
Abstract
Mathematical analysis of blast pressures has typically involved the empirical fitting of parametric models, which assumes a specific function shape. In reality, the true shape of the blast pressure is unknown and may lack a parametric form, particularly in the negative phase following arrival of the secondary shock. In this work, we develop a non-parametric (NP) representation that makes few assumptions and relies on the observed experimental data to fit a unique and previously unknown model. This differs from traditional approaches by not arbitrarily selecting a single, restrictive class of functions and estimating a minimal set of parameters, but rather estimating the underlying function class for which the blast pressure is generated; learning the model directly from the observed data. The method was applied to experimental blast measurements and the NP estimates matched the experimental data with a high degree of accuracy, both qualitatively and quantitatively. The NP approach was shown to significantly outperform other commonly used approaches, near-perfectly track the entire pressure and specific impulse history and predicting experimental peak specific impulse to within ±0.5% in all cases (compared to ±5.0% for a trained artificial neural network (ANN) and ±7.5% for the UFC semi-empirical approach). The NP approach predicts experimental net specific impulses (positive and negative phases combined) with a maximum variation of 2.7%, compared to maximum variations of −116% and 55% for the UFC and ANN approaches, respectively. Since the framework is probabilistic in nature, it can naturally account for random noise in sensor measurements, which are typically more pronounced in blast experiments than many other machine learning applications.
Introduction
Detonation of a high explosive material will result in a substantial release of energy as the explosive undergoes an exothermic chemical reaction and rapidly converts into a high pressure, high energy gas (Dewey, 2016). These gaseous detonation products violently expand outwards into the surrounding air, causing a shock wave to form which travels at velocities several times greater than the ambient sound speed as it propagates away from the source of the explosion. In the early stages of an explosion, the expanding fireball remains in contact with the shock wave and complex turbulent structures emerge at the contact surface between the detonation products and the air (Brouillette, 2002). The region where the shock front is still being driven by the detonation products is known as the near-field, and the emerging blast pressure waveforms have been shown to be highly complex (Rigby et al., 2015a; Tyas et al., 2016).
After some time, however, the shock wave detaches from the detonation product fireball and expands outwards in a regular, spherical manner. This detachment marks the beginning of what is known as the far-field region. Here, the blast pressure profile takes the form of an almost instantaneous rise to peak pressure, followed by an exponential decay back to ambient conditions. Following the period of positive overpressure (where overpressure is the term given to the increase in pressure above atmospheric conditions (Kinney and Graham, 1985) comes a period of below atmospheric pressure, termed the negative phase (Rigby et al., 2014a). At a point near the minimum of the negative phase comes a smaller “secondary shock,” caused by internal reflection of a backwards-moving rarefaction wave formed by outward movement of the detonation product/air interface (Brode, 1955). The magnitude and arrival time of the secondary shock is dependent on the pressure/volume/energy state of the detonation products shortly after detonation and hence varies by explosive type (Rigby and Gitterman, 2016). Thereafter, the pressure returns back to ambient conditions.
A freely expanding blast wave is known as an incident wave. When a blast wave reflects off a rigid surface, the fluid is momentarily brought to rest non-isentropically so that the translational kinetic energy contributes toward the total reflected pressure on the surface (Dewey, 2016). Experimental measurement of incident and reflected blast pressure parameters has been a topic of interest since the mid-1940s (see (Esparza, 1986) for a detailed review), and gained particular prominence with the now well-established compilation of Kingery (1966), and later Kingery and Bulmash (Kingery and Bulmash, 1984). These compiled blast parameters form the basis of design guidance such as the UFC 3-340-02 manual Structures to Resist the Effects of Accidental Explosions (US DoD, 2008), and the computer code ConWep (Hyde, 1991).
While these semi-empirical methods exist in the literature for determining blast pressure from an idealized situation, it remains vitally important for the civil and military engineering communities to be able to experimentally measure blast pressure parameters for situations not covered in the above, for example, different explosive shapes or types (Rigby et al., 2021; Langran-Wheeler et al., 2021), complex internal or confined environments (Larcher and Casadeia, 2010; Alterman et al., 2019; Dennis et al., 2021; Gan et al., 2022), and cityscapes (Rigby et al., 2020). The accurate and robust treatment of recorded signals from commercial pressure gauges is not trivial, with typical experimental traces demonstrating features such as ringing, sensor drift, and noise (Kucera et al., 2016).
Accordingly, it is common to fit a least-squares exponential curve to a later portion of the pressure-time curve, which can be extrapolated back to the arrival time to yield peak pressure and integrated to yield specific impulse. These fitted values are typically considered better representations of the true blast parameters compared to those determined from the raw data (Farrimond et al., 2022). While this may be an acceptable approach for simple free-field loading cases, it generally requires the analyst to define a function (or family of functions) to fit the raw data to. One such parametric form is the “modified Friedlander” equation, described in detail in “Empirical Parametric Fits.” The accuracy with which this equation can model a number of blast wave properties over a range of shock strengths has led to suggestions of a fundamental relationship between the Friedlander exponential and the explosive process (Dewey, 2010). However, it is known that this relationship cannot accurately describe the negative phase (Rigby et al., 2014a; Hatfield et al., 2022) or secondary shock (Rigby and Gitterman, 2016), even for idealized free-field blasts. Clearly, the quality of fit is dependent on the availability of a suitable parametric function, and as the complexity of the problem increases the likelihood of there being a satisfactory function decreases.
Furthermore, regarding parameter curves for the negative phase, Bogosian et al. (Bogosian et al., 2002) noted that, “The precise provenance of these curves is unknown at the present time.” The authors suggest that the reason why negative phase predictions are less trustworthy is in part to the fact that “Not all (experimental recordings) were of sufficient duration and/or quality as to be able to extract negative as well as positive values, and…others became suspect at later time and therefore could not produce reliable impulses.”
An alternative is to use a non-parametric approach, that is, a Gaussian process (GP) formulation. GPs form a non-parametric model, and are particularly useful when little is known about a specific parametric model that could give accurate predictive performance. While most commonly utilized in machine learning problems (Rasmussen and Williams, 2006), GPs have been used in a diverse field of additional applications including mining (Coburn, 2000), model identification of dynamic systems (Nguyen-Tuong et al., 2009), and modeling channel-to-noise ratios of wireless transmitters (Kirchner, 2019), to name a few. In a blast-specific setting, they have recently been used to estimate degradation and life-span of explosive materials from blast experiments (Kirchner and Kirchner, 2015), to predict blast-induced ground vibrations (Arthur et al., 2020), and to model the structural response of reinforced concrete beams retrofitted with fiber-reinforced polymer (Almustafa and Nehdi, 2021), although as noted in Bortolan Neto et al. (2020), there still appears to be a general lack of studies verifying the applicability of GPs to blast and impact events. GPs have several advantages over traditional parametric approaches in that they provide a natural representation of blast pressures by incorporating qualitative prior knowledge of blast pressure profiles that regularize the problem. Aside from this, GPs make few other assumptions and instead rely on the observed experimental data to shape the model, making them particularly suited for complex/non-ideal blast settings as discussed previously.
This article presents the formulation of a non-parametric Gaussian process for probabilistically estimating the underlying latent shape of a blast curve, for the entire pressure history. This is significant in two regards: first, the method is robust to the noise incurred during experimental collection of blast wave data, and second; the method does not just infer a single, most-likely blast wave, but rather a probabilistic estimate of the blast wave itself. This provides a quantitative measure of how trustworthy the estimate is.
Results from the GP model are compared against raw experimental data from a series of simple blast settings, each with a unique combination of explosive mass and distance to the measurement location (6 unique combinations and 14 total test samples). Performance of the GP is assessed against other common approaches including an empirical parametric model and an artificial neural network. Additional unique features of the GP model are explored in further detail, including its ability to problematically estimate the blast pressure history from multiple trials concurrently, and its ability to model complex near-field blast pressure histories.
Gaussian process framework
Overview
In this section, we outline the development of a non-parametric Gaussian process for probabilistically estimating the underlying latent shape of a blast pressure history. First, it is essential to identify certain broad necessary conditions of a blast wave, that is Axioms 1–5. Subsequently, we generalize the GP method to incorporate these Axioms. These generalizations, while developed to apply to blast waves in this paper, are more general and can be applied to other problems. Specifically, the developments in Sections “Gaussian Process Model with a Difference Operator” to “Simultaneous Analysis of Multiple Trials” (inclusive) are novel in the field of GP regression, regardless of application.
Blast characteristics
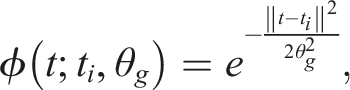
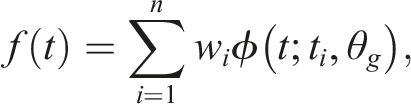
We assume there is an underlying latent function, denoted by Idealized pressure-time profile for a reflected blast wave. The variable f denotes the underlying pressure wave as described by the model given in (1), and i denotes the impulse of the pressure wave.

The initial pressure is at atmospheric pressure, p0. Without loss of generality, we will consider this to be zero for the remainder of this article.
At some time t
a
, the blast wave front is observed as a jump-discontinuity
The intensity of the blast decreases with time, decaying monotonically from time t
a
until it reaches the minimum pressure, pr, min, which occurs at time denoted by t
neg
. The blast wave increases monotonically after time t
neg
. The blast pressure function is piecewise smooth.
Gaussian process regression
Since we have little prior knowledge of the parametric form of f, we model this non-parametrically as a Gaussian Process (GP), previously developed in Rasmussen and Williams (2006). The GP model allows for immense generality of function classes while still having the potential to adhere to the constraints listed in Axioms 1–5. However, the method is currently not robust to real data, so we first need to generalize the GP method to incorporate these Axioms.
Formally we state the GP as:
A Gaussian Process is a collection of random variables, any finite number of which has a joint Gaussian distribution (Rasmussen and Williams, 2006). A GP is effectively providing a distribution over the space of functions for which f lies. A GP is completely described by a mean function The covariance function is a kernel operator, and is an expression of how correlated the output of two points are, based on input proximity. For example, if two pressures were sampled 0.01 ms apart, they would likely exhibit similar magnitude, but if 2 s were to have elapsed between samples we would expect them deviate greatly. The covariance function describes this relation. In order to comply with Axiom 1, we have a kernel of For notational simplicity, we follow Rasmussen and Williams (2006) and define Estimating for


Hyperparameter optimization
It is clear that solving for the posterior distribution in (8) and (9) is dependent on hyperparameters,


We then select the model by finding the hyperparameters with

This gives us the most likely model that generated the observed data.
Gaussian process model with a difference operator
From Axioms 3 and 4, we must impose a constraint that the function is monotonic. Riihimäki and Vehtari (Riihimäki and Vehtari, 2010) suggested that we can impose a monotonicity constraint by adding an additional observation that derivatives are decreasing. We propose to use a difference operator as opposed to a derivative observation, due to ease of implementation with a wide variety of covariance functions, since no complicated analytical derivatives of covariance functions are required (only the squared exponential function is used in Riihimäki and Vehtari (2010). Non-Gaussian likelihoods result with monotonicity observations, and the approximate inference technique of Expectation Propagation (EP) (Minka, 2001) was proposed. EP uses a Gaussian approximation to the likelihood function, and for this particular application, can bias the slope of the posterior curve. This is critical for blast wave analysis, since estimation of the decay rate of the blast pressure is of primary interest. We present an alternative method, that does not bias the slope estimate.
Define the matrix
2
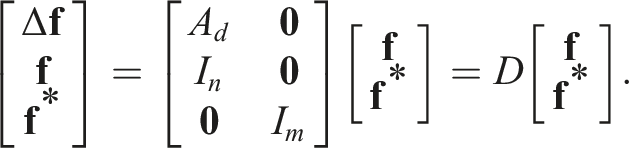
This implies that
This shows that the vector
Marginal likelihood with monotonicity constraints
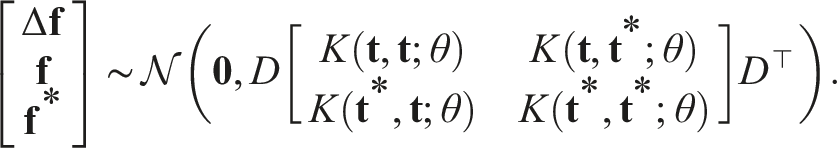
We add an observation that

The joint likelihood of observations is modeled conditionally independent with


The term

For numerical stability, we optimized the log marginal likelihood as

The second term represents the sum of the log of Gaussian cumulative distribution functions, for which fast and stable methods exist for computing this quantity. Solving for hyperparameter θ by optimizing (12) using the new log marginal likelihood in (16) finds the most likely model that generated the data and is monotonic.
Generalization for additional waves
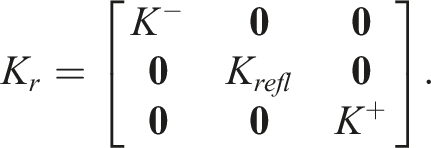
If the presence of an additional wave is known to exist in the raw blast data 3 , then the estimates can be generalized to account for this phenomenon. This is achieved by decorrelating all measurements from before the reflected wave with the measurements that occur after, effectively introducing a discontinuity.
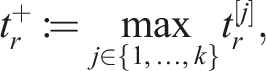
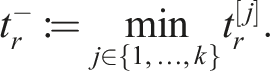
Let t
r
> t
a
denote the arrival time of the reflected wave, and we denote by
We note here that t r is know in advance and used to construct the matrix K r . This can be seen by observing the raw experimental data, and we assume this is the case in all results that follow. In general, however, we don’t need to know t r in advance. It can be added as an additional parameter that can be found during the hyperparameter optimization. If optimizing for t r as an extra parameter, care must be taken as it may introduce discontinuities in the optimization.
Simultaneous analysis of multiple trials
The presented GP method can support joint analysis of several independent trials from the same blast experiment, that is, the same charge weight, measurement distance, etc. This has the advantage of incorporating multiple observations to improve estimation of the underlying blast phenomena. We consider k independent trials, and denote by
We assume that all trials are aligned such that
We consider a range of times,
Computational efficiency
Low rank approximation
Computing the posterior function estimate in (8) and (9), as well as the log marginal likelihood in (11) and (16), require the inversion of an n × n matrix. This can be inefficient when n is large since computing a matrix inversion
4
is
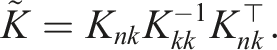
K
kk
is k × k covariance matrix constructed by using only k data points selected uniformly at random, without replacement, from the original set of n data points. K
nk
is a n × k covariance matrix of the selected k points with all points in the dataset. We can write this equivalently as

This is now a diagonal plus low rank system and we can exploit this structure to create an efficient solution using the matrix inversion lemma (Higham, 2002)

We now only require the inversion of a k × k matrix in (18), as opposed to the inversion of n × n matrix in (17). The mean estimate from (8) is now computed with low rank approximation as


The low rank approximation can also be applied for efficient computation of the determinant

We can take the Cholesky factor such that
Matrix order of operations
Another consideration is the order of operation of matrix multiplication that is introduced with the low rank approximation in “Low Rank Approximation.” Multiplying a n × k matrix with a k × m matrix is

This reduces an

This replaces a product of


Performance analysis
Overview
In this section, the non-parametric (Gaussian process) model described above is compared against select experimental data, and several performance metrics are compared against those from two other common approaches. These are detailed in full in the following sections, with a brief overview of the four data types as well as the naming conventions used in this article below: 1. 2. 3. 4.
Experimental data
In this article, we make use of the results from a number of small-scale arena blast experiments conducted at the University of Sheffield Blast and Impact Laboratory in Buxton, UK (Rigby et al., 2015b). Here, 180–350 g hemispherical PE4 charges were situated either 4 or 6 m from a blockwork-covered reinforced concrete bunker wall, which acted as a nominally rigid, semi-infinite reflecting surface. Pressure was measured using flush-mounted, ground-level commercial pressure gauges (Kulie HKM 7 bar) embedded within the reflecting surface, perfectly normal to the charge. Data were recorded using a 16-Bit Digital Oscilloscope at a sample rate of 100 kHz, and recordings were synchronized with the detonation via a breakwire embedded in the charge periphery. The charges were shaped using 3D printed hemispherical molds to ensure consistency, and then placed uncased on small (50 mm thick) steel plates to limit repeated damage to the concrete ground slab at the required stand-off distance for each test. The charges were base-detonated using an L2A2 electrical detonator pushed through from the top-center of the explosive. The test arrangement is shown in Figure 2 and further details are provided in Table 1. Set-up for small-scale tests at the University of Sheffield. Figure adapted from (Rigby and Sielicki, 2014). Summary of experimental tests. TNT equivalent scaled distance values calculated using an equivalence of 1.20 for PE4 (Rigby and Sielicki, 2014).
In all cases, time is expressed as “relative time,” t* = t − t a , where t a is determined separately for each test from visual inspection of the raw data. This is to ensure that all subsequent models share the same time-base, allowing for direct comparisons. Time data were truncated once the recorded signals were judged to have returned to ambient conditions following the negative phase.
Empirical parametric fits
The parametric blast pressure history is defined as the piecewise expression below


Finally, we define net specific impulse, i = i+ + i−, as indicated in Figure 1. Values for positive and negative phase peak pressure/specific impulse/duration, and decay coefficient 7 are taken directly from the polylogarithmic relations presented in UFC 3-340-02 (US DoD, 2008); the positive phase values of which are taken from the original Kingery and Bulmash report (Kingery and Bulmash, 1984). A TNT equivalence of 1.20 was taken for PE4 (Rigby and Sielicki, 2014) since the UFC predictions require the charge mass (and scaled distance) to be expressed in terms of an equivalent mass of TNT.
Previous work has shown the UFC method to be a highly accurate first-order method for modelling the positive phase of the blast (Rigby et al., 2014c; Farrimond et al., 2023). Note that while these parameters may be further calibrated using curve-fitting techniques, this will neither change the underlying fitting function nor the peak and net impulse. Since this article is focused on assessing the quality of the form of the pressure history, and these two impulse values, then no further calibration of the values determined from the UFC relations has been performed.
Artificial neural network
Network parameters, based on those used in (Dennis et al., 2021).
The network is trained using 33,210 input combinations, from all 14 experiments described in “Experimental Data” and Table 1. Unlike many typical ANN applications, here we are not aiming to develop a tool to solve unseen problems, rather we are concerned with assessing the ability of the ANN to generate complete pressure-time histories after the training process (similar in concept to the work of Bortolan Neto et al. (2020). Hence the decision to train the network on 100% of the available data. The trained network will subsequently be used to output complete sets of pressure-time pairs for each combination of charge mass and stand-off.
Overview of non-parametric approach
Before proceeding, we assume that the user pre-processes the data. While not always required, it can simplify the procedure. This includes locating the initial and secondary shock times and trimming excess data, for example, any data recorded well after returning to atmospheric pressure. First, find the hyperparameters by optimizing (16) for θ. Then use θ and
The low rank approximation derived in “Computational Efficiency” was used with k = 100. Since nearly 20,000 pressure measurements were collected for each mass–distance pair, the reduction of rank to 100 results in orders of magnitude of improvement in computation complexity over a naive computation, and with little degradation in the quality of the estimate. The optimization of the log marginal likelihood in (16) used the Nelder–Mead simplex approach (Lagarias et al., 1998) for unconstrained optimization. All data before the initial shock were trimmed and hence partitioning the covariance matrix so (3) is satisfied is no longer necessary.
Results and discussion
Qualitative appraisal
Figures 3 and 4 show example experimental and fitted
9
results from 250 g PE4 at 4 m and 6 m stand-off distance, respectively, where specific impulse histories are determined from cumulative trapezoidal integration of the pressure histories. Note that in each figure the middle row is a re-scaled version of the top row to allow for clearer qualitative appraisal of the quality of each fit with regards to the negative phase. While the ANN was trained on all 14 experimental tests, here we only present results from the first test of each mass–distance pair and the corresponding fits. Comparison of non-parametric (NP), empirical (UFC), and artificial neural network (ANN) pressure and specific impulse histories against raw experimental data (Exp.): 250 g PE4 hemisphere at 4 m stand-off. Comparison of non-parametric (NP), empirical (UFC), and artificial neural network (ANN) pressure and specific impulse histories against raw experimental data (Exp.): 250 g PE4 hemisphere at 6 m stand-off.
It appears as though the NP and ANN approaches represent the positive phase pressure history remarkably well, albeit with some initial rounding of the shock front in both cases. 10 Conversely, the UFC approach appears to overpredict the pressure history in both the early and late stages of the pressure history, resulting in an overprediction of specific impulse.
The NP approach exhibits near-perfect tracking of the impulse history. The ANN approach appears to be slightly corrupted by the arrival of the secondary shock shortly after the end of the positive phase, and therefore the ANN predictions begin to lose accuracy at this time. Furthermore, ANNs are prone to learning non-physical behavior (Pannell et al., 2022), which is observed here as sporadic changes in gradient during the positive phase as a result of fitting to noisy data. Since the NP approach probabilistically estimates the underlying latent shape of a blast curve, its behavior is generally physically consistent.
Both the ANN and UFC approach are unable to model the secondary shock (the ANN approach is unable to generalize this effectively discontinuous behavior, and the UFC simply neglects it), resulting in poorer quality fits in the negative phase, and a general drift in terms of negative phase specific impulse values. The NP approach is able to accommodate the secondary shock and the near-perfect tracking of the impulse history persists for the entire loading duration.
It should be noted that an advantage of the UFC method is that it does not require any additional experimental data in order to generate its predictions. As discussed previously, the trained ANN could subsequently be used to generate predictions for intermediate values of charge mass and stand-off, which the NP approach is unable to do in its current form. Since the NP approach forms an equation with differentiable functions, it can easily interface with other forms of linear differential equations, that is, equations of motion for structural response, although the equations posses no intrinsic link to the physical properties of a blast wave.
Results of performance assessment
Comparison of performance metrics: pressure and impulse histories. Best performing model for each metric is highlighted in bold.
Comparison of performance metrics: peak and net impulse and % difference from experiments.
Finally, peak positive phase specific impulse, i+, and net impulse, i, are directly compared against the raw data in Table 4, with percentage difference between experiment and fit also shown. Note that while peak pressure is a common metric, it is not reported in detail here since the focus is the quality of fit for the entire loading duration. In all cases, reported values of peak pressure were similar, with the UFC fits generally over-predicting slightly.
Discussion of performance assessment
Of the performance metrics in Table 3, the NP approach outperforms both ANN and UFC approaches in all but a small number of cases, and of the cases where the NP approach is outperformed, the difference is marginal. The NP approach exhibits R2 values of no less than 0.976 when considering positive phase pressure histories only, p+(t*), and scored the highest R2 and lowest MAE for four out of the six mass–distance pairs. When considering negative phase and full specific impulse histories, p−(t*) and i(t*), respectively, the NP approach is the top-performing model in all cases considered, with R2 values of no less than 0.937 and 1.000 for the negative phase and entire impulse histories, respectively. Due to the presence of the secondary shock and the inability of the ANN and UFC models to account for this, R2 values for these two methods are generally lowest when considering negative phase histories (minimum values of 0.823 and 0.733 for ANN and UFC, respectively).
With reference to Table 4, it can be seen that the NP approach is able to predict peak specific impulse, i+, to within ±0.5% in all cases, compared to ±5.0% for ANN and ±7.5% for UFC. While relative comparisons of net impulse, i, are less meaningful due to experimental and/or predictive values being close to zero in some cases, it is clear that the NP approach outperforms the others by a significant margin: only the 6 m, 350 g net impulse predictions are greater than 1.1% from the experimental value, with a maximum variation of 2.7%. The UFC and ANN approaches perform considerably less well when predicting net impulse (i.e., the total combined impulse delivered over the positive and negative phase), with maximum variations of −116% and 55%, respectively.
It is worth highlighting that the UFC method consistently and substantially over-predicts the magnitude of negative phase impulse and therefore under-predicts net impulse. Take, as an example, the 6 m, 250 g test. Here, the experimental and NP net impulses are positive; if applied as a purely impulsive load this would result in displacements in the direction of travel of the blast wave. Conversely, the UFC approach predicts a net negative impulse; applied impulsively this would result in smaller displacements towards the source of the explosion. In all cases the UFC net impulse is non-conservative, and in half the cases the sign is incorrect. This has potentially significant implications for lightweight, flexible structures, which are particularly sensitive to these effects on account of their relatively large natural periods (Teich and Gebbeken, 2012; Yang and Ahmari, 2013). Additionally, the full form of the loading history, including the negative phase and therefore net impulse, is an important consideration for the blast response of glazing (Krauthammer and Altenberg, 2000; Wei and Dharani, 2006; Teich and Gebbeken, 2010); the majority of non-fatal injuries from terrorist attacks are caused by either airborne glass fragments or damage to hearing from failed glass panels (Norville et al., 1999).
Evaluation of each method’s advantages and disadvantages considering their use for blast predictions and with subsequent analyses.
Example results from simultaneous analysis
As an illustration of the NP method’s ability to jointly analyze pressure signals from a number of independent trials, a new non-parametric fit was evaluated for all four experimental results from the 250 g PE4, 4 m stand-off distance tests, according to the process outlined in “Simultaneous Analysis of Multiple Trials.” The results of this simultaneous analysis are shown in Figure 5, alongside upper and lower 90% confidence intervals derived from the analysis. Experimental and simultaneous non-parametric pressure histories for 250 g PE4 hemisphere at 4 m stand off.
Generally, the positive and negative phase histories are well represented by the NP fit, with the 90% confidence intervals typically forming a ±5 kPa band about the NP fit. There is a region of increased uncertainty around t* = 2.9–3.3 ms corresponding to the arrival of the secondary shocks, which suggests that the formation and expansion of these secondary waves is highly sensitive to the early pressure–volume–energy state of the detonation products. Clearly, simultaneous NP fits to data from nominally identical blast trials used in this manner can provide further information on the magnitude and sources of variability in blast experimental data.
Example results from near-field analysis
In order to illustrate the versatility of the NP approach, in particular for modelling blast pressure histories for non-simple cases, NP fits were generated for the experimental data from Barr et al. (Barr et al., 2023). Here, a 113 g sphere of PE10 (86% PETN, 14% plasticizer) was detonated at 70 mm clear from a rigid reflecting surface, embedded in which was a single Hopkinson pressure bar (4 mm diameter) measuring normally reflected pressure. Data were recorded at a sampling rate of 5 MHz and 14-bit resolution, and have been corrected for dispersion (Barr et al., 2020).
Figure 6 shows pressure and specific impulse histories for the experimental data, NP fit, and UFC predictions assuming a TNT equivalence of 1.22 for PE10 (Farrimond et al., 2023). The NP fit is less satisfactory during the first 10 μs due to the highly transient nature of the experimental history. As a consequence, the initial peak pressure is under-predicted by around 100 MPa. However, the complex blast pressure history is faithfully replicated by the NP fit beyond this brief initial period, and the specific impulse is near-perfectly tracked thereafter, as was the case with the far-field test data previously. The UFC predictions are considerably less accurate, which is unsurprising given that semi-empirical predictions in the extreme near-field are not based on direct measurements and instead are inferred from indirect measurements and rudimentary numerical analyses (Rigby et al., 2015a; Esparza, 1986). Of particular note is that at 20 μs, both NP and experimental specific impulses are 2940 MPa.μs, which is 91% of the peak value (3240 MPa.μs). Conversely, at the same point the UFC specific impulse is 2330 MPa.μs, which is 63% of the peak value (3670 MPa.μs). That the accumulation of specific impulse in the UFC loading is much more gradual than experimental data suggests that the true loading function is considerably different than the assumed modified Friedlander. The incorrect evolution of specific impulse, and the considerably higher peak value of the UFC approach is likely to have significant implications for modelling of structures with short natural period (i.e., stiff systems with relatively short span). This is considered to be a major limitation of the semi-empirical predictive approach in its current form. Comparison of non-parametric (NP) and empirical (UFC) pressure and specific impulse histories against raw experimental data (Exp.): 113 g PE10 sphere at 70 mm clear stand-off.
Summary and conclusions
We presented a non-parametric methodology to analyze blast pressure histories based on Gaussian process regression; learning the model directly from the observed data. The method was applied to experimental blast data and the estimates match experimental blast pressures with a high degree of accuracy, both qualitatively and quantitatively. The NP approach was shown to significantly outperform other commonly used approaches, namely the UFC empirical approach and a trained artificial neural network, particularly when considering net specific impulse. The NP approach was able to near-perfectly track the entire pressure and specific impulse history, where the two other methods were unable to accommodate the arrival of the secondary shock and generally exhibited poorer performance.
Specifically, the NP approach achieved the highest Young’s correlation coefficient for 4/6 of the positive phase pressure histories, 6/6 of the negative phase pressure histories, and 6/6 of the full-duration specific impulse histories. The NP’s ability to replicate the experimental specific impulse history was particularly noteworthy, with R2 values of 1.000 for all 6 of the examples tested. The NP approach achieved the lowest mean absolute error for 4/6 of the positive phase pressure histories, and again for all of the negative phase pressure and full-duration specific impulse histories. In terms of peak specific impulse, all NP predictions were within ±0.5% of the experiments, compared to ±5.0% for outputs from the trained artificial neural network and ±7.5% for the UFC semi-empirical predictions. In terms of net specific impulse (i.e., the specific impulse of the entire loading duration), the NP approach predicted all but one of these values to within 1.1% of the experimental values, with a maximum variation of 2.7%. This is compared to maximum variations of −116% and 55% for the UFC predictions and trained neural network, respectively.
In addition to its enhanced accuracy and ability to better generalize blast pressure histories, the NP approach offers two further benefits and applications for blast load modelling. First, we are now able to simultaneously analyze multiple independent trials and derive a single fit. A simultaneous analysis was performed herein on the data from all four tests using 250 g PE4 at 4 m, with the resulting confidence intervals forming a band of approximately 5 kPa either side of the NP fit. Regions of increased confidence intervals allow for clear qualitative discussion on the nature of variability in blast load measurements (i.e., secondary shock arrival time).
Second, the ability of the NP approach to accommodate more complex waveforms can be especially advantageous for analyzing blast events in non-simple settings, for example, crowded building interiors (Larcher and Casadeia, 2010; Alterman et al., 2019; Dennis et al., 2021; Gan et al., 2022), cityscapes (Rigby et al., 2020), and in the near-field (Rigby et al., 2015a; Tyas et al., 2016). This has been demonstrated with a final example where a non-parametric fit was evaluated for the pressure signal measured from a 113 g PE10 sphere detonated at 70 mm clear distance from a rigid measurement plane. Again, the NP fit was shown to clearly outperform the UFC predictions, and aside from a brief period at the beginning of the signal characterized by high pressure, extremely short duration transients, near-perfectly matched the experimental pressure and specific impulse histories. The UFC predictions were shown to much more gradually accumulate specific impulse, suggesting a fundamentally different loading mechanism to the standard modified Friedlander waveform currently adopted in the UFC near-field predictions.
The NP method presented herein has conceptual similarities to regression problems that have become popular in machine learning applications, such as those that utilize convolutional neural networks as a universal function approximator and then perform regression to determine the coefficients of a very high-dimensional parameter space. Those methods, however, require large amounts of labeled data to help avoid “over-fitting” since the problem is close to being ill-posed. We avoid such problems using a GP and only need to solve for a small number of hyperparameters. We can utilize, unlike general machine learning classification problems, a set of axioms (see “Gaussian Process Framework”) to guide the class of functions that can realistically represent blast pressure data. This regularizes the problem and can lead to effective blast pressure estimates with a reasonable amount of data collected. Since the GP framework is probabilistic in nature, we naturally account for random noise in sensor measurements, which can be more pronounced in blast experiments than many other machine learning applications.
Since the model can be generalized to include any linear operator, this enables a simple future expansion by any (dynamic) process that can be described by linear operators. For example, correction and removal of smoothing artifacts due to anti-aliasing filters which are typically applied prior to digital sampling in data collection. This would essentially create a regularized deconvolution process jointly at the time of blast wave estimation. Additionally, future work can aim to reconstruct the blast pressures from acceleration measurements taken on elastic structures for which the motion can be described by a linear ordinary differential equation. This offers the potential for more sophisticated use of inverse modelling in blast engineering (Gallet et al., 2022).
Footnotes
Acknowledgements
The authors would like to thank Brown University Professor of Applied Mathematics Jèrôme Darbon for advice on the computational impact of order of operations of non-square matrices.
Declaration of conflicting interests
The author(s) declared no potential conflicts of interest with respect to the research, authorship, and/or publication of this article.
Funding
The author(s) disclosed receipt of the following financial support for the research, authorship, and/or publication of this article: This research was supported in part by the Office of Naval Research under ILIR 4764.