
Abstract
Nowadays, the safety of infrastructure and people is a primary concern. To ensure safety in public, industrial, or military facilities, it is necessary to be able to predict the behavior of shock waves in any environment. However, while the physical phenomena that occur in free field are well known, they cannot be applied to follow the path of a shock wave in a closed medium, where the phenomena are more complex. The aim of the present study was to define the origins of the different reflections and the path followed by the shock waves after the first reflection in a closed environment composed of two chambers separated by a wall with a variable opening. To achieve this, a fast code was developed based on the shortest path algorithm to determine the parameters of the shock wave at any point of a simple geometry. The code was designed from small-scale experiments that enabled the predictive laws of the distribution of maximum overpressure, total impulse, and the arrival times of the first four peaks to be established. An application of the code is presented in the last part of the paper.
Keywords
Introduction
Accidental or intentional explosions inside public, industrial, or military infrastructures have become a vital safety issue. Although many studies on the free field evolution of shock waves have been conducted since the sixties, they cannot be applied to confined environments, where interactions between the blast and the geometry, such as reflection, diffraction, and recombination, complicate the interpretation of blast wave phenomena and blast wave parameters.
To investigate these phenomena, experimental campaigns can be either small-scale or large-scale. Large-scale experiments were conducted by Edri et al. (2011) in a single room sized space specially constructed for the experiments with inner dimensions of 2.9 m length× 2.9 m width × 2.7 m height. The authors studied the influence of the size of the load ranging from 0.5 to 4 kg of TNT and placed in the center of the structure on the characteristics of the shock waves. They did not consider, however, the origin of the different reflected peaks detected by the sensors. Among the small-scale studies, Rigby et al. (2014) compared the reflected pressure and impulse of a blast generated by the detonation of PE4 hemispherical charges (180-35 g) located on the ground 2–6 m from the target (rigid wall). The experiments showed that empirical blast predictions such as the Conwep code can be used with confidence as a first-order approach and that well-controlled tests can be conducted at small scale. Gault et al. (2020) focused on the effect of the position and the weight of the charge in a cubic room measuring 0.5 m per side. These small-scale results were compared to the experiments by Edri et al. (2011). It was found that the laws of reflected overpressure and arrival time obtained by the two studies agreed, showing that small-scale experiments can represent what occurs in large-scale experiments with a TNT charge on the considered scale distance range.
Numerous studies have been performed for a simple confined model or for semi-confined environments. Murray et al. (2006) carried out large-scale experiments on the detonation of a thermobaric charge on bunker models representing an urban environment. A calculation code was developed to define the protective structures that military forces must deploy during the occupation of a building or the installation of a temporary camp. The conclusions were based on the burned gases. The confinement produced by the walls allowed the shock waves generated by the initial detonation to reflect into the confined space, mixing the remaining fuel with the available air. The efficiency of the mixing process thus depends on the degree of confinement. The higher the confinement, the greater the post-combustion energy and therefore, the greater the overpressure will be in the chamber. Ripley et al. (2012) also looked at street patterns for urban environments, this time focusing on reflection by comparing incident pressure (Free Field), single wall reflection (True Reflection), and two-wall reflection (Street Reflection). The results showed that single-wall reflection and two-wall reflection are identical up to the point where the shock reflected from the other side of the street intersects and merges with the incident shock. If the length of the street is greater than this distance, the urban geometry causes the resulting pressure to be significantly higher than the single wall reflection. The recombination of reflected shock waves on the walls is called “channeling,” increasing their intensity.
Experiments performed in tunnels (Smith et al., 1998), subway stations (Ma et al., 2017), and single rooms (Hu et al., 2011; Togashi et al., 2010) demonstrate the importance of the analysis of containment effects. Experiments in more complex environments composed of several chambers or even corridors are feasible at a lower cost for small-scale campaigns. For instance, Julien (2013) investigated a pyrotechnic warehouse in which the building was split into two parts by a movable wall. Many studies focus on the effect of the confinement, but without predicting reflection. Reflections can be predicted using various methods. The first one, used by Sauvan et al. (2012), consists in progressively building the model (a cubic box without a ceiling) wall by wall around the charge. Hence, the model is constructed first with only one wall for each position, second with the combination of two walls, third with the combination of three walls and finally with all four walls, making it possible to understand and identify on which wall reflections occur. The second one is the method of images used by Needham (2018). This method assumes that the blast waves are produced by the explosive source and the images reflected from the enclosure wall. As this method cannot be used in a multi-room model, a different version of the method of images was created by Wu et al. (2017) to analyse reflections in an enclosure with an opening. Another method to predict reflection is based on the shortest path algorithm from Dijkstra (1959). It was used in a fast-running predictive tool by Lapebie et al. (2016) to predict reflection in an urban environment.
For numerical simulation codes, such as Autodyn, a code based on the finite difference method, finite volumes, and finite elements, and used by Zyskowski et al. (2004) and Sauvan et al. (2012), the accuracy depends essentially on the mesh size, as does the computation time.
In the present study, since the overriding criterion for our industrial partner was to have an execution time below one second, the calculation code had to be based on simplified models. The time criterion was fixed in order to have a fast tool which could be used to facilitate the emergency response in the case of accident or training for rescue teams and to protect the environment (people and property). Simplified calculation codes allowing the prediction of the effects of the shock wave in a few seconds have already been published. The main inspiration for the calculation code presented in this paper comes from the FLASH (Fast Lethality Assessment for Structures and Humans) code developed by Lapebie et al. (2016). The FLASH code is based on simplified models to predict the consequences of an explosion in an urban environment and uses the shortest path algorithm as well as ray tracing methods. Additional sub-models are used for various phenomena such as reflections, channelling, and diffraction. It relies on already established predictive laws (e.g., Kinney and Graham, 1985; U.S. Department of the Army, Unified Facilities Criteria (UFC), 2008) to reconstruct the signal at any point of the mesh. Other codes have also been developed for confined environments, e.g., by Frank and Hurley (2005). The principle of their code is identical to FLASH but it focuses on the phenomena present inside buildings of different shapes. Simplified calculation codes are generally based on the shortest path algorithm to determine the distance between a point and the load.
In the present study, experiments were performed in a small-scale model, and several behavior laws for the data obtained were established. A simple and fast-running predictive tool was developed to compute the path and the main characteristics of shock waves inside the double-room model.
Experimental setup
This study aimed to compute general laws about the main characteristics of shock waves in the case of a confined explosion in two rooms. The laws focus on maximum overpressure, total impulse, and arrival time of the reflected peaks. A small-scale model composed of two polycarbonate boxes separated by a plate with an opening (Figure 1) was built to achieve this. The opening does not touch the ground, but is raised above it by a step, 0.03 m in height, called a coaming which represents a surrounding frame. This experimental device is an adaptation of the one used by Gault et al. (2020) which consisted of a single fully closed chamber. In the present study, the dimensions of the “emitting chamber,” where the charge is detonated, are 0.53 m × 0.50 m × 0.50 m, and those of the second chamber, called “receiver chamber” are 0.50 m × 0.50 m × 0.50 m. Both chambers are bolted on an aluminum bench (1.30 m × 0.76 m × 0.05 m). Representation of the small-scale model with sensors (units: meters) Color is needed.
A hemispherical soap bubble with a radius of 0.05 m contained the gaseous charge used. The charge is a stoichiometric mixture of propane–oxygen, with a total gas mass of 0.369 × 10⁻³ kg. Four positions for the gaseous charge were used, as shown in Figure 2. An exploding wire fixed between two electrodes linked to a high-voltage supply generated the detonation of the gaseous mixture. (Details can be found in Sochet, 2018.) Positions of the charge in the emitting chamber (units: meters).
Two types of sensors were used in this study. Thirty Kistler sensors were installed on the model, twenty-one of type 603C and nine of type 603B (from RG1 to RG9), represented in Figure 1 by solid circles for the sensors that are visible with perspective and by hatching for the others. Type 603B sensors were used for the receiving chamber floor because they have a better vibration resistance than 603C sensors in our experimental setup. The sensors were separated into five planes. The first one, which includes sensors RW2, RW3, RW7, RW8, RW12, and RW13, was located at a height of 0.07 m, shown in orange on Figure 1; the second one includes sensors RW1, RW6, and RW11, placed at a height of 0.25 m from the ground, in blue on Figure 1; the third one at 0.43 m from the ground, includes sensors RW4, RW5, RW9, RW10, RW14, and RW15, in purple on Figure 1. Lastly, the roof comprises sensors ET and RT (in red) and the ground (in green) sensors ET, and RG1 to RG9. The notation adopted for the sensors is as follows: the first letter (E or R) denotes the emitting and receiver chamber, respectively, while the second letter T, G, and W represents the Top, Ground, and Wall. These letters are followed by the number of each sensor.
Twelve different plates separating the two chambers were studied to investigate the influence of the surface and the direction of the opening: six with a horizontal blowhole and 6 with a vertical one. Figure 3 shows an example of each one. The plates were denoted as follows: PH (V)-X, where H means horizontal and V vertical for the direction, and the number X represents the surface area of the opening (in cm2). For example, PH-300 means that it is the plate with a horizontal opening with an area of 300 cm2. The total solid surface S0 of the separating plate is 0.25 m2 (0.5 × 0.5 m) Table 1 summarizes the characteristics of the openings. Outline of one vertical opening and one horizontal one (units: meters). Characteristics of Horizontal and Vertical openings.
Selection of reflected peaks
The main focus of this study was the first four overpressure peaks. As it is not straightforward to identify reflected peaks on an overpressure signal of 32 ms, a MATLAB program was designed to ensure that the reflected peaks were selected regardless of the position of the charge. Precise criteria were chosen to develop accurate experimental laws. The criteria were modified from those used by Gault et al. (2020) in order to adapt them to the two-room model used here.
Figure 4 shows the selection of these four peaks after application of the criteria. The profile is that of sensor RW2 for the opening PH-1344 with the charge in position 1. Selection of reflected overpressure peaks (Color is needed).
The criteria used were as follows
• The first criterion is the minimum overpressure. As some sensors are protected by the plate separating the two chambers, their overpressure for the first peak can be very low (<0.10 bar). For this reason, it was decided to lower the threshold to 0.05 bar (red dashed line). The criterion of 0.1 bar is lower than the lethal effect and 0.05 bar corresponds to the irreversible effects threshold. For example, in Figure 4, the threshold value excludes the peak corresponding to the first red triangle. • The second criterion concerns the time difference between two peaks retained to avoid considering mechanical vibrations. A minimum duration of 10 μs was chosen. In Figure 4, the second marked peak includes two overpressure peaks indicated by a green triangle and a red triangle. However, as they are too close together, only the first peak was retained. • The third criterion is the amplitude of the peak. This criterion was selected to avoid vibrations or mechanical noise. As for the first criterion, the amplitude is 0.05 bar. In Figure 4, the peak indicated by the third red triangle, located on the descending phase of the second overpressure peak, was not retained because its amplitude is too low compared to the criterion of 0.05 bar.
In order to limit the influence of measurement uncertainties, each configuration was repeated three times, and the values of the signal characteristics were averaged. First, it is necessary to ensure that the differences between the signals of the three shots on overpressure and arrival time are less than 5% for the entire experimental campaign.
Experimental models
Experimental models were developed based on the above criteria and from data gathered during experiments. The models describe the main characteristics of the shock wave, that is, the maximum overpressure ΔPmax, the total impulse I, and the arrival time of the first four reflection peaks Ta1->4. The models are based on the scaled distance Z (m.kg−1/3) defined by
Parameters
Given the complexity of signals in a multiroom confined environment, four geometric parameters were used to develop the laws: • The geometric parameter • The ratio of surface areas described as • A solid angle parameter from the center of the explosive charge denoted Ω, is given by • A solid angle Ω1 was used for the correlation on the total impulse, calculated as
Moreover, the maximum overpressure law depends on the overpressure obtained in free field for the same distance noted 
Maximum overpressure
It is difficult to predict the value of maximum overpressure because of reflections, differences in the angle of reflection, the effects of confinement, and the diffraction on the opening. The dispersion on the maximum overpressure is high, and the maximum overpressure can be different for two sensors close to each other for an acquisition time of 32 ms.
Hence, the experimental results of the maximum overpressure are represented for each type of opening and versus the radial distance and the solid angle Ω. The dependence of the ratio S/S0 on the maximum overpressure can be clearly seen on Figures 5 and 6. For further clarity, the curves are separated into two intervals for the abscissas for each type of opening. On Figures 5 and 6, dots represent experimental data. A lower envelope curve and an upper one limit these dots with a deviation of −30% and +40%, respectively, compared to the average correlation. Evolution of the maximum overpressure versus the reduced radial distance and the geometrical parameters for the horizontal openings. Receiver chamber. Dots represent experimental data. (Color is needed). Evolution of the maximum overpressure versus the reduced radial distance and the geometrical parameters for the vertical openings. Receiver chamber. Dots represent experimental data. (Color is needed).
An average law was established for each horizontal and vertical plate to represent the evolution of maximum overpressure as a function of the reduced distance and geometrical parameters. These laws are in the form of abacuses depending on the factor 
Coefficient A is too dependent on the ratio Evolution of coefficient A versus the ratio S/S0 for the two types of opening. (Color is needed).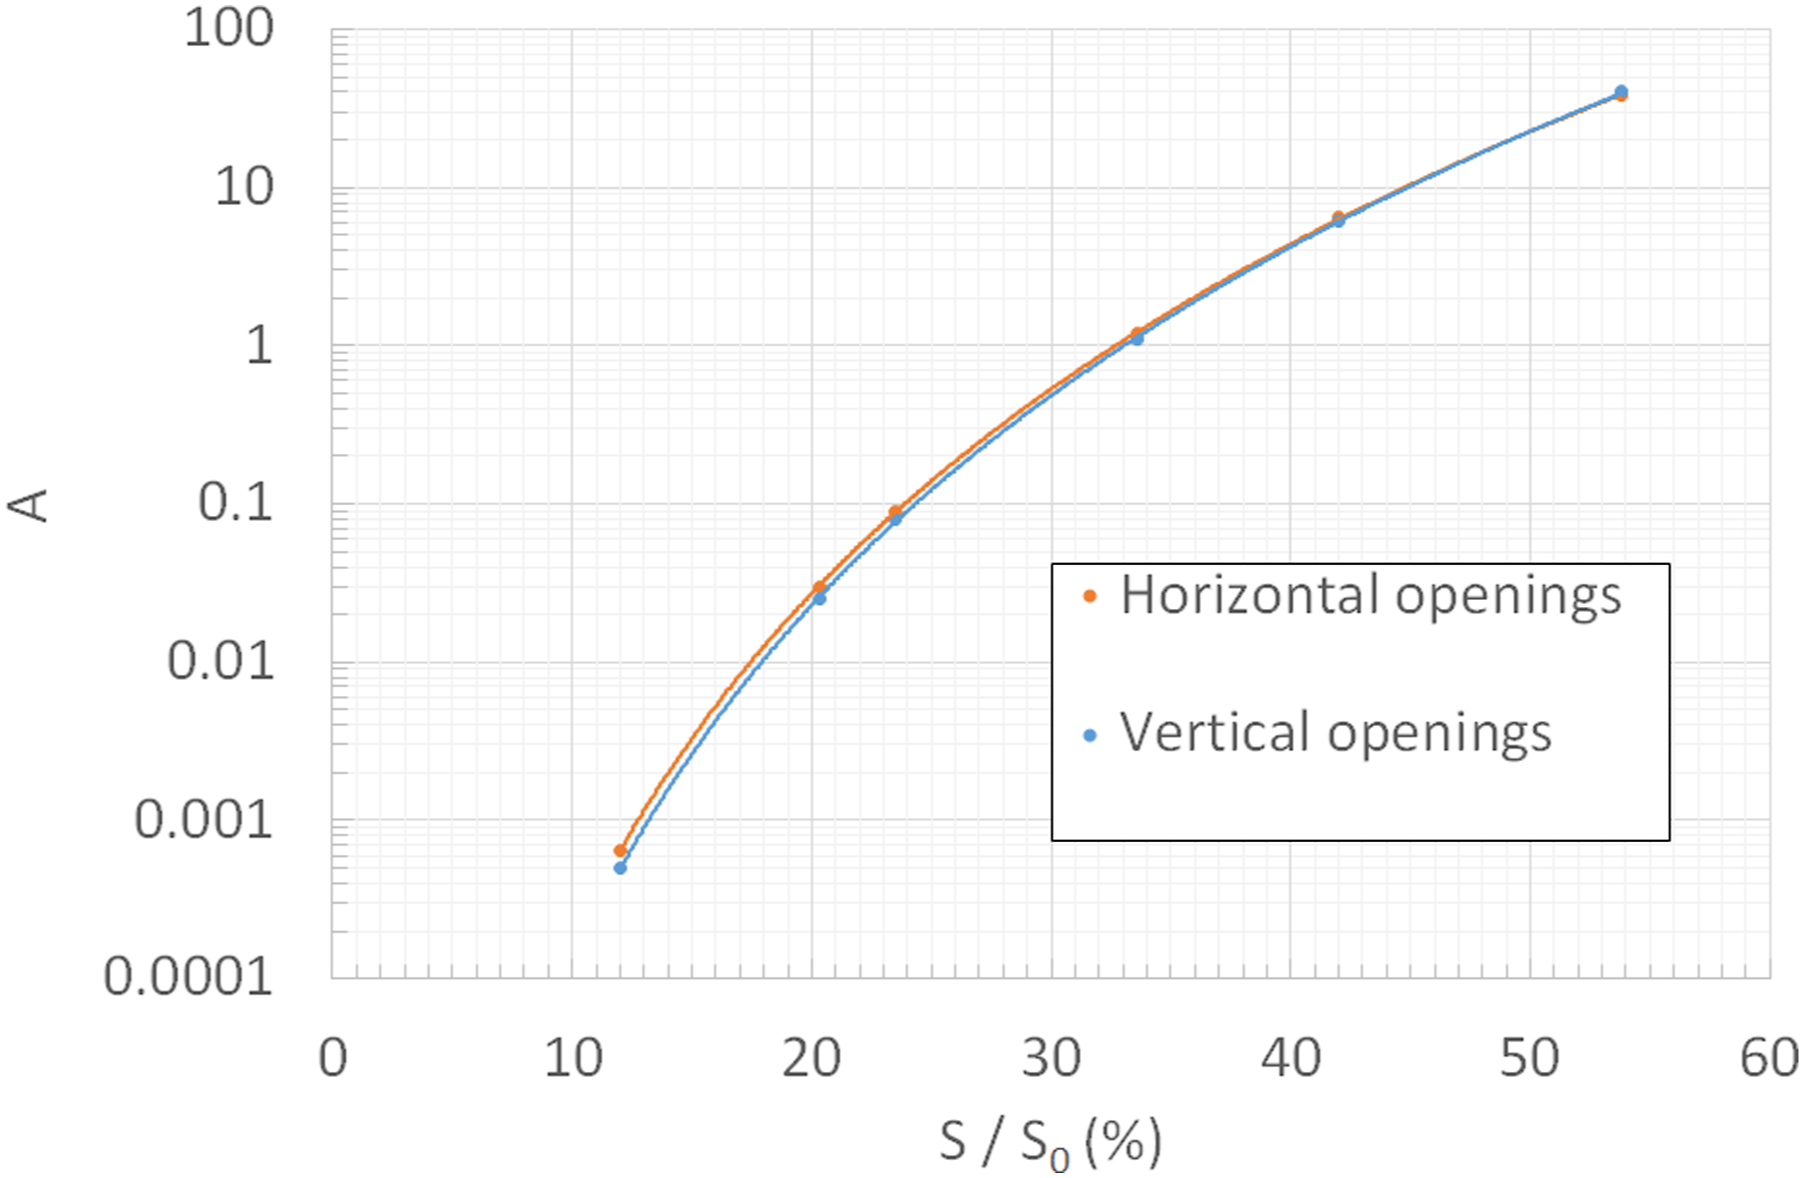
Case of horizontal openings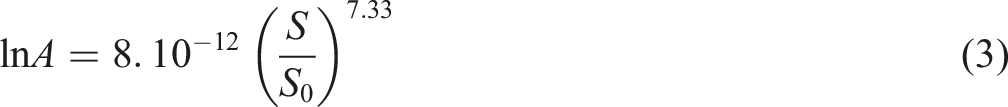
Case of vertical openings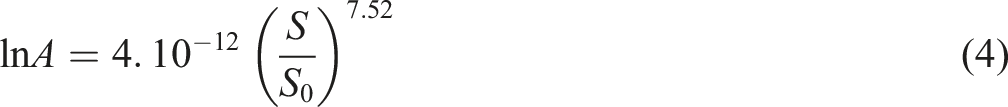
Total impulse
The method of Rigby et al. (2019) was used to develop a predictive law of the total impulse in a two-room model. Rigby et al. (2019) investigated impulse distributions, between 0 and 100 mm from the target centre, are shown for 100 g spherical charges. The scale of this numerical and experimental study is comparable to our experiments. Hence, we are applying here.
The method involves the calculation of an equivalent energy impulse noted IEK. This term represents a fictitious uniform impulse load applied to a face. IEK is calculated over the 32 ms of acquisition by relation (5).
Each face of the receiver chamber has five sensors, one in the center and one in each corner, 0.07 m from the edge. That is why each face is divided into five areas, as shown in Figure 8. Zones Z1 to Z4 have an area of Ai = 0.05015 m2 (i= 1, 2, 3, 4) and the central zone Z5 has an area of A5 = 0.04938 m2. The first step was to calculate IEK for each face, thanks to the total impulse measured by each sensor Ii,Exp Area separation on a face (distances in mm).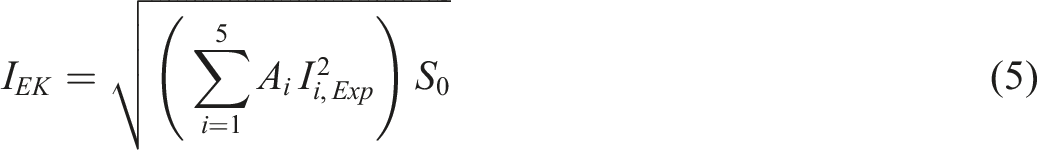
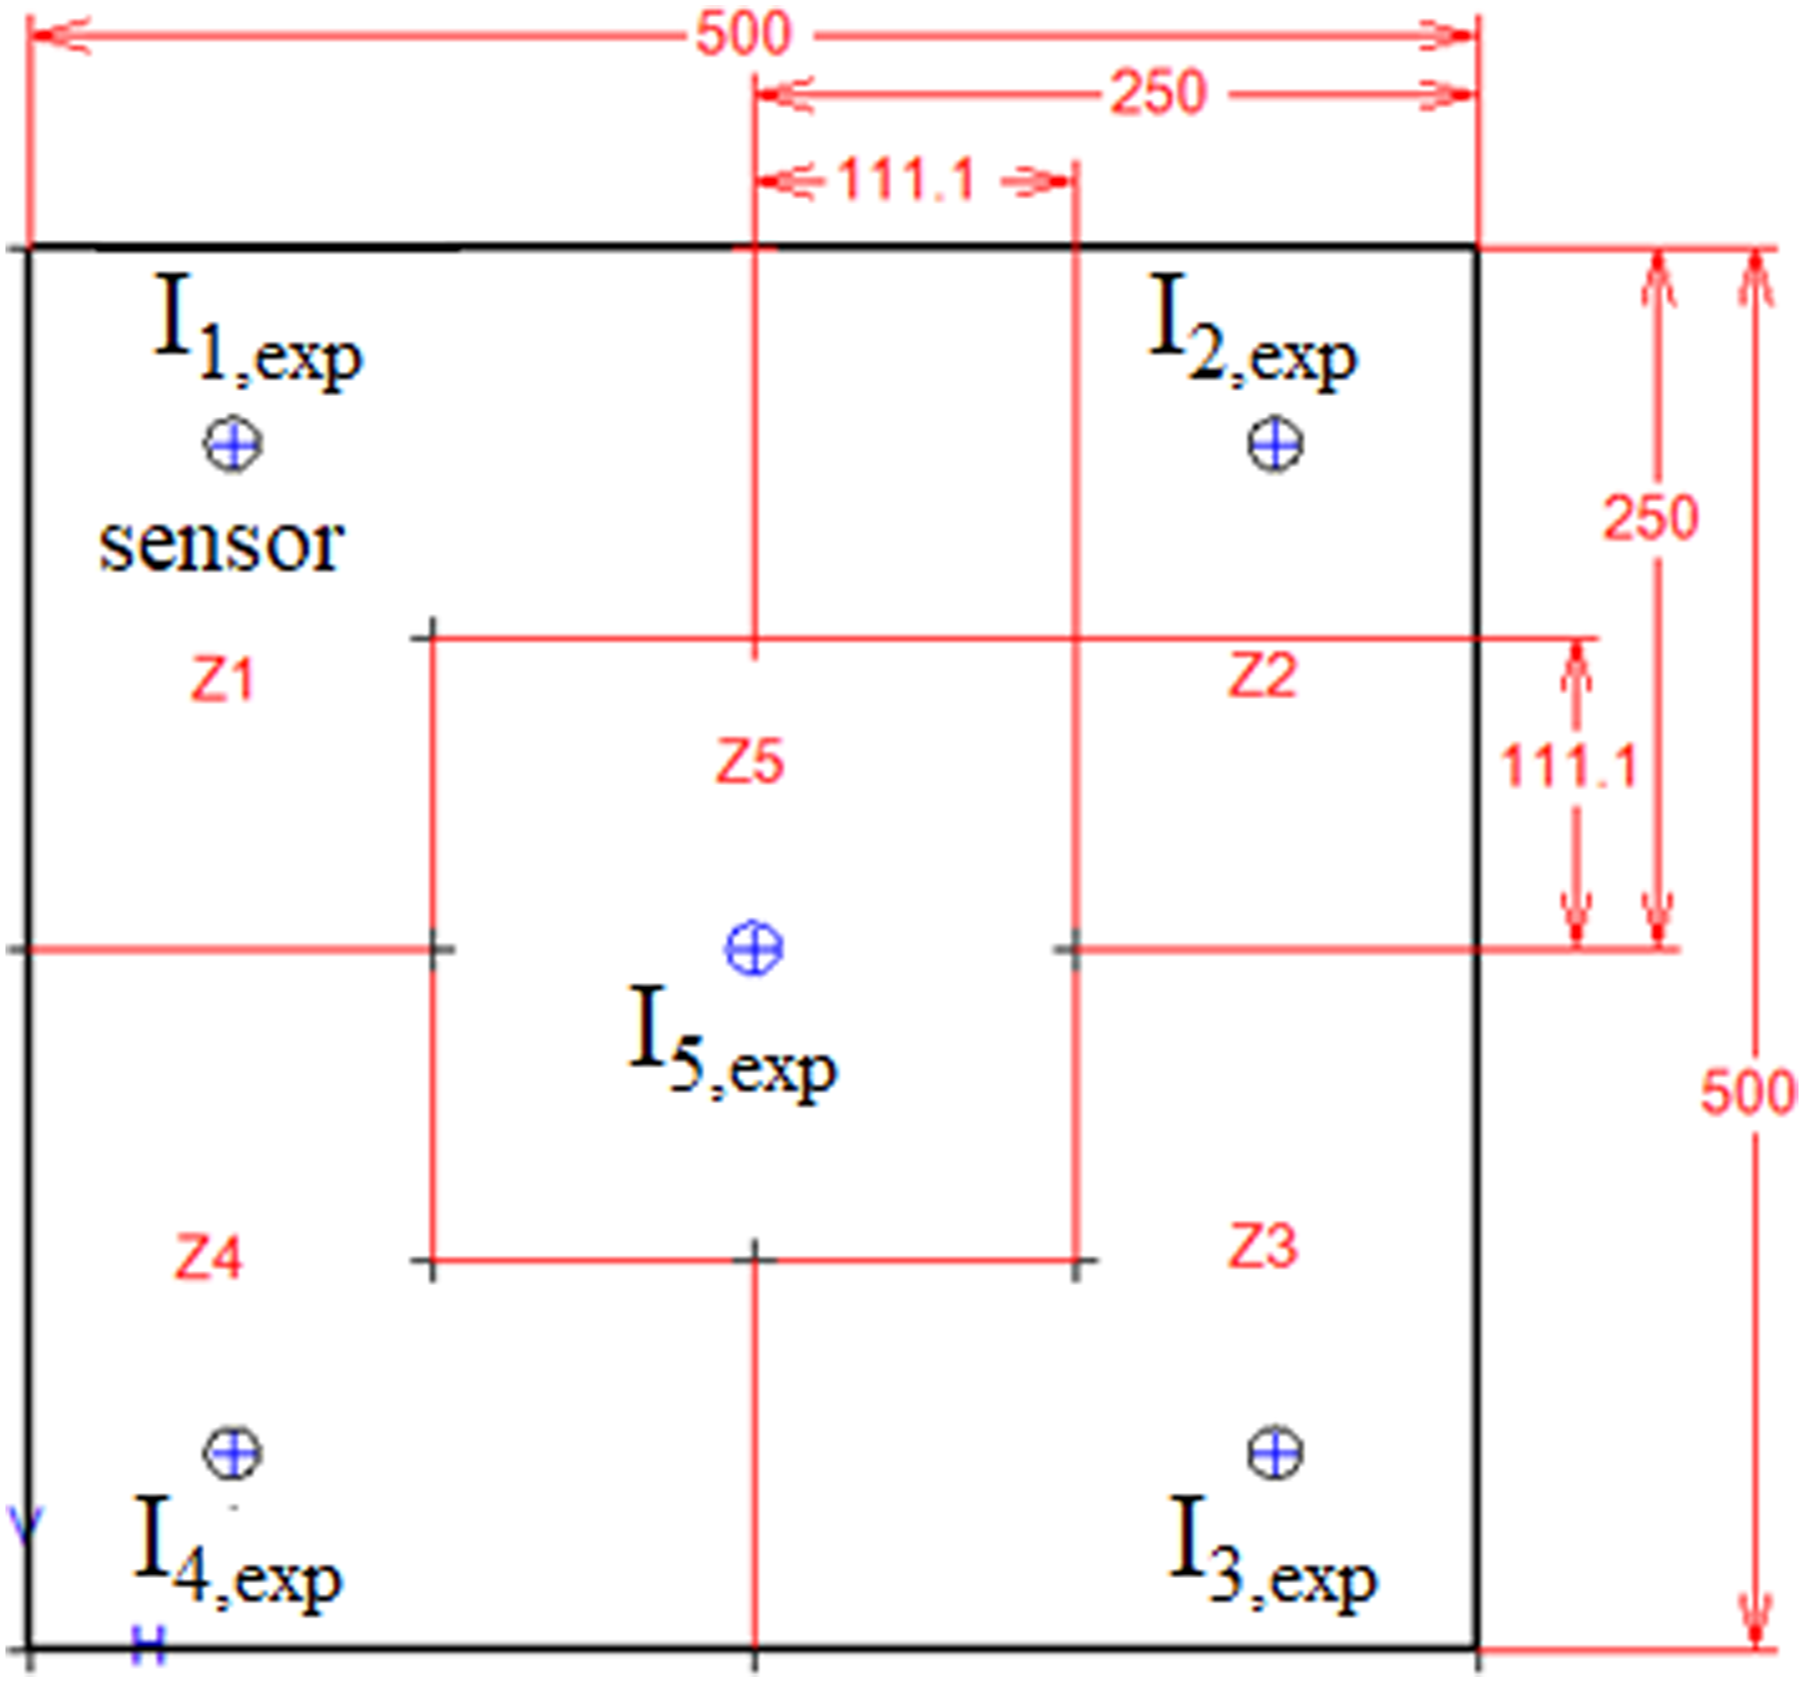
The final step was to determine the impulse correction factors Ki. They are calculated for each sensor according to the total impulse Ii,Exp measured by the sensor and the impulse IEK calculated for this sensor using the relation:
The correlation for the specific impulse is expressed in equation (6)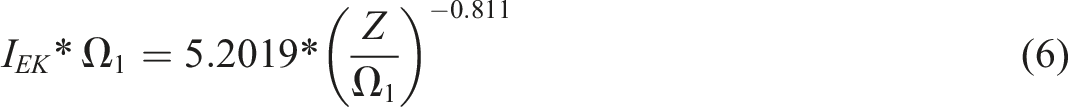
Figure 9 shows all the experimental data dispersed around the median correlation (equation (6)) and limited by high and low correlations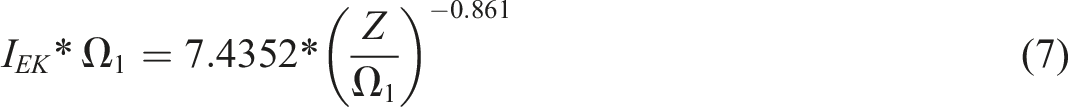
The deviation between experimental data and the average correlation varies from −29.7% to +25.6%. It corresponds to the maximum gap between the envelope curves and the median correlation.
The total impulse
Arrival time
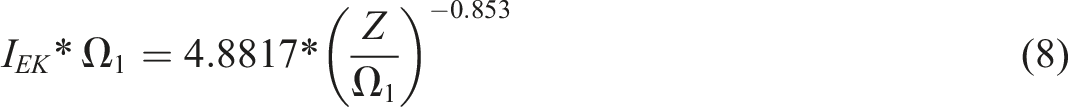
The arrival of the incident wave can be predicted from the evolution of the first arrival time. Equation (8) gives the corresponding law
The correlation of the second to the fourth arrival times depends on the arrival time of the first peak ta1. The predictive law is defined as
Coefficients C and D for the correlations on arrival times.
Average and maximum deviation between laws and experimental data in percent.
Figure 10 (a to d) show the evolution of each arrival time Tai with the median correlation defined by equations (8) and (9) limited by the envelope curves which represent the maximum deviation defined in Table 3. Evolution of the arrival times versus distances 
The predictive code
Principle of the code
In order to make the best use of the experimental correlations presented previously, a predictive computational code was developed. The code is limited to simple geometric enclosures, that is, two rooms separated by an opening. The shortest path method was used to calculate the length of the paths followed by the reflected shock waves. The user chooses the coordinates of the first impact point, which is the location of the first reflection. This code has three objectives: to predict where the reflections occur after the impact point chosen by the user, to determine where the different reflections recorded at the point of impact come from, and to calculate the different characteristics of the shock wave at each point. The mesh used for the calculation is the same for boxes and the opening. Nevertheless, the calculation does not depend on the mesh; it is used simply to show the graphic results.
Operating the code
Figure 11 presents a graphical representation of how the code works. First, the user must define the dimensions of the model (length, width, and height in meters), the characteristics of the charge (its coordinates and the mass of the charge), information about the point of impact and the method used for the calculation (described further). Graphical representation of the code.
Then the code calculates the distance between the charge and the point of impact chosen by the user, based on the shortest path. This distance is considered as the distance travelled by the shock wave, and it depends on the presence of a diffraction point on the opening as shown in Figure 11.
After that, it depends on the method used. The first method, called “upstream,” gives the path of the shock wave after the first impact point, while the second one called “downstream” gives the provenance of the different reflections on the impact point chosen by the user.
For the upstream method, a search for the shortest path is performed on all walls other than the one where the first impact point is located. Thus, a matrix is found with five distances (one for each different lateral wall and the ceiling). This step is repeated for the third and fourth impact points so that in the end, the Path matrix is composed of five possible paths of the shock wave.
For the downstream method, calculating the shortest paths is easier. The path between the charge and the impact point is calculated with a reflection for all mesh points. The seven shortest paths from the seven different faces of the impact point are kept. These are all the faces except the two located on the opening and the ground, that of the charge and that of the impact point.
Application of the code
For both methods, the sensor used in this application was RW6, with the opening PH-840, and the charge was placed in position 1. Sensor RW6 is located on the backside of the model.
Upstream method
Figure 12 represents the graphical result obtained under these conditions for sensor RW6, using the upstream method. The red dot represents the charge, the black one is the origin of the reference frame, the purple one is the point of interest chosen by the user, and the blue ones represent reflections. The program calculates the possible reflections on the different faces (colour paths) and the parameters associated to each point. The calculation time was 119 ms. Graphical display of results for method one (upstream method) (Color is needed).
In Figure 12, there is no diffraction between the charge (red dot) and sensor RW6 (purple dot). After that, reflections are calculated on different faces. For example, the blue path will reflect first on face HINK (point 1), then the closest reflection point on a different face will be on face KJNP (point 2) to finish on face IJNM (point 3). The red path is symmetrical. The reflection first occurs on face LMNP, then KJNP, and IJNM.
Parameters calculated for sensor RW6.
Some of the parameters can be easily checked directly on the overpressure profile. This is the case for the maximum overpressure and the arrival time. Figure 13 depicts the overpressure profile obtained experimentally for this sensor under this configuration. The arrival time is 1.782 ms, and the maximum overpressure is 0.359 bar. Results obtained with the code are very close to the experimental ones, with a difference of 3% for the arrival time and 4% for the overpressure. Overpressure profile for sensor RW6 with PH-840.
Downstream method
The sensor used here was the same. However, with the downstream method, the focus of interest is the origins of reflections recorded at sensor RW6. Using the previous example on sensor RW6 with priming position one and opening PH-840 with a mesh size of 0.1 m, Figure 14 depicts the graphical result obtained under these conditions using the downstream method. The calculation time was 3 s. The program calculates the possible origins of the first four possible reflection peaks on the different faces (colour paths), returns the distances associated with the different paths, and calculates the parameters associated with the point of interest. As already mentioned, the code calculates seven paths. For this case, the shortest path is the charge/sensor distance (5.20 m), then the red one reflected on face ABCD (5.94 m), then the pink one reflected on HIJK (6.04 m), followed by the blue one reflected on face OEFG (6.06 m). Other paths, such as the green or orange ones, are significantly longer, respectively, 7.88 m and 8.40 m. This method makes it possible to determine the origin of reflections. Graphical display of results for method two (downstream method) (Color is needed).
Arrival times for sensor RW6 with PH-840 and position 1 of the charge.
Overpressure profile of sensor RW6 with PH-840 before 6 ms after detonation (Color is needed).
Conclusion
The tests carried out in the two-room model provided a large amount of experimental data, which was the first step to obtain laws on the maximum overpressure, total impulse, and the arrival times of the first four overpressure peaks. Given the complex phenomena and reflections occurring after the detonation of a charge inside the model, four criteria were defined to select the overpressure peaks to be studied. The shock wave characteristics make it possible to understand and compare the phenomena that occur inside a multi-space confined environment. The predictive laws presented in this paper depend on geometric parameters and reduced distance between the load and the sensor. Because of the difficulty encountered in obtaining a behavior law for the impulse, it was decided to find the correlation on the equivalent energy impulse IEK. The deviations observed between the predictive laws and the experimental data can be explained by experimental uncertainty but remain in the order of 10%. The laws are used within a simplified calculation code to determine the characteristics of the shock waves at any point of the model as a function of the distance. The shortest path algorithm was used to determine this distance. To meet the requirements of our industrial partner, an essential criterion for this study was a low calculation time. As shown by the results, this method appeared to have a fast calculation time, as it took only 119 ms for the downstream method and 3 s for the upstream method with a mesh size of 0.10 m. The computational code allows the reconstruction of the path and characteristics of the shock wave in a parallelepiped enclosure separated into two chambers and provides the origins of reflections in the chamber.
Footnotes
Acknowledgements
DGA Techniques Navales funded this work under contract N° 15-86-0027.
Declaration of conflicting interests
The author(s) declared no potential conflicts of interest with respect to the research, authorship, and/or publication of this article.
Funding
The author(s) received no financial support for the research, authorship, and/or publication of this article.