
Abstract
Obstructing the passage of blast waves is an effective method of mitigating blast pressures downstream of the obstacle. To this end, the interaction between a blast wave and a simplified structural shape, such as a cylinder, has been widely investigated to understand the complex flow pattern that ensues around the obstacle. The patterns include the interference zones of the incident wave, the diffracted wave, and other secondary waves in the downstream region. Such zones are responsible for causing significant modifications to the blast wave parameters. This research aims to identify and study the factors that serve to mitigate the resulting blast loads downstream of a cylindrical obstacle – both on the ground, and on a rigid wall target that the obstacle is aiming to protect. Inputs from this numerical study are also used to develop a fast-running predictive method based on an artificial neural network (ANN) model. It was found that the size of the cylinder, the strength of the blast wave, the position of the cylindrical obstruction, and the target length, all have remarkable effects on the development of the complex flow-field downstream, and on the impulse mitigation on a reflective target. A number of key mitigation mechanisms are identified, namely shadowing and interference, and their origins and significance are discussed. An ANN model trained using scaled input parameters could successfully predict impulse values on such a reflective target. Using this model to predict the response of previously unseen configurations (for the ANN) gave excellent correlation, thereby demonstrating the high fidelity of this fast-running tool, and its ability to predict the effectiveness of various wave-cylinder interactions in mitigating blast loading.
Keywords
Introduction
General context
Protective barriers are known for their effectiveness in reducing the blast loading on targets located behind them, thereby limiting the structural damage. Such barriers can be considered for urban layouts, either as resilient and solid blast walls, or as passive protective elements such as stand-alone obstacles. A common obstacle has been the cylindrical one, as it is an effective blast wave attenuator (Abe et al., 2001; Gebbeken and Döge 2010; Suzuki et al., 2000). This is because the diffraction wave tends to gradually load the rounded profile of a cylinder, and due to the cylinder’s mitigation potential in its downstream region. An understanding of the effects of the blast wave interaction with a rigid cylindrical obstacle is therefore vital for protection purposes. This interaction has been investigated in the literature along two different lines: (i) the initial interaction between an obstacle and the blast wave to predict the frontal load, and (ii) to understand the consequences of the wave interaction in the downstream region. To predict such a load, ANN methods have successfully demonstrated the ability to estimate complex blast loads in scenarios such as a confined environment (Dennis et al., 2021), near-field blast loading (Pannell et al., 2022a; 2022b; Holgado et al., 2022) and for a target protected by a solid wall (Bewick et al., 2011). However, there is no deep insight into the characterization of blast wave interaction with a cylindrical obstacle and its role in mitigating the load acting on shadowed structural rigid targets.
Motivation and aims
Therefore, a parametric study is required to explore the influences of the following on the mitigation of blast loads: (i) the size of the cylindrical obstacle, (ii) the blast wave intensity, (iii) the position of the obstruction, and (iv) the target length/size.
A validated special purpose Computational fluid dynamics (CFD) software for explosions, called APOLLO Blastsimulator, has been employed for this study. As an aside, the findings from this parametric study will also aid in developing a successful ANN prediction approach.
The outline of the paper, therefore, is as follows: the methodology section first explains in detail the setup of the numerical model and its validation. Then, the results and discussion section illustrates the consequences of shadowing and wave interference on blast loading parameters on the ground and on a target wall downstream of an obstacle. Finally, an ANN is developed to predict blast mitigation behind the cylinder, which is subsequently tested against a number of unseen examples. Finally, the ideas put forward in this work are then summarized and concluded.
Literature review and theoretical considerations
Literature review
Several researchers have characterized the interaction of a blast wave with a structural column and have provided empirical formulae to predict the blast loads. This has been done for different cross-sections of stand-alone columns to assess the influence of geometrical shapes on the interaction process (Rajkumar et al., 2020; Shi et al., 2007; Williams and Williamson 2012). Among all shapes evaluated, a circular cross section was found to have the highest ability to diffract rather than reflect the incoming blast wave. This leads to a more uniform variation of load across the cross-section, leading to a reduced total load (Gebbeken and Döge 2010). Moreover, the load amplitude remains unaltered at various angles of impact of the surface blast. Combining this with the fact that the stiffness also remains unchanged due to rotational symmetry, a cylindrical column is a good choice as an attenuation obstacle. Qasrawi et al. (2015) numerically worked on characterizing the loading for relevant parameters of stand-alone circular columns and developed sinusoidal curve fits to estimate the equivalent reflected pressure and impulse. The experimental work of Mulligan (2018) put forward a different relation to predict the pressure ratio across the circumference of the cylinder by taking into account the influence of angle of incidence and the wake region in the rear face. Gauch et al. (2020) developed analytical equations for calculating the load on the surface of a cylinder due to the impact of a pressure wave having an arbitrary shape, amplitude and time duration.
Concerning the effect on the downstream flow after a blast wave impacts such an obstacle, it is vital to understand the diffraction/refraction phenomenon around the circular barrier. The phenomenon of diffraction of shock waves over a cylinder was first studied in the 1950s and a general theory of shock wave diffraction over finite objects was established by Whitham (1957, 1959). Subsequent research aimed to study the shock wave diffraction experimentally and analytically over the cylinder (Bryson and Gross 1961; Ben-Dor and Takayama 1985; Heilig 1969; Parkinson and Jandali 1970). The process of wave diffraction around a circular geometry involves regular and irregular (Mach) reflection waves. Regular reflection starts when the shock wave encounters a stagnation point on the surface whereas a diffraction wave originates from points where the incident shock impinges on a non-normal surface. As the wave travels along the circular surface, the regular reflection configuration persists until the interaction angle of the wave with the surface decreases and reaches a certain limit, leading to a Mach reflection. Such a configuration gives rise to a new composite shock front called a Mach shock, comprising the reflected, Mach, and incident waves intersecting at a point called the triple point (Xiao et al., 2020). As this wave progresses, at some point on the curved surface of the cylinder, the triple point separates and propagates further downstream. By this time, it is worth noting that two regions of flow exist: one processed by the incident wave and the other processed by the reflected wave. Each region has its own mechanical and thermodynamic properties. A vortex now forms downstream owing to the difference in velocities (slipstream) above and below the locus of the triple point. Furthermore, as the unaffected portion of the incident wave propagates downstream, complex shock-shock interactions are established because of the collision with the Mach waves at the rear stagnation point just behind the cylinder surface. All of these are responsible for modifying the blast wave in the downstream region.
It needs to be mentioned here that such modifications need not always result in attenuation. There exists the possibility of amplification occurring as well, and this was demonstrated experimentally for a shock wave interacting with cylindrical obstacles by Suzuki et al. (2000) and also by Abe et al. (2001).
For blast loading on a target plane, a pole located upstream can disrupt the blast loading. The disruption introduced by such a pole is usually taken to diminish within a distance of 10 pole diameters. To test this commonly used rule of thumb, Christiansen and Bogosian (2012) numerically analysed two configurations: first, a single circular pole in front of a target plane; and second, two poles placed behind a central pole to form a triangular array of three circular poles located in front of a target plane. They report that the shock wave disrupted by the central pole does not recover within 10 pole diameters, thereby resulting in peak pressure variations and even a delay in the arrival time of the shock wave. It was also reported that total scaled distance, Z, between explosives and the target significantly affects the wave interference, resulting in impulse reduction, especially at small scaled distances (Z < 0.8 m/kg1/3). However, a negligible effect of Z on impulse reduction was observed for longer scaled distances.
Niollet et al. (2015) measured the blast wave attenuation arising from an interaction with cylindrical bars in a shock tube by measuring the target response. The numerical and experimental data support the view that the location of the obstacle between the explosive and the target plays a substantial role in controlling the degree of the mitigation. It was found that placing one bar closer to the explosive can substantially improve attenuation, as the blast wave takes time to then re-form behind the bar. On the other hand, placing an obstacle closer to the target can produce more damage by trapping the reflected wave. The authors however state that the influence of an obstacle’s position on the attenuation may be insignificant for larger explosive charge mass. Another study by Luo et al. (2017) reports the strong influence of the Mach number, that is, blast intensity, on the interaction with a cylindrical surface. A strong drop in pressure, and density values, and an enhanced vortex generation in the wake region were seen for such strong shock wave cases.
In addition to the previously mentioned experiments and analytical work, numerical solutions have also been validated and found to be accurate in capturing the diffraction patterns around the cylinder and to obtain the pressure distribution over a cylindrical surface (Ofengeim et al., 1993, 1996; Ofengeim and Drikakis 1997; Yang et al., 1987). Therefore, mitigating a blast wave by means of wave interactions described previously may also be evaluated reliably using numerical simulations.
Hahn et al. (2021) numerically characterized the pressure and impulse changes downstream of a blast wave-circular pole interaction. The explosive charge masses were varied to generate a range of scaled stand-off distances. A build-up of pressure and impulse due to constructive interference of the waves was observed in the downstream region, eventually approaching amplification factors of 1.6 and 2.0 for pressure and impulse, respectively. As the disturbed waves propagate downstream, the waves recover, providing a linear relief for the impulse. The pressure recovery however was not as quick as the impulse, as it was found to persist beyond 10 column diameters. Therefore, the values of pressure and impulse in circular column diffraction events are highly reliant on the Hopkinson scaled distance (i.e. blast wave intensity) which is linked to the explosive mass and not primarily the position of the column. For a specified shock wave intensity, the wave reattachment distances for interactions behind some generic objects including a cylinder were quantified in this research.
Two-dimensional numerical modelling, which only takes into account diffraction from the top edge, was carried out by Dey et al. (2020). The differences between the disturbed flow and the free-field scenario were found to be less than 5%. The presence of corners in an obstacle, which leads to formation of vortices, was shown to affect the pressure loss and postpone the recovery of the shock wave.
To evaluate structural response, both experiments and numerical simulations are still vital for accurate blast load prediction (Rigby et al., 2019). A comprehensive knowledge of the factors influencing the magnitude of this loading is also useful. To design active mitigation systems such as a resilient blast wall, and to assist in developing an interior layout for improved passive blast protection, say, due to a stand-alone cylindrical obstacle, detailed maps of blast loading are necessary. This is more so, when disturbances arising from complex wave interactions are involved, such as an explosion in a closed environment. Since numerical methods are computationally intensive, there exists an acute need for a quick and reliable engineering tool to obtain such blast loads. The use of artificial intelligence and machine learning methods have significantly improved the ability to predict the magnitude of blast loading impinging on targets under complex conditions. Recently, Dennis et al. (2021) successfully developed a rapid artificial neural network (ANN) model to predict the blast loading in a confined internal environment. Pannell et al. (2022a; 2022b) utilised ANNs to explore physics-guided regularisation and transfer learning respectively to improve the ability of an ANN to predict near-field blast loading. Another ANN methodology to model non-linear blast loading behind a blast barrier protective wall was developed by Bewick et al. (2011). Prior to this, Flood et al. (2010) employed results from two previous experimental studies to successfully predict blast loading parameters behind a solid wall. Hence, it may be gathered from the literature that the ANN methodology has the ability to describe the modification of blast loading parameters with high fidelity in closed environments and even behind a solid barrier.
Theoretical considerations
A primary blast load parameter is specific impulse, i. This is because the blast load duration, especially for near-field explosions, is expected to be considerably shorter than the period of vibration of the structure, which is therefore unlikely to be sensitive to the exact form of the pressure load, only its integral with respect to time, viz. specific impulse. The distribution of impulse across the face of the target is expected to be complex for close-in detonation scenarios. This non-uniformity is addressed by defining an energy-equivalent specific impulse (EEI) which imparts an identical kinetic energy to the object (Rigby et al., 2019) as the distributed load, and was shown to better correlate to structural response than the simple area-integral of specific impulse. Thus, in this work, EEI, as defined in equation (1), has been utilised as a single-number metric to quantify loading on a given target area (A).
Numerical methodology
Modelling in APOLLO blastsimulator
APOLLO Blastsimulator (hereinafter shortened to Apollo) is a commercial finite volume CFD software from Fraunhofer EMI (2018). It is a specialized software intended for simulating detonations, blast wave propagation, and problems pertaining to gas dynamics. Using a HLL-type Reimann solver of second-order accuracy, it solves the inviscid compressible Euler equations – laws of conservation of mass, momentum, and energy – which are time-dependent, non-linear, and hyperbolic in nature. Furthermore, it may also be used to solve fluid flows that are inert, chemically reacting, or non-heat conducting. The mesh system in Apollo is based on the Cartesian grid system, and it also has dynamic mesh adaptation (DMA), solution mapping from 1D to 3D, and mapping between 3D stages. Apollo’s mesh system is quantified in terms of the zone length L at the coarsest level, and the cell length h (called resolution) at the finer level. On specifying the zone length L and a resolution level N ranging from 0 to 9, the ultimate resolution is automatically calculated as h = L/2
N
as shown in Figure 1. A schematic drawing representing the mesh generation (left) and the dynamic mesh adaptation scheme with staging technique (right) as used in Apollo Blastsimulator software (Fraunhofer EMI 2018).
Apollo performs the computational analysis using its one dimensional (1D) and DMA solvers. The 1D solver computes on a uniform one dimensional mesh in the direction of the target using a global mesh adaptation, where it chooses an initial domain whose resolution depends on the charge size. However, DMA solver computes on a 3D cartesian mesh system incorporating a dynamic mesh. Specific zones in the computational domain are dynamically refined to the maximum selected resolution. This is done based on the local gradient of quantities such as pressure, density, or temperature. An advantage of DMA is that based on certain pre-selected quantities, it identifies meshing zones which are inactive, thereby reducing the computational demands both in terms of computational time and memory used. Moreover, staged mapping can reduce the cost of the simulation by either dividing the computational domain into subdomains according to the number of stages with increased mesh resolution (right of Figure 1) or by combining a 1D solver with a DMA solver in a single process. In Apollo’s mesh, objects/structures are then modelled as embedded objects in the domain using an approximate voxel formulation that is rigid and impermeable (without heat transfer and friction).
The explosives used in this work are Trinitrotoluene (TNT) and the plastic explosive, C4. The detonation modelling of a high explosive (HE) in Apollo is based on the Chapman-Jouget model. The relationship amongst pressure-density-temperature values for the products of reaction is then given by the Jones-Wilkins-Lee (JWL) equation of state (Lee et al., 1968).

The equation of state parameters for Trinitrotoluene and C4 as used in this work. Adapted from Dobratz and Crawford (1985).
Mesh sensitivity and problem validation
In any CFD analysis, mesh convergence is essential to obtain correct values of blast loading parameters, especially, peak overpressure and peak specific impulse. In Apollo, this is carried out by analysing the effect of the ultimate cell length, h = L/2 N , associated with the DMA. For free-field events, Apollo has been extensively validated for both close-in detonation (Pannell et al., 2019, 2021; Whittaker et al., 2019), and far-field events (Dennis et al., 2021), where the ultimate cell length h was linked to the stand-off distance S. On considering an integral numbers of zones, it was suggested that 10% convergence in overpressure and specific impulse to the experimental records in Rigby et al. (2015) may be achieved when the ultimate cell lengths are taken to be h = S/240 and, h = S/40 respectively (Dennis et al., 2021; Pannell et al., 2021). Since in the present study a form of the peak value of specific impulse is the parameter to be monitored, a minimum ‘ultimate cell length’ of h = S/40 has been used for free-field detonations. But to simulate the diffraction around a cylindrical surface by faithfully capturing the shape of the cylinder, h had to be further decreased. This is due to the limitations imposed by Apollo’s voxel formulation to model structures within the simulation domain.
Next, the validation of diffraction/refraction phenomenon was carried out as this is pertinent to the problem at hand. First, the experimental work of Tyas et al. (2011a) was used to validate the pressure evolution on a finite target surface to demonstrate Apollo’s ability to capture clearing effects. For a rigid target shown in Figure 2(b), blast loading using 250 g PE4 (nominally identical to C4) hemispherical charges at 4, 6, 8, 10 m stand-off distances were simulated. A quarter symmetry 3D model was set up in Apollo, with an overall domain size of 8 × 11×8 m. An ultimate cell length of h = 12.5 mm The experimental configuration that was used to validate simulations in Apollo software. 
The overpressure histories at these points for both the experiment and Apollo were compared, an excellent correspondence was obtained as shown in Figure 3. The smoothing of the initial shock front is clear for all models, leading to a slight discrepancy in the peak pressure values due to the numerical rounding of the shock front. This can be solved by further mesh refinement, but it has little influence on improving the ability to capture clearing pressure history (Rigby 2014) and was therefore not taken up further. A comparison of the peak specific impulse values
1
has been provided in Table 2. Overall, the numerical overpressure history has been shown to qualitatively follow the experimental trace and the impulse values remain within 3% of the experiments. This demonstrates the ability of the Apollo software to capture the physics of blast wave interactions involving clearing. A comparison of the experiment and simulation overpressure histories for gauges 1 & 2 at stand-off distances of (a) 4 m, (b) 6 m, (c) 8 m and (d) 10 m. The experimental and numerical values of peak cleared, reflected impulse values of gauge 1 at different stand-off distances.
As this study aims to explore the reduction of EEI arising from wave interferences, a quantitative and qualitative validation of the flow structures needs to be carried out as well. Due to the limited data available in literature for pressure distribution over a cylinder exposed to a blast wave, numerical validation is carried out using data from two different sources. First, pressure distribution over a cylinder from the work Yang et al. (1987) has been used. Second, a qualitative comparison was carried out against schlieren images taken from the experimental work of Bryson and Gross (1961).
Yang et al. (1987) numerically solved the shock wave diffraction problem over a 12.5 mm diameter cylinder for an incident Mach number of 2.81 in a ‘shock tube’ setup. The pressure history at certain angular positions across the circumference, starting from the forward stagnation point (0°) until the rear stagnation point (180°) was reported in increments of 30°.
For purposes of validation of Apollo software, a larger diameter cylinder of 120 mm was used, as a lower size would mean the use of a highly refined mesh which was beyond the capabilities of the available computational hardware. A full 3D model with a semi-infinitely tall cylinder along the positive Z-axis was used to run this simulation over a domain of 2 × 1.5 × 2 m. A semi-infinite model was simulated to avoid the top diffraction effect to maintain equivalence with Yang’s work. The ultimate cell length used for this simulation was 6.25 mm to ensure the cylinder radius is discretized with ∼10 voxel cells. To obtain an inflow Mach number of 2.81, a particle velocity of 710 m/s and static pressure of 910 kPa were assigned to start the solution process from the quiescent conditions in ambient air (γ air =1.4, p amb =101.325 kPa and T amb =300 K).
Figure 4 shows the comparison of pressure traces at five gauge points, taken from angular positions along the lower half of the cylindrical surface. Although the pressure history at the 180° gauge in Apollo records a lower amplitude, the overall pressure profile closely matches with the numerical results of Yang et al. (1987). The mismatch at the rear stagnation point is quite likely to have risen from the disparity in the size of the cylinders, leading to different separation points along the rear portion of the cylinder. Comparison of pressure histories from Apollo CFD and Yang et al. (1987) experiments at 5 angular locations on the cylinder. CFD: Computational fluid dynamics.
The numerical schlieren photos from Apollo were also compared against the experimental schlieren photos of Bryson and Gross (1961) to validate the mechanics of blast wave diffraction around the cylinder as laid out in the introductory section. Figure 5 shows comparisons for an early t1 and late time t2 interaction profile. At time t1, the transition of regular reflection (RS) into Mach reflection (MS1), and the location of the triple point (TP1) connecting the Mach reflection to the incident shock (IS), have been captured fairly well by Apollo. At time t2, the subsequent interactions of the Mach wave behind the cylinder involving a second Mach reflection (MS2), a second triple point (TP2), the generation of vortices (V), and the associated complex shock-shock interactions, all have been captured by Apollo in a satisfactory manner. Comparison of schlieren snapshots from Apollo CFD and the experimental work of Bryson and Gross (1961) at two time instants. Flow is from right to left. CFD: Computational fluid dynamics.
Overall, the diffraction effects on blast wave interaction with the cylinder have been captured successfully by Apollo software. This demonstrates the ability of the software to simulate wave interactions behind the obstacle for ultimate cell sizes at least 10 times smaller than the cylinder radius.
CFD data generation
Parameters
Blast wave interaction with an obstacle depends on the properties of the blast wave and the geometry of the obstacle. However, due to the absence of specific pointers regarding this in the literature, a global setup has been considered with four input parameters. The parameters are: 1. The mass of the explosive W
TNT
. 2. The scaled distance Z
R
=R/W1/3 that uses the total stand-off distance of the target R and the explosive of mass W. 3. The cylindrical pole diameter D. 4. The obstacle location ratio, given by d0/R, where d0 is the obstacle distance from the explosive.
A summary of the input configuration groups that were used for the simulations.
To understand the interferences on the target due to the presence of the cylinder, it is also helpful to consider the flow evolution on the ground, in the vicinity of the cylinder. So first, CFD studies focusing on the ground plane downstream of the obstacle were undertaken before proceeding to understand the impulse evolution on a target wall downstream.
Dataset for studies on the ground behind the obstacle
To study the effect of the cylinder on the blast wave propagation downstream, four 3D numerical models were simulated using Apollo. A plan view of such a simulation is shown in Figure 6 and the input variables for the simulations are given in Table 4. Cylinders of two diameters (12 cm and 24 cm) that were sufficiently tall in the Z-direction were considered. Each was exposed to a medium intensity (Z
do
= 1.04 m/kg1/3, Mach number = 3.5) and a high intensity blast wave (Z
do
= 0.44 m/kg1/3, Mach number = 7.3) to clarify the role played by the particle velocity on the development of the wave interference pattern and its consequences on blast loading. As baseline markers, two simulations without obstacles were run to compute the free-field peak overpressure and specific impulse values. A schematic drawing illustrating the model setup for a study of the downstream effects of blast interaction with a tall cylindrical pole. A summary of the input conditions for the free-stream simulations.
The downstream domain (Figure 6) was chosen to be a slightly over 10 pole diameters (10D) long as this is the length it takes for the wave interference effects to cease (Christiansen and Bogosian 2012; Hahn et al., 2021). The additional length beyond 10D is necessary to prevent spurious reflections from arriving at the gauge location during the positive phase. Mesh elements of size 6.25 mm were used for this simulation. The stages feature in Apollo was used to enable solution mapping from 1D to 3D to reduce the computational load and CPU time. The 1D stage was terminated at a distance of 0.90 m from the detonation centre, which is just before the impingement of the wave onto the cylindrical surface. Then, the numerical solution was mapped into a 3D model to proceed with the simulation of the diffraction around the cylinder. An array of gauges was positioned on the ground, spaced 5 cm apart along both X and Y directions. The following ratios were then obtained from the simulations
Here, the subscripts ‘pole’ and ‘free’ relate to the obstructed and non-obstructed model results, and P and I refer to pressure and impulse.
Dataset for studies on the target plane
For the simulations on the target plan, EEI ratios were to be calculated for the input conditions in Table 3. But then, since the location of the obstacle plays an important role in the interaction process, the total stand-off distance R has been split in terms of the distances from the charge to the obstacle d
o
, and from the obstacle to the target d
t
, respectively. To avoid working with two parameters, the obstacle location ratio d
o
/R is being used, as it can account for the position of the obstacle in the domain. The blast intensity is captured by the obstacle scaled distance Z
do
(d
o
/W1/3). This accounts for different aspects of wave diffraction such as the inclination of the shock-shock path, and also the strength of the vortices and the reflected wave. The target distance d
t
is being used as a measure of the reattachment distance of the disrupted waves in the downstream. The EEI is then computed based on reflected specific impulse values acting on the reflective rigid target. This evaluation was carried out over 5 different target lengths, TL, as illustrated in Figure 7. For simplicity, the wall height has been fixed at 1 m since the interest is in understanding the wave disruption along the width and not the height. With the inclusion of these additional parameters, Table 3 was slightly emended, and the final input dataset used for the simulations may be found in Table 5. A perspective drawing illustrating the 3D CFD domain that was set up to study the role of the indicated parameters on the propagation of an obstructed blast wave. CFD: Computational fluid dynamics. A layout showing the simulation configurations under each group.
A typical 3D domain for these 106 models (plus 25 free-field models) has been illustrated in Figure 7. The extents of the simulation domain are set up according to the total stand-off distance in each group to prevent artificial reflections from the outflow boundary disturbing the flow evolution inside. The target wall was R + 1 m tall, and 861 gauges were distributed across the target area TA, as highlighted in Figure 7. The distance between gauges was 25 mm along the X-axis and 50 mm along Z-axis, as this was found to be sufficient to pick up the essence of the variation of the specific impulse on the wall. The cylindrical obstacle was as tall as the domain to eliminate diffraction from the top, and to ensure that the diffraction occurs only along the curved surface of the cylinder.
The numerical solution was completed in two stages. First, a 1D stage with a fine mesh to ensure proper initiation of detonation and accurate wave tracking until the blast wave approaches the obstacle. This was then remapped to a 3D model. The cell size was 6.25 mm for all datasets.
Results and Discussion
The influence of wave interference on the ground
In this section, a description of the flow on the ground, downstream of the cylinder is presented. A contour plot of the pressure and impulse ratios (equation (4)) on the ground, downstream of these cylinders has been shown in Figures 8 and 9. The spatial co-ordinates for these plots were normalized using the cylinder diameter. A contour plot of the Apollo simulation results showing peak overpressure ratio in the downstream region of a cylindrical obstacle. The origin of the plot is the farthest downstream point on the cylinder. The simulation parameters for these plots were(a): Z
do
= 1.04 m/kg1/3, M = 3.5, D = 12 cm, (b): Z
do
= 1.04 m/kg1/3, M = 3.5, D = 24 cm, (c): Z
do
= 0.44 m/kg1/3, M = 7.3, D = 12 cm and (d): Z
do
= 0.44 m/kg1/3, M = 7.3, D = 24 cm. A contour plot of the Apollo simulation results showing peak specific impulse ratio in the downstream region of a cylindrical obstacle. The simulation parameters were(a): Z
do
= 1.04 m/kg1/3, M = 3.5, D = 12 cm, (b): Z
do
= 1.04 m/kg1/3, M = 3.5, D= 24 cm, (c): Z
do
= 0.44 m/kg1/3, M = 7.3, D= 12 cm and (d): Z
do
= 0.44 m/kg1/3, M = 7.3, D = 24 cm.
From Figure 8, one may gather that the evolution of the pressure field depends primarily on blast wave intensity measured in terms of the Hopkinson scaled distance, or the Mach number. It is also influenced by the cylinder size which modifies a given pattern of the diffracted wave. The shock-shock path, also known as the triple point locus that is associated with the pressure rise (Hahn et al., 2021; Yang et al., 1987), is visible here and has been annotated in the figure. As is clear from the figure, this path separates the downstream flow field into distinct zones of amplification and mitigation. Another observation is that the wave interference region extends beyond 10D, which is consistent with the findings of Hahn et al. (2021).
Intense explosions, characterized by a higher Mach number and a faster shock speed, lead to a more complex wave interaction behind the cylinder as is evident from the contour plot of the impulse ratios in Figure 9. This serves to improve the mitigation ratio and extend the mitigation region behind the obstacle, as seen in Figures 9c and d. This improvement may be attributed to the enhanced vorticity generation at higher particle speeds, resulting in diminishing directional flow velocities. This reduces the kinetic energy, which in turn affects the dynamic pressure, resulting in a pressure amelioration overall. An increase in cylinder size can also extend the wave interference region, resulting in a reduction in specific impulse values over a wider region behind the cylinder.
A plot of the flow streamlines to help visualize vortices for these configurations has been given in Figure 10. The drastic differences in these flow paths reinforce the view that particle speeds play a significant role in determining the attenuation and the overall wave interaction pattern behind the obstacle. Contours of the streamlines showing the velocity magnitude for (a): Z
do
= 1.04 m/kg1/3, M = 3.5, D = 12 cm, (b): Z
do
= 1.04 m/kg1/3, M = 3.5, D = 24 cm, (c): Z
do
= 0.44 m/kg1/3, M = 7.3, D = 12 cm and (d): Z
do
= 0.44 m/kg1/3, M = 7.3, D = 24 cm.
The influence of wave interference on a reflective wall target
The interaction of a blast wave with an obstacle results in altered EEI ratios on the wall. These values are useful to identify the zones of mitigation and amplification, which are influenced by the shadowing and interference patterns of the flow-obstacle interaction. To present the results on the wall, since there were 106 different simulations, a scatter plot involving all the EEI ratios is first presented. The EEI ratios for all pertinent parameters including the cylinder diameter, the target distances, and the target length have first been collected and plotted as a function of obstacle scaled distance in Figure 11. From these plots, it appears that the effective mitigation mainly depends on obstacle scaled distance and cylinder size. Significant EEI reduction was obtained for near-field denotations with larger obstacle sizes. This reduction though, is highly reliant on the target distance behind the obstacle. For example, consider target distances d
t
less than a metre: for cylinder diameters of 12 cm, 16 cm, 20 cm and 24 cm, a no-mitigation limit (EEI = 1) is reached at obstacle scaled distances Z
do
=1 m/kg1/3, 1.5 m/kg1/3, 1.6 m/kg1/3 and 1.7 m/kg1/3, respectively. This means that for closer stand-off distances, a cylinder with larger diameter is required to achieve good attenuation by disrupting the flow-field downstream. So in addition to the others, the distance to target measure d
t
is a significant parameter as it regulates the wave detachment process (Christiansen and Bogosian 2012; Dey et al., 2020; Hahn et al., 2021). A scatter plot of energy-equivalent specific impulse ratio as a function of obstacle scaled distance Z
do
for cylinder diameters of 12, 16, 20 and 24 cm. These EEI ratios have been computed over target lengths of (a) 1 m, (b) 0.75 m, (c) 0.5 m and (d) 0.25 m.
To enable a closer look at the relationship amongst the variables d t , Z do , TL, and EEI, a representative scatter plot was then employed.
EEI data for 11 out of the 106 CFD runs were carefully selected to illustrate the interplay amongst these factors as shown in Figure 12. From this plot, the following may be gathered: • An increase in the target distance (height of dark shaded bar) can lead to reduced mitigation effectiveness, irrespective of the target length used to calculate EEI ratios • An inverse relationship exists between the target distance and mitigation, but this is linked to the obstacle scaled distance for all target lengths regardless of the cylinder radius. • For closer targets (d
t
< 0.4 m), the mitigation is localized over a small area just behind the pole (TL ∼ 0.25 m) and it becomes less-significant on considering a wider area. • Amplification can occur due to wave trapping, especially for the large cylinders placed close to the target. For instance, a 24 cm diameter cylinder for Z
do
= 2.05 m/kg1/3 and d
t
= 0.3 m reported EEI ratios of 1.03 and 1.04 for target lengths of 1 m and 0.25 m, respectively, due to wave trapping. • For near-field events (height of lighter bars), mitigation is high for 0.5 m A plot showing the effect of TL, d
t
and Z
do
on the energy-equivalent specific impulse ratios. To reduce the clutter, only data from 11 simulations were chosen to demonstrate the general trend.
To highlight a few observations not explicitly clear in Figure 12, an exponential curve fit of certain data points has been presented in Figure 13. The d
t
dependence was not explicitly considered while generating these fits. These fits were formulated using the most effective mitigation cases, regardless of the influence of target distance. The plots suggest that increased mitigation occurs when the obstacle is closer to the explosive i.e., closer obstacle scaled distance. This mitigation also increases with cylinder size, and with shrinking target area. The trends of most effective energy-equivalent specific impulse ratios for different cylinders, and for target lengths TL: (a) 1 m, (b) 0.75 m, (c) 0.50 m and (d) 0.25 m.
For narrow target lengths such as TL = 0.25 m, the effect of cylinder size on mitigation is inconsistent. For example, in Figure 13(d), with obstacle scaled distances varying from 0.3–1.1 m/kg1/3, the cylinders with diameter of 16 and 20 cm lead to higher attenuation than a pole with 24 cm diameter. This could be due to the complex combination of shadowing (attenuation) and interference (amplification) effects arising from the cylinder-wave interaction. The effect of such a disruption on the downstream reflective target is different across the width of the target. Some regions can be shadow zones, while others can be interference zones or even a mixture of both. A few areas can remain undisturbed as well, especially when the target is far enough for the wave to reform. Figures 14(a)–(d) illustrate this using peak specific impulse ratio (I
pole
/I
free
) plots on the reflective target wall (TL = 1 m) for 4 simulations. Pseudocolour plots of impulse ratio for Z
do
=0.825 m/kg1/3 and d
t
= 1.5 m on reflective target for different pole diameters: (a) 12 cm, (b) 16 cm, (c) 20 cm and (d) 24 cm.
The plots show that whilst mitigation is relatively low ( The overpressure and specific impulse traces at gauge 1 (shadowing region) and gauge 2 (interference region) for cylinders of different diameters.
Therefore, for improved attenuation and protection from blast threats, large sized obstacles are recommended for interrupting the incoming blast wave. All these findings make it quite clear that the wave disruption depends strongly on the incoming blast wave intensity, the obstacle size, the target distance and the width of the target. Inputs from these general mitigation trends were then used to develop a method to predict EEI mitigation on a target wall.
Prediction using artificial neural networks (ANNs)
The concept of artificial neural networks (ANNs)
Development of a fast-running tool to predict blast load mitigation (reduction in EEI) on a target wall behind a cylinder is one of the primary aims of this study. Having previously identified the parameters which influence the evolution of loading on a target wall, the next step is to use these findings to inform the design of an efficient and accurate engineering tool.
Artificial neural networks (ANNs) are a biologically motivated computer code, which operate in a manner similar to the way the human brain processes knowledge. ANNs gain their knowledge by identifying the patterns and relationships in input data and learn through understanding, not from a sequence programming. An ANN is constructed from multiple individual units, artificial neurons, with interconnected nodes connected with coefficients (weights and biases), and are arranged in layers. The behaviour of a neural network is governed by the transfer functions of its neurons, by the learning rule and by the network architecture. The weights are adjustable through optimisation algorithms such as gradient descent and thus, a neural network is an adaptation system. The weighted summation of inputs into a given node can, if the signal is deemed strong enough, activate that node, which then propagates that signal onwards through the network. Throughout training, the weights and biases of the interconnected nodes are optimised to minimise the prediction error until the network reaches the required level of precision. After the network is successfully trained and is deemed satisfactory through subsequent testing, new ‘unseen’ data can be input and the network can forecast its output.
Validation of the scaled factors
The hand-picked values of physical parameters that were used for Apollo simulations to verify the validity of the scaled parameters.
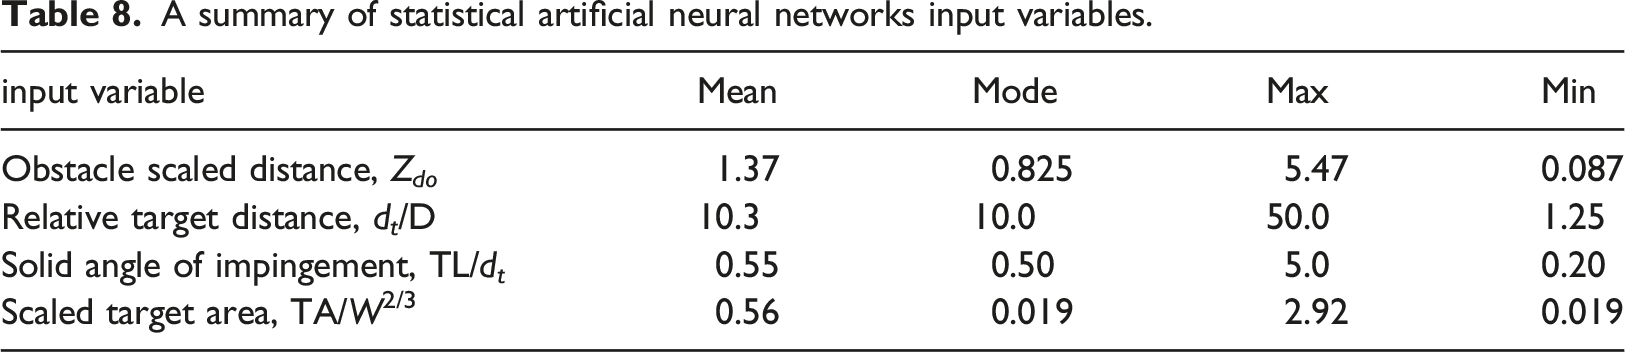
The relevance of each of these identified scaling parameters has been briefly described below: • Obstacle scaled distance, Z
do
: This plays an important role in the evolution of the diffraction pattern and it indicates the incident blast intensity, • Relative target distance to cylinder’s diameter, d
t
/D: This characterizes the wave detachment and relieving effect downstream of the obstacle, • Solid angle of impingement, TL/d
t
: This value has direct association to EEI calculation for different target lengths, and • Scaled target area, TA/W2/3: This compares the EEI of free-field scenarios to the obstructed scenarios.
For different combinations of these parameters, 530 data points were obtained using Apollo to train the ANN model. These EEI data were scaled using equation (4) and the ratios higher than 1 that signify intensification were excluded by replacing them with unity. This was done to isolate cases which do not have any mitigation potential.
Feedforward network architecture
The development of a feedforward neural network is described in this section. This network has one hidden layer of tan-sigmoid neurons, followed by an output layer of linear neurons. The use of several layers of neurons with a non-linear activation function permits the network to learn both linear and non-linear relations between predictors and target vectors. A schematic drawing of the functional approximation of ANNs is provided in Figure 16. The input layer is connected to a single hidden layer, typically known as a shallow neural network. A chart showing the artificial neural network architecture (a): the layout and (b): the layer processes.
Before training, the input parameters were pre-processed to constrain the values within [-1 1] (often termed ‘min-max scaling’) using MATLAB’s inbuilt function premnmx. This function was also used to scale the target EEI values, which were then stored in matrix p1. Weights and biases were automatically initialized and stored in matrix W and vector b1. Upon initiating the network training, the weights multiplied by the normalized inputs are added to the bias values as depicted in Figure 16 and are transferred by a tan-sigmoid function (equivalent to tanh) to a vector a1. A similar process is repeated on a1 and this is then transferred by a linear function (purelin) to the scaled output vector a3. Converting this back to absolute values gives the (attenuation) output vector y. Thereafter, this function approximation (non-linear regression) is repeated by modifying the weights and biases of the network to minimize the network performance (mean square error, MSE). This minimization is carried out according to the gradient of the evolution of the output values in a process termed back-propagation, which entails performing computations backward across the network. The easiest execution of back-propagation learning updates the network weights and biases in the direction where the performance function falls most rapidly, that is, the negative of the gradient. An example of one such iteration may be written as
However, this simple form of back-propagation training algorithm, such as gradient descent, can be sluggish for functional problems and requires more computational effort and time. Therefore, the fastest training algorithm (Beale et al., 2010, p. 3-16), Levenberg-Marquardt (LM), has been adopted here as it can approach second-order speed without involving extensive computational effort.
Besides employing the LM algorithm for training the network, an automated regularization method using a Bayesian framework is implemented in a combination algorithm called ‘trainbr’, an inbuilt MATLAB code which can effectively eliminate outliers and sift through noisy data without overfitting. This also eliminates the lengthy cross-validation step that would require the use of a larger training dataset. For further details, the Bayesian regularization method, the interested reader may refer to the work of Burden and Winkler (2008). Details on using Bayesian regularization along with the Levenberg-Marquardt training procedure may be found in Foresee and Hagan (1997).
A summary of the parameters that were used for the Levenberg–Marquardt Bayesian regularization back-propagation training.
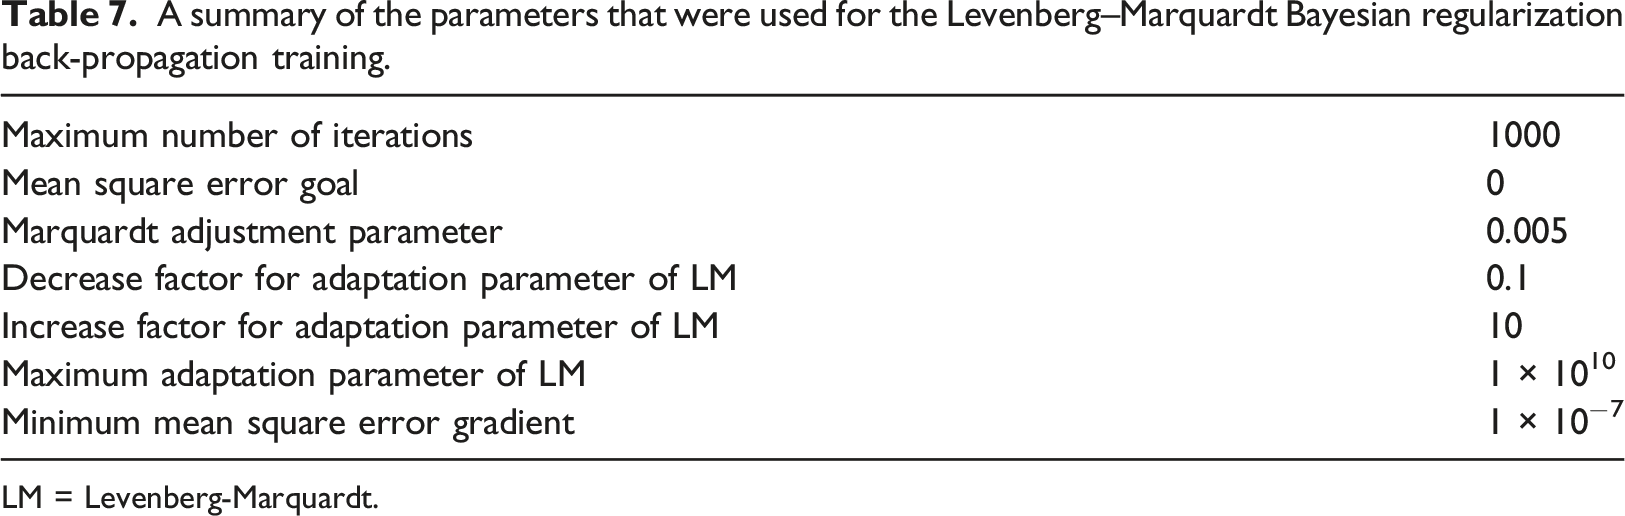
LM = Levenberg-Marquardt.
Database development
A summary of statistical artificial neural networks input variables.
Since the data points available for training and testing are relatively (Bewick et al. (2011) used 17,882 data points in their ANN model), an extensive development of a single-layer shallow network was undertaken. The number of neurons was varied from 1 to 150, and 85% of the complete dataset was used for training with the remaining 15% retained for testing. Performance evaluation was primarily assessed using Young’s correlation coefficient (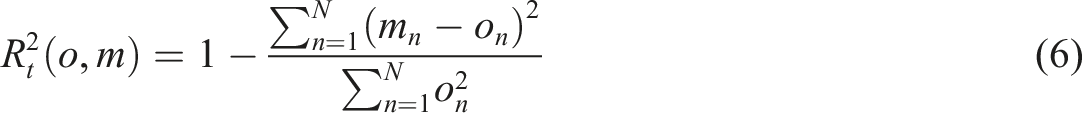
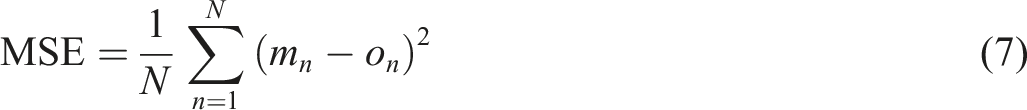
Figure 17 shows the mean square error and correlation coefficient as a function of the number of neurons. The training dataset converges quickly within 8 neurons. However, the MSE and R2 exhibits small fluctuations even up to 150 neurons, likely due to the random initiation of network properties (e.g. weights and biases). The average of these fluctuations for MSE and R2 for neurons ranging from 8 to 150 was 0.00049 and 0.9824 respectively. The best performance was obtained for 91 neurons, for which the MSE was 0.00029 (training) and 0.0004 (testing) and the R2 was 0.9899 (training) and 0.9853 (testing). Variation of performance metrics of the artificial neural network model as a function of the number of neurons: (a) mean square error and (b) correlation coefficient 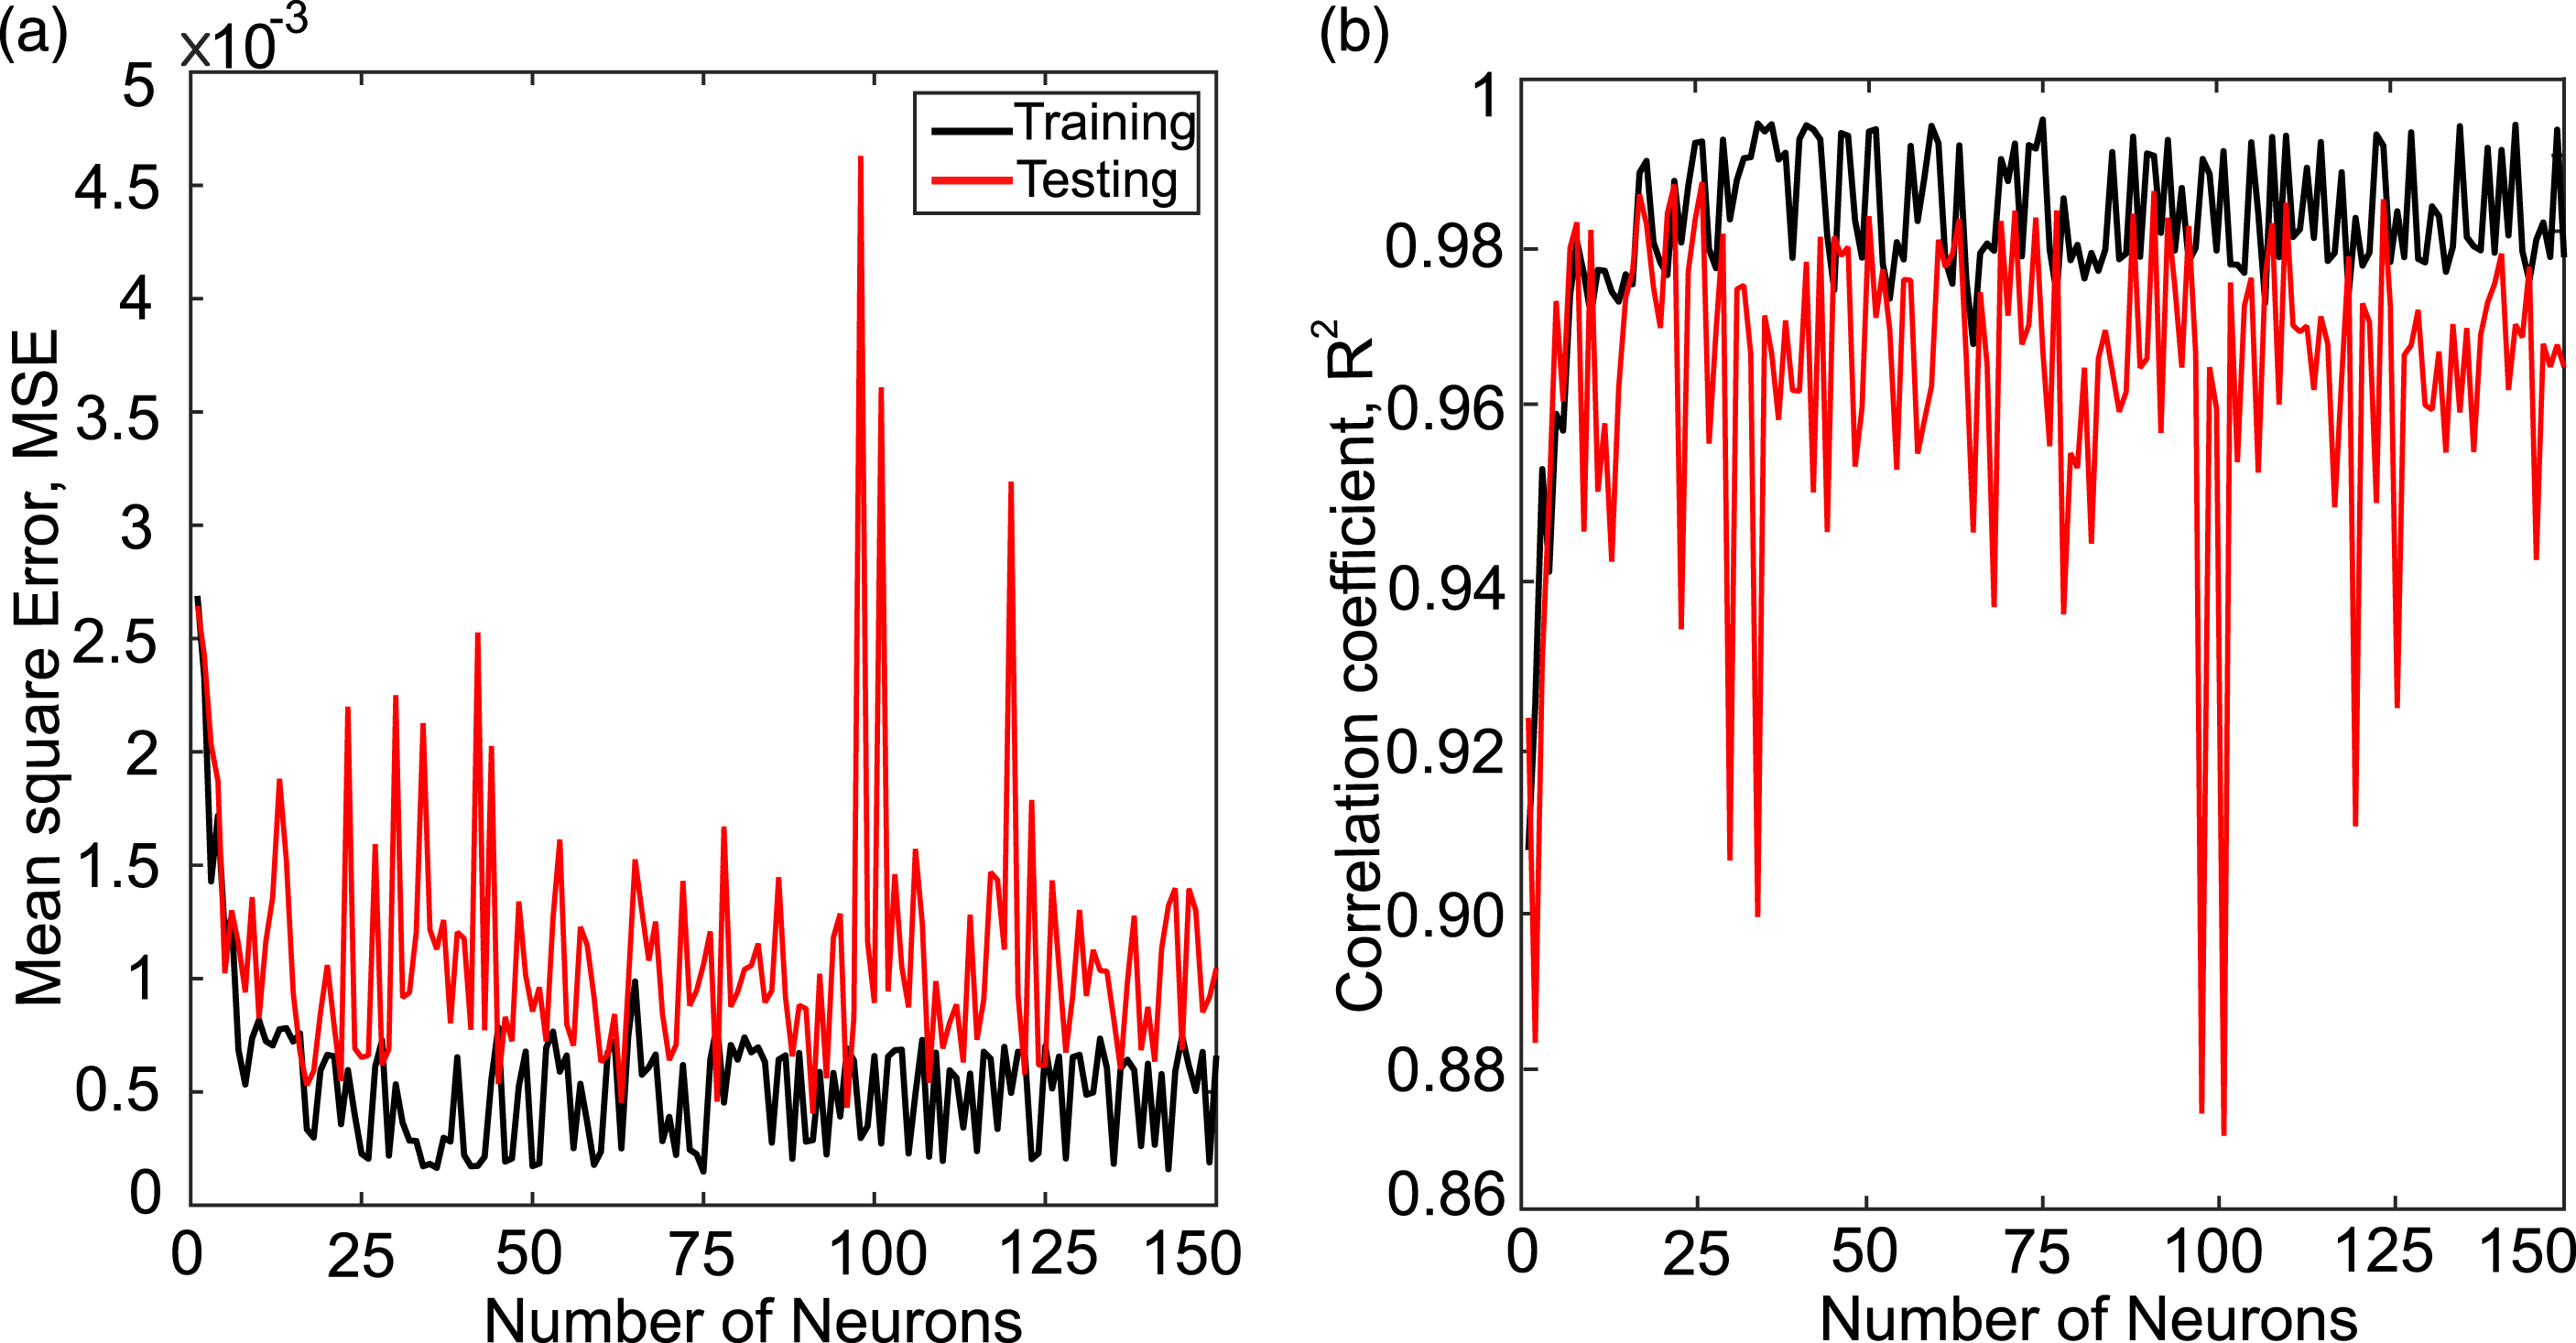
The final network design therefore contained 91 neurons in a single hidden layer along with the previously defined network architecture. For the maximum allowable 1000 iterations, the training returned an MSE of 0.000171 as shown in Figure 18(a). The calculated relative error of EEI outputs for the best MSE is plotted as a histogram in Figure 18(b). It is clear that the overall sample error close to zero, indicating the suitability of using the trained model for predicting new cases. A plot of monitors while training the artificial neural network model. (a) Evolution of mean square error with iteration and (b) a histogram chart of the relative output error.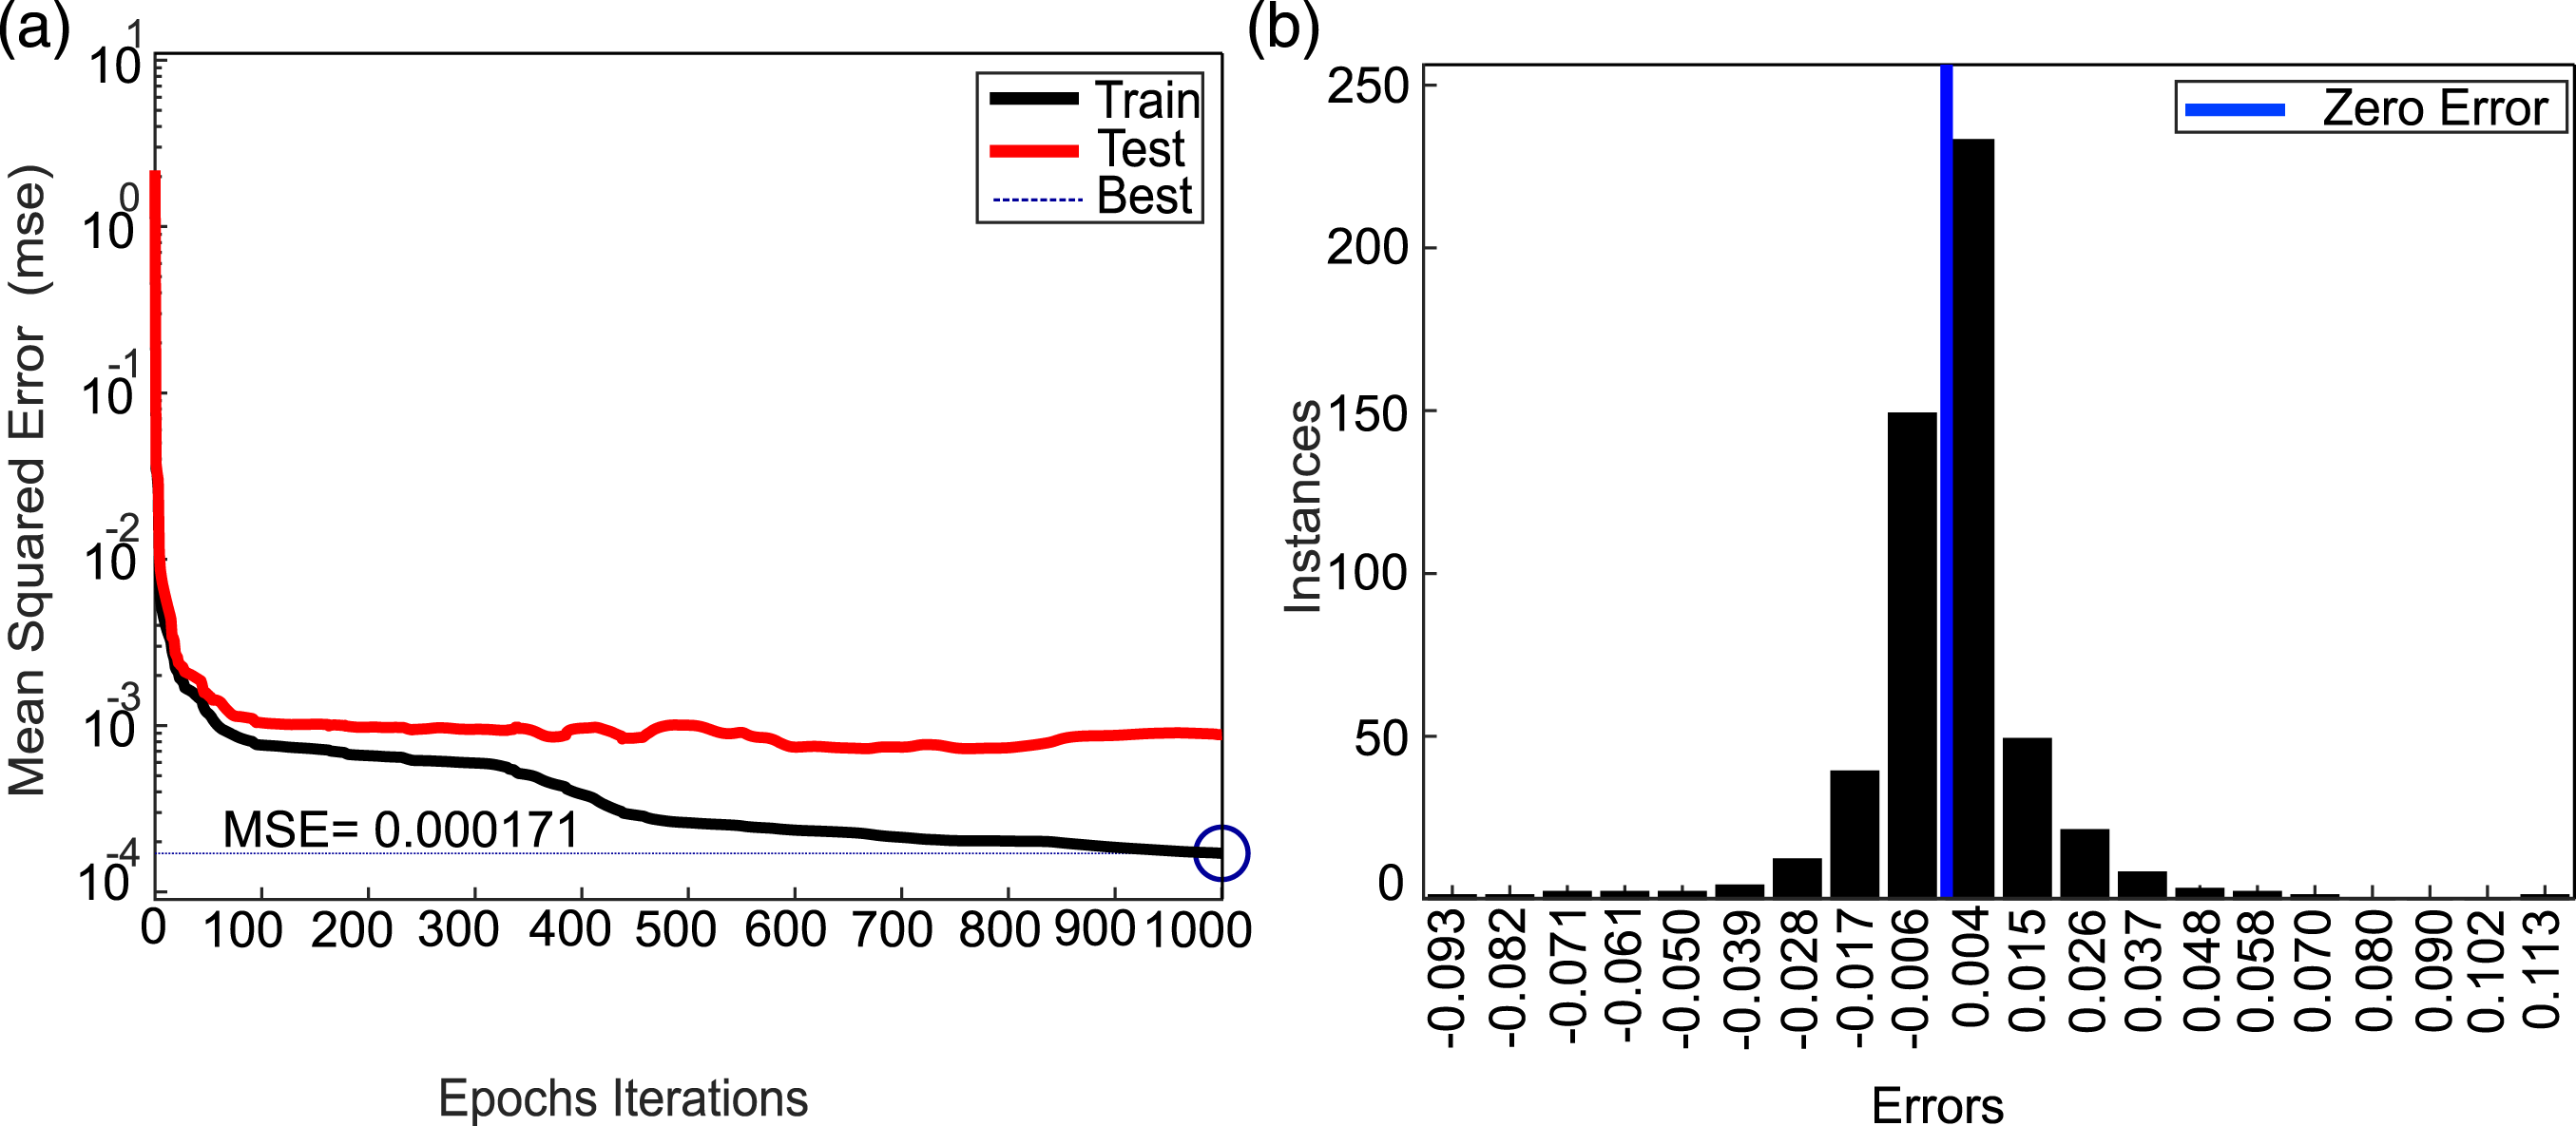
Figure 19 shows the correlation plots for training, testing, and the combined datasets, with the dashed line representing a perfect prediction. The correlation plot for the training dataset, Figure 19(a), shows an excellent Correlation plots for the artificial neural network training dataset (top left), the test dataset (top right), and all datasets (bottom).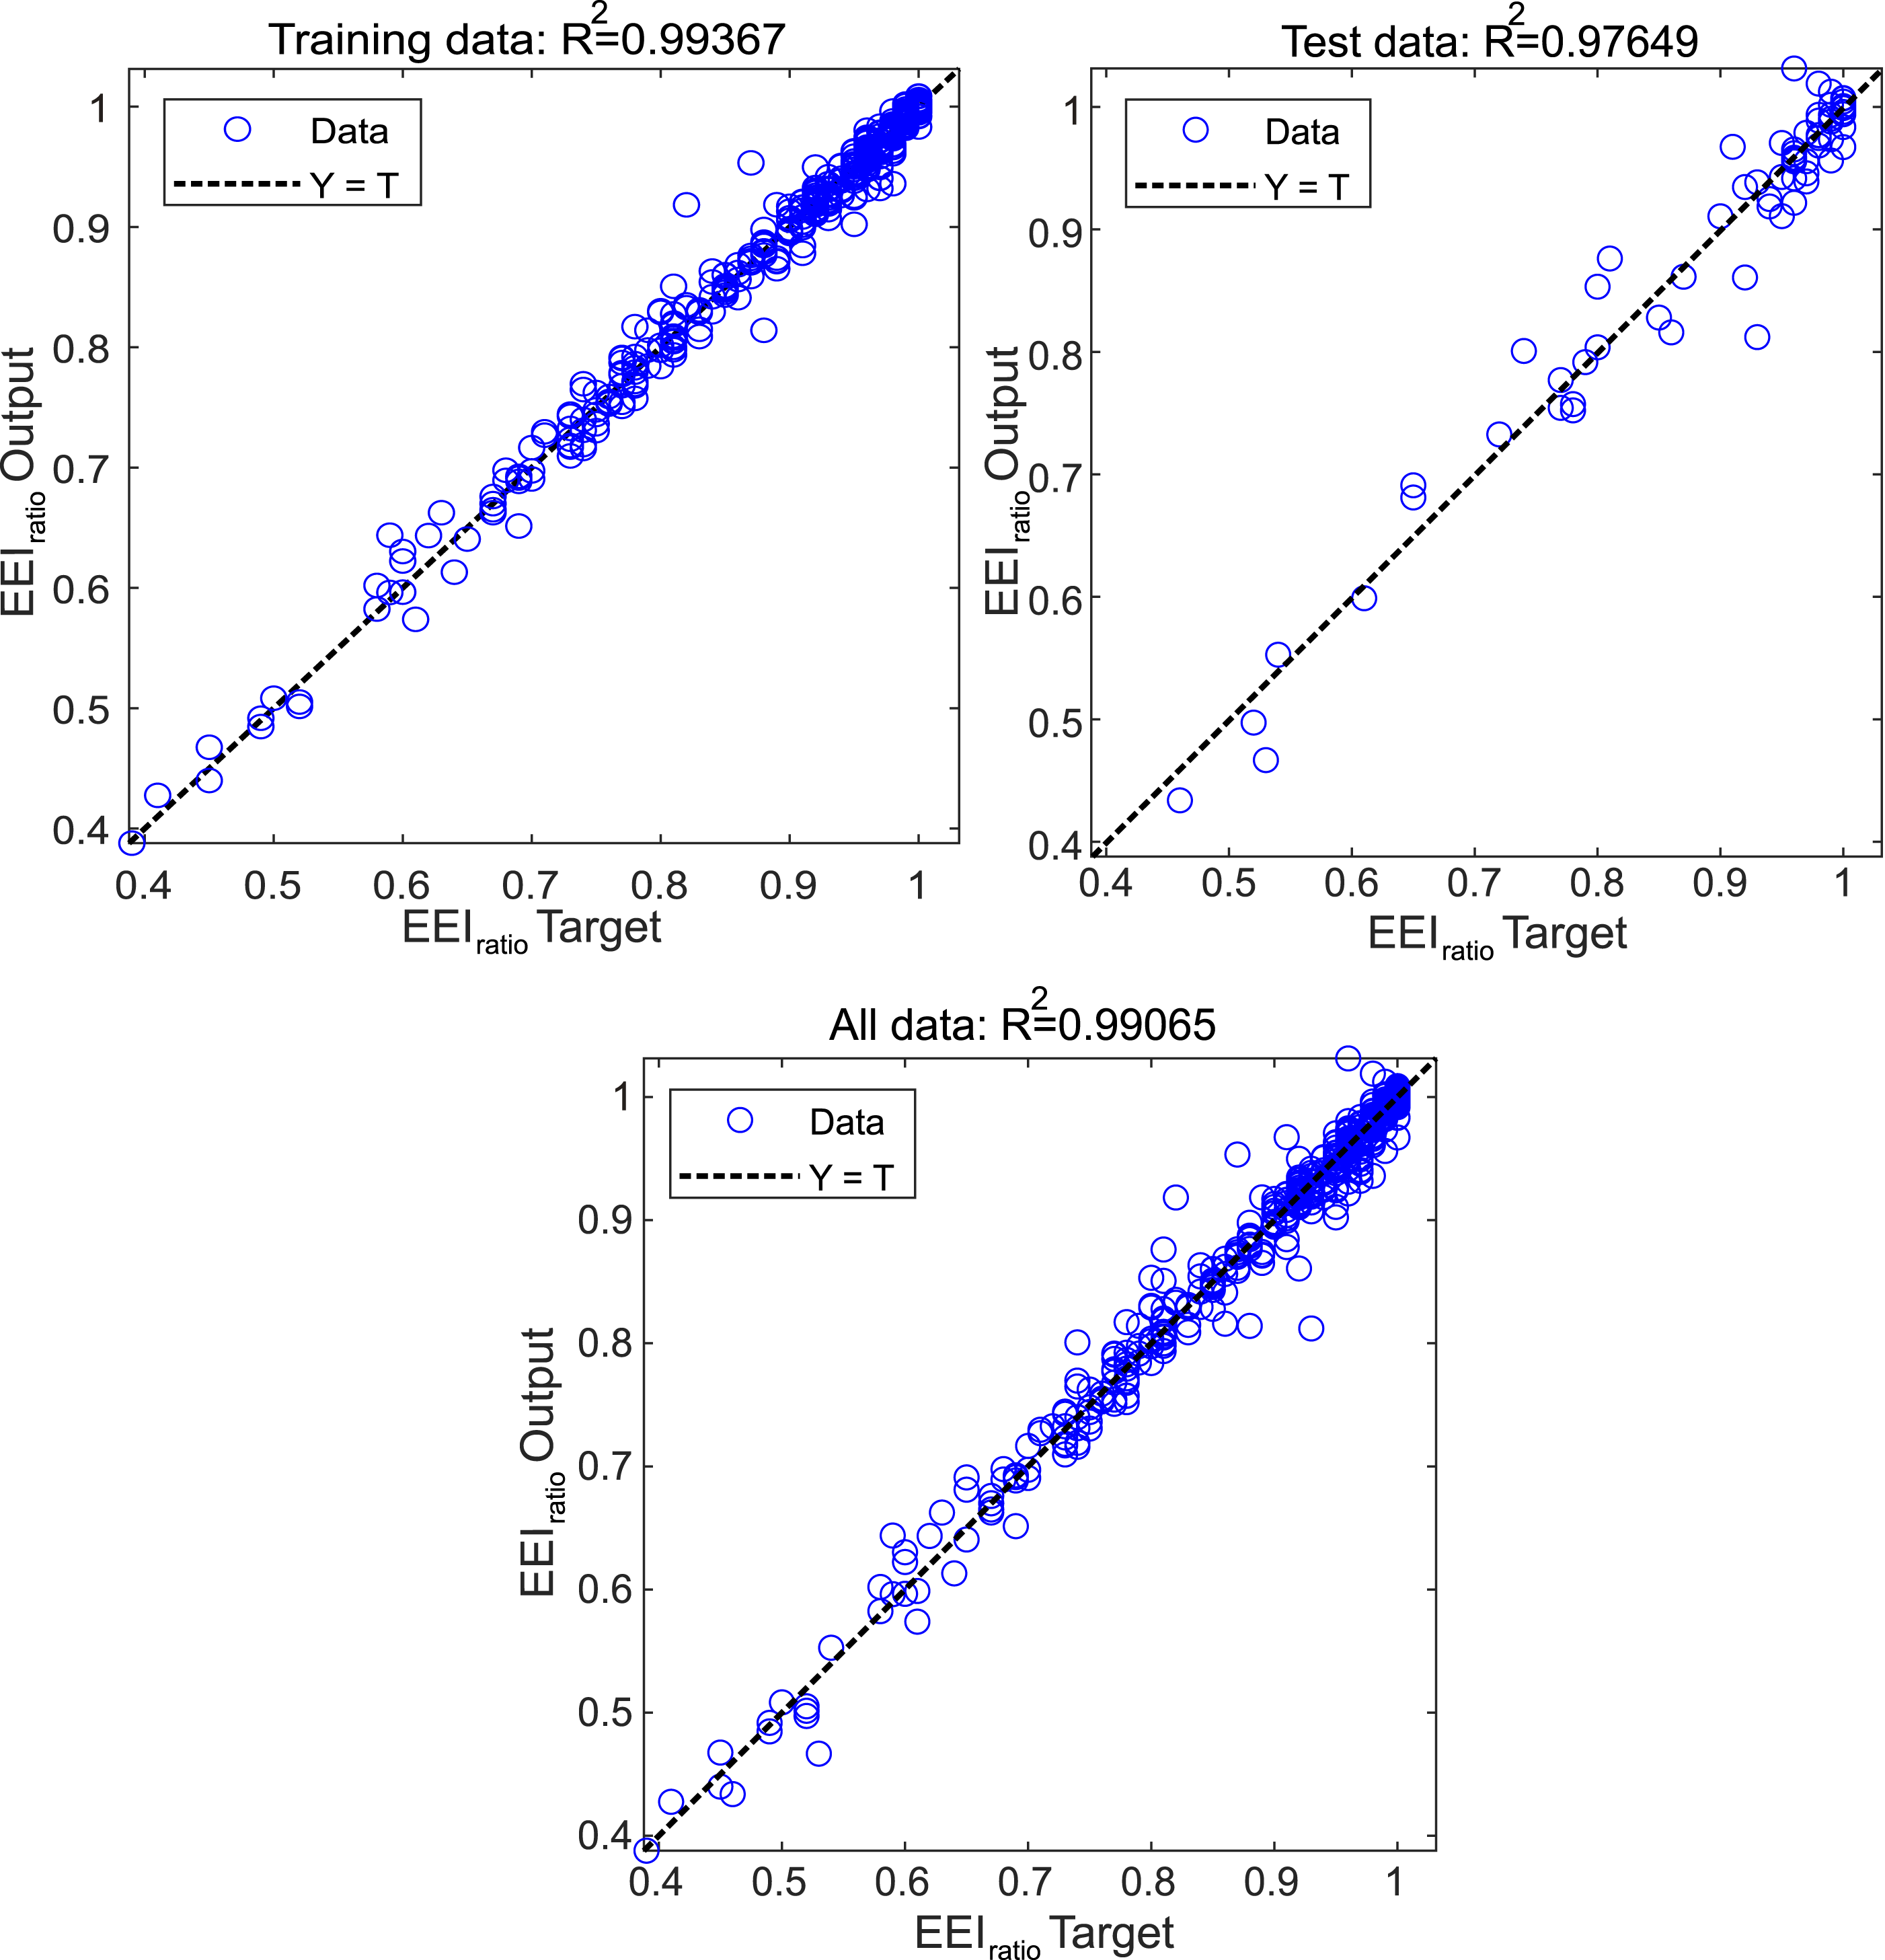
The distribution of the relative error of the predicted EEI ratios for each input parameter has been presented in Figure 20. The error falls mostly within the 5% limit and the trend for all input parameters is mostly similar (i.e. decreasing relative error with increasing input parameter), showing the successful generalization of this network model. Plots of relative error for artificial neural network outputs against each of the scaled input parameters.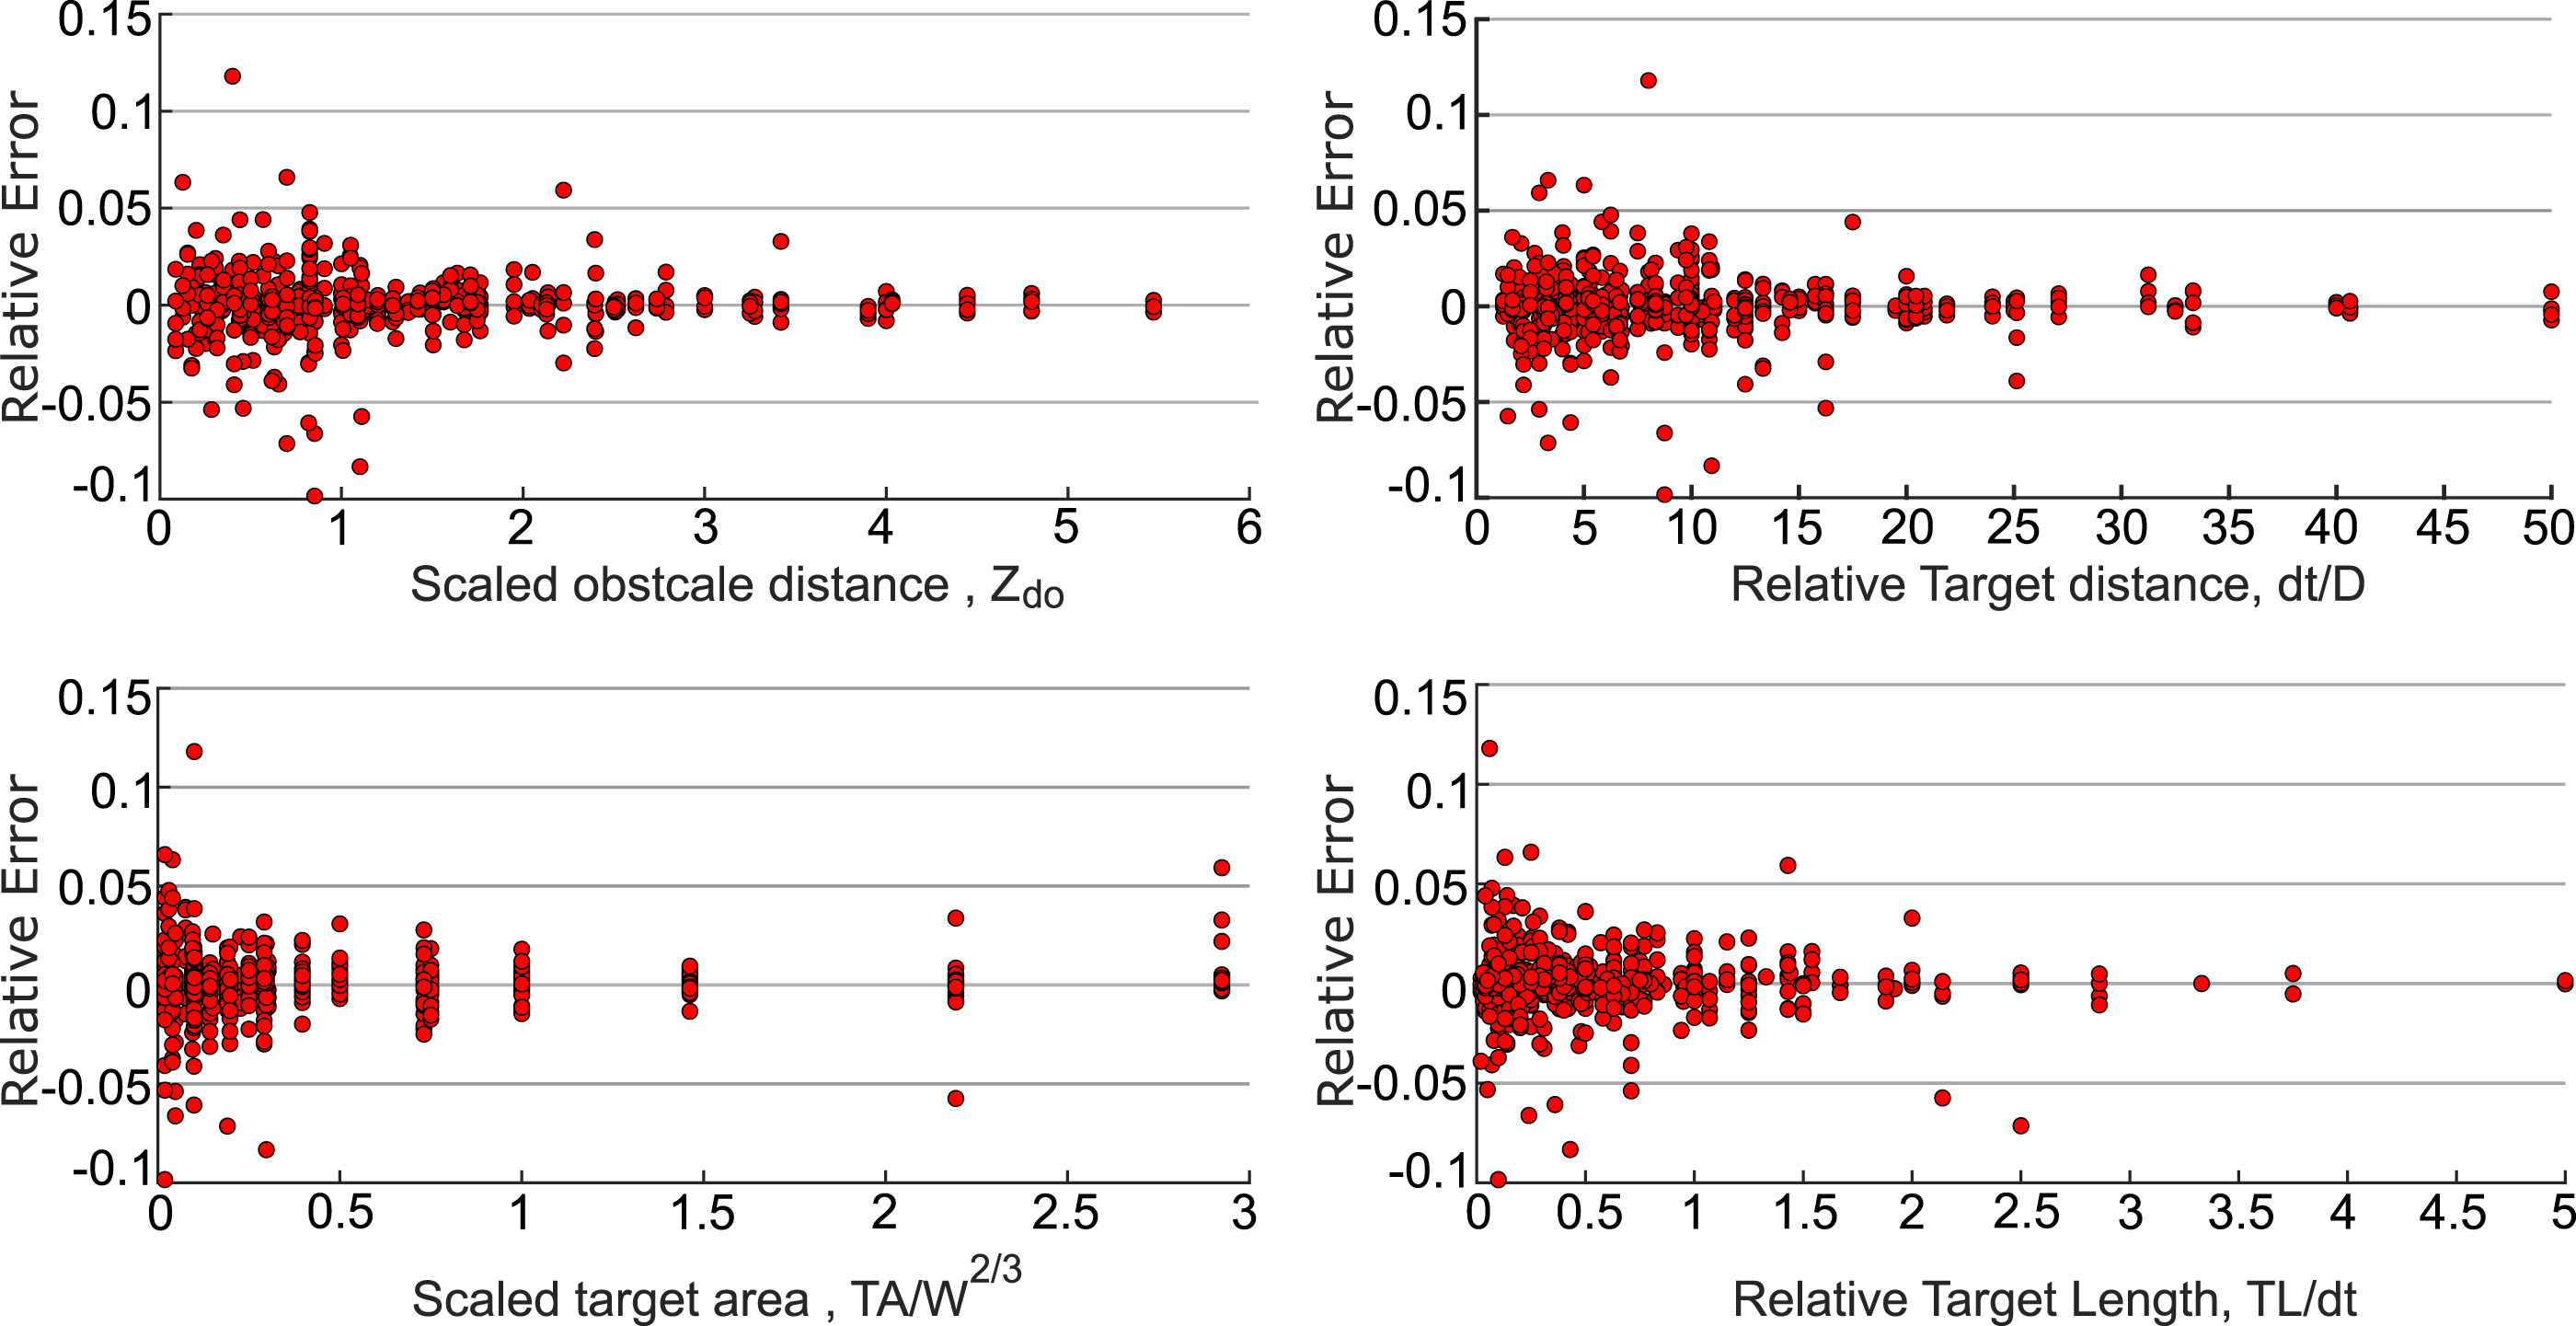
Testing the ANN predictive model against unseen data
A summary of the new input values to generate unseen data for the ANN model. The energy-equivalent specific impulse values from the Apollo simulations and the ANN model have been compared in terms of percentage differences. ANN = artificial neural network.
A plot showing the correlation coefficients for the output of the ANN model against CFD results. This is for data previously not seen by ANN. ANN = artificial neural network. CFD: Computational fluid dynamics.
The typical difference between Apollo and ANN output is less than 2% (only four out of the 20 results exceed this value), with no results exhibiting a difference of more than 6%. The correlation coefficient, R2, of the ANN predictions against this unseen dataset is 0.9925, indicating the robustness of the ANN model in capturing the mitigation potential of various blast-cylinder interaction scenarios.
Summary and conclusion
A numerical investigation of blast wave-cylindrical obstacle interaction was performed using a high-fidelity, physics-based CFD solver; Apollo Blastsimulator. The ability of this CFD software to model blast-structure interactions such as these was validated using reflected pressure data from the work of Tyas et al. (2011b). A qualitative validation of the diffraction phenomenon over the cylindrical surface was also carried out using numerical data from Yang et al. (1987) and experimental schlieren visualization from Bryson and Gross (1961).
The overall aim of this work was to understand and characterize the altered flow-field downstream of a cylinder loaded by a blast wave, due to wave interference. Results were interrogated over two planes, with consideration of the following parameters: • Ground plane downstream of obstacle: The blast wave intensity Z
do
and the obstacle size D • Target plane downstream of obstacle: The blast wave intensity Z
do
, the obstacle size D, the obstacle location ratio d0/R, and the target size TL.
Results from these characterisation studies were then used to develop a fast-running model – an artificial neural network (ANN) – to predict equivalent energy impulse (EEI) values on the wall. The input parameters for the ANN had been identified and scaled based on the findings from the characterisation studies.
Apollo was used to generate pressure and impulse values behind a cylinder for 6 ground plane simulations and 131 simulations for the reflective wall (106 obstacle cases and 25 reference cases). The simulations showed that the evolution of the pressure and impulse values due to wave interference are mainly dependent on obstacle size and blast wave intensity, according to Hopkinson scaled distance. Higher intensity blast waves (faster particle velocities) were found to introduce more disruption to the flow-field by generating a stronger vortex. This led to increased attenuation of the specific impulse values downstream.
The ratio of equivalent energy impulse (EEI) values on a reflective wall target was calculated and characterised in terms of the blast wave strength, the cylinder size, distance to the target and target length. It was found that a strong relationship exists between EEI mitigation, the blast wave strength (defined by obstacle scaled distance), and the cylinder size. Another factor influencing EEI mitigation is the reattachment/coalescing of waves behind the obstacle which was shown to be associated with target distance. A shorter target distance (
The general pattern of blast loading distribution on a reflective structural target wall could be such that the region can entirely lie in the shadowing region, or in the wave interference zone, or have a combination of both shadowing and wave interference regions. On such a wall, the peak impulse reduction ratio was found to be mild at the shadow zones (
Finally, an artificial neural network model (ANN) using Bayesian regularisation with a Levenberg-Marquardt (LM) training algorithm was developed to predict EEI mitigation. The following scaled parameters were used as input variables: Hopkinson scaled distance to the obstacle Z do , the ratio of distance to the target and diameter of the cylinder d t /D, the solid angle of impingement TL/d t , and scaled target area TA/W2/3. A total of 530 (106×5) data points were available for training the ANN. 85% of these values were used for training the model with the remainder used for testing. After optimizing the network model, 91 neurons were used in a single hidden layer. The results showed a very low variation with a mean square error of 0.000171 and a correlation coefficient R2 of 0.994 and 0.976 for the training and testing datasets, respectively.
The trained ANN model was then used to predict the results of previously unseen analyses, outside of the previous 530 CFD data points. The model exhibited excellent accuracy, with 80% of the predicted data points having less than 2% difference from the CFD results, with the remaining predictions all within 6% of the CFD data. Thus, it may be concluded that appropriate ANN models can be used to obtain the total load on a target wall downstream of a cylinder despite the complex wave interactions. Blast mitigation analyses for similar complex models can thus be reliably carried out using the proposed ANN model.
Footnotes
Declaration of conflicting interests
The author(s) declared no potential conflicts of interest with respect to the research, authorship, and/or publication of this article.
Funding
The author(s) disclosed receipt of the following financial support for the research, authorship, and/or publication of this article: University of Hail (40/4/23077) and Engineering and Physical Sciences Research Council (EP/S037241/1).