
Abstract
Blast loading scenarios and the corresponding hazards have to be evaluated for infrastructure elements and buildings especially at industrial sites for safety and security issues. Point fixed corrugated metal sheets are often applied as façade elements and can become a hazard for humans if they are pulled off.
This paper investigates the dynamic bearing capacity of such structural members in terms of their general bending behavior in the middle of the span and pull-out behaviors at the fixing points. The elements are fixed at two sides and the load transfer is uniaxial. An experimental series with static and dynamic tests forms the basis to identify the predominant failure modes and to quantify the maximum stress values that can be absorbed until the investigated structural members fail.
The experimental findings are applied to create and to optimize an engineering model for the fast and effective assessment of the structural response. The aim is the derivation of a validated model which is capable to predict the blast loading behavior of metal sheets including arbitrary dimensions, material properties, and screw connections. Results of this study can be integrated into a systematic risk and resilience management process to assess expected damage effects and the evaluation of robustness.
Keywords
Introduction
Effective and systematic risk management methodologies are essential to evaluate critical infrastructure elements or industrial plants (Assael and Kakosimus, 2010). To perceive a desired level of safety, it is essential to identify potential hazards and the resulting expected damage effects in case of event occurrence. The results will detect structural deficits for the existent loading behavior and can evaluate the effectiveness of potential enhancement measures.
Explosion events, like accidents on an industrial site or a terroristic attack, cause different hazard sources. Besides primary hazards, like the blast wave, secondary hazards like fragments can threaten exposed humans in the surrounding area. Many façade elements were designed with cold-formed corrugated metal sheets, especially on industrial sites. The unforeseen occurrence of an explosion inside a building has the potential that such elements can be pulled out and cause serious harm to exposed individuals.
Knowledge about the response of point fixed corrugated metal sheets subjected to dynamic loading is essential to assess the hazard potential. A sufficient safety level is given with certain position stability, meaning the plate is plastically damaged but still in place.
The general analysis of blast-loaded metal sheets is available within different publications. Application examples can be found within the design of containment rooms for package handling on airports or harbors (Crawford, 2006) or general analytical formulations (U S Army, 2008). The blast resistance of cold-formed steel components can be analyzed with the use of SDOF models (Crawford, 2006), but no detailed information is given concerning the modeling of the resistance behavior with assumed bending of the investigated structure. The response of sandwich panels composed of thin face skins and corrugated cores is investigated through an empirical study by varying the stand-off distance and material properties for close-in detonations (Zhang et al., 2015). The numerical and experimental investigation of four-sided clamped thin aluminum steel plates with the focus on tearing at the boundaries is published in (Aune et al., 2017). A variation of stiffener configurations for aluminum plates is compared and discussed in (Goel et al., 2015) but the information for point fixed plates is not considered. In U S Army, 2008, the explicit consideration of point fixing is also missing. Fatigue behavior of cold-formed metal panels with screwed connections, as applied on industrial buildings, is assessed in (Garcia-Palenciaa and Godoy, 2013) under wind loading. The experimental analysis investigates the influence of applied washers at the screw connections and identifies a metal plate pull-through as the predominant failure mode.
Numerical or experimental investigations are possible, but expensive in terms of costs and time, when the configuration or the hazard scenario changes. A generalized engineering model with a focus on the failure behavior of the screw connections is currently not fully described. The research in this paper focuses on the derivation of an engineering model to deliver fast and validated results concerning the resistance behavior of point fixed metal sheets subjected to blast loading, especially taking fixing conditions into account.
The investigated corrugated steel sheets are connected on a substructure with three screws at two sides each, forming a two-sided line bearing and a uniaxial load transfer. In a first step, the overall dynamic behavior of the structural member is analyzed with a series of shock tube tests to identify the governing failure mode. Afterward, static tensile tests are performed to quantify the maximum resistance of the bearing with varying loading angles.
The experimental results are used to derive a single degree of freedom model. This engineering approach allows the assessment of the structure behavior for arbitrary blast loading scenarios. A further formulation is derived and integrated to purpose a detailed design of the screw support.
Experimental investigations
General component characterization
The cold-formed corrugated metal sheet of type “Hoesch T40.1” (Kreuztal-Eichen, 2017) was used within the study which is made out of steel. The cross-section is shown in Figure 1 (a). For all fixings, the self-cutting screw “EJOT SAPHIR Bohrschraube JT2-12-5,5” was used, and Figure 1 (b) shows the dimensions. Cross-section and dimensions in (mm) of the investigated corrugated sheet “Hoesch T40.1” (Kreuztal-Eichen, 2017) (a) and the applied screw “EJOT SAPHIR Bohrschraube JT2-12-5,5” (EJOT Baubefestigungen GmbH, 2021) (b).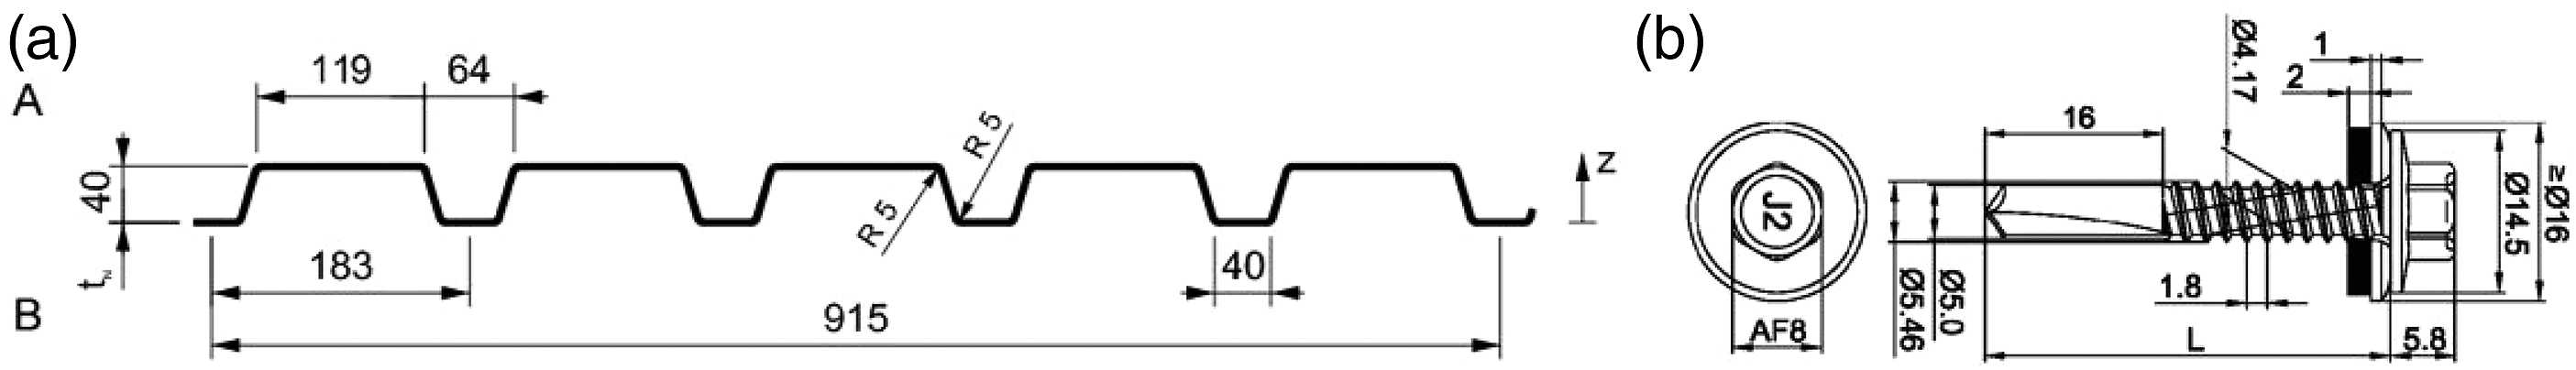
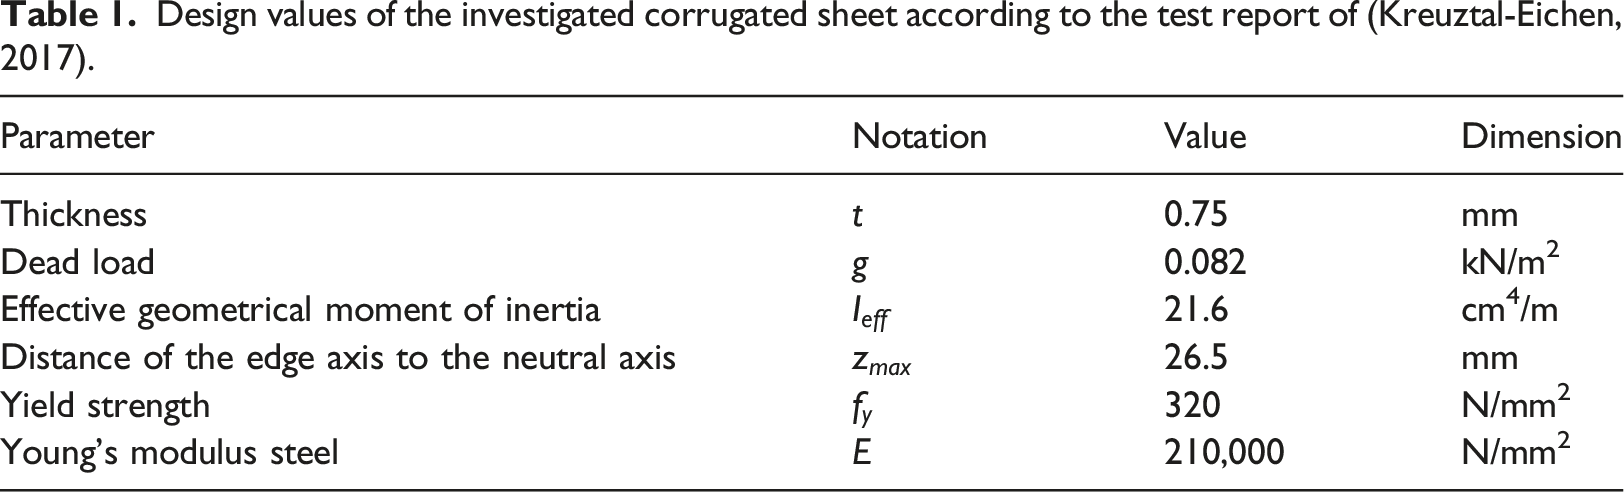
Design values of the investigated corrugated sheet according to the test report of (Kreuztal-Eichen, 2017).
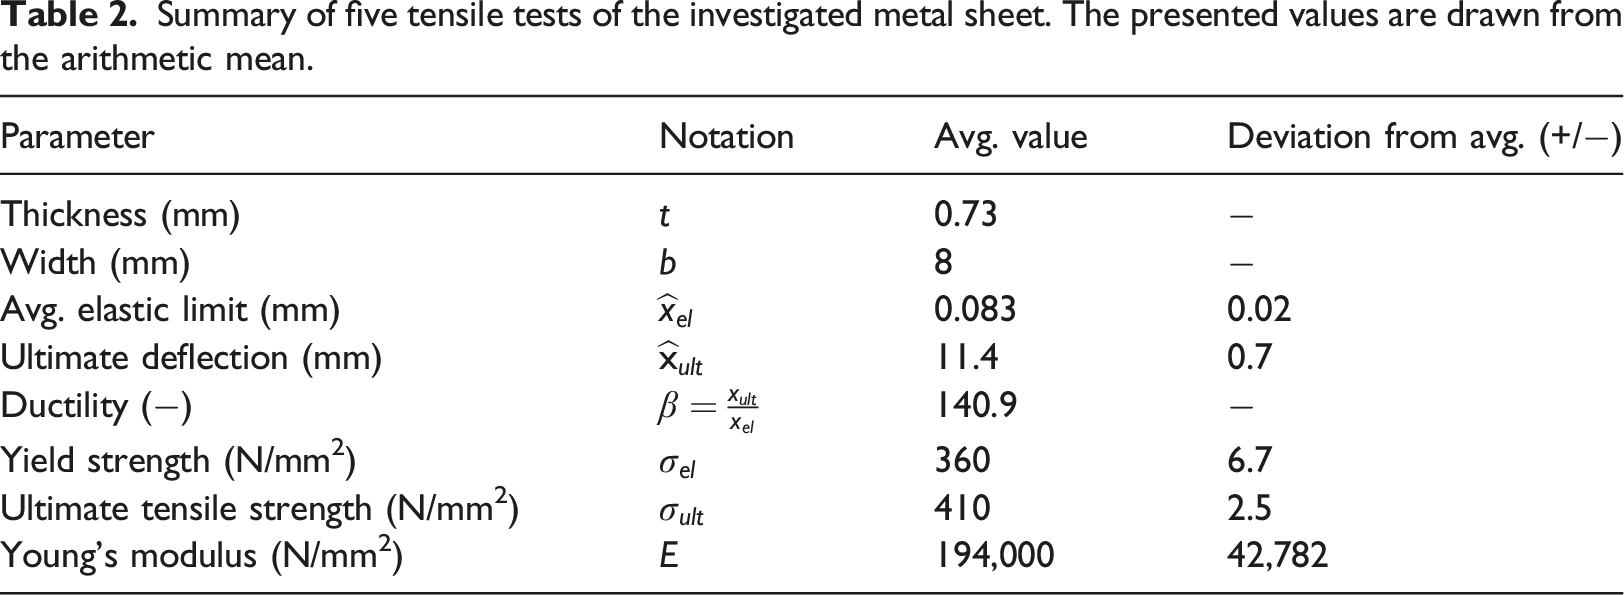
A tensile test series was performed to investigate the material properties of the applied metal sheet. Figure 2 (a) shows the setup of the tensile tests. The sample with a measured thickness of 0.73 mm and a width of 8 mm was drawn from the investigated metal sheets. Each sample was colored with a dappled pattern to observe the deformation during a test. In summary, five tests were performed. Figure 2 (b) shows in detail the elastic region of the force–displacement relation and Figure 2 (c) shows the complete stress–strain relation. The averaged derived material parameters are summarized in Table 2. The investigated material results in small values concerning the elastic limit, a larger potential concerning yielding and a relatively larger value for the ductility. The yield strength is 12% larger than the material properties from (Kreuztal-Eichen, 2017) in Table 1. The dashed black line in the left diagram of Figure 2 shows the averaged elastic behavior of the specimen and builds the basis to derive the Young’s modulus of the material. Setup of a tensile test (a) to derive the material behavior of the investigated structure. Resulting force–displacement relation from tensile tests, zoomed into the elastic region (b) and the engineering stress–strain relation (c). The black dashed line (b) shows the average elastic region. Summary of five tensile tests of the investigated metal sheet. The presented values are drawn from the arithmetic mean.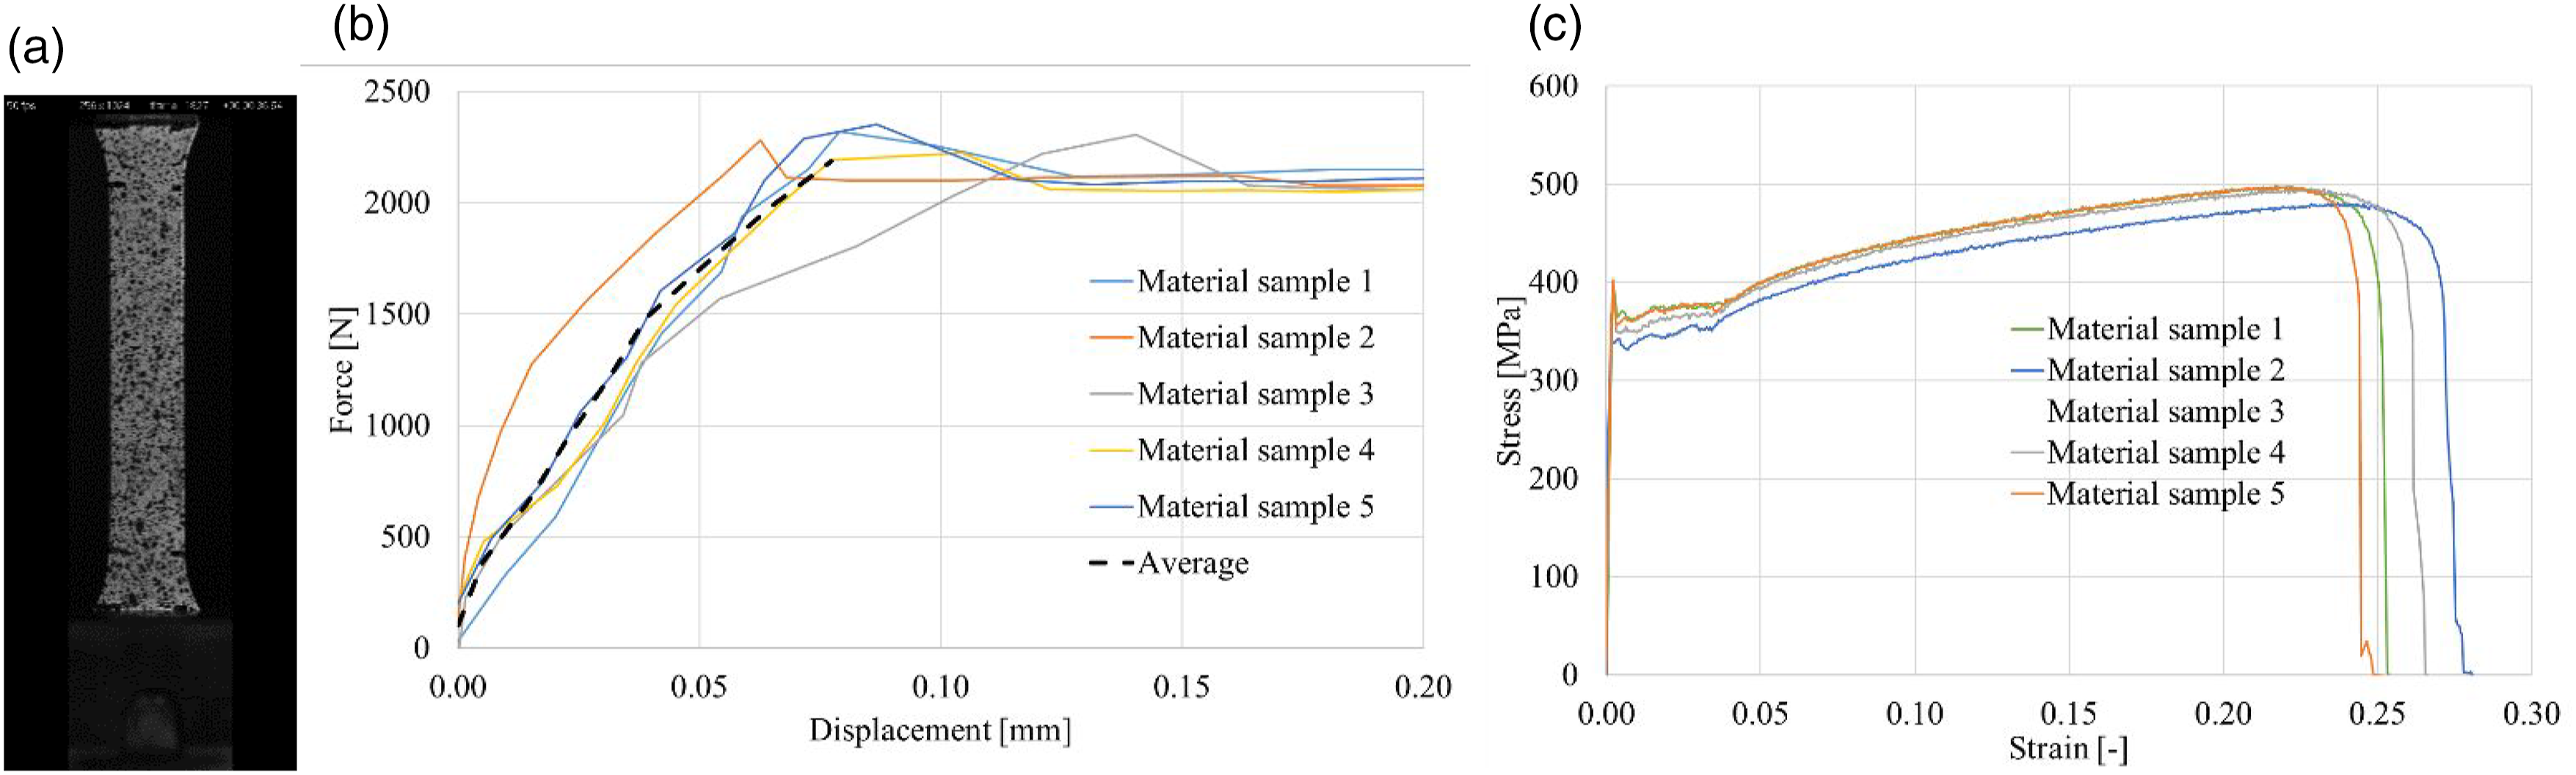
Besides the characterization of the material properties, the governing failure mechanism has to be known for the derivation of an engineering model. Theoretical preliminary considerations result in different failure mechanisms, illustrated in Figure 3: - Extraction of the screw connection (a); - Shearing of the screw connection (b); - Buttoning through of the metal sheet (c); - Extraction of the metal sheet (d); - Failure of the plate (e). Presumed failure mechanisms of structural element and fastening.
The first objective of the experimental investigation is the identification of typical failure mechanisms drawn from dynamic loading and the limit load-bearing capacity of the overall system including the support. The detailed analysis of the support provides information for the design of the screw connection.
Dynamic shock tube tests
The dynamic experimental investigation is performed at the Blast-Star (Blast Security Test and Research Facility) shock tube (Klomfass et al., 2012). This facility has been used to classify and scientifically investigate the response of structural components subjected to blast loading for many decades (Mayrhofer, 2002), (Kranzer, 2009), (Stolz et al., 2016) (Stolz et al., 2014).
The Blast-Star is a gas-driven shock tube with a two-chamber design, consisting of a high-pressure filling chamber and a low-pressure expansion chamber. In order to generate a blast wave, compressed air is filled into the pressure chamber, which is separated by a membrane from the expansion chamber. The volume and the filling pressure are variable. By using these parameters, blast waves with different characteristics concerning the peak pressure and the duration of the positive pressure phase can be generated. When the desired filling pressure is achieved, a mechanical device opens the membrane and the compressed air propagates within the expansion chamber. A plane shock front develops as the blast wave advances through the expansion part. At the end of the chamber, the specimen is mounted onto a support frame. The specimen can have maximum dimensions of 3 m x 3 m.
Nine shock tube tests are performed and are labeled with the numbers BS 324 to BS 332. A sketch of the experimental layout at the mounting frame is shown in Figure 4 (left). The metal sheet has a length L of 2.52 m and a width B of 0.96 m and is fixed at the upper and lower side onto a substructure. Three screws per side onto an edge steel fix the sheet. The edge steel is connected to a massive beam of the mounting frame with a weld. Experimental setup of the shock tube test: sketch with major dimensions (left); front view of the experimental setup. Here test BS 328 (right).
The screws are placed into the middle of a bead with a vertical edge distance of e = 20 mm and a space of d = 366 mm between two screws. A detailed view of the fixing at the lower support can be seen in Figure 5. In total, there are six beads in the cross-section. Two different configurations of the fixing are executed and its effect examined. With tests BS 324 to BS 329, the screws are fastened to the upper and lower support in a staggered manner so that each bead has a screwed connection on alternate sides as displayed in Figure 6 (left). Initial considerations suggest reduced robustness if the upper and lower screws fasten the corrugated sheet in a staggered manner. With tests BS 330 to BS 332, the same bead at the upper and lower side is used and can be seen in Figure 6 (right). The deflection of the sheet is measured in the middle of the panel by the use of a laser displacement gauge with a sampling rate of 7.5 kHz. Pressure gauges at the inner, respectively, loaded side of the mounting frame measure the reflected pressure of the generated blast wave. A high-speed camera is used to observe the specimen at the protected side. The measurement devices are marked in Figure 4 (right). The setup realized in the experiments represents a blast load which acts from the inside on the trapezoidal sheet. This would be the case for a hazardous reaction in a largely vented industrial hall. An additional argument for the chosen load direction is the possibility to investigate the pull-out behavior at the screw connections in full detail throughout the blast loading using high-speed cameras. Detail view of the fixing at the lower support. Comparison of two setups to investigate the influence of fixing positions: screws (red dots) in different beadings (left); screws in identical beads (right).
Overview of the investigated experimental loading levels including the reflected peak overpressure (pro) and the impulse (Imax), as well as the maximum deflection (xmax) and a description of the structural response.
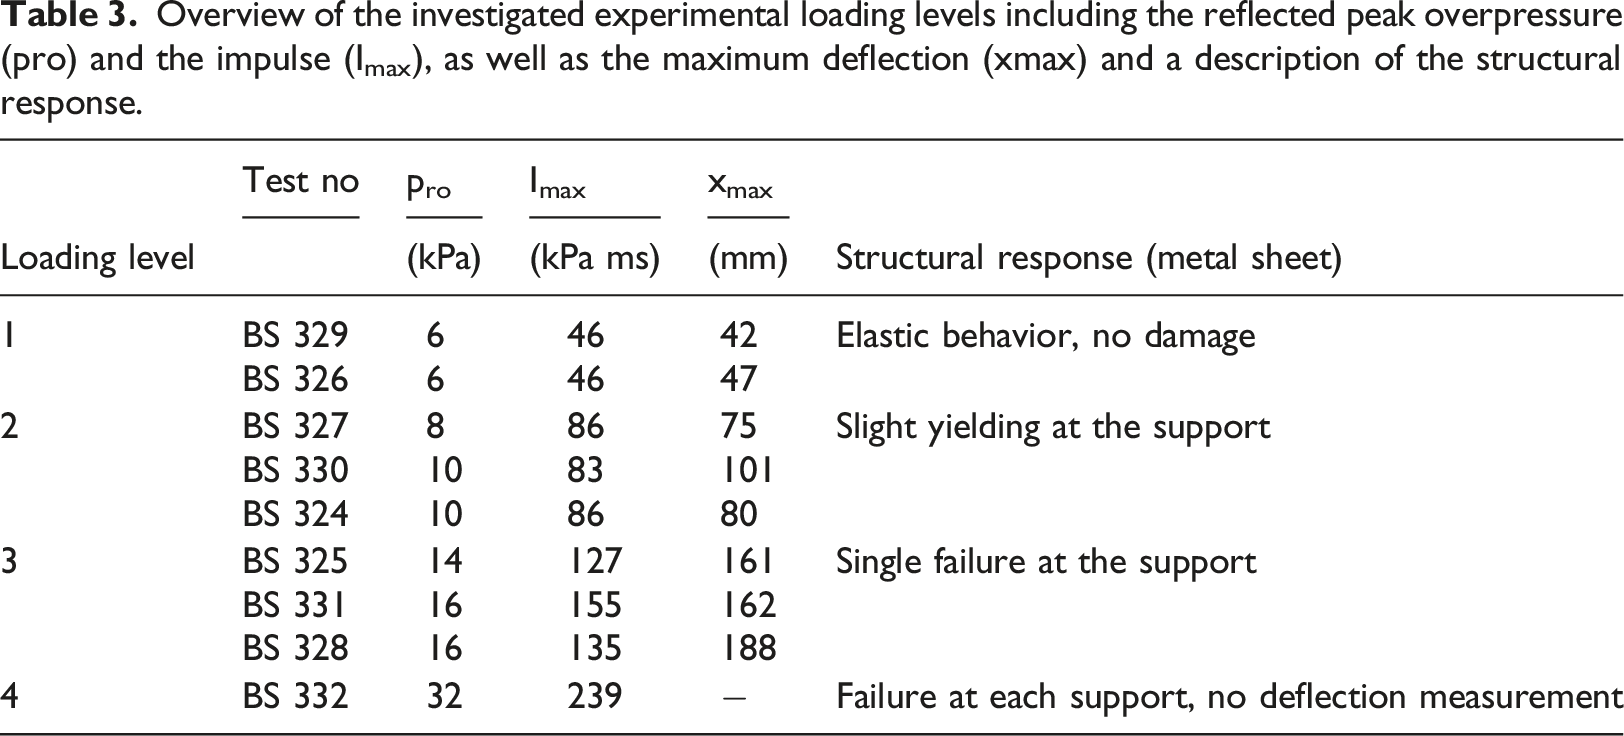
The investigated specimen shows elastic behavior without damage subjected to the first loading level. At the second loading level, the specimen shows permanent deformation after the test without a failure of the structure. Slight yielding is observed at the support and can be seen in Figure 7 (left). At loading level 3, the support fails at one side, see Figure 7 (right). At loading level 4, both supports fail and the specimen is ejected. Only one test (BS 332) is performed at this level. The torn specimen can be seen in Figure 8 (above). A detailed view of the support region is shown in Figure 8 (down). A series of images, taken with the high-speed camera, during test no. BS 332 at different time steps is shown in Figure 9. A strong deformation of the sheet is observable but the failure occurs at the fixing before a critical deformation is reached. Figure 10 shows pressure-time (left) and impulse-time (right) histories of the four applied loading levels. The duration of the positive pressure phase is nearly the same with 15 ms for all tests. The reflected pressure and the impulse are nearly equal for the blast waves in one loading level. Structural response after testing: slight yielding of the fixing with tests at loading level 2 (left); failure at the lower support with tests at loading level 3 (right). Structural response of test BS 332 with loading level 4: torn specimen (above); detailed view of the pull-out behavior at the fastening points (down). View at the protected side structural element of test BS 332 after the arrival of the blast load at different time steps (test BS 332). Measured pressure-time (left) and impulse-time (right) histories for the four applied loading levels from the shock tube tests.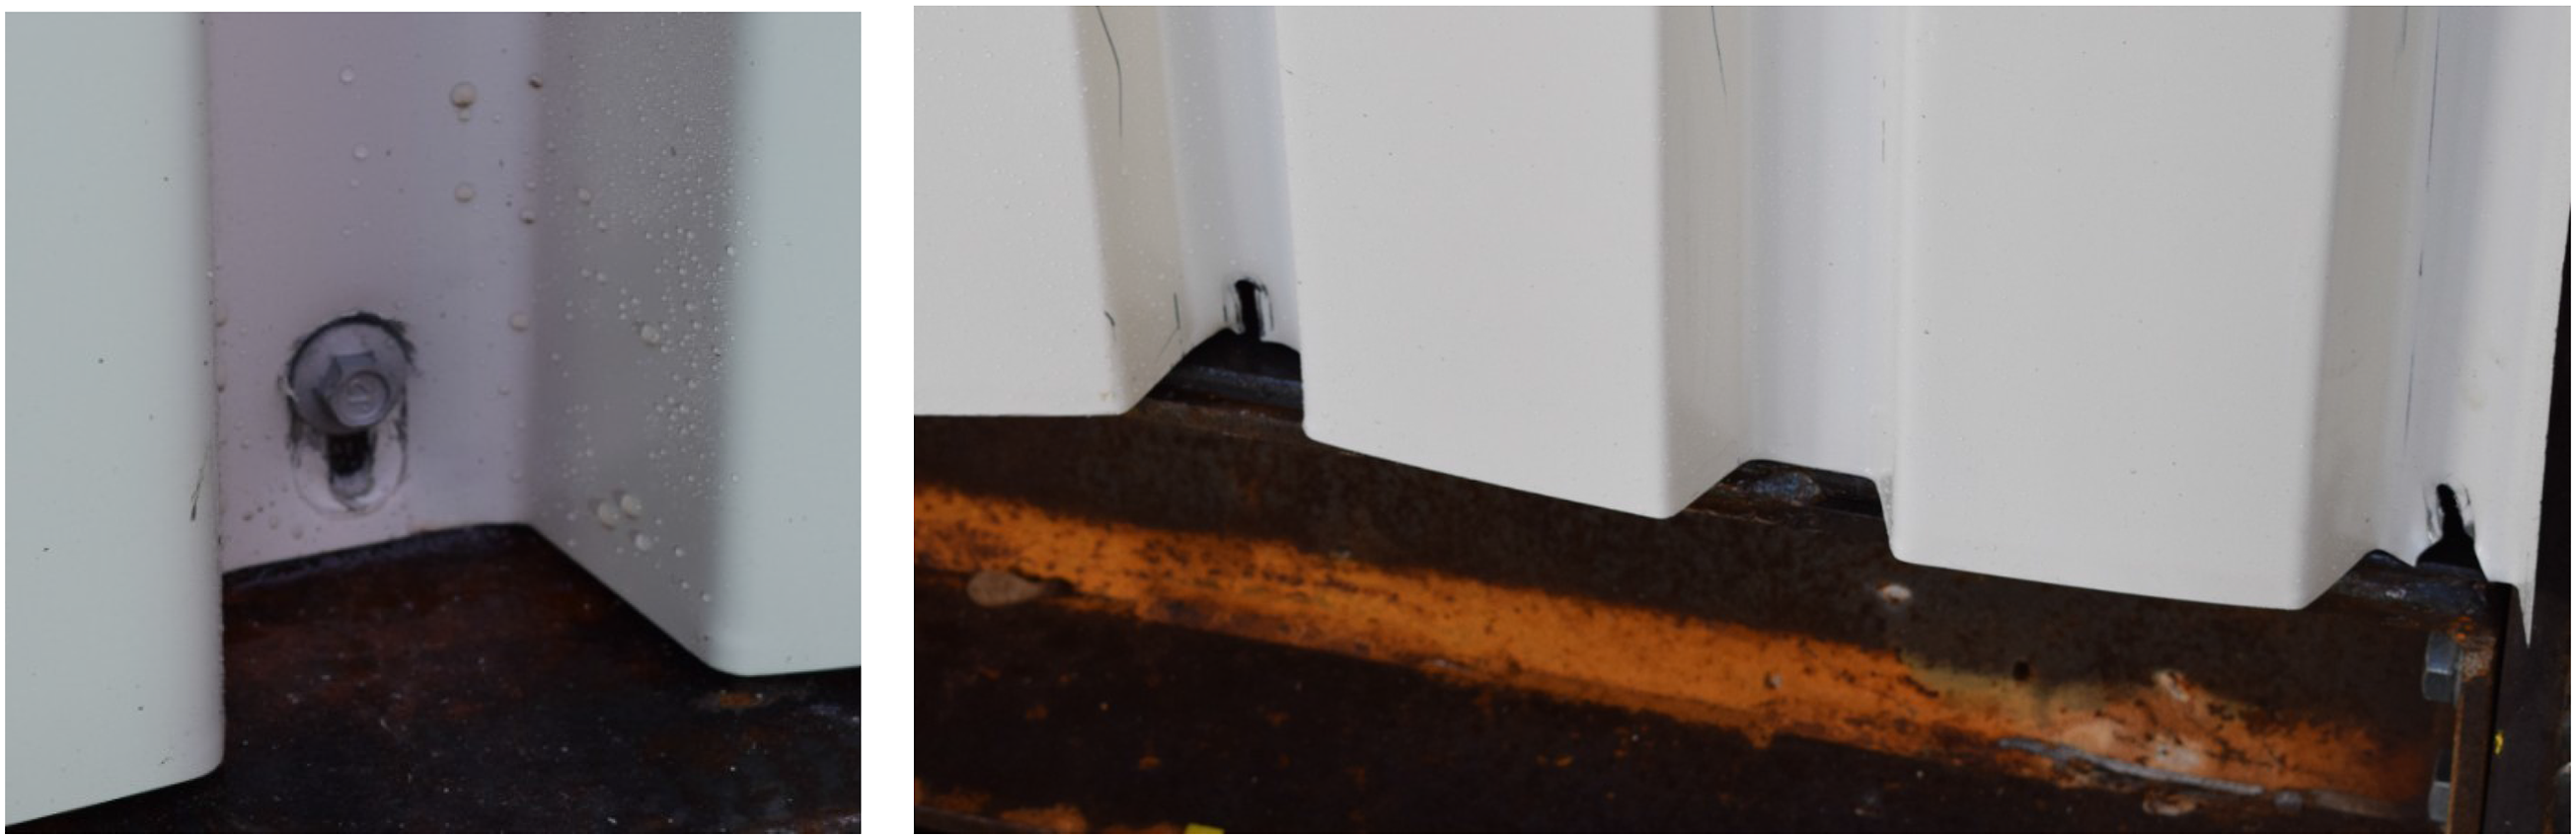
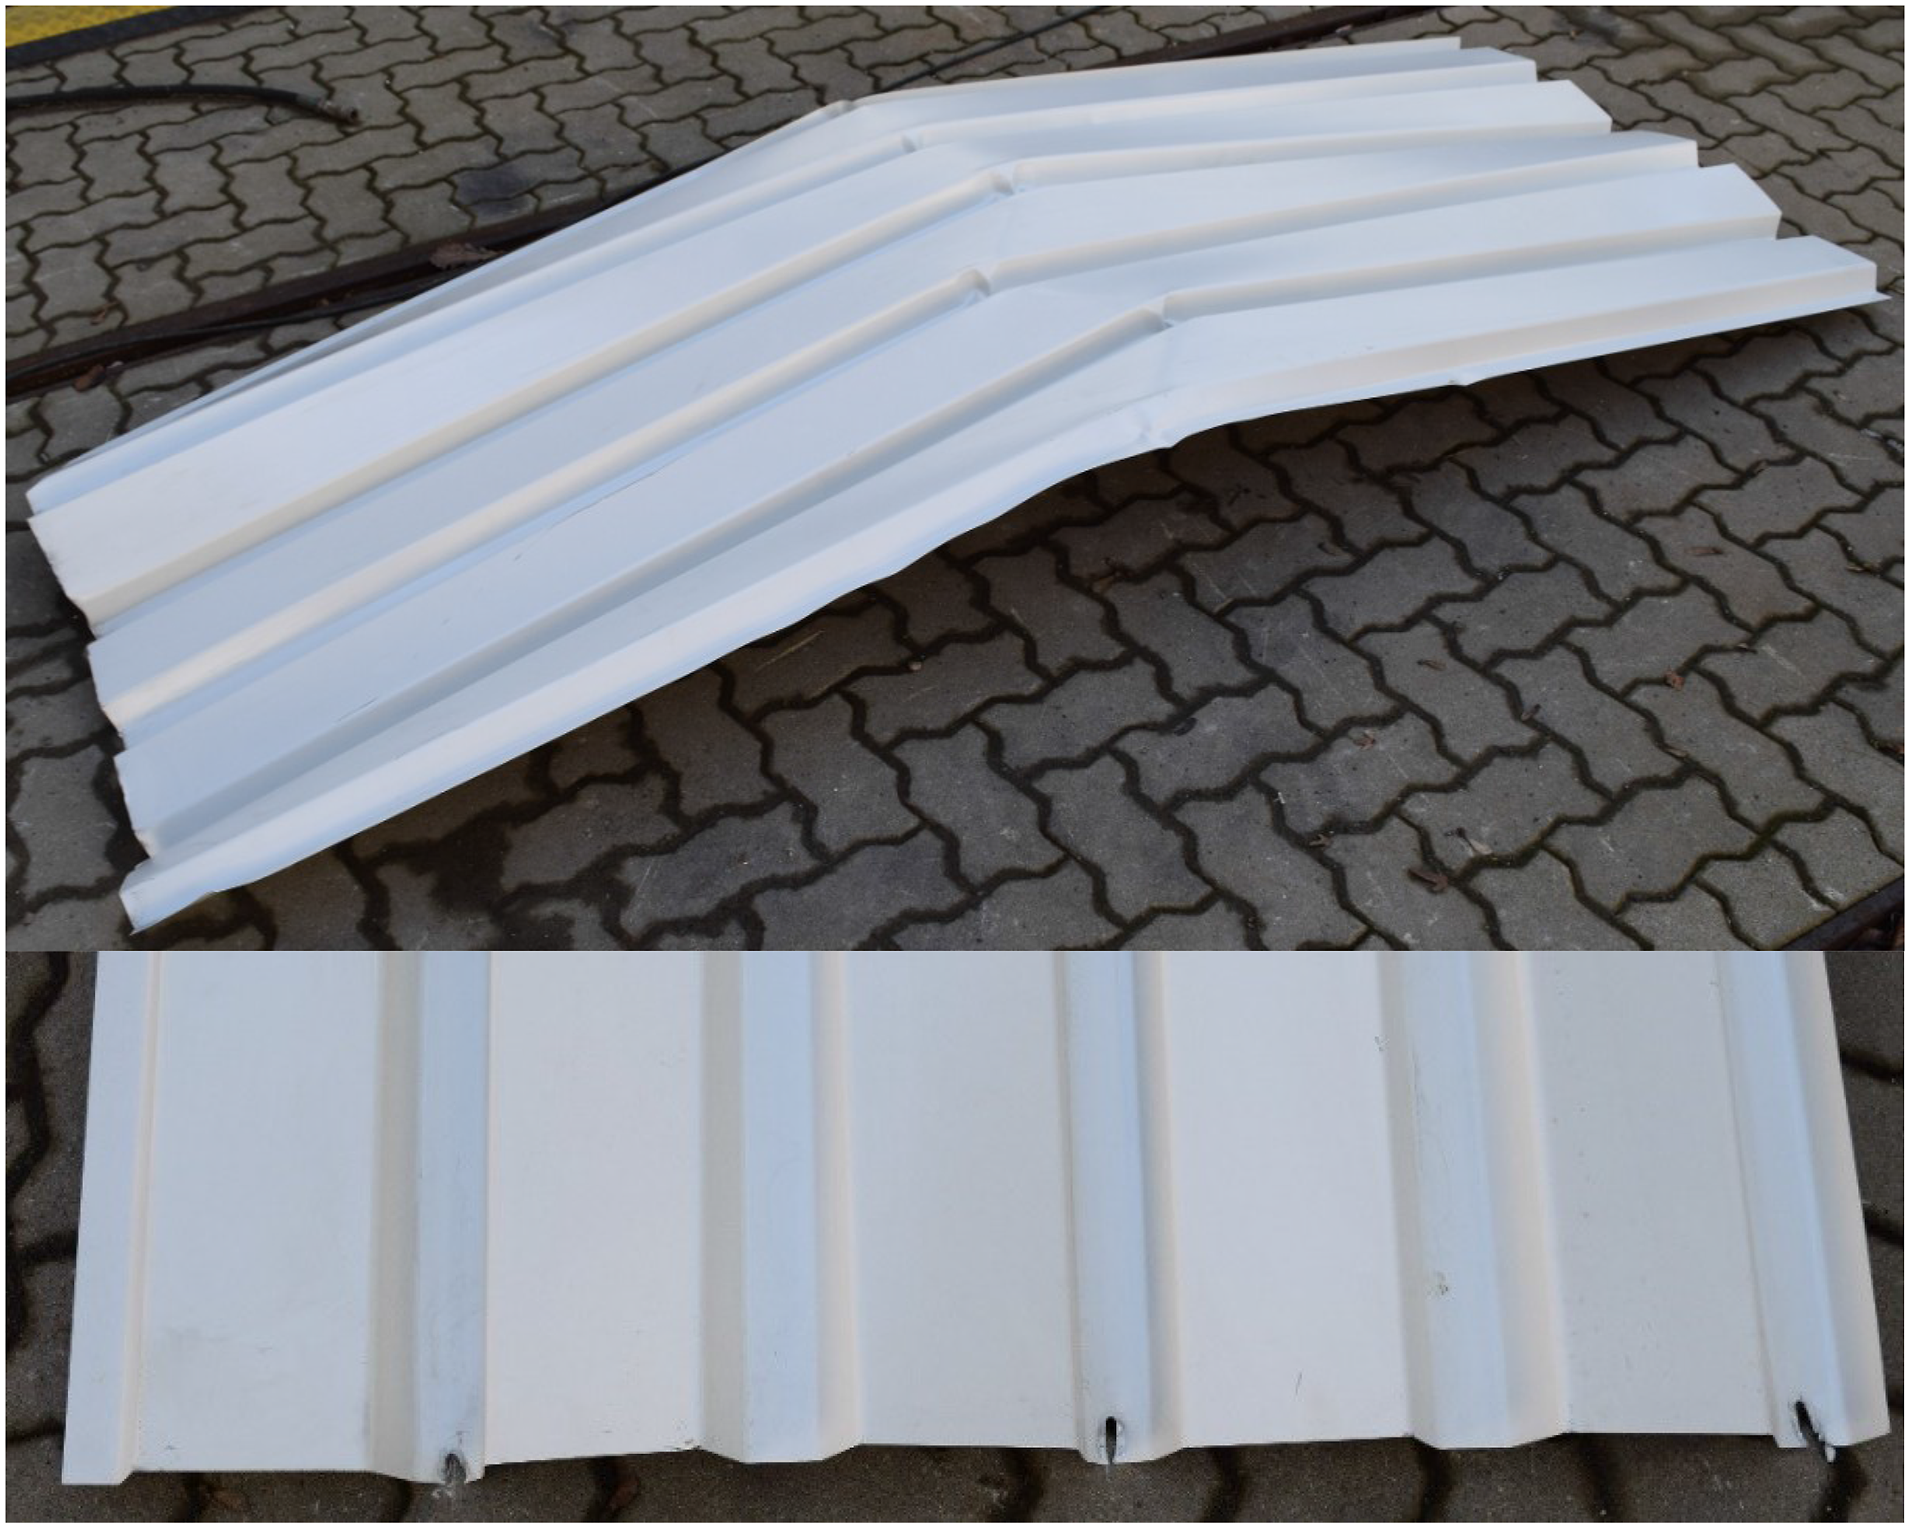
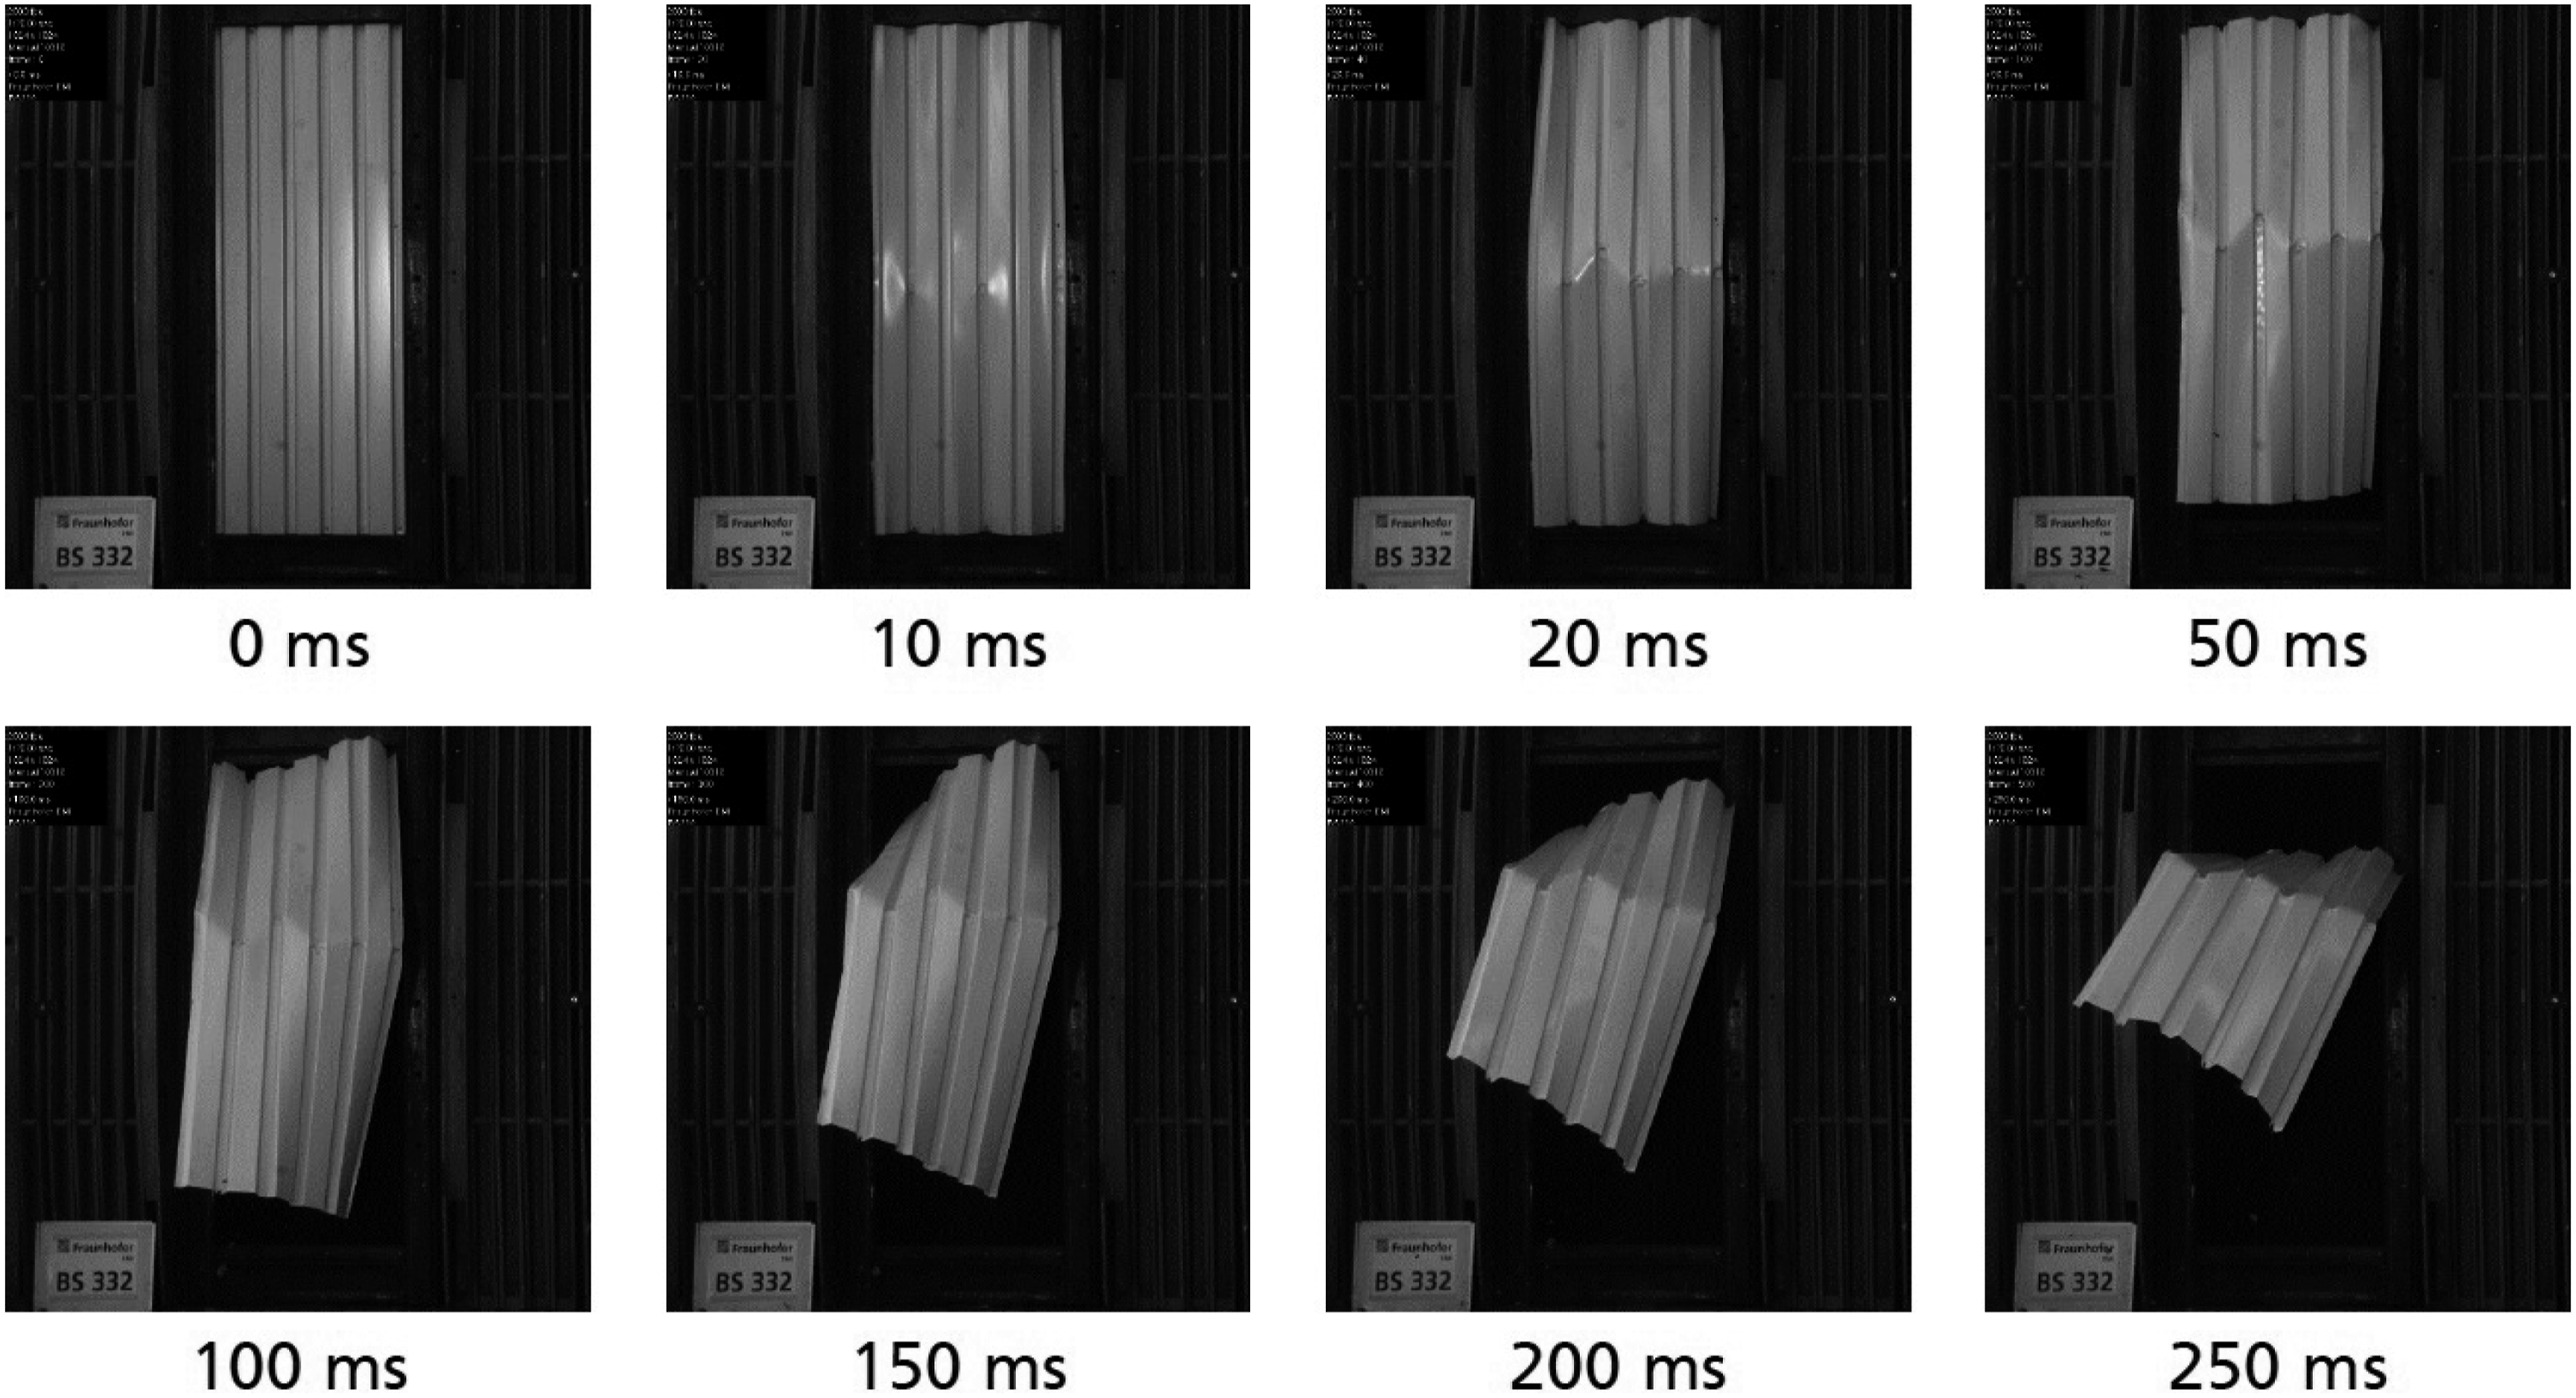
Figure 10 shows the raw unfiltered blast data of the tests. The pressure gauges are fixed in the support frame of the shock tube which is not totally rigid. Small oscillations of the frame result in the fluctuating pressure recordings in the left diagram of Figure 10. Similar observations concerning the pressure oscillation in blast recordings are visible within other publications, as exemplary shown in (Stolz et al., 2014), (Chern et al., 2020), (Stewart et al., 2020), (Gebbeken et al., 2018). Based on the pressure signals, smoothed averaged curves are applied to derive the peak values in Table 3 which are later applied to optimize the engineering model. The observed scattering in the pressure over time data does not reduce the quality of the experimental observation, due to the fact that the mobilized reaction forces are dominated by the blast impulse.
Figure 11 compares the deflection-time relations of the test series. The measurement of loading level 1 is shown in green. The response of the specimen is elastic and a harmonic oscillation is observed. After loading, the component bounds back into the unloaded starting position. Larger deformations result during the tests with loading level 2, which are illustrated with black curves in Figure 11. The structure bounds back, but the oscillation shows some disturbances, which indicate the slight yielding at the support (compare Figure 7 (left)). The deflection measurements for loading level 3 are marked with red-colored lines. The maximum deflection is approximately by a factor of two larger than the results from loading level 2. An oscillation is not observable and the structure stays in a deformation. At this moment, the support at one side of the specimen failed (compare Figure 7 (right)). No deflection measurement was done for Test BS 332 representing loading level 4. Since a failure of the specimen is expected, it is not desired to damage the laser measurement by ejected debris. Comparison of the measured deflection-time histories during the shock tube tests.
The evaluation of the dynamic tests results in the following conclusions: - The governing failure mechanism is the extraction of the metal sheet (see failure mechanism c) in Figure 3). The investigated corrugated sheets fail mainly at the fixing. The bending load capacity of the metal sheet is not exceeded. No critical yielding of the metal sheet is detected outside the support area. Failure of the screws is not observed. - The failure at the fixing is due to the extraction of the metal sheet from the screws. With increasing loads, a buttoning through of the screws in the metal sheet is observed. This effect is not governing the failure; however, it provides a small portion to the failure and increases the extraction of the sheet. - A staggered manner of placing the screws at the upper and lower support has only marginal influence on the response of the structural member compared to an identical placing. This can be attributed to the small distance between the beads compared to the span of the profile.
Static tensile tests
Static tensile tests are performed to investigate a detailed analysis of the failure mechanism at the support.
The following considerations are made prior to planning the tensile tests: Larger blast loads result in an increasing deflection in the middle of the sheet. In the case of small deformations, the load-carrying behavior is governed by the bending load capacity of the cross-section of the sheet. At a certain point of deflection, the load-bearing mechanism is switching and the load is transferred to the support by membrane forces. The capacity of the sheet is limited by its tensile strength. The failure of the support occurs prior to the excess of the tensile strength of the sheet.
As long as the load is transferred by bending action, the rotation at the support (denoted with θ in Figure 13 (left)) is very small and can be neglected. The screws of the support are fully loaded in tension. As soon as the governing load transfer of the sheet is changed to membrane action, the support rotation can no longer be neglected. Due to the support rotation, an additional shear force acts on the screws.
The failure mechanism at the support during the shock tube test is the extraction of the sheet. The decisive acting force for this failure mechanism is the transmitted shear force into the screws. The screws are connected to the sheet by contact and an equivalent force acts in the plane of the sheet pointing to the edge. For further investigations, the tension forces in the screws are neglected. The sheer force is mainly influenced by the rotation of the support.
In order to investigate the extraction of screws out of the sheet, the test setup in Figure 12 is used. The implementation of the setup can be seen in Figure 12 (left). As a specimen, a corrugated metal sheet with the same width as in the shock tube tests of 960 mm but a different height of 800 mm is used (compare Figure 12(c)). At the upper fixing, in total five screws with an increased edge distance of 75 mm are used to avoid failure at this side. At the lower fixing, the conditions are identical to the setup of the shock tube tests. The attachment for the lower support can be moved to create different angles representing the support rotation as shown in Figure 12(a) and (b) . The load during the tests is applied with a speed of 0.05 mm/s. Experimental setup of the static tensile tests: side view with no rotation (a); side view of setup with applied rotation by shifting of the lower support (b); and front view of the setup (c).
In total, 31 tests at different rotation angles are performed. The rotation is varied in a range between 0 and 12°. The identified failure mode during the shock tube tests could be observed during the tests as shown in Figure 13 (right). Experimental setup of the static tensile test with consideration of a support rotation (left pictures) and the failure of the sheet at the support (right).
The results of the tensile tests are evaluated in steps of 4°. At least four tests are performed per step until the results are averaged. The diagram in Figure 14 (left) shows the force-displacement behavior for different support rotations. Discontinuities in the curves indicate a failure of single screw connections. Smaller maximum forces are observed for increased support rotations. The diagram in Figure 14 (right) shows the averaged maximum tensile force for a given support rotation. A clear relation is observed: an increasing angle results in smaller maximum forces. This functional behavior Evaluation of tensile tests: Force–displacement diagram for different support rotations (left) and the averaged resulting maximum experimental tensile force depending on support rotation and force (right).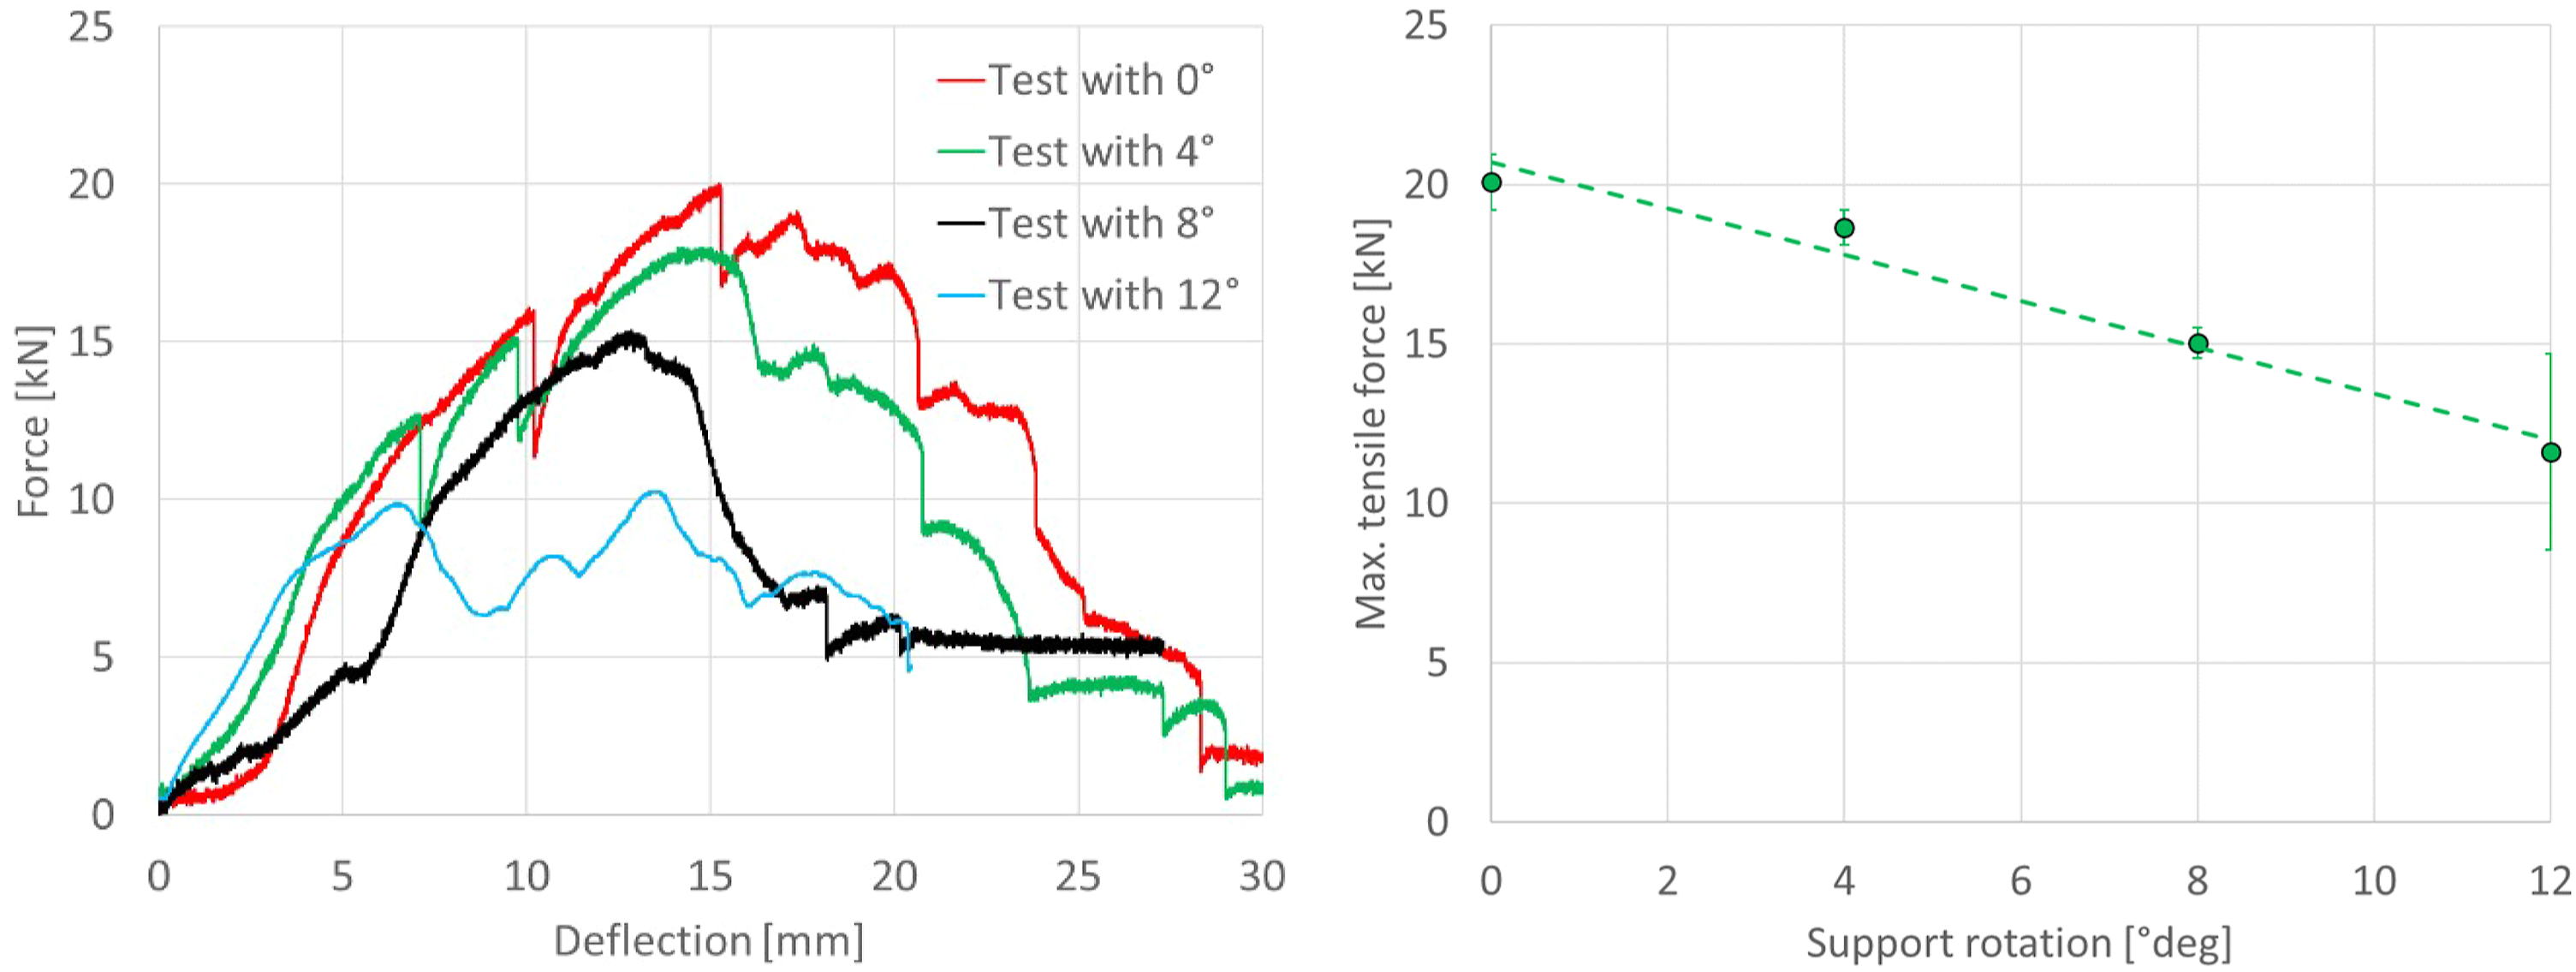
The dynamic and static tests result in a comprehensive overview concerning the failure behavior of point fixed corrugated metal profile sheets. The investigations show two significant failure mechanisms: bending of the panel and a pull-out at the screw connections. Subsequently, two different approaches are introduced and combined to characterize this behavior within an engineering model.
Analytical dynamic bearing model
Assessment of the bending behavior
Besides experimental investigations and finite-element simulations, fast-running engineering models are common practice for the structural assessment subjected to dynamic loading, as shown in (Riedel et al., 2010), for example. The bending behaviors and failures of structural members under dynamic blast loading are often described with a single degree of freedom model (SDOF) (Morison, 2006), (Krauthammer, 2008), (Cormie et al., 2009), (Riedel et al., 2012). Within the SDOF model, the structural element is idealized in a single mass point 
In equation (1), the deflection and the acceleration of the mass are expressed by
The external force is considered as the product of the surface area of the structural element and the pressure-time relation of the dynamic loading
To transform the structural element into an equivalent mass-spring model, the mass and loading factors (
The inverse approach of (Fischer and Häring, 2009), that is, the comparison between the SDOF model solution and the measured deflection-time history from shock tube tests, results in a direct and dynamic determination of a resistance parameter. By varying the stiffness (
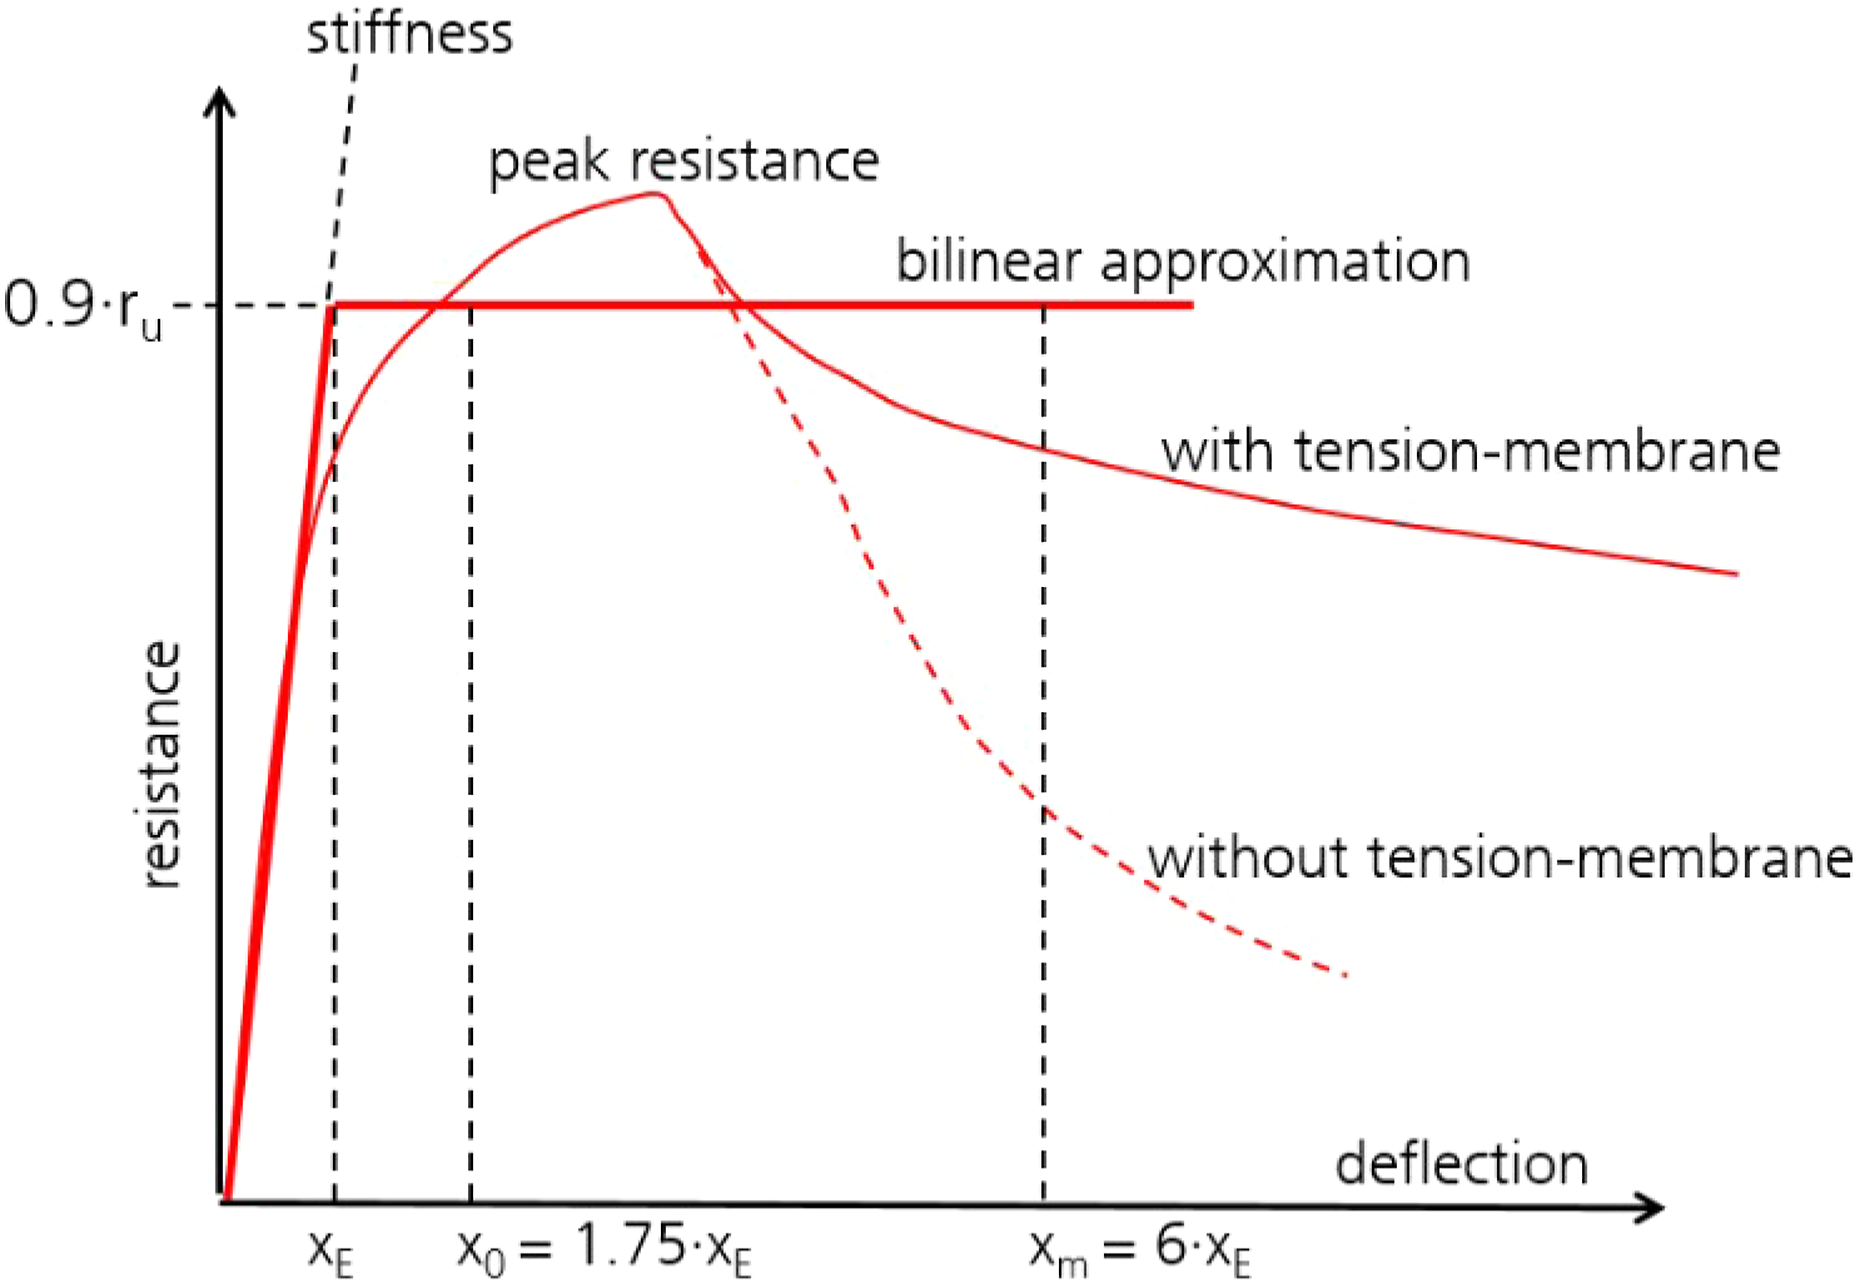
Analytical derivations based on a UFC document (U S Army, 2008) are additionally applied to determine the required resistance parameter of the SDOF model to consider an arbitrary configuration, e.g. different dimensions or material properties. Figure 15 shows a sketch of the idealized resistance shape according to the analytical approach of (U S Army, 2008) in comparison to the real behavior. In alignment with the resistance function in equation (1), the response pressure is equal to the ultimate resistance Sketched resistance behavior of cold-formed steel (thin line) and the idealized bilinear characterization (thick line) according to (U S Army, 2008). A differentiation of tension-membrane forces characterizes the yielding of the material.
Within the calculation of (U S Army, 2008), the dynamic yield strength 
The derived parameter in (3) in relation to the length of the structure quantifies the ultimate resistance 
The elastic limit is quantified by the ultimate resistance 
Based on the ultimate resistance and the elastic limit, the spring stiffness is derived.
Overview of calculated resistance parameter according to the investigated metal sheet and the comparison to the inverse derived parameter.
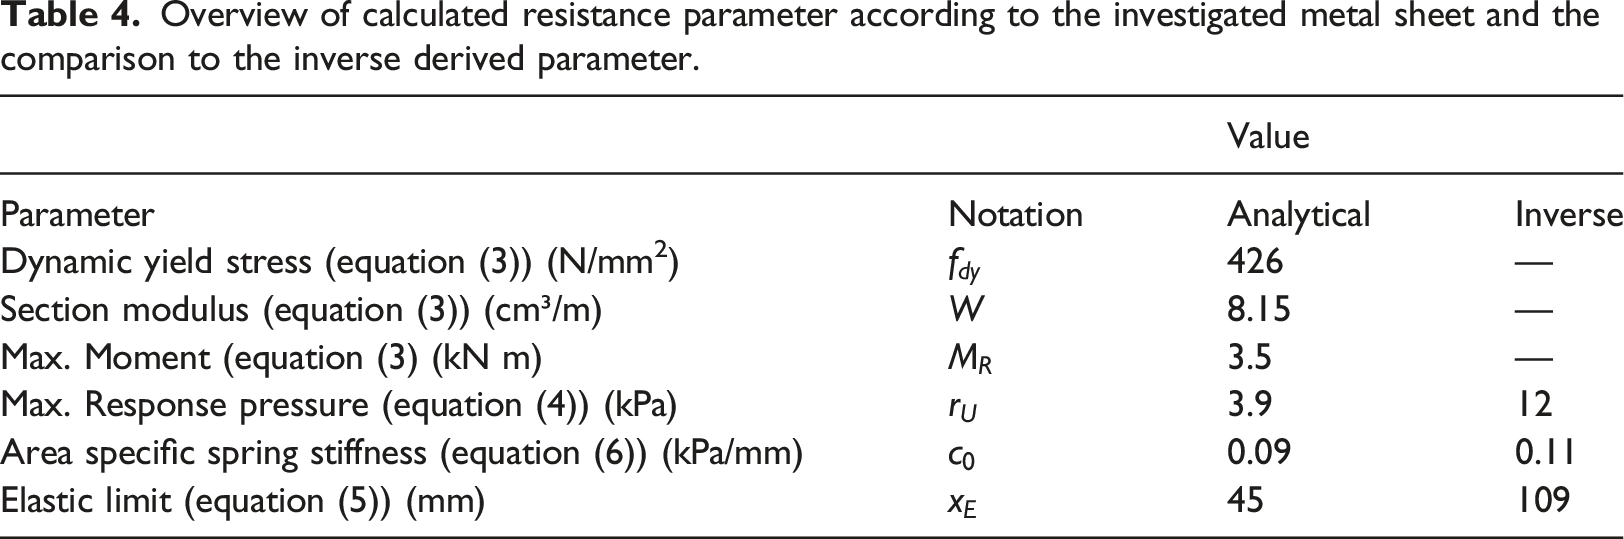
The analytical approach according to equations (3) to (6) and the corresponding results of Table 4 are applied in the SDOF model (equation (1)). The external force in this model is matched with measured peak values of the shock tube tests (Table 3). The comparison to the inverse approach as the target solution and the acquired data quantifies the quality of the analytical formulation. A good agreement with the derived stiffness is observed. Due to the level of simplification and neglect of slipping effects, both model approaches generally predict a stiffer component response than it is observed in the experiment. The comparison of the inverse or dynamic response pressure shows a stronger deviation, whereas the analytical approach results in smaller quantities. This result is also visible in comparison to experimental tests with the nonlinear behavior of the material (see the red graphs in Figure 11). The analytical model overestimates the maximum deflection by approximately 20%. Based on these findings, it is proposed to apply the SDOF model of equation (1) with an adapted response pressure, based on the analytical ultimate resistance of equation (4)
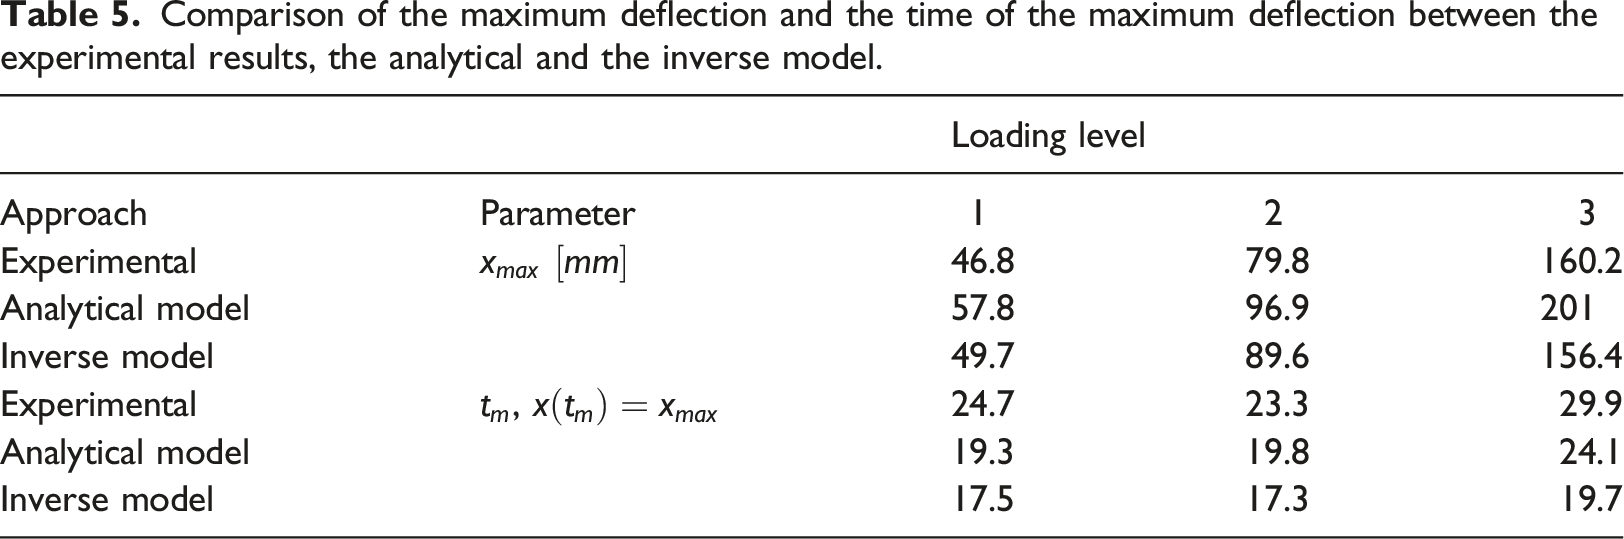
Figure 16 compares the experimental deflection (solid lines) with the two different model approaches. The inverse model (dashed line) shows a good agreement concerning the maximum deflection for all loading levels. The dotted lines show the analytical approach using the modified response pressure of equation (7). It has to be noted that the analytical model addresses only the midpoint deflection of the sheet caused by the bending and not any displacement portions resulting from partial connection plasticity. Table 5 shows the corresponding comparison concerning the maximum deflection and the time where the maximum deflection arrived. Comparison of the experimental deflection, the dynamic derived model, and the analytical model. The acronym “LL” indicates the corresponding loading level. The analytical model neglects the characteristics of the fixing. Comparison of the maximum deflection and the time of the maximum deflection between the experimental results, the analytical and the inverse model.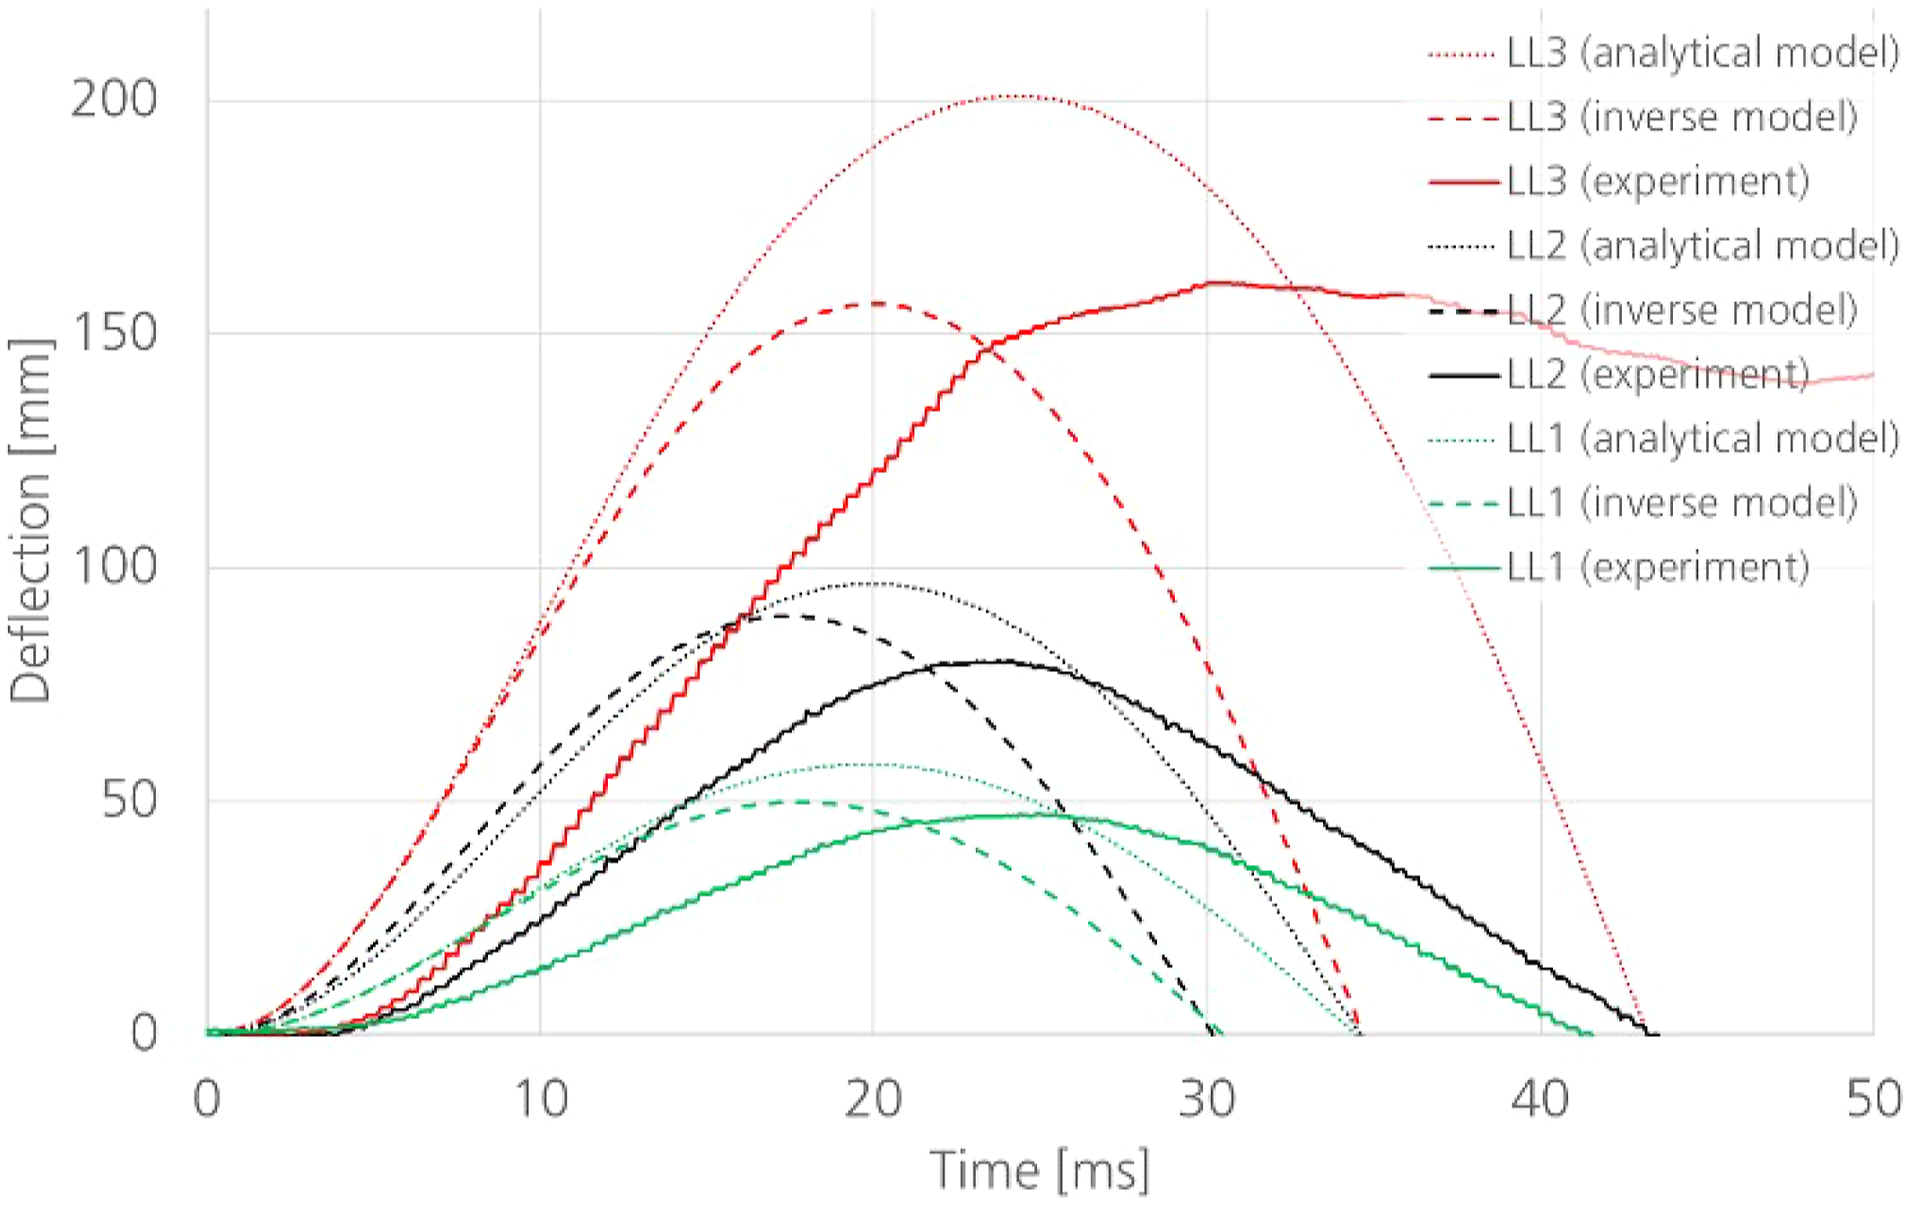
Based on a similar stiffness between the inverse and the analytical model (see Table 4), the maximum deflection for the weak loading level (green lines) is almost in a similar range. For stronger loadings, the model deflection is higher than the maximum deflection of the experiment and hence, a conservative prediction. In contrast to the initial UFC approach of (U S Army, 2008), the new modified prediction include lower safety factors and a suggested correction of the response pressure (equation (7)) and deliver an accuracy that is more sufficiently aligned with the observations of the Experiment.
The comparison between model and experiment shows a sufficient and conservative agreement when using an SDOF model and a corresponding derivation of a resistance function but is based on pure bending behavior of the structural member without consideration of any fixings. The applied approach is valid to assess the bending failure of the structure under dynamic loading but gives no information on the reaction forces and the dimensioning of the screw connections.
Analysis of the dynamic reaction forces at the support and failure criterion
The dynamic reaction forces of the structural elements have no direct counterpart in the equivalent SDOF analysis in the previous section. The information of the reaction is essential to characterize the maximum forces and their direction in the element as the requirement for the design of the supporting structure. For the given system, a calculative verification of the permitted tensile forces, aligned to the standard EN 1993-1-3 (Deutsches Institut für Normung (German Institute for Standardization), 2006), is proposed. The permitted force 
The normed expression of equation (8) is valid for a single connection and has to be multiplied by the number of screws. The comparison of the evaluated forces to the measured values of the static tests (Figure 13, Figure 12) can be seen in Figure 17. The direct comparison shows that the calculated values according to the standard are smaller than the experimental values. Comparison of the calculated normative tensile force and the experimental tensile tests depending on the support rotation. The experimental curve is based on a linear regression of single data points.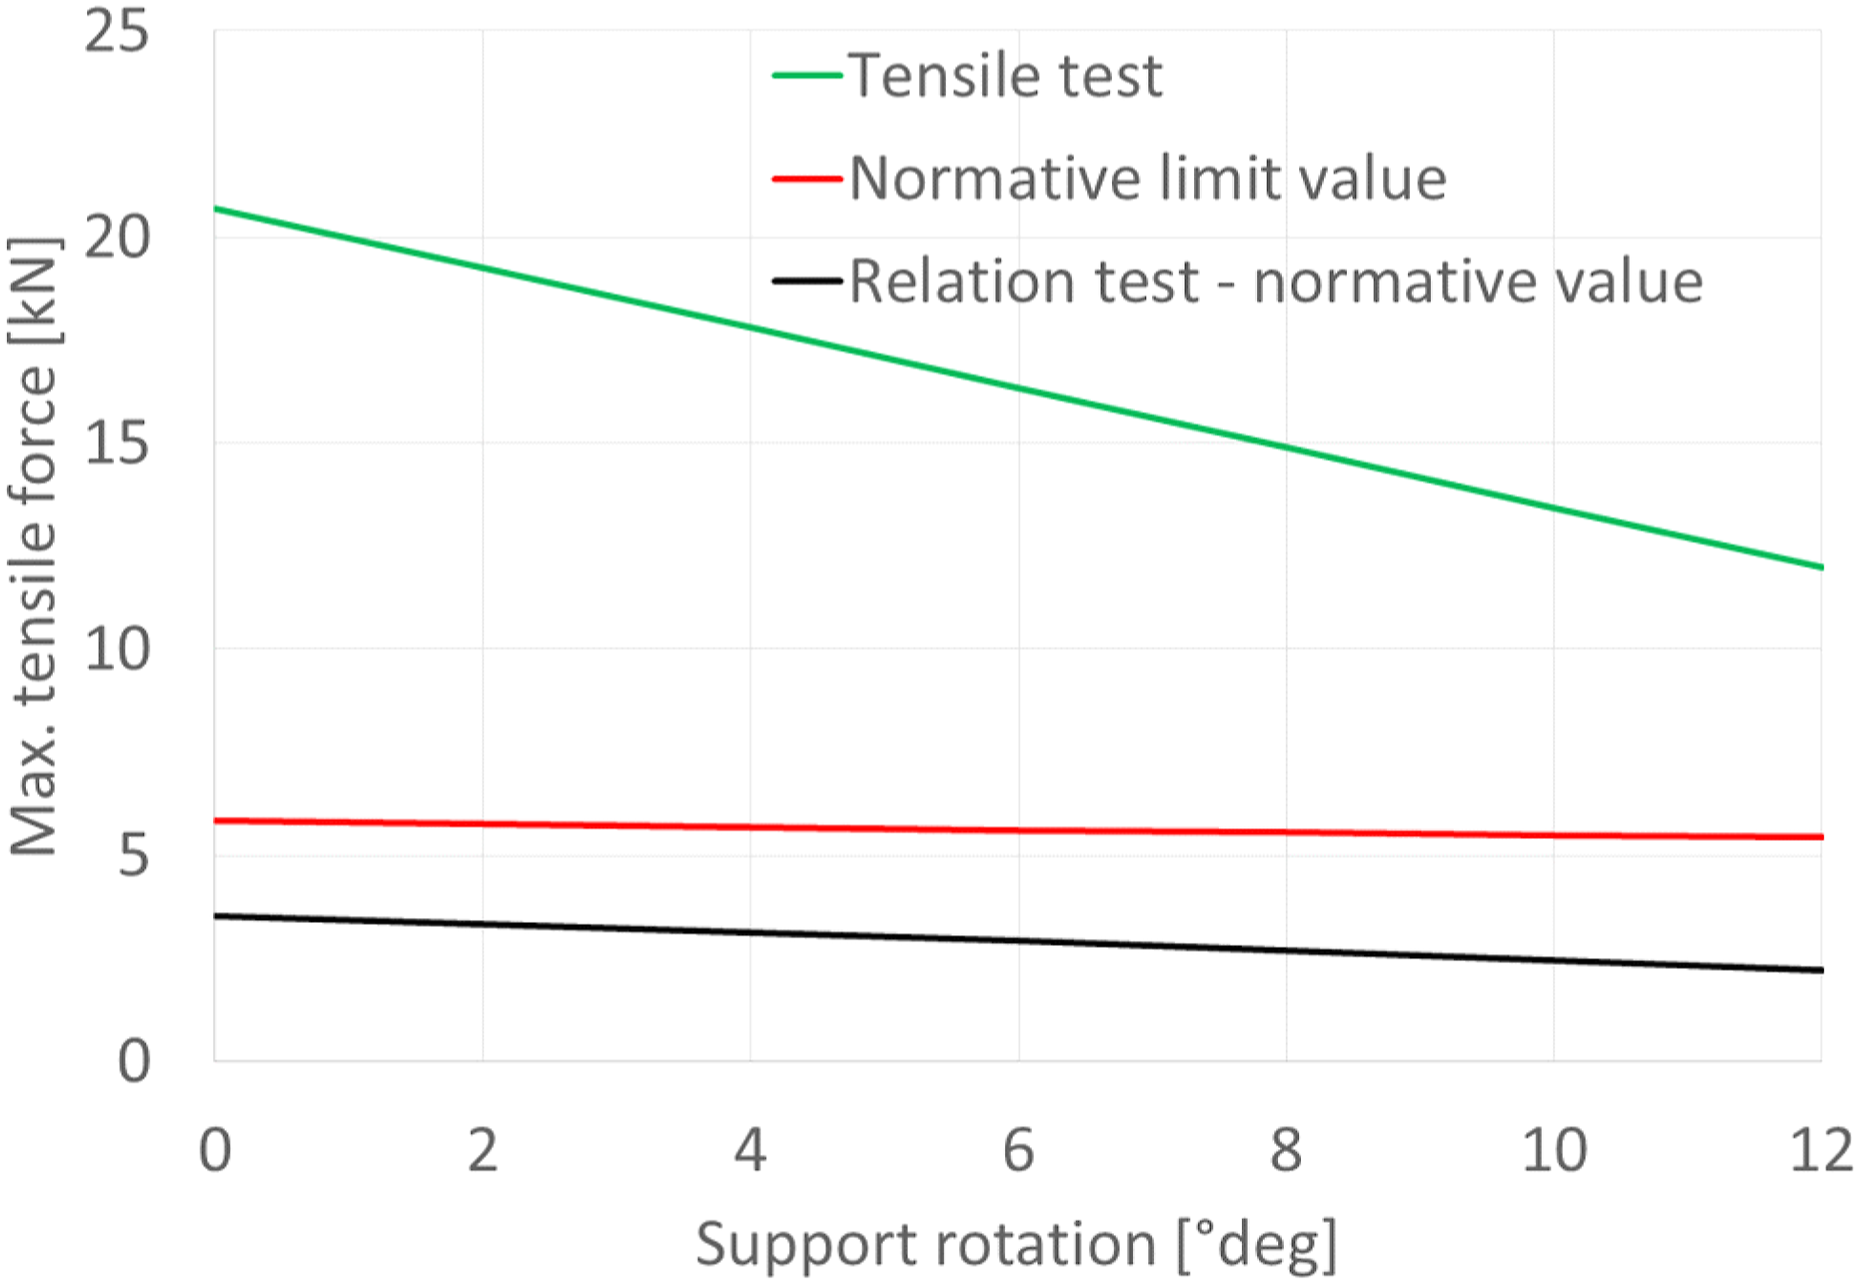
The comparison of the experimental and the calculated values results in an increased factor, which depends on the support rotation. The increase factor is calculated with the relation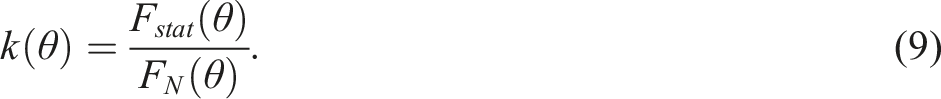
This quantity is visualized as a black line in Figure 17. The factor is calculated for the investigated values of the support rotation and with increasing values of the rotation, it declines from 3.5 to 2.2.
The impact of an external force on a structural member causes a time-dependent deflection and a rotation at the support, as shown in the idealization of Figure 18. This information and the working direction of dynamic forces can be used to compare the dynamic shear force with the static observation of the experiments and the normative limit values. Idealized description of the structure under dynamic loading, the resulting response and the working direction of time dependent forces. The dotted lines represent a simplified idealized bending line.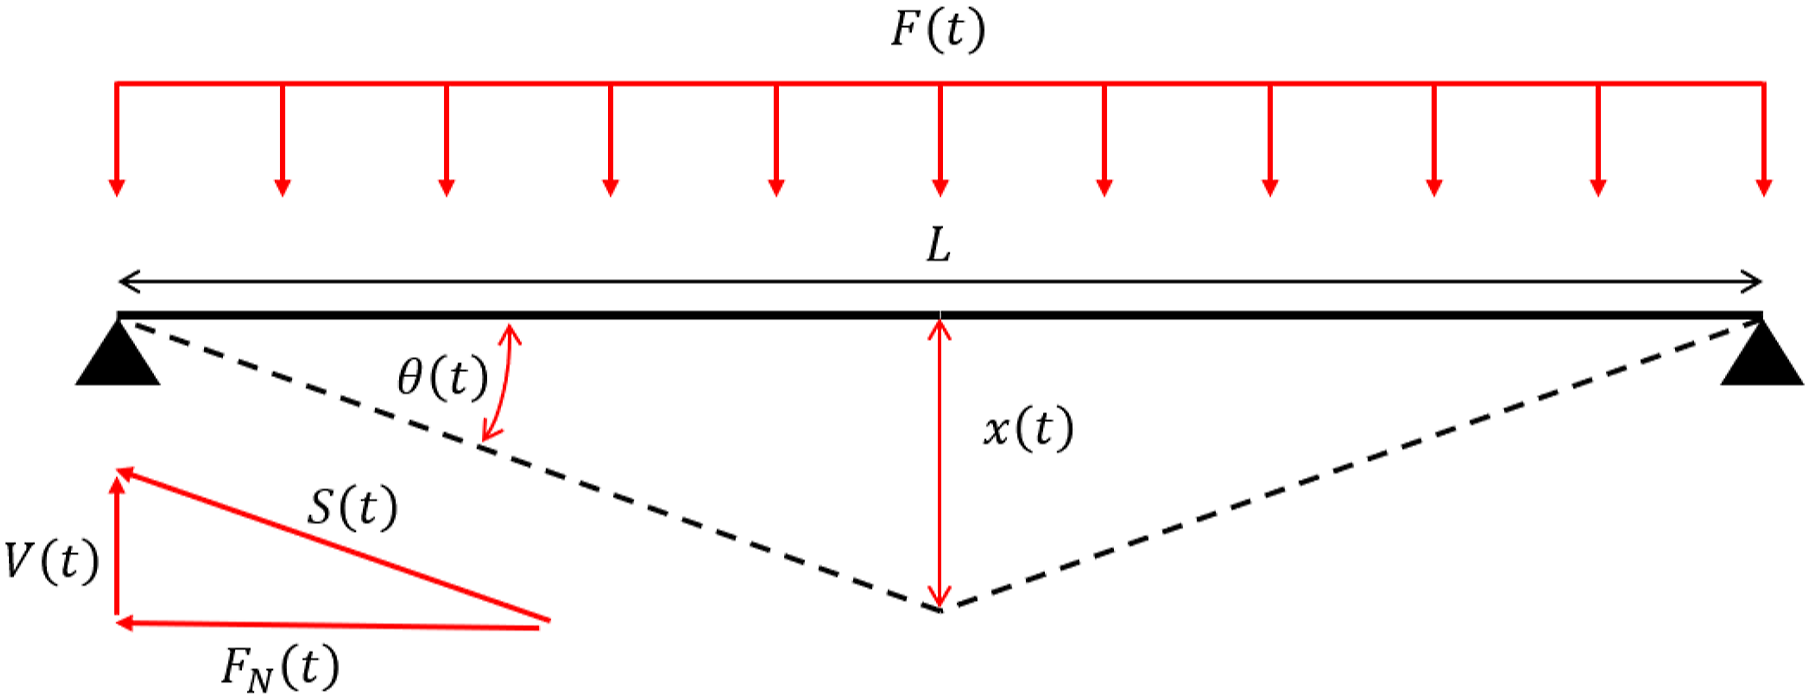
The dynamic reaction of the structure at the support under dynamic loading can be calculated according to (Biggs, 1964) by 
The reaction
The support rotation 
This quantity is compared to the permitted static force of equation (8) and the rotation dependent relation is compared to the static tests of equation (9), which results in a dynamic increase factor (DIF), see (equation 12)
(Equation 12) is applied in comparison to the test series of shock tube experiments that are summarized in Table 3 and results in an averaged increase factor of 
Application and verification of the model
Derivation of pressure-impulse diagrams and critical reaction forces
The SDOF analysis in equation (1) results in a valid response prediction for a single loading scenario. If a failure criterion, e.g. a critical deflection, is known, pressure-impulse diagrams are common practice to evaluate the structural response for arbitrary loading scenarios (Krauthammer, 2008).
The principal sketch in Figure 15 shows essential benchmarks concerning the deflection-dependent resistance behavior of metal sheets under dynamic loading. Critical points are the elastic limit ( Derived pressure-impulse diagram based on the optimized SDOF model in comparison to the measured loading level from the experimental investigations (left). Comparison of the dynamically derived forces to the limit values. If the dynamic value is smaller than the limit, the structure will not fail. The colored circles indicate the different loading levels from the shock tube test series (green, no failure; black, slight yielding; and red, failure at the support) (right).
A further application is the evaluation of the critical reaction forces. For each dynamic shock tube test, the dynamic forces (blue points in Figure 19, right) and the permitted limit forces (yellow points in Figure 19, right) are calculated in alignment with equations (7), (8), and (12). According to the introduced equations, the structure will not fail if the dynamic values are smaller than the limits for a given support rotation, see equation (13). The colored circle indicates the loading levels of the test series. The dotted lines are interpolations and the intersection illustrates the critical support rotation, where the screw connection will fail. This information corresponds with the experimentally observed results.
Application of the model to further test series
Design values of the investigated trapezoidal sheet for validation.
Figure 20 (left) shows the calculated iso-damage curves in comparison to the measured loading values (left). Equal to the initial test series, the loading is distinguished into three levels: “no damage” (green), “plastic deformations” (black) and “failure at the screw connection” (red). Even considering the scattering of the raw pressure recordings the model shows in general a good agreement with the acquired values. The different modes for the different loading levels can be distinguished. Comparison of the overall model response in comparison to a further test series. Pressure-impulse diagram (left) and the comparison of dynamic and static forces (right).
Figure 20 (right) shows the comparison of the limit and the calculated dynamic support force, already reduced by the dynamic increase factor. Based on a higher number of screw connections, the structural member has higher robustness and the model predictions correspond to the experimental observations.
Summary and conclusion
The evaluation of structural elements subjected to blast loading can be carried out with the use of simplified engineering models. Single degree of freedom models form the basis to derive iso-damage curves within a pressure-impulse diagram to assess the overall response behavior.
In this paper, the resistance behavior of point fixed corrugated metal sheets was analyzed. Within an experimental shock tube test series, the extraction of the sheet at the screw connection was identified as a predominant failure criterium. In alignment with the setup of the experiment, the failure behavior was further investigated via static tensile tests. They provided the maximum tensile force, which is decisive for the resistance of the steel sheet-screw connection against a dynamic load.
The obtained information was applied to optimize a single degree of freedom model. An analytical model was used to characterize the bending behavior of the structural member. The dynamic supporting force was compared to the static tests to derive a dynamic increase factor and to obtain a failure criterium. The optimized model was validated with a following test series and showed sufficient accuracy.
Finally, the derived model can be applied for the design of point fixed corrugated metal sheets subjected to blast loading. In the model, the dimensions, the cross-section and the material parameters of the corrugated metal sheets can be altered and the number of screws at the support can be arbitrarily chosen. Expected damage effects can be effectively characterized and give contributions within a systematic risk management procedure.
Footnotes
Declaration of conflicting interests
The author(s) declared no potential conflicts of interest with respect to the research, authorship, and/or publication of this article.
Funding
The author(s) received no financial support for the research, authorship, and/or publication of this article.