
Abstract
The utilization of Astragalus Gombo (AG) as a primary ingredient in this research has been employed for the purpose of cellulose synthesis. The objective of this study was to explore the potential of utilizing agricultural waste, specifically AG, as a novel source for cellulose production. The cellulose underwent a three-step preparation process. Initially, deproteinization was conducted, followed by lipid extraction. Subsequently, a bleaching treatment was applied to eliminate lignin and hemicellulose. This study investigates the optimization of cellulose extraction from agricultural residues through the utilization of analysis of variance. Various extraction durations (1, 2, and 4 h), extraction temperatures (30, 60, and 100°C), and concentrations of NaOH (5, 10, and 20%) were employed. The optimal circumstances can be ascertained employing the 3-D response surface and contour plot generated from the mathematical models. The most favorable conditions for extraction involve maintaining an extraction temperature of 30°C, an extraction period of 2 h, and a NaOH concentration of 5%. Based on the regression analysis, the estimated final mass is projected to be 1356 g, with a regression coefficient of 90.96%, given the specified parameters. The cellulose was subjected to a comprehensive analysis using several spectroscopic, thermal, morphological, and structural techniques, including Fourier Transform Infrared Spectroscopy (FTIR), Differential Scanning Calorimetry (DSC), X-ray Diffraction (XRD), Thermogravimetric Analysis (TGA), Differential Thermogravimetry (DTG), and Scanning Electron Microscopy (SEM). The preparations of cellulose from AG were executed successfully. Furthermore, the findings of this study indicate that AG represents a newly identified environmentally sustainable resource.
Introduction
Bio-based materials are intentionally made from substances derived from living organisms. 1 Bio-based materials fall under the broader category of bioproducts or bio-based products, which include materials, chemicals, and energy derived from renewable biological resources. Bio-based materials include Cellulose fibers, Engineered wood, Zein (a natural biopolymer that is the most abundant corn protein), Corn starch…….etc.2,3
Bio-based materials are perceived as potentially greener alternatives to their petroleum-based counterparts, as they are created using renewable biomass sources. 4 Using bio-based raw materials enables the transition from fossil-based sources and helps us move toward a more sustainable society. 5 Bio-based materials also offer better recyclability than fossil-based options and have higher process efficiency thanks to biologically based production processes such as enzymes, fermentation, and bio-catalysis. Biobased materials can be used in various industries, such as natural biomaterials, ceramics, polymeric, and more.6,7
Due to their abundance, renewable nature, non-toxicity, and biodegradability, polysaccharides have been known and harvested for many years.8–10 In this context, cellulose is one of the most representative polysaccharides widely present in plants, as its unique properties, such as renewable properties, biodegradability, processing flexibility, low density, high specific strength, and cheaply, have demonstrated numerous advantages.11–13
Cellulose is a complex carbohydrate, or polysaccharide, consisting of many glucose units. It is the main structural component of plant cell walls, comprising about 33% of all vegetable matter.14,15 Cellulose fibers are enmeshed in a polysaccharide matrix to support plant cell walls. Cellulose is hydrophilic, insoluble in water and most organic solvents, and biodegradable. It has no taste, is odorless, and is chiral. Cellulose can be broken down chemically into glucose units by treating it with concentrated mineral acids at high temperatures.16–18
Cellulose has many uses. It is processed to produce papers and fibers and is chemically modified to yield substances used in manufacturing of plastics, photographic films, and rayon. Cellulose pulp may also be treated with strong acid to produce short rigid cellulose nanocrystals, which are of high technological interest due to their self-assembly into cholesteric liquid crystals, production of hydrogels or aerogels, use in nanocomposites with superior thermal and mechanical properties, and use as Pickering stabilizers for emulsions. In cotton, cellulose makes clothes like t-shirts and jeans.19–21
In light of increasing industrial demand, new cellulose sources from original plants like those grown in the Sahara should be identified. 8 These Saharan plants are usually high in polysaccharides, particularly those belonging to the genus Astragalus (Fabaceae) and, in particular, Astragalus Gombo (AG) (Fabaceae), a perennial, ubiquitous and indigenous plant that is commonly utilized as animal fodder.22–24 Specific polysaccharides generated from Astragalus plant’s leaves, seeds, or roots have already been identified for their biological effects. 25 To the best of our knowledge, no research has been conducted on the cellulose content of Astragalus Gombo (AG).22,26 After extraction, the amounts of cellulose in plant biomass differ between plants. The surface-response method (RMS) optimization calculates the best result in optimum conditions of cellulose extraction to estimate the final mass or determine the optimum final yield.
The primary purpose of this research is to increase the value of Astragalus Gombo (AG) by using its seeds as a raw material. Second, extract the cellulose in Astragalus Gombo (AG) seeds by a high-purity chemical procedure by eliminating other components, such as proteins, lipids, and water-soluble compounds, to boost its purity. This paper also seeks to optimize the process for cellulose extraction by employing Response Surface Methodology (RSM) and applying a three-level and three-variant design to investigate the effects of extraction time, extraction temperature, and Sodium hydroxide (NaOH) concentration on the final mass of cellulose. Last but not least, the purified cellulose is examined and identified by analytical techniques that reveal its various aspects and properties; these techniques focus on thermal, structural, and morphological properties and include Attenuated Total Reflectance-Fourier Transform Infrared (ATR-FTIR) spectroscopy, X-ray diffraction (XRD), Scanning Electron Microscope (SEM) techniques, Thermogravimetric Analysis (TGA), and Differential Scanning Calorimetry (DSC) analysis.
The novelty of this study is that it is the first to investigate cellulose of extraction from this plant. Furthermore, there is no information available on cellulose derived from Astragalus Gombo (AG). We chose this subject because now the scientific research is based on renewable, biodegradable natural resources and the availability of agricultural wastes and medicinal plants.
Materials and methods
Raw materials and preparative procedures
North Algerian Sahara was the source of AG seeds (Figure 1), precisely from a region called Ouargla. To make a fine powder, the seeds were separated by hand, dried for many weeks, and ground in an electric mixer. The powder was kept in an excellent, dry location until it was time for extraction. AG seeds; (a): before maturation, (b): after maturation.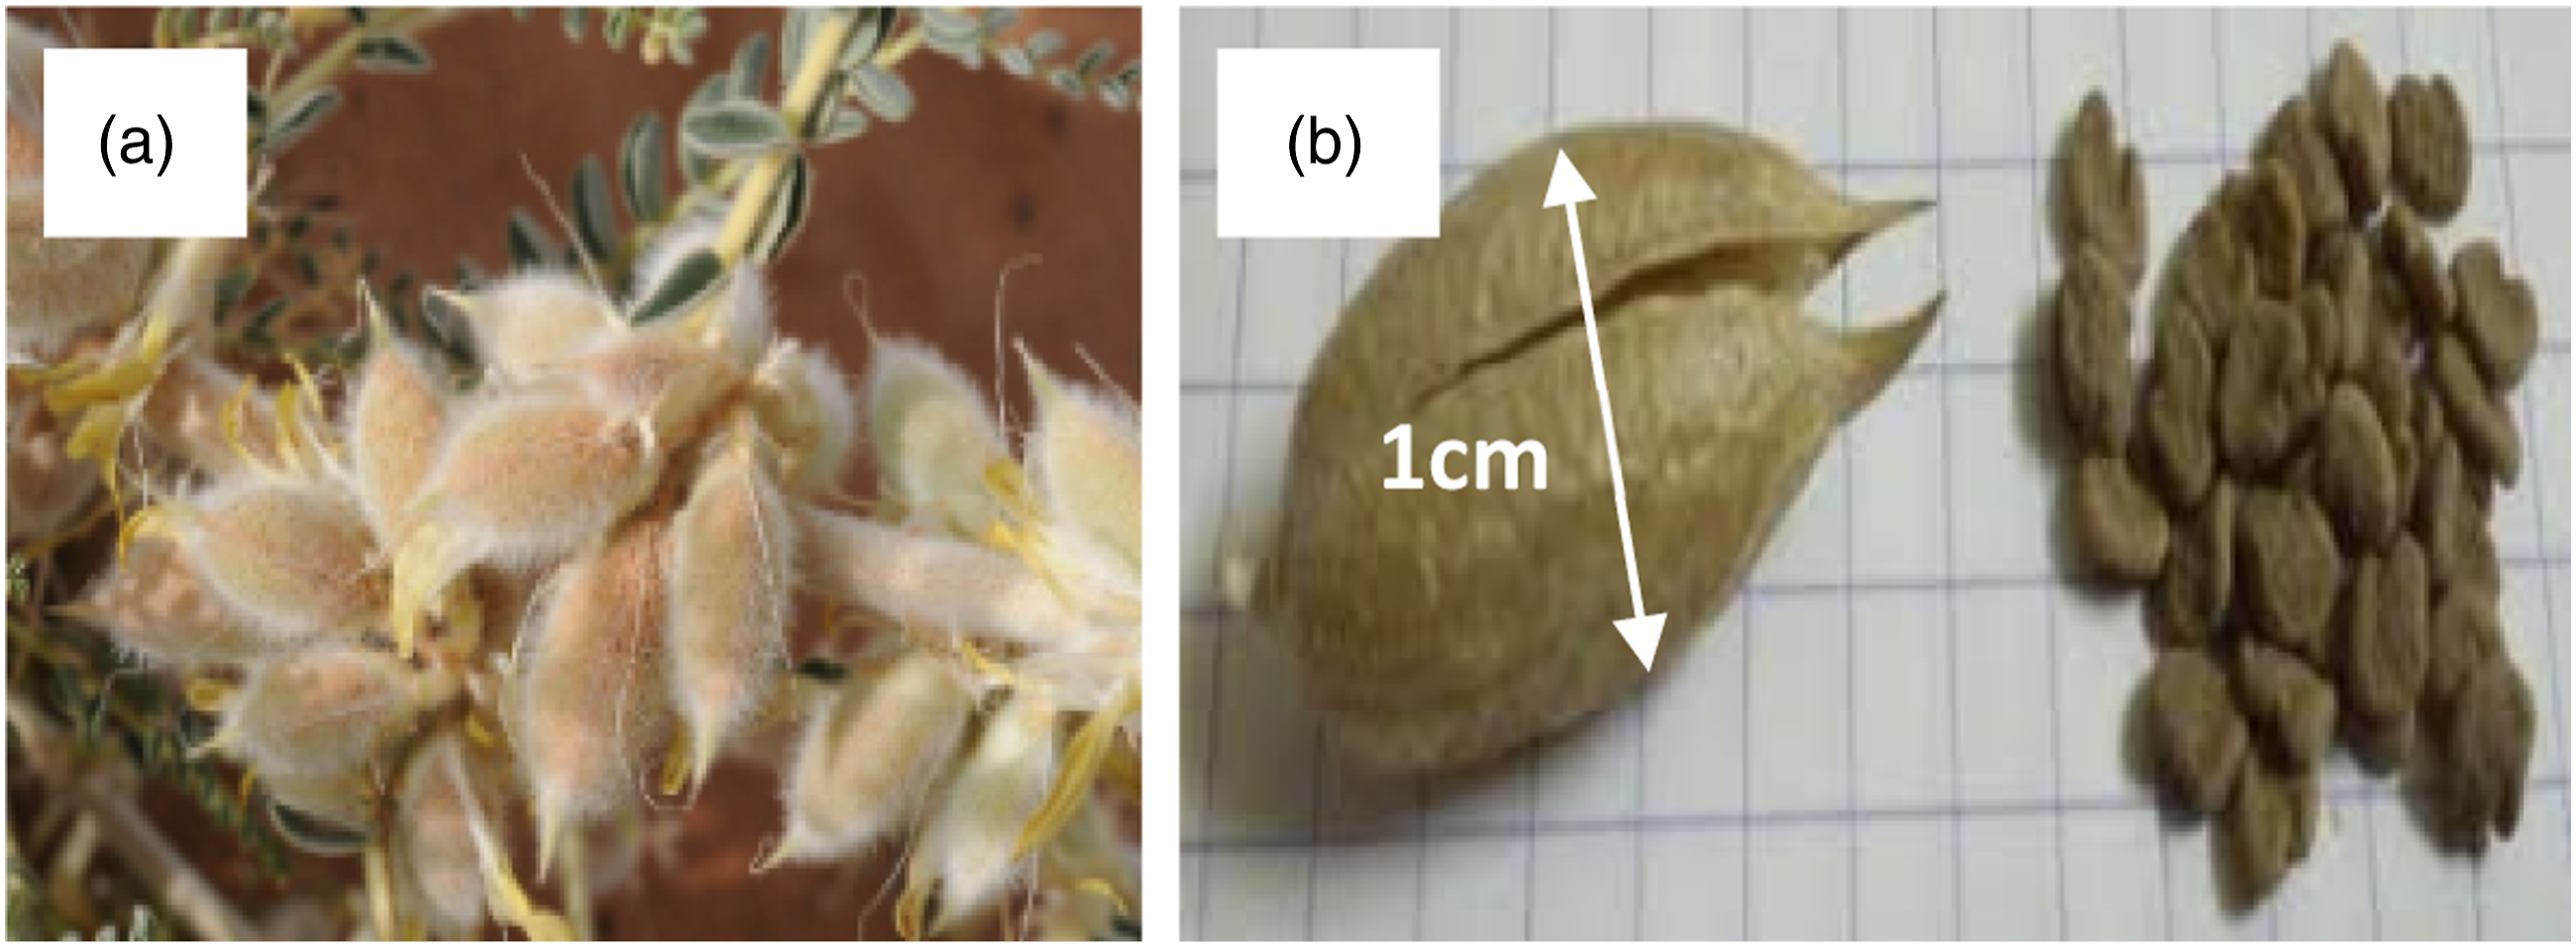
Cellulose extraction method
Using certain adjustments from Kouadri’s original description, the cellulose extraction process used in this study was developed.8,13 Figure 2 summarizes all the processes of cellulose extraction from the AG. A four-step extraction was carried out. Firstly, pretreatment 3.5 g of AG seeds powder with distilled water for 8 h at 50°C under stirring to eliminate pectin and water-soluble impurities.8,27,28 Second, the residue was re-extracted with Ethanol/Toluene at 60°C for 10 h under stirring to liberate pigments, waxes, and other organic solvent-soluble particles.8,13,29 The dried residue is extracted with an aqueous solution of NaOH in an oil bath for different times (t) temperatures (T°) under mechanical stirring. The suspension is filtered, repeatedly washed with purified water until the pH is neutral, and then dried.8,13,28 Finally, the residue is bleached at 80°C for 4 h using a solution of NaClO mixed with distilled water (2:1) and two drops of acetic acid until the cellulose turns white. The suspension is then filtered, rinsed with water, and lyophilized to produce a dry powder.8,13 Cellulose extraction from AG plant in different steps.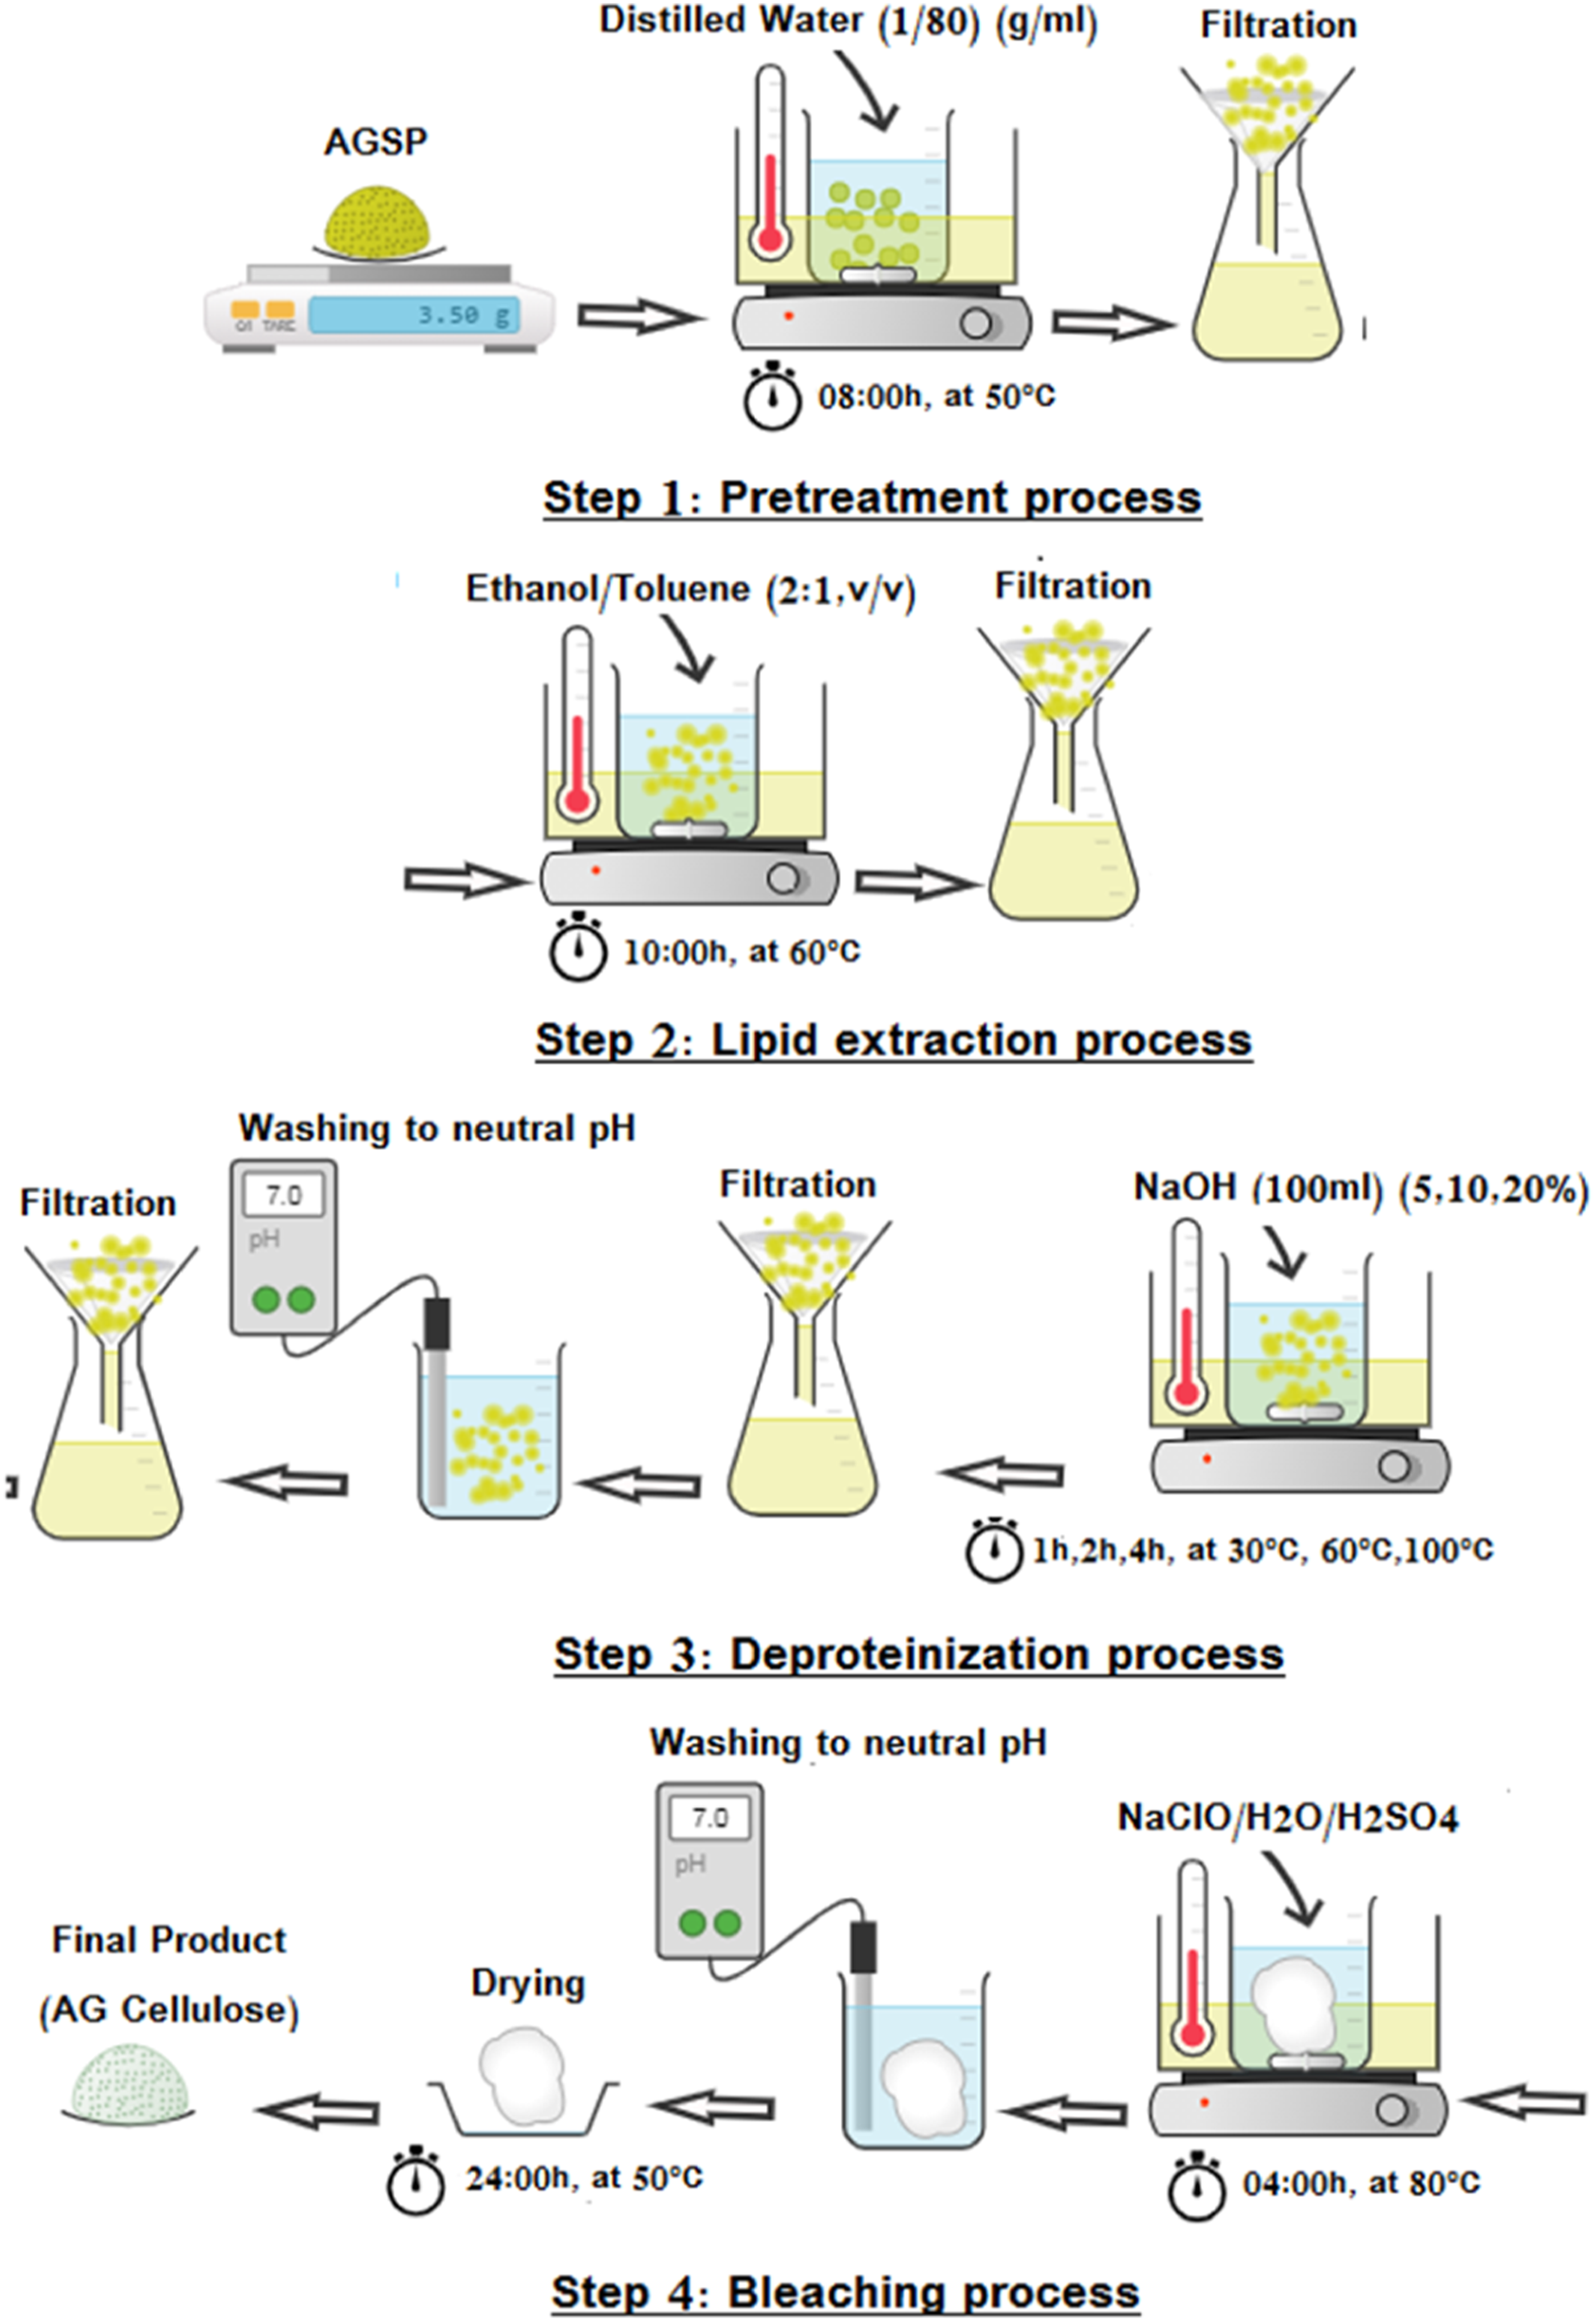
Characterization methods
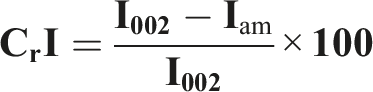
A Thermo Scientific Nicole spectrometer equipped with an ATR accessory, was used to obtain ATR- FTIR spectra. Between 4000 and 500 cm−1, all ATR-FTIR-spectrums with a spectral resolution of 4 cm−1 were obtained. XRD analysis utilized a Bruker D8-Advance diffractometer. From 5° to 50°, scattered intensities were measured in the 2θ angular domain. The index of cellulose crystallinity was computed using the following equation:
Statistical analysis and experimental design employing the response surfaces design method
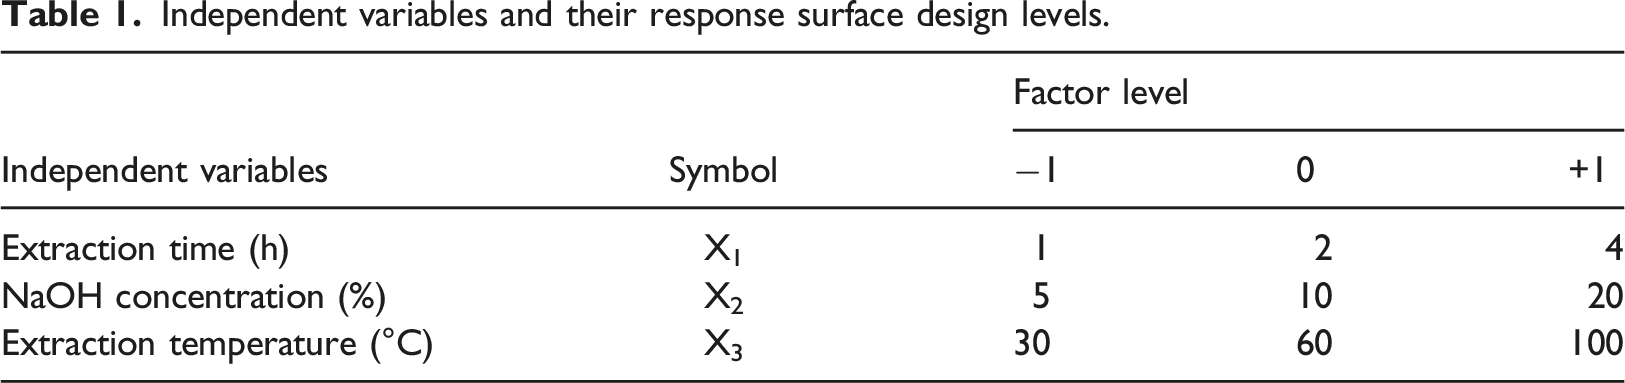
Independent variables and their response surface design levels.
The following is the complete quadratic equation that was used: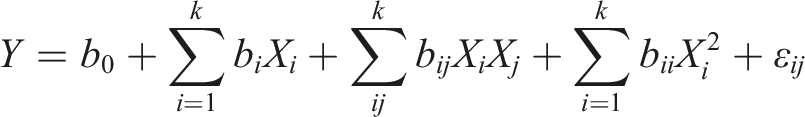
Results and discussion
Attenuated total reflectance-fourier transform infrared analysis
Figure 3 illustrates the structural identification of commercial cellulose and cellulose isolated from AG following bleaching treatment in the 500–4000 cm−1 range using ATR-FTIR. ATR-FTIR spectra of (a) commercial cellulose; (b) cellulose from AG.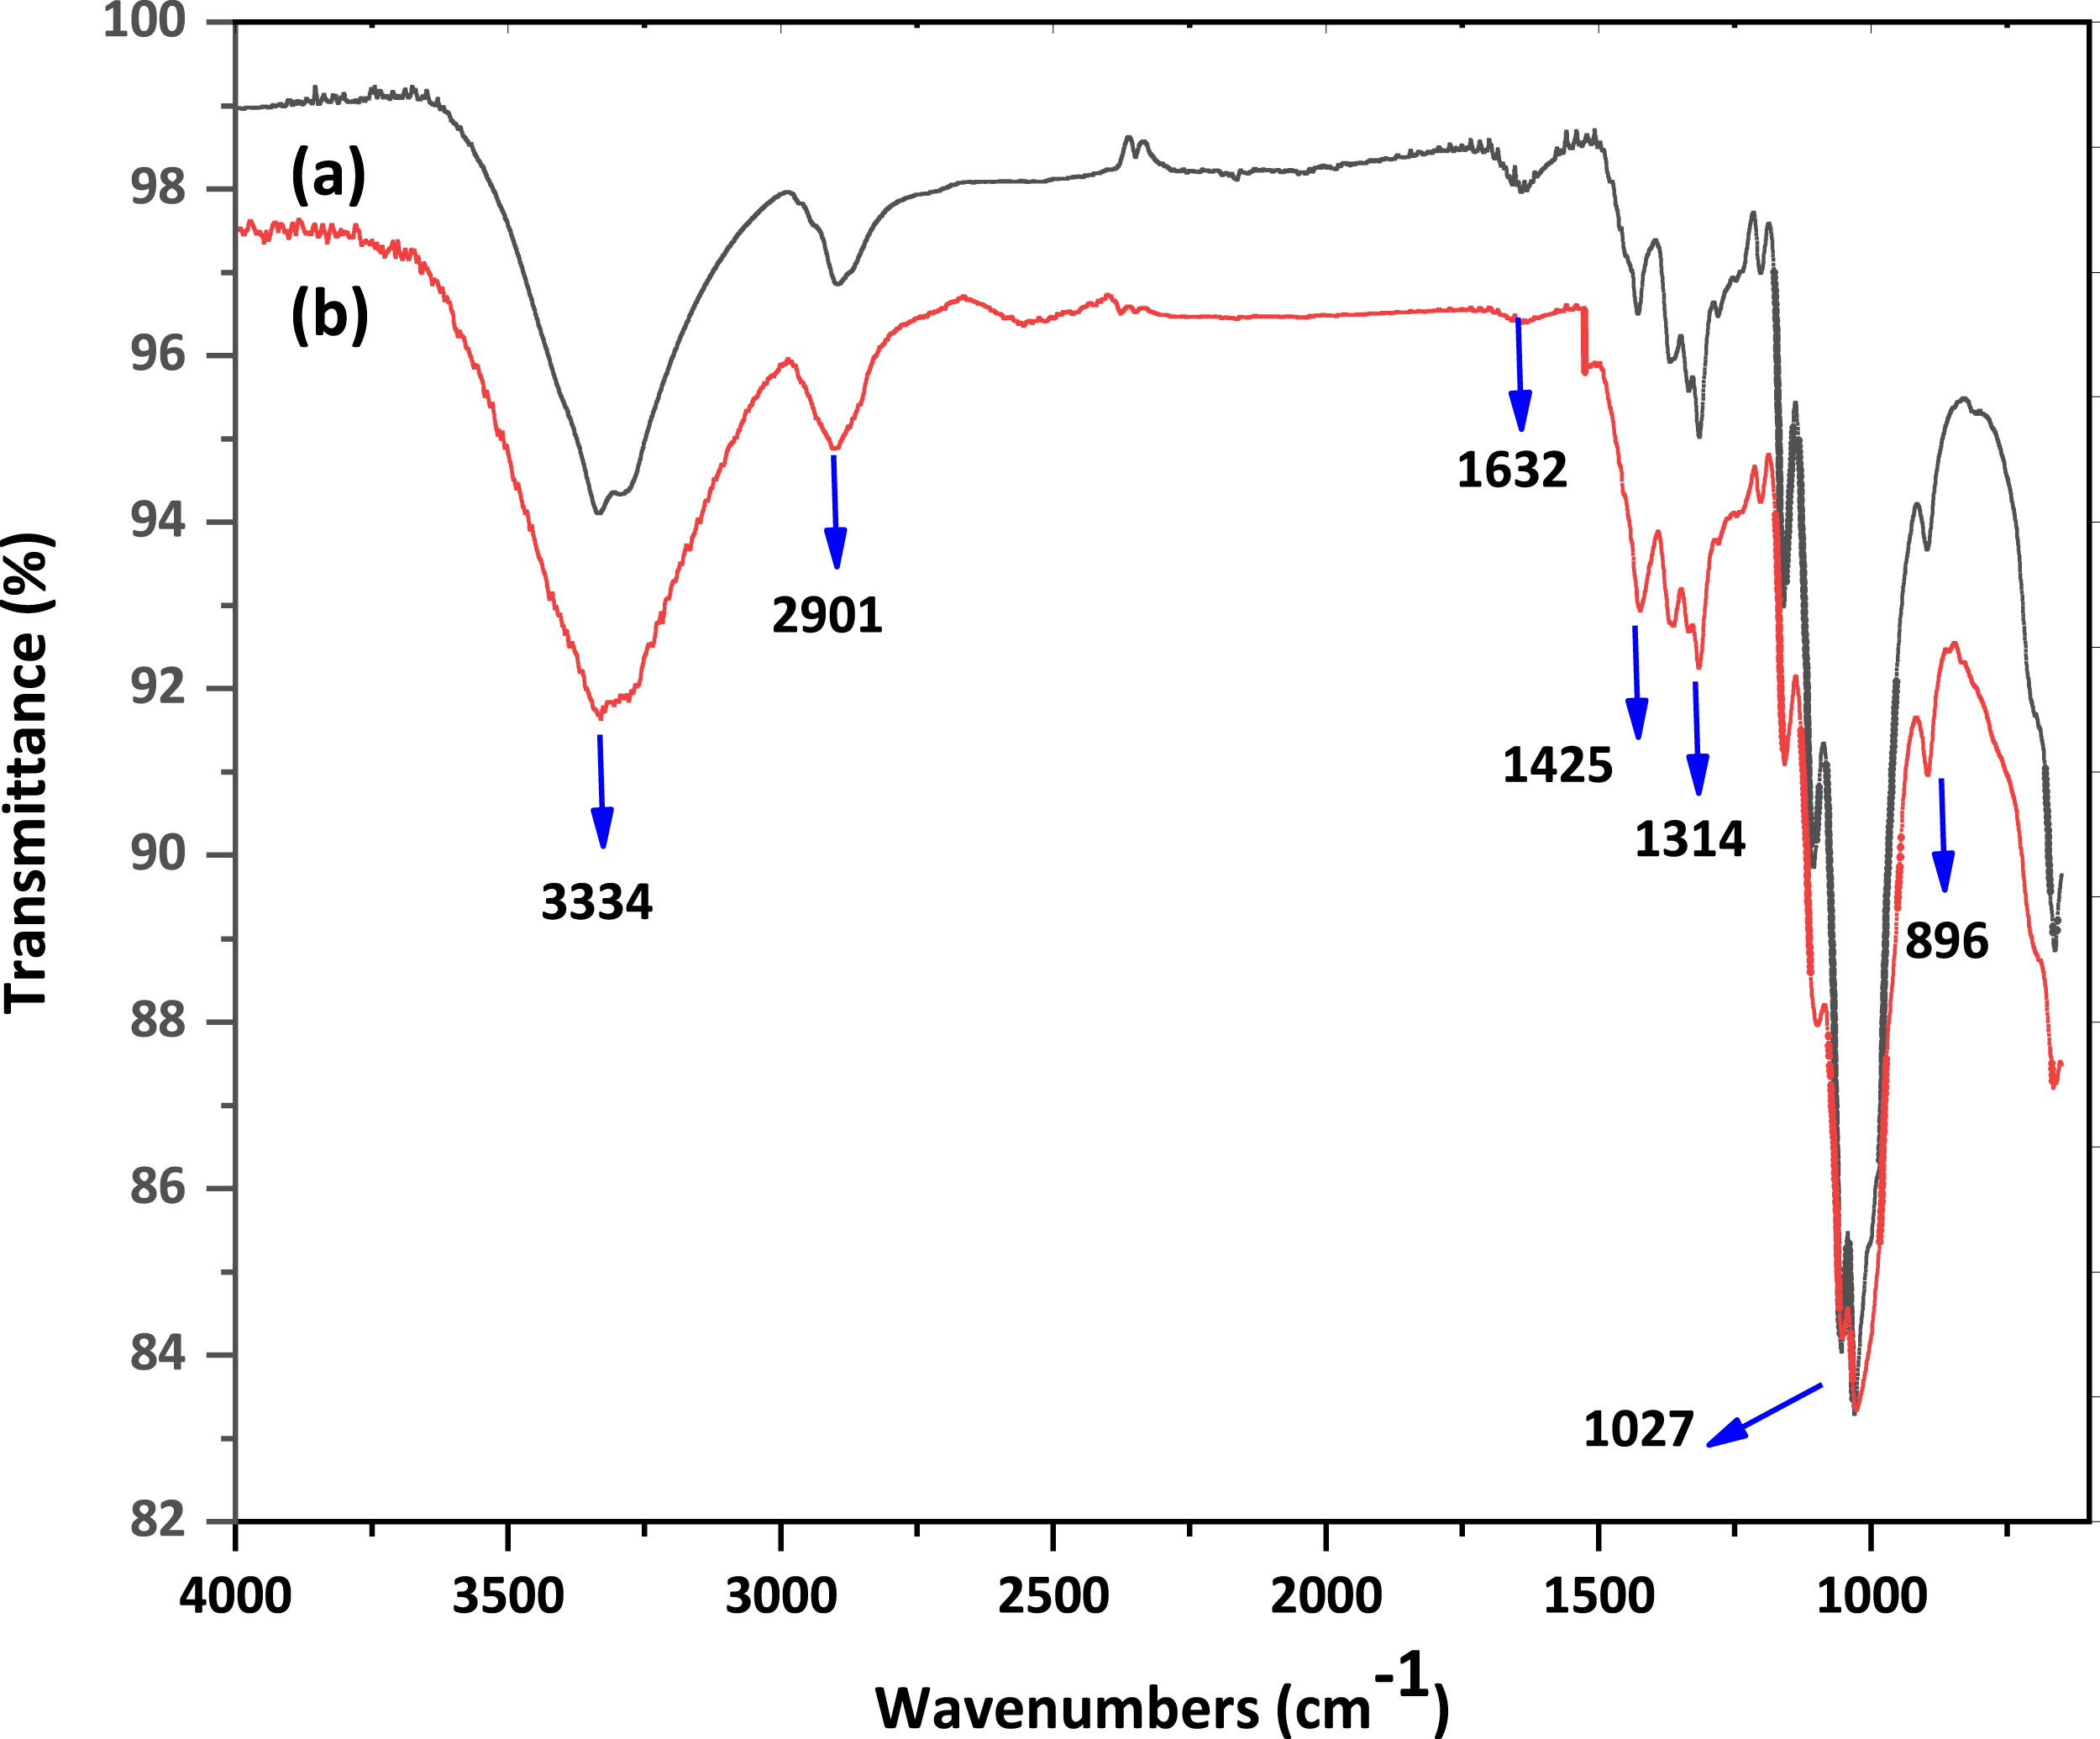
According to the comparison and table data, there are no differences in commercial cellulose and AG cellulose spectra. The lack of peaks at 1641 and 1745 cm−1 suggests that proteins and lipids have been eliminated, respectively. In addition, the absence of peaks at 1507 and 1595 cm−1 suggests the removal of lignin and the effectiveness of the bleaching procedure.8,13
X-ray diffraction analysis
The X-ray diffractogram of cellulose extracted is shown in Figure 4. X-ray diffraction of AG cellulose extracted.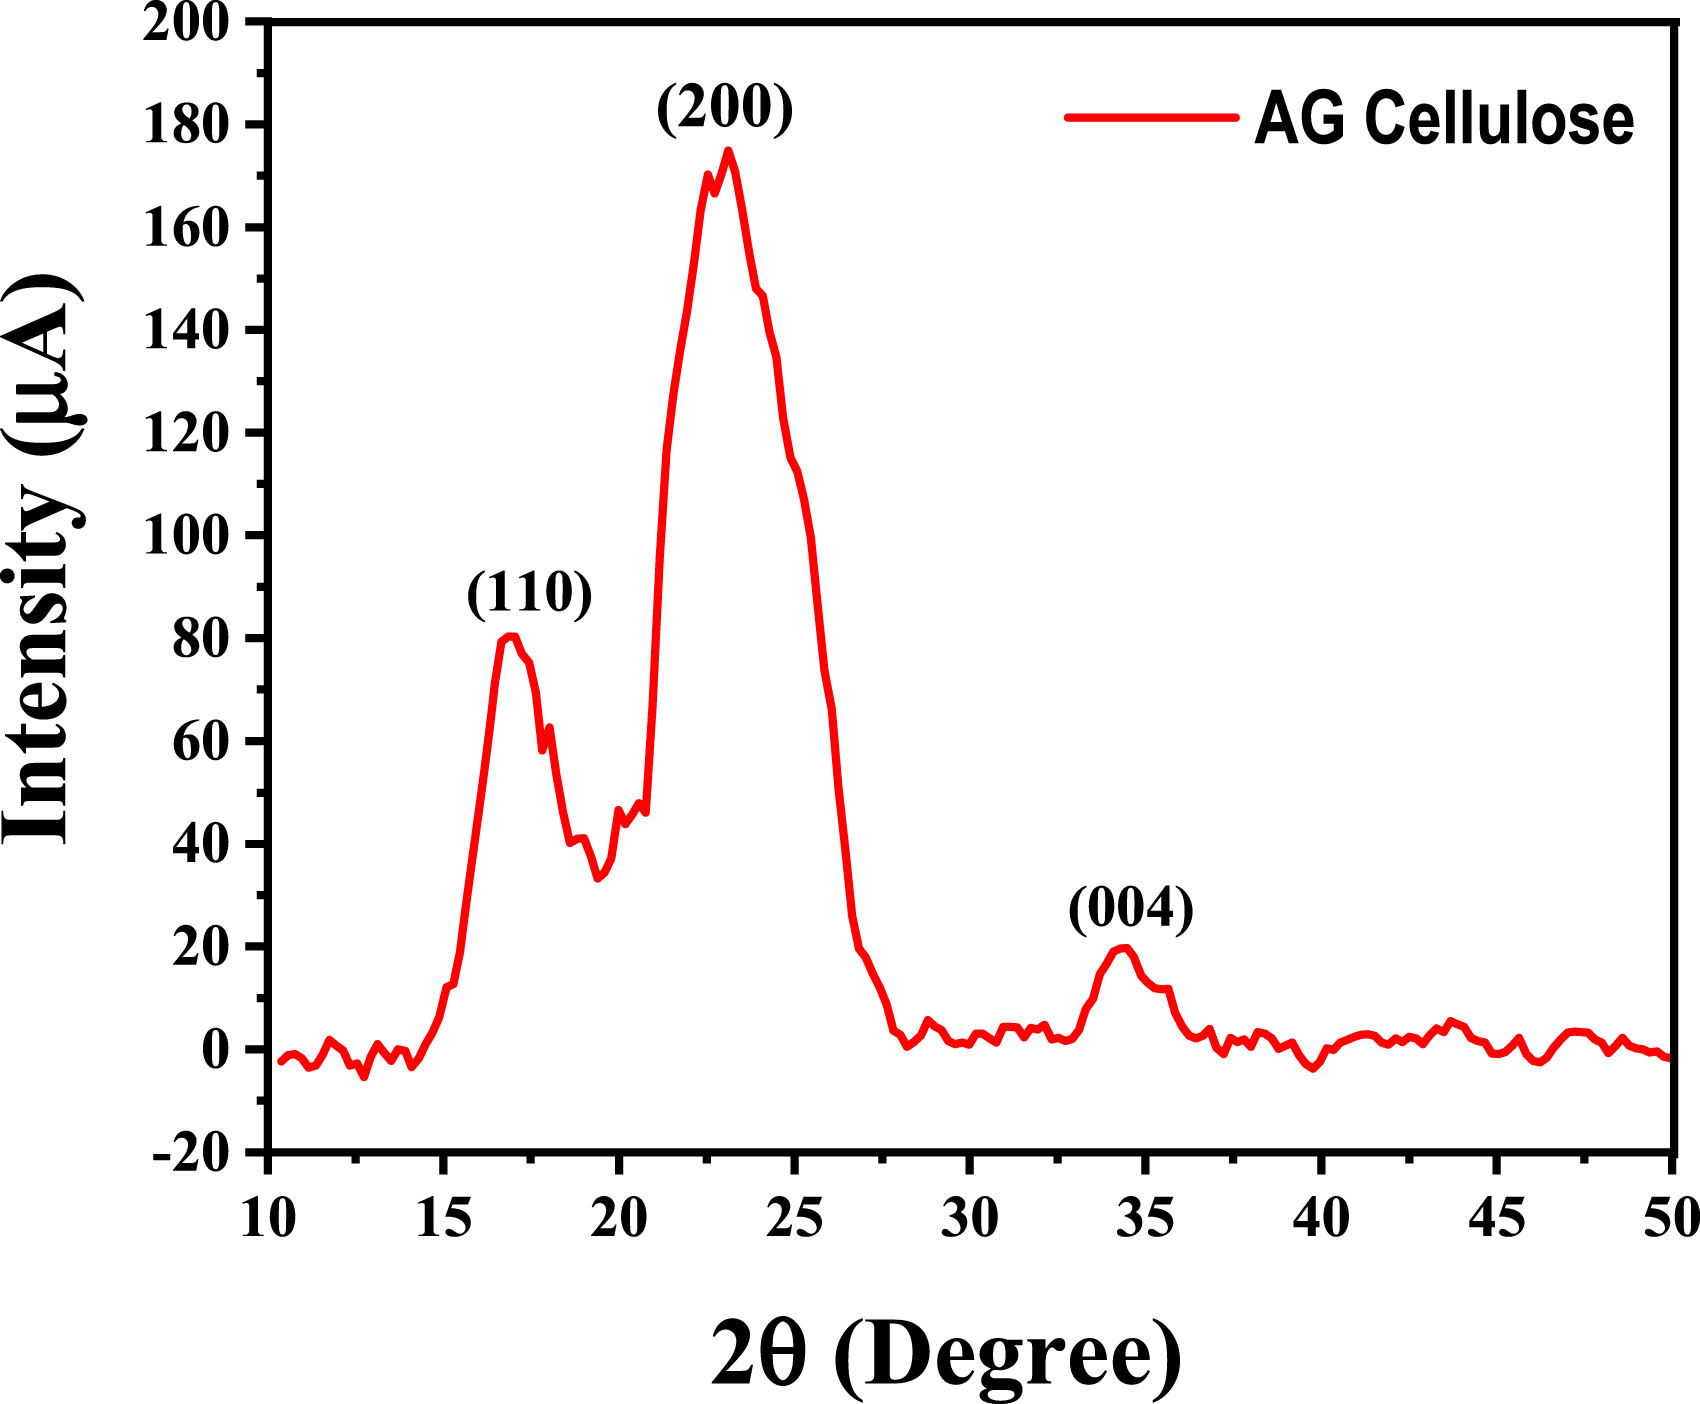
As seen by the curves, the three maximum values at about 2θ = 16°, 2θ = 22°, and 2θ = 34° correspond to the reflection on the family of cellulose I planes (110), (200), and (004).8,31 The presence of crystalline cellulose was confirmed by observing the primary crystalline peak at 22.6° with high intensity. 32
XRD patterns were used to determine the cellulose’s crystallinity index (CrI). Nevertheless, the equation indicates that the CrI of cellulose is 54%. According to this value, there is a discernible convergence with commercial cellulose; commercial cellulose has a higher crystallinity index (60%) than cellulose.8,33 Similar results were observed with S. japonica cellulose.31,34 According to Kouadri et al., 8 the bleaching process increases the crystallinity rate by increasing the crystalline phase and degrading the amorphous phase and lignin. Cellulose’s mechanical and thermal properties also rely on its crystalline structure.32,33
Thermogravimetric analysis-differential thermogravimetry analysis
TGA measurements were performed to investigate and comprehend the heat stability of isolated cellulose. TGA and DTG curves of extracted cellulose are shown in Figure 5. (a)TGA curves; (b) DTG curves of cellulose extracted from AG.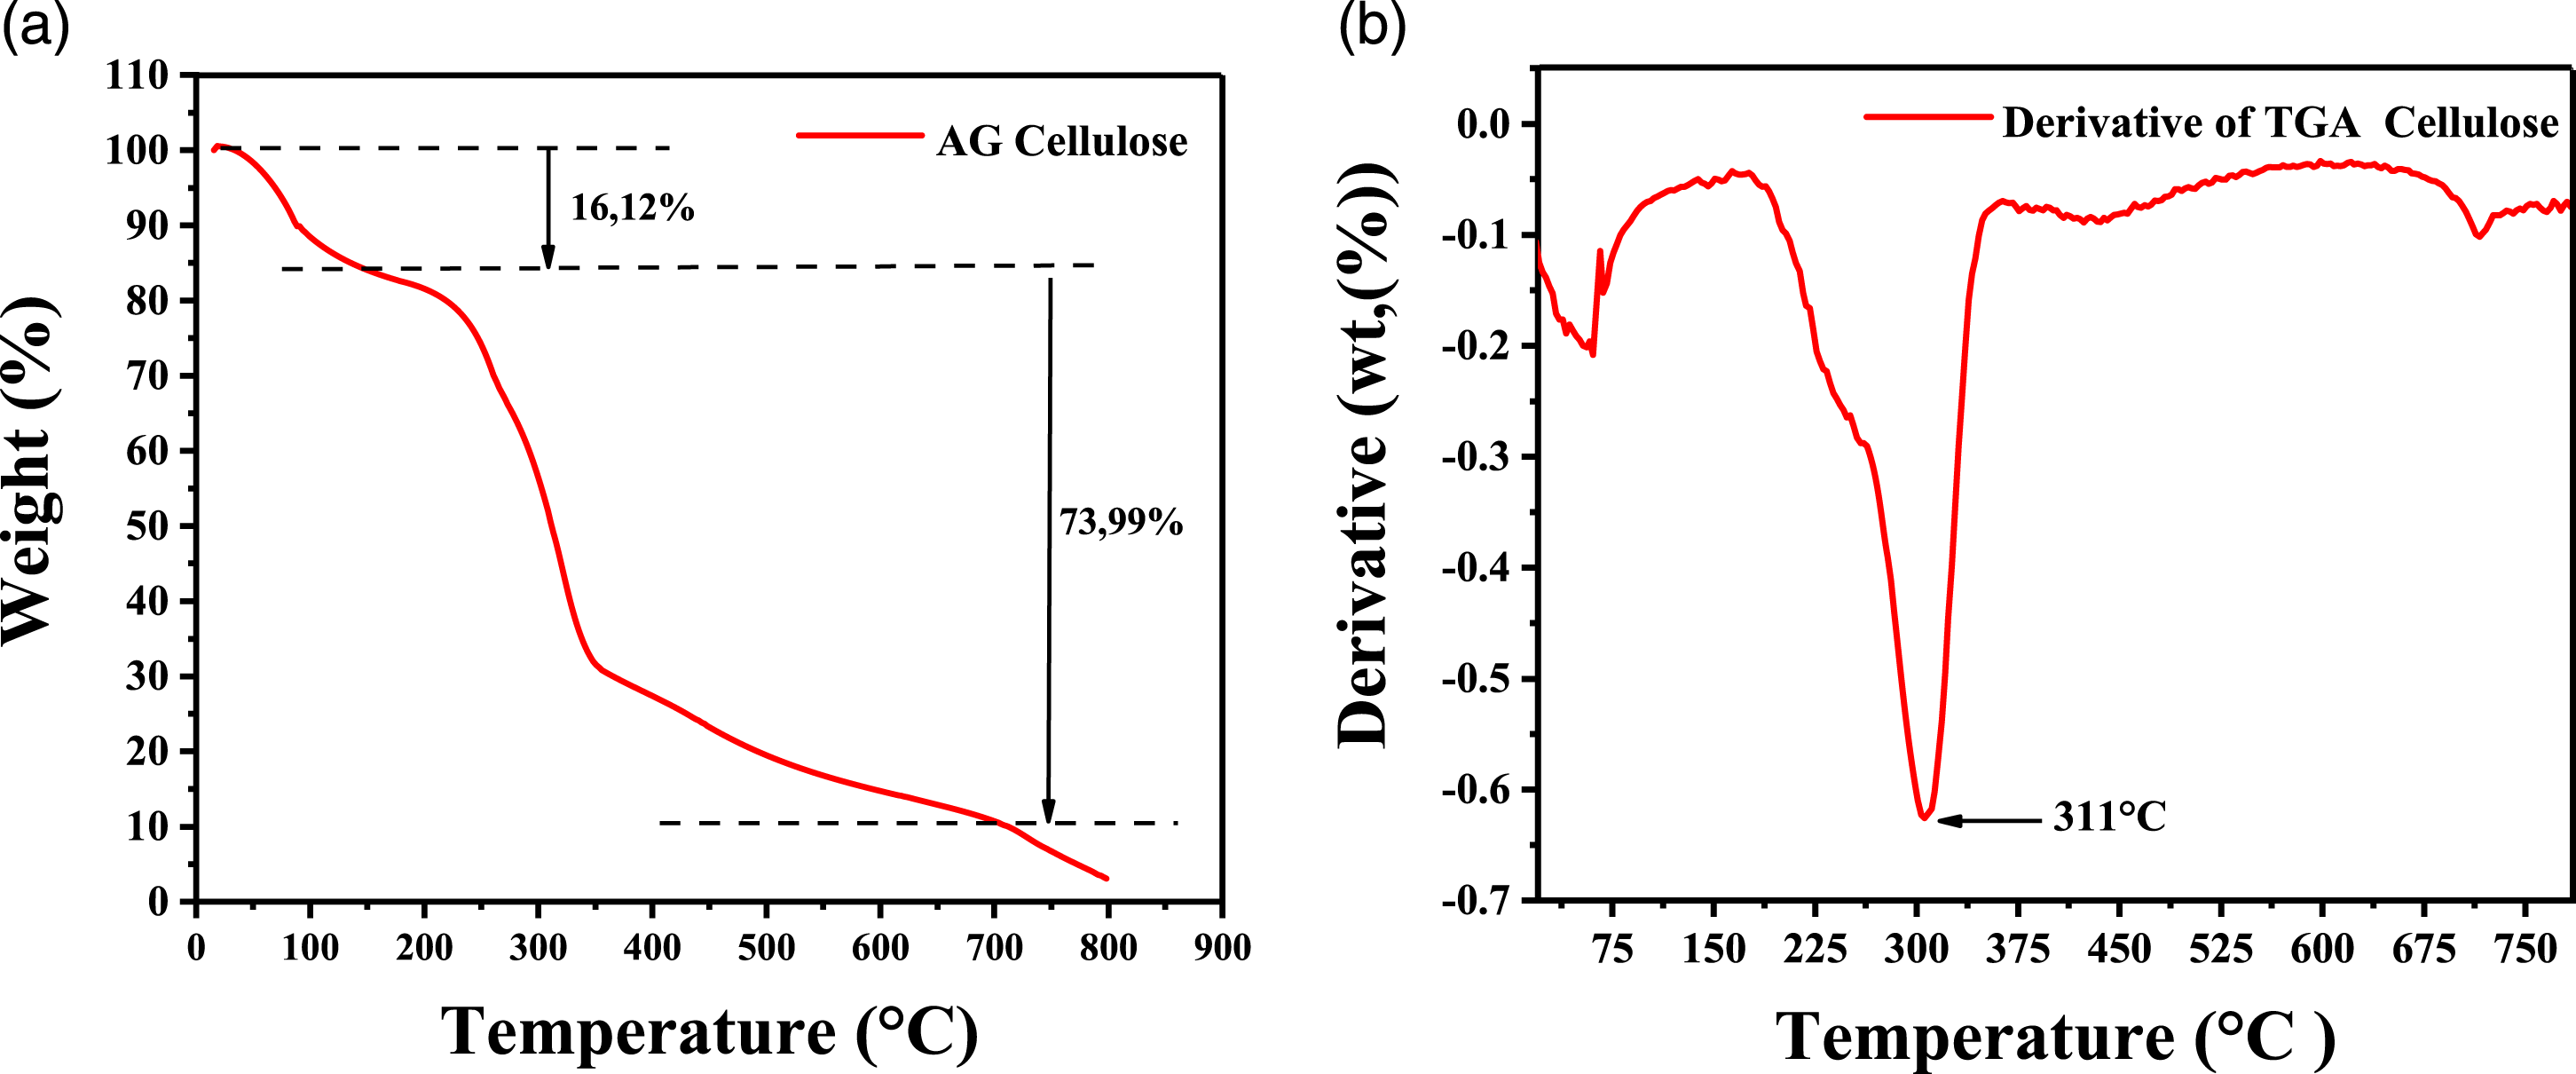
The thermal breakdown of the sample was examined using TGA from 25°C to 800°C at a rate of 10°C/min. There were three stages of heat degradation manifested by weight loss. The first zone begins at room temperature and rises to 160°C due to evaporation and water loss.13,35 Cellulose was hydrophilic and subjected to dehydration, in which water was released due to decreased intermolecular interactions and hydrogen bonding during regeneration.32,36 The weight loss in these ranges is about 16.12%.
The second transition region, from 160 to 750°C, is characteristic of the degradation and depolymerization of extracted cellulose.22,37 The most significant peak of the derivative DTG is 311°C (Figure 5(b)), which is the temperature at which the oxidation process begins.32,38 In this range, the overall weight loss was roughly 73.99% by weight. The third region occurred above 750°C due to the decomposition of carbonaceous matter, with a negligible amount of solid residue remaining, perhaps due to cellulose impurities.36,37
The extracted cellulose is a uniform substance. This result is supported by more research. 39 They are ncrease cellulose’s heat stability through chemical purity.39,40 Cellulose and lignin are primarily responsible for the thermal stability of the plant wall. Sevrel studies have demonstrated cellulose is more stable than lignin and hemicellulose. 41
Differential scanning calorimetry analysis
The DSC thermogram of cellulose from 20°C to 350°C is depicted in Figure 6. DSC thermograms of the cellulose extracted from AG.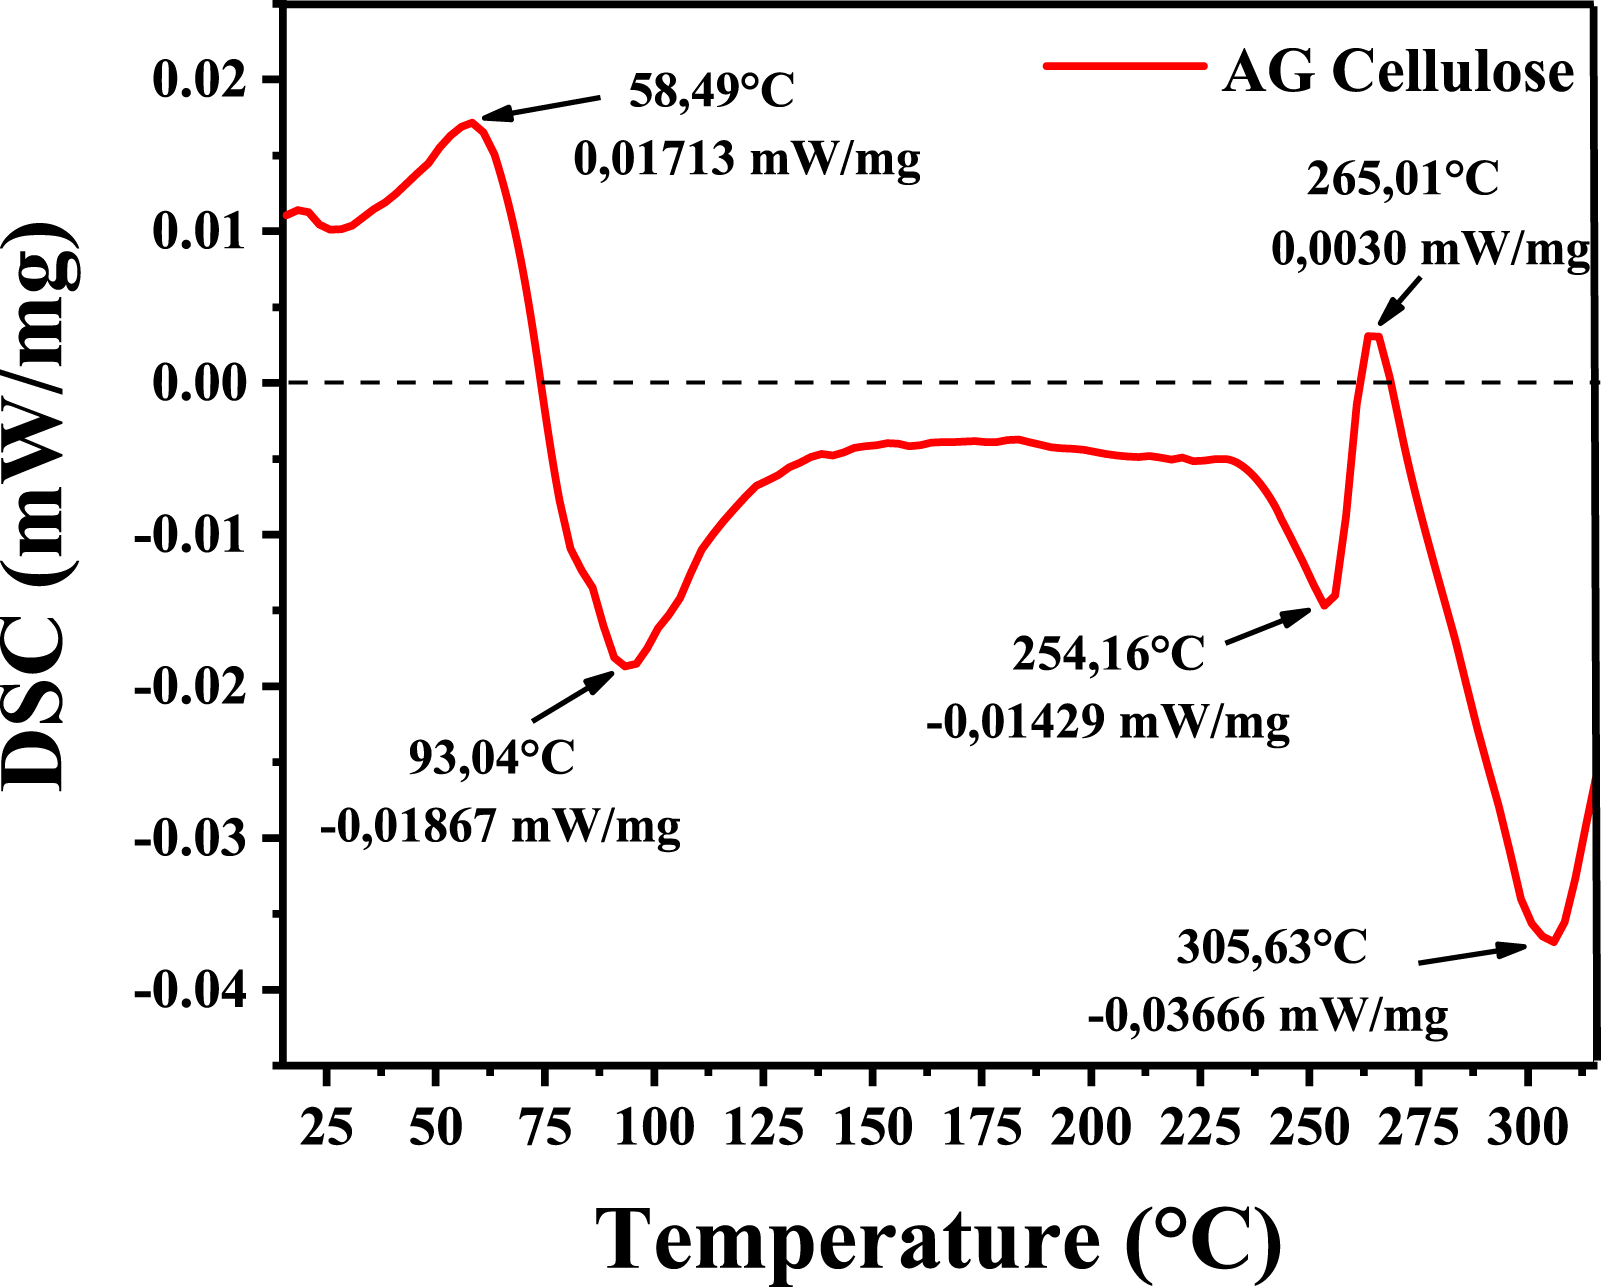
The first broad exothermic and endothermic peaks occur at around 58.49°C and 93.04°C, respectively. It is hypothesized that this range of endotherm transitions corresponds to an amorphous component, which prompted the rearrangement of the molecular chains. 42 There were no peaks relating to hemicellulose at about 150°C. These results demonstrate the separated cellulose’s exceptional purity and thermal stability. 32
The second endothermic transition occurred between 254.16 °C and 265.01°C, corresponding to the beginning degradation temperature. The presence of a minor second endothermic peak indicates that heat breakdown of the cellulose has commenced.35,36 The third endothermic transition coincided with the cellulose crystallite phase. The endothermic transition at 305.63°C was attributed to the melting of cellulose, which corresponded to the breaking of glycosidic linkages and the depolymerization of cellulose.36,41,43
Moreover, the thermal transitions in this temperature range are connected with the initiation of thermal degradation of cellulose, which consists of the rearrangement of molecular chains, followed by the breaking of glucosidic bonds along molecular chains and intermolecular cross-linking.36,44
Scanning electron microscopy analysis
The morphology of the material extracted was observed with the help of SEM images. Figure 7 gives an overview of the morphology of the raw material (AG) and cellulose. SEM micrographs of (a) raw material (AG); (b) extracted cellulose.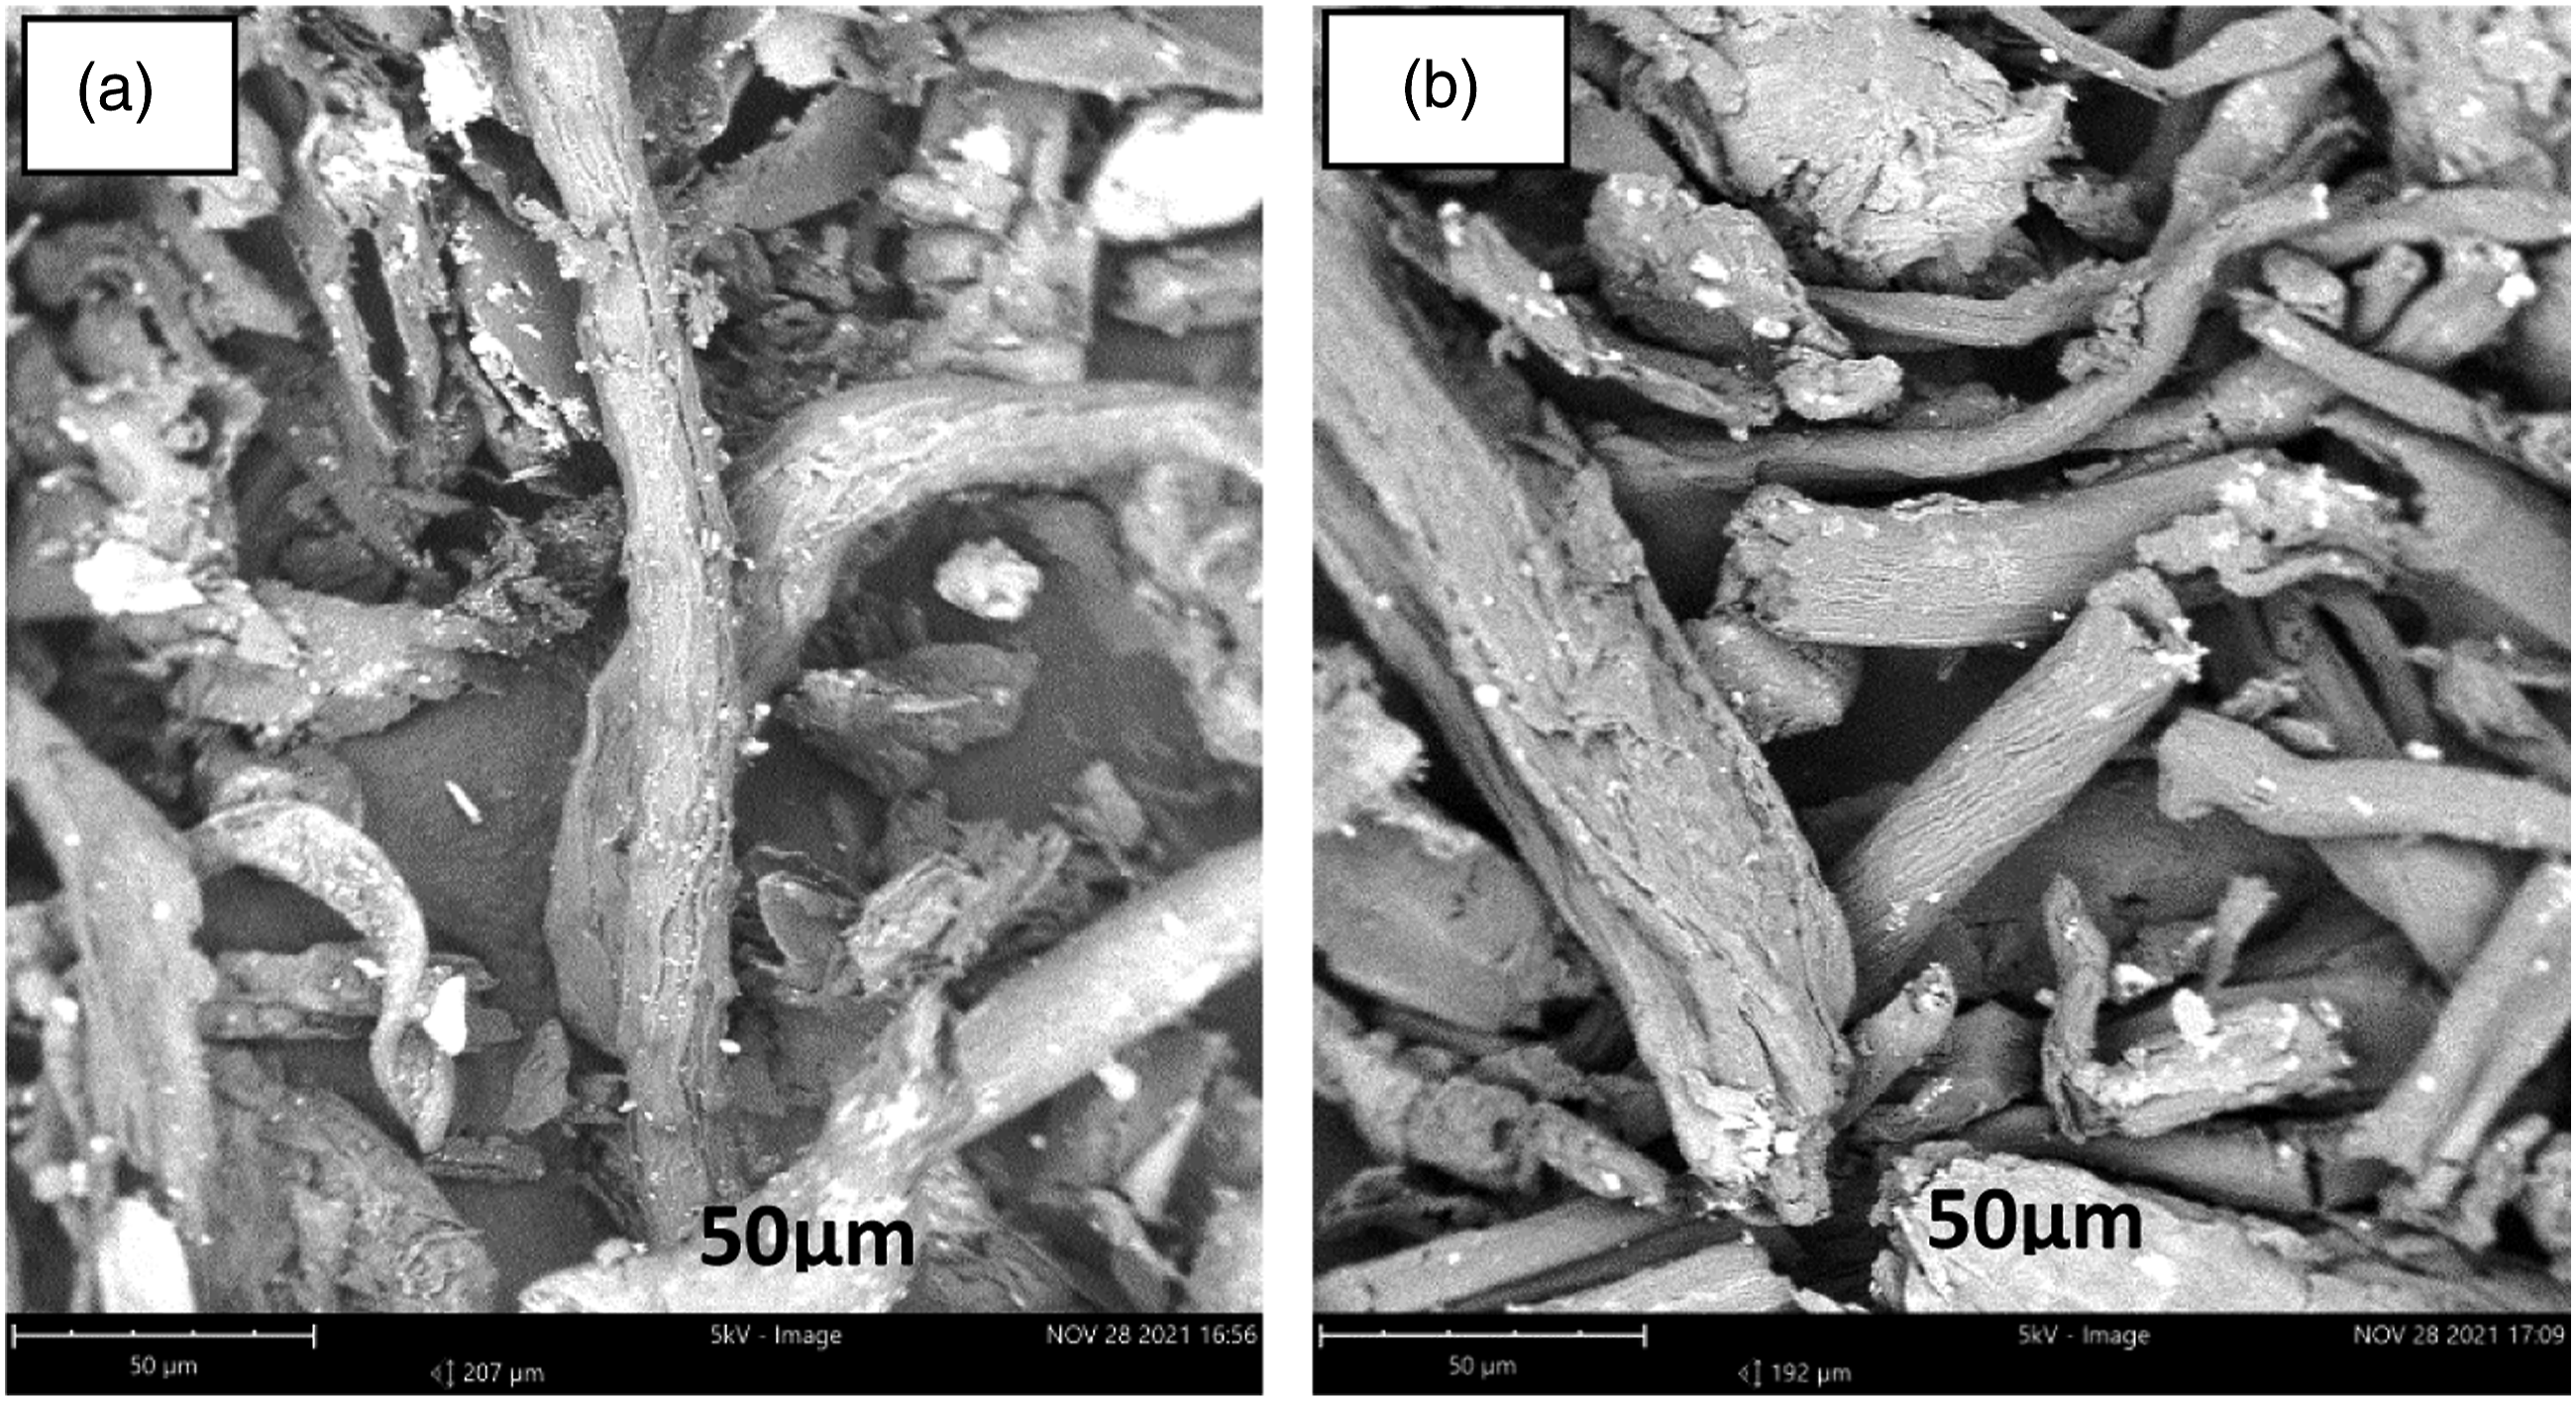
As illustrated in Figure 7(a), the surface of the raw material was covered with intercellular components constituted of hemicelluloses and lignin. 45 Compared to the raw material, the extracted cellulose surface (Figure 7(b)) became rougher and cleaner, showing that the hemicellulose and lignin were effectively removed by the chemical treatments.46,47 The SEM image of cellulose isolated from AG reveals a structure resembling elongated threads, which was the original structure of the AG.48,49
The nearly preserved structure of AG following hydrolysis was likely due to the strong hydrogen bonds between hydroxyl groups in cellulose. Ref. 50 also observed a similar outcome. 50
Variables that influence the final mass of cellulose
The time of polysaccharide extraction is a crucial factor influencing polysaccharide efficacy. As illustrated in Figure 8(a), the mass of the cellulose rose significantly (from 1 to 4 h) (max: 1.39 g/4 h); nevertheless, the mass decreased over time, suggesting that extending the extraction duration may result in polysaccharide degradation.8,51,52 Effects of different (a) times; (b) temperatures; (c) concentration of NaOH on the final mass of AG cellulose.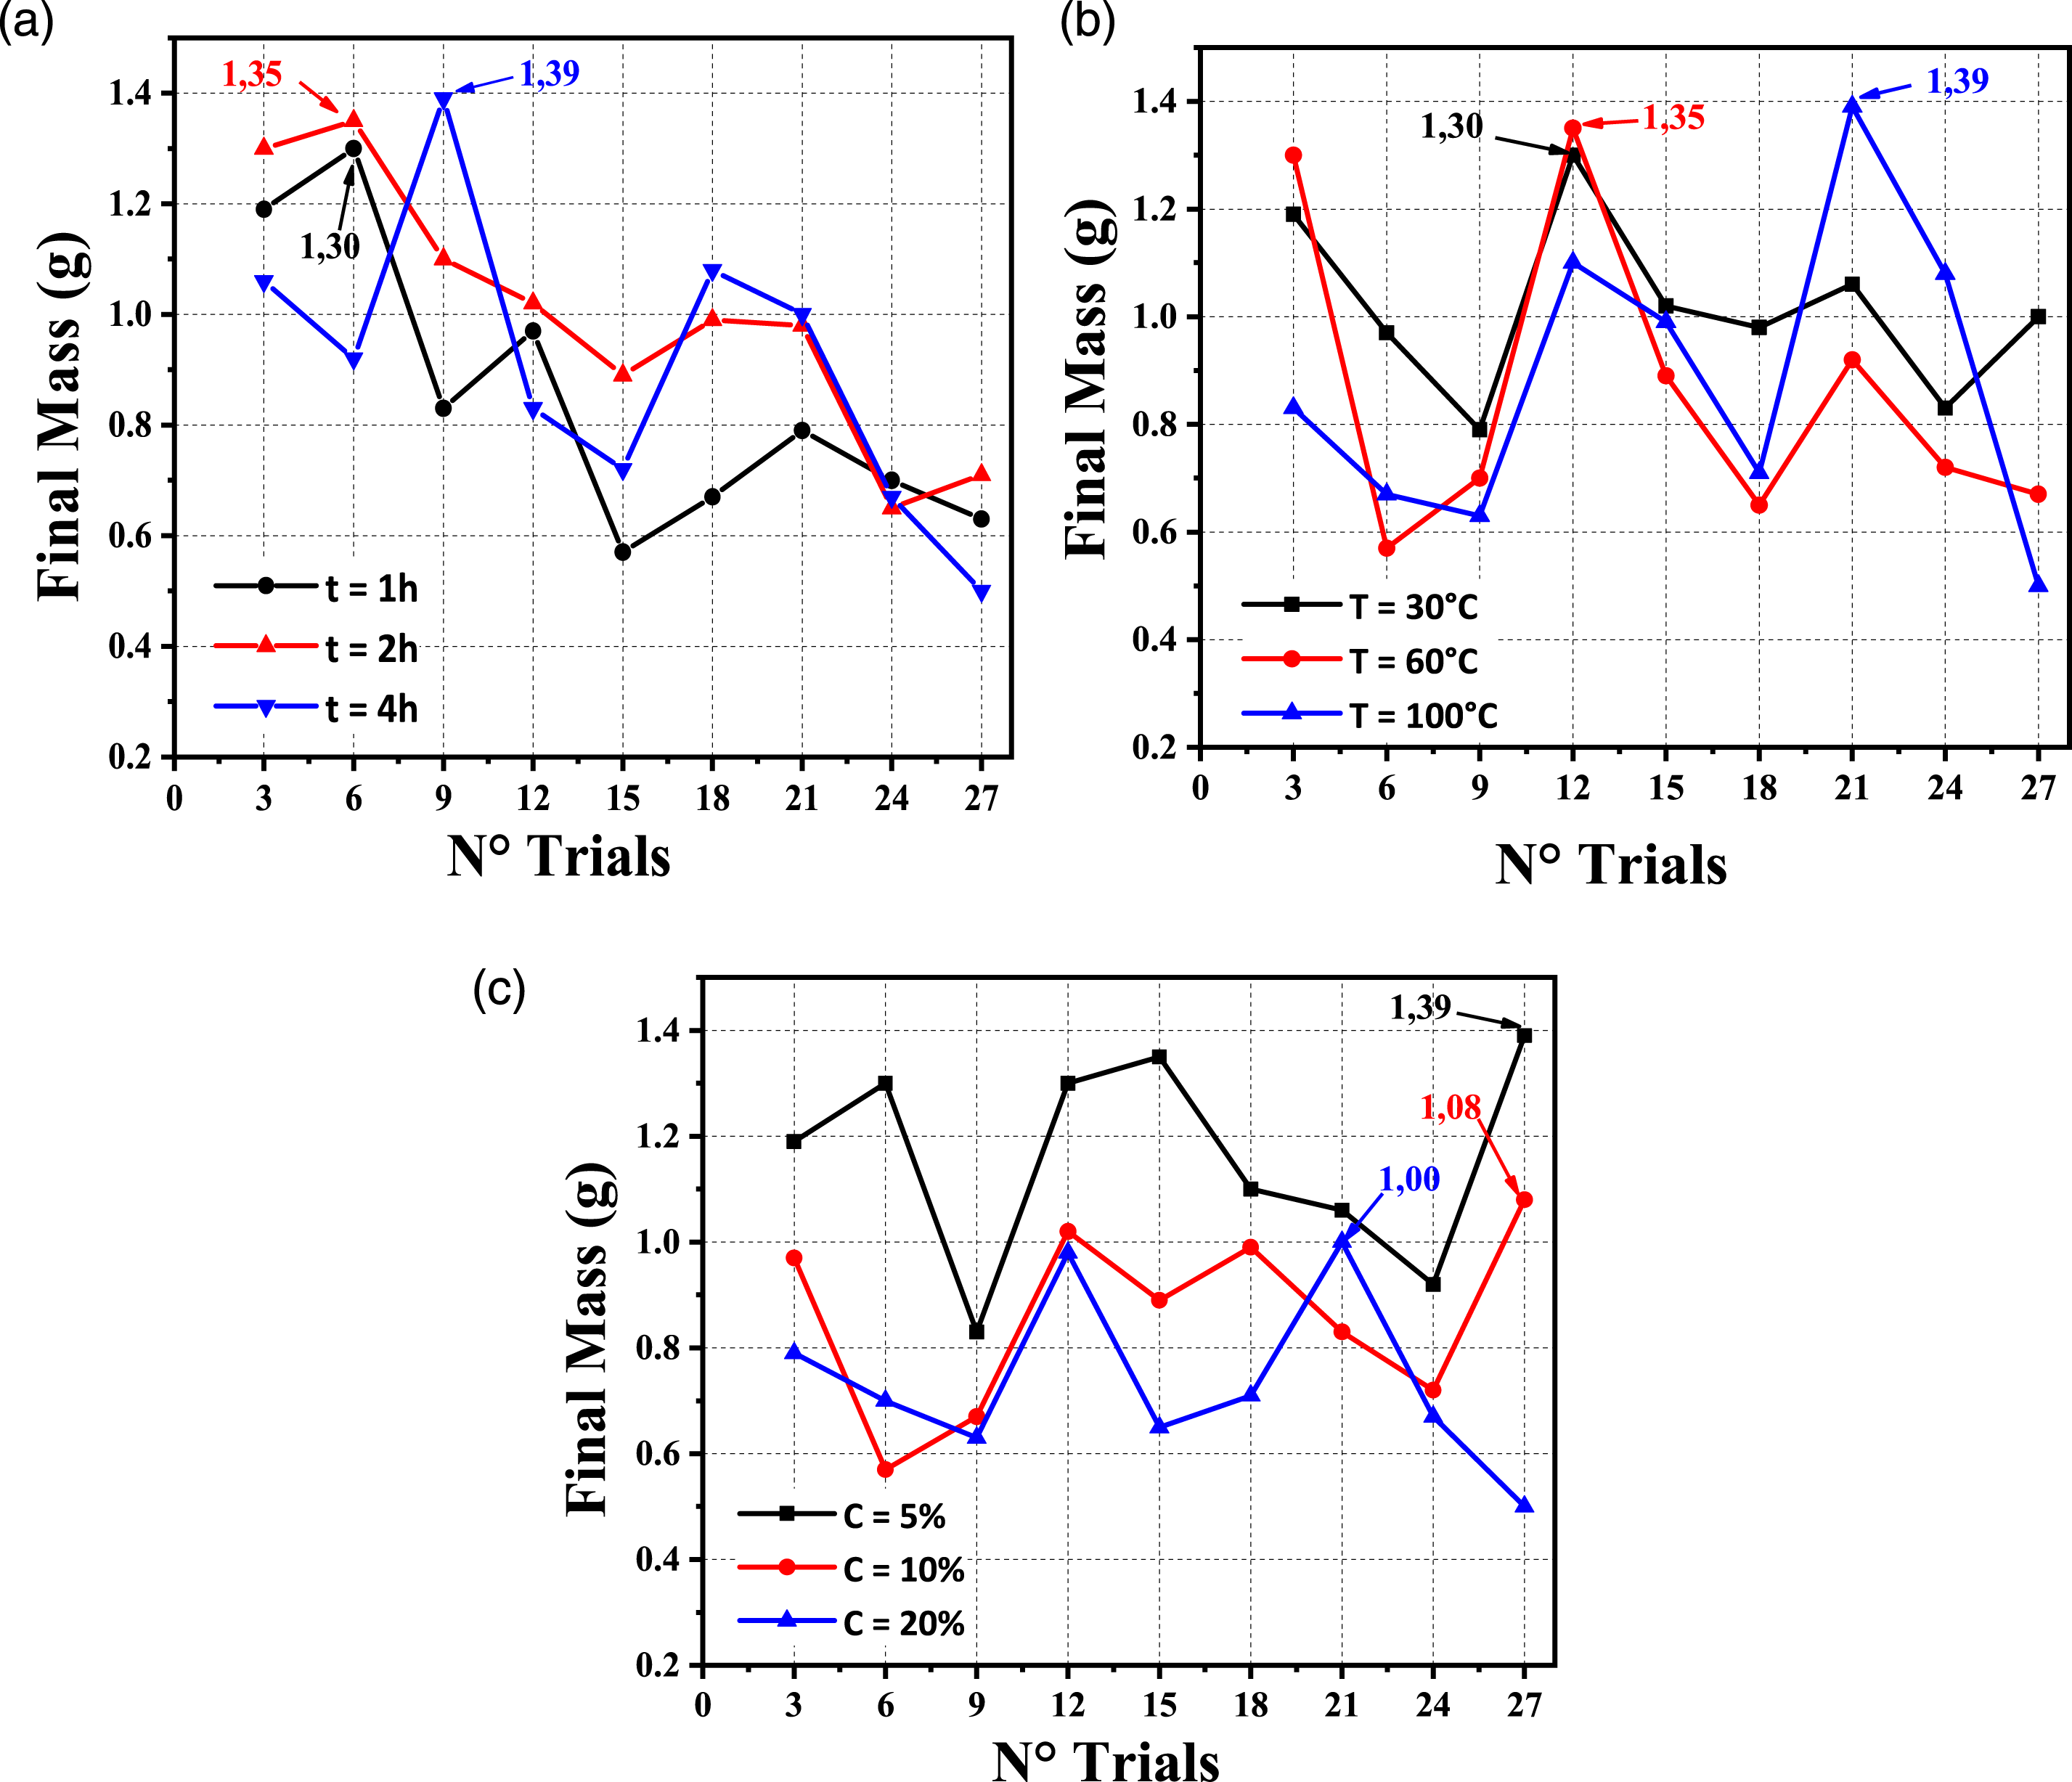
Also, the temperature has substantially increased the final mass of cellulose (Figure 8(b)) (max: 1.39 g/100°C) and then reduced it. According to other studies, the positive effect of extraction temperature is due to the solubility of cellulose in the solvent at higher temperatures.8,53,54
Along with previous factors, the sodium hydroxide concentration is another critical variable during the extraction process (Figure 8(c)). With increasing solvent concentration, the mass of cellulose has decreased. This result indicates that the increase in the solvent concentration leads to the degradation of cellulose.51,53,54
Model fitting and statistical analysis
Experimental data for AG cellulose with independent variables.
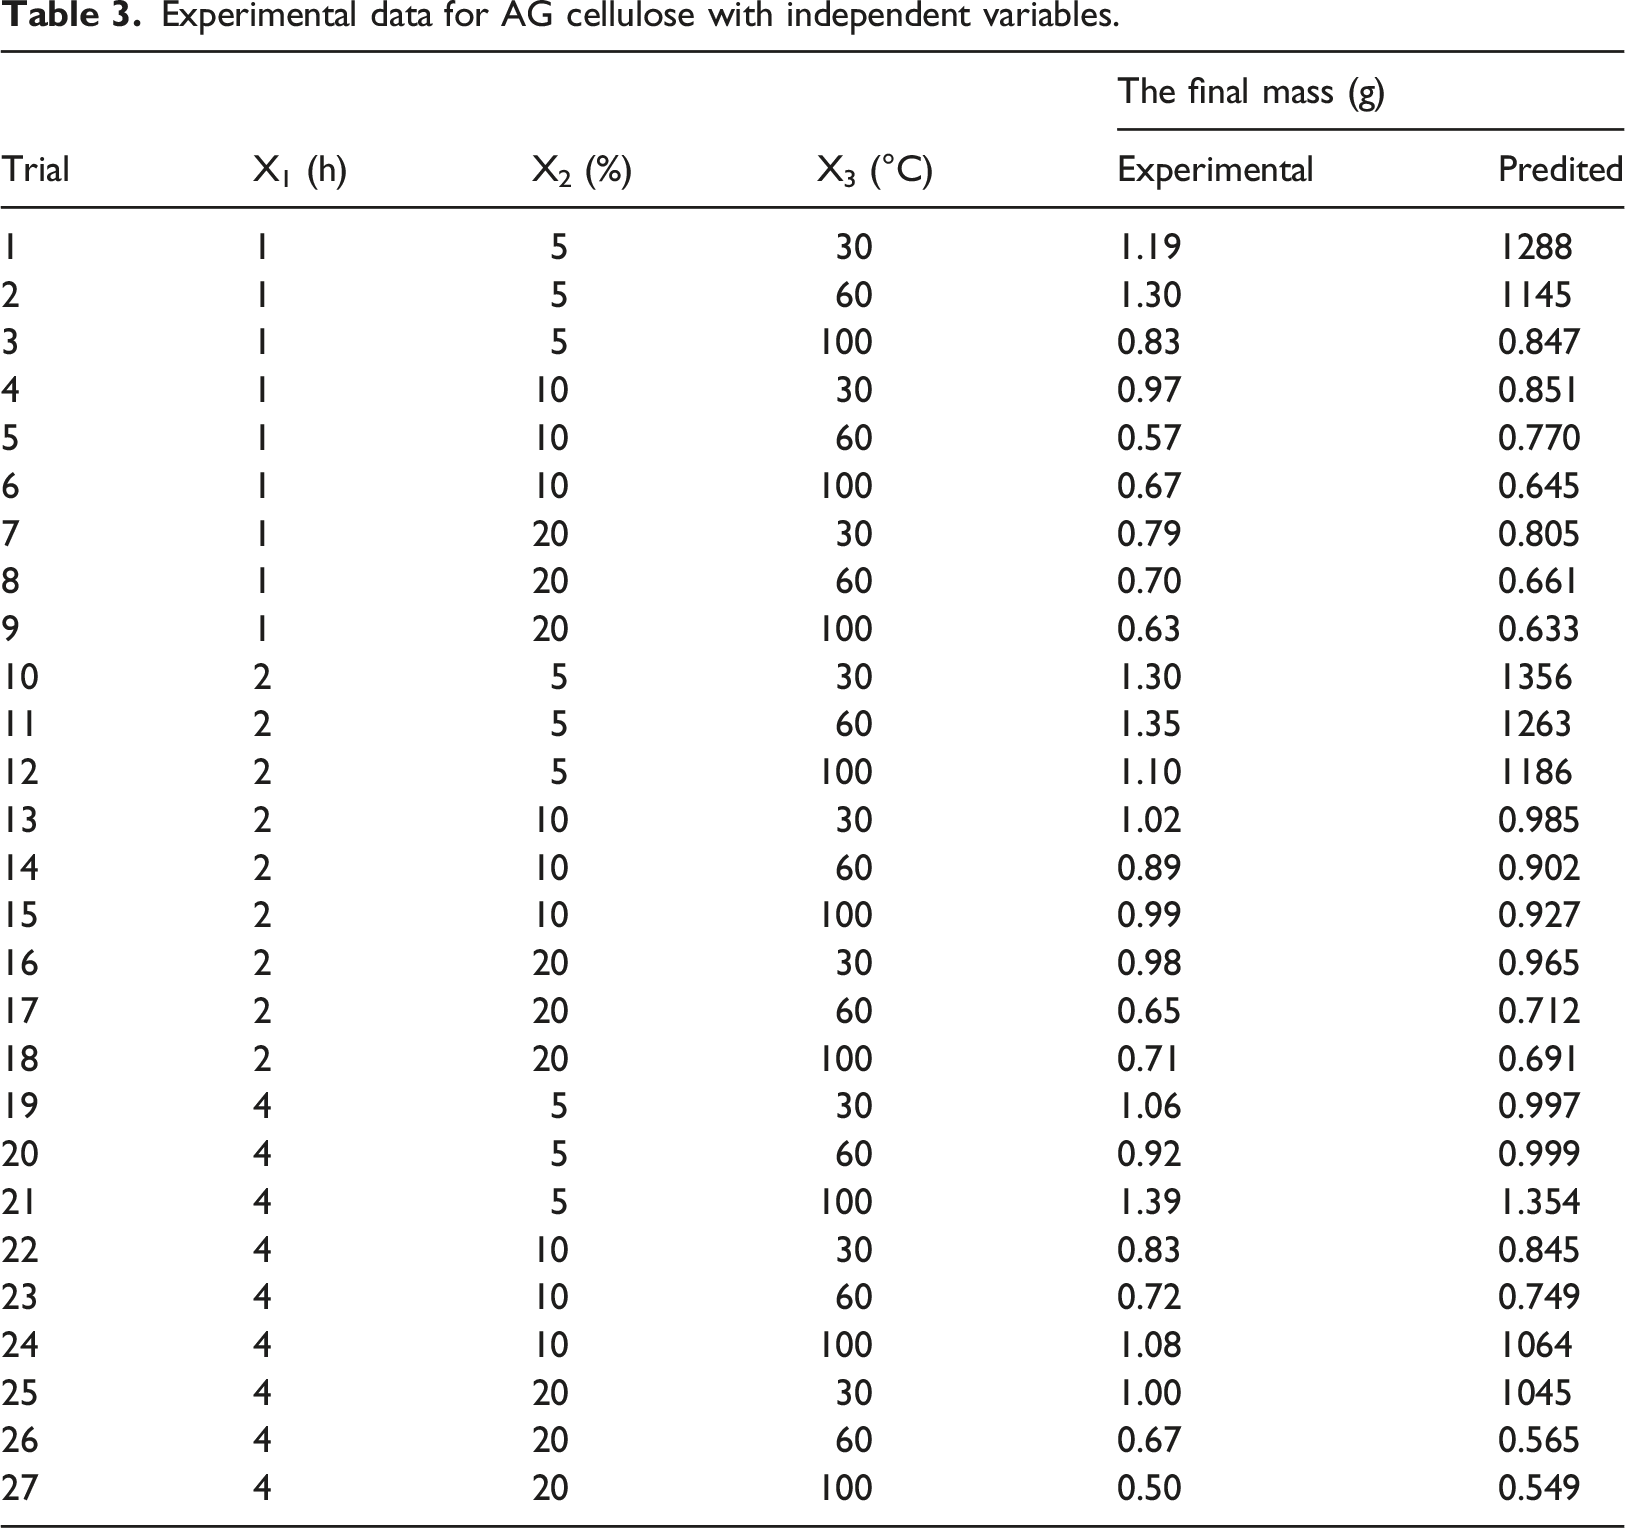
The complete quadratic equation was utilized to correlate the independent parameters with cellulose’s final mass and predict the relationships between the independent variables and the dependent variable. This equation can be expressed as follows: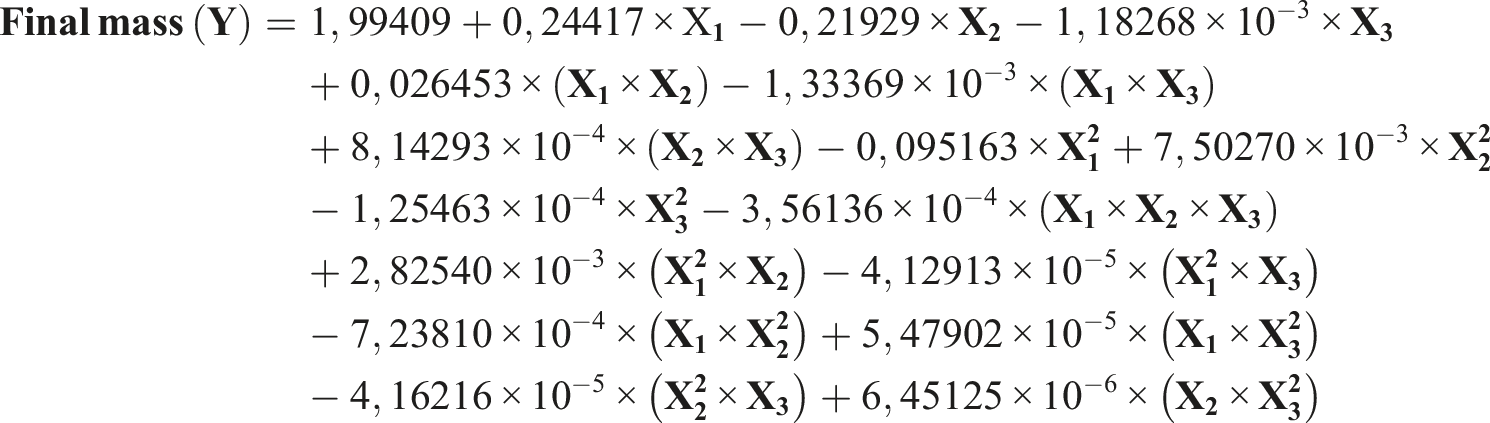
ANOVA result for experimental data.
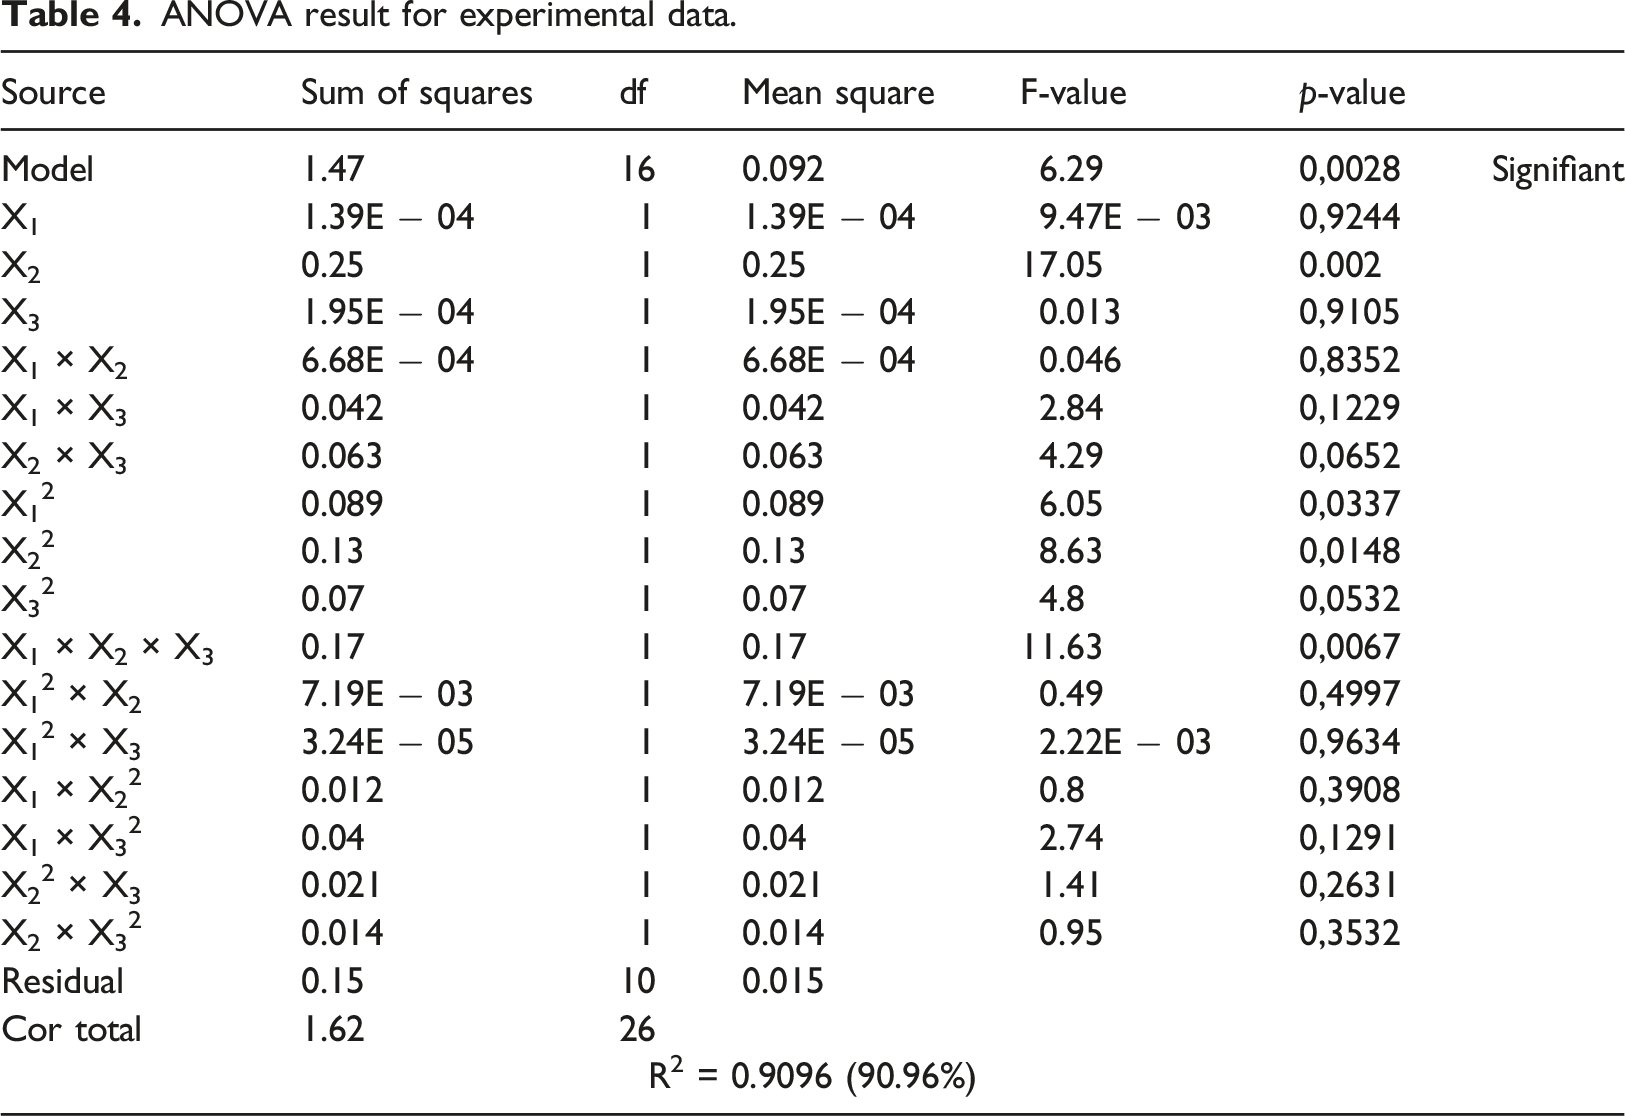
However, based on several previous researches, such as,56,57 it was found that a reduced model must be used to obtain the best Response surface methodology correctly.
Influence of extraction factors on surface response
Response surfaces were generated using Design-Expert software to evaluate the effects of variables and their interactions on the mass of cellulose. Figure 9 depicts a 3-D response surface plot and a 2-D contour plot, which were especially helpful for estimating the interaction effects of the parameters on the responses. Response surface (3-D) and contour plots showing the effects of variables on the final mass of cellulose.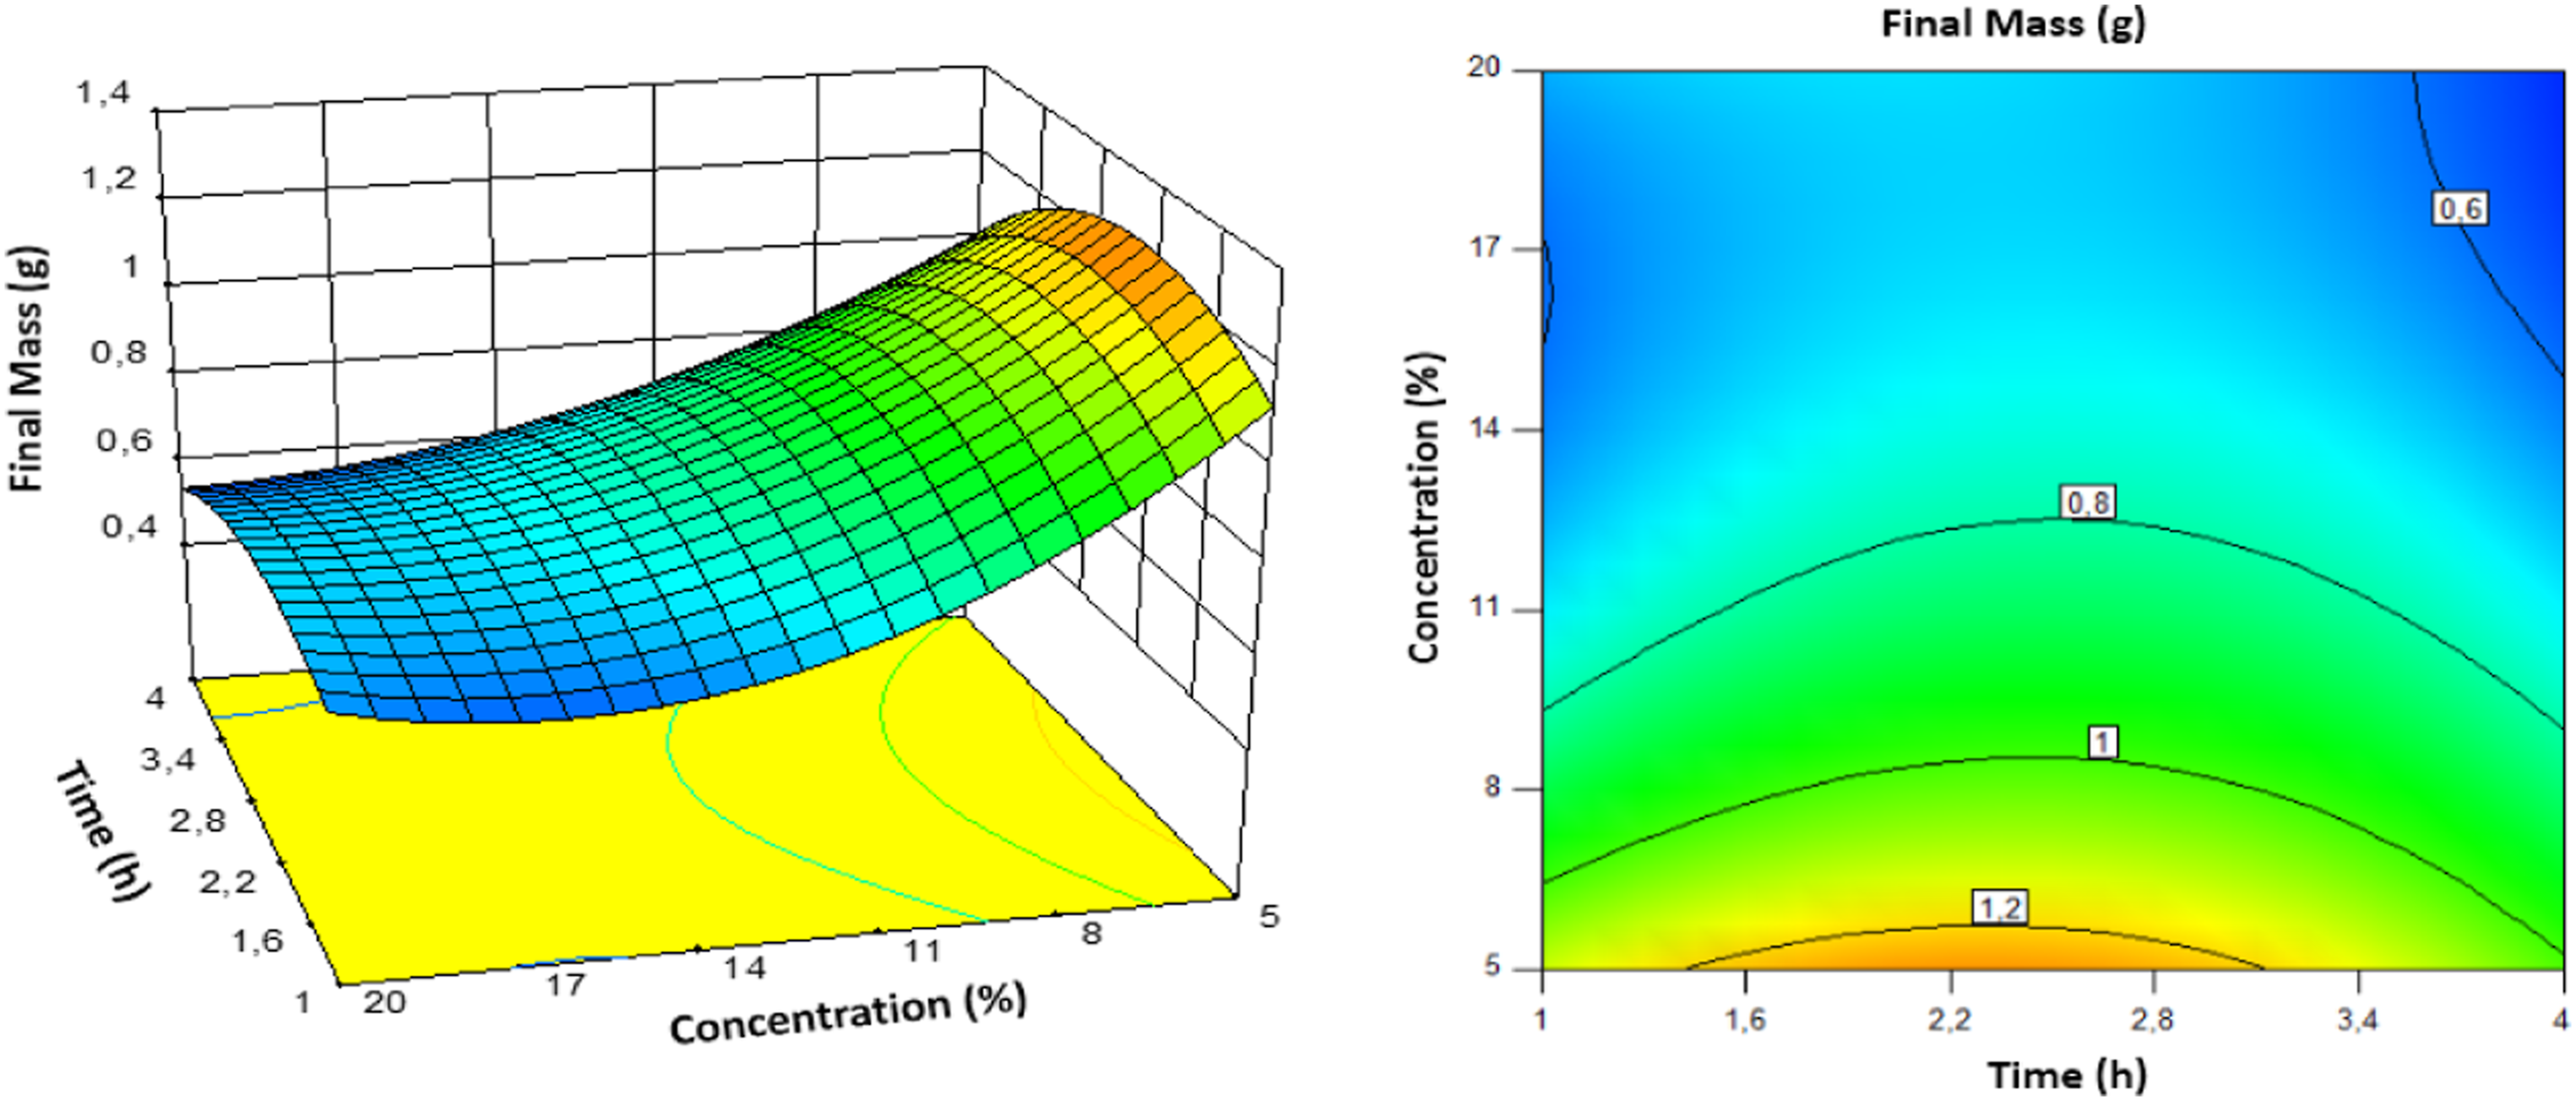
These graphs illustrate the simultaneous influence of the three variables on the response. The graphs in Figure 9 demonstrate that the extraction mass of cellulose increased as extraction temperature and time increased from 30 to 100°C and 1 to 4 h, respectively. 58 The optimal cellulose extraction mass is achieved by combining a medium extraction time with the lowest possible extraction temperature and NaOH concentration.
Optimization for cellulose extraction
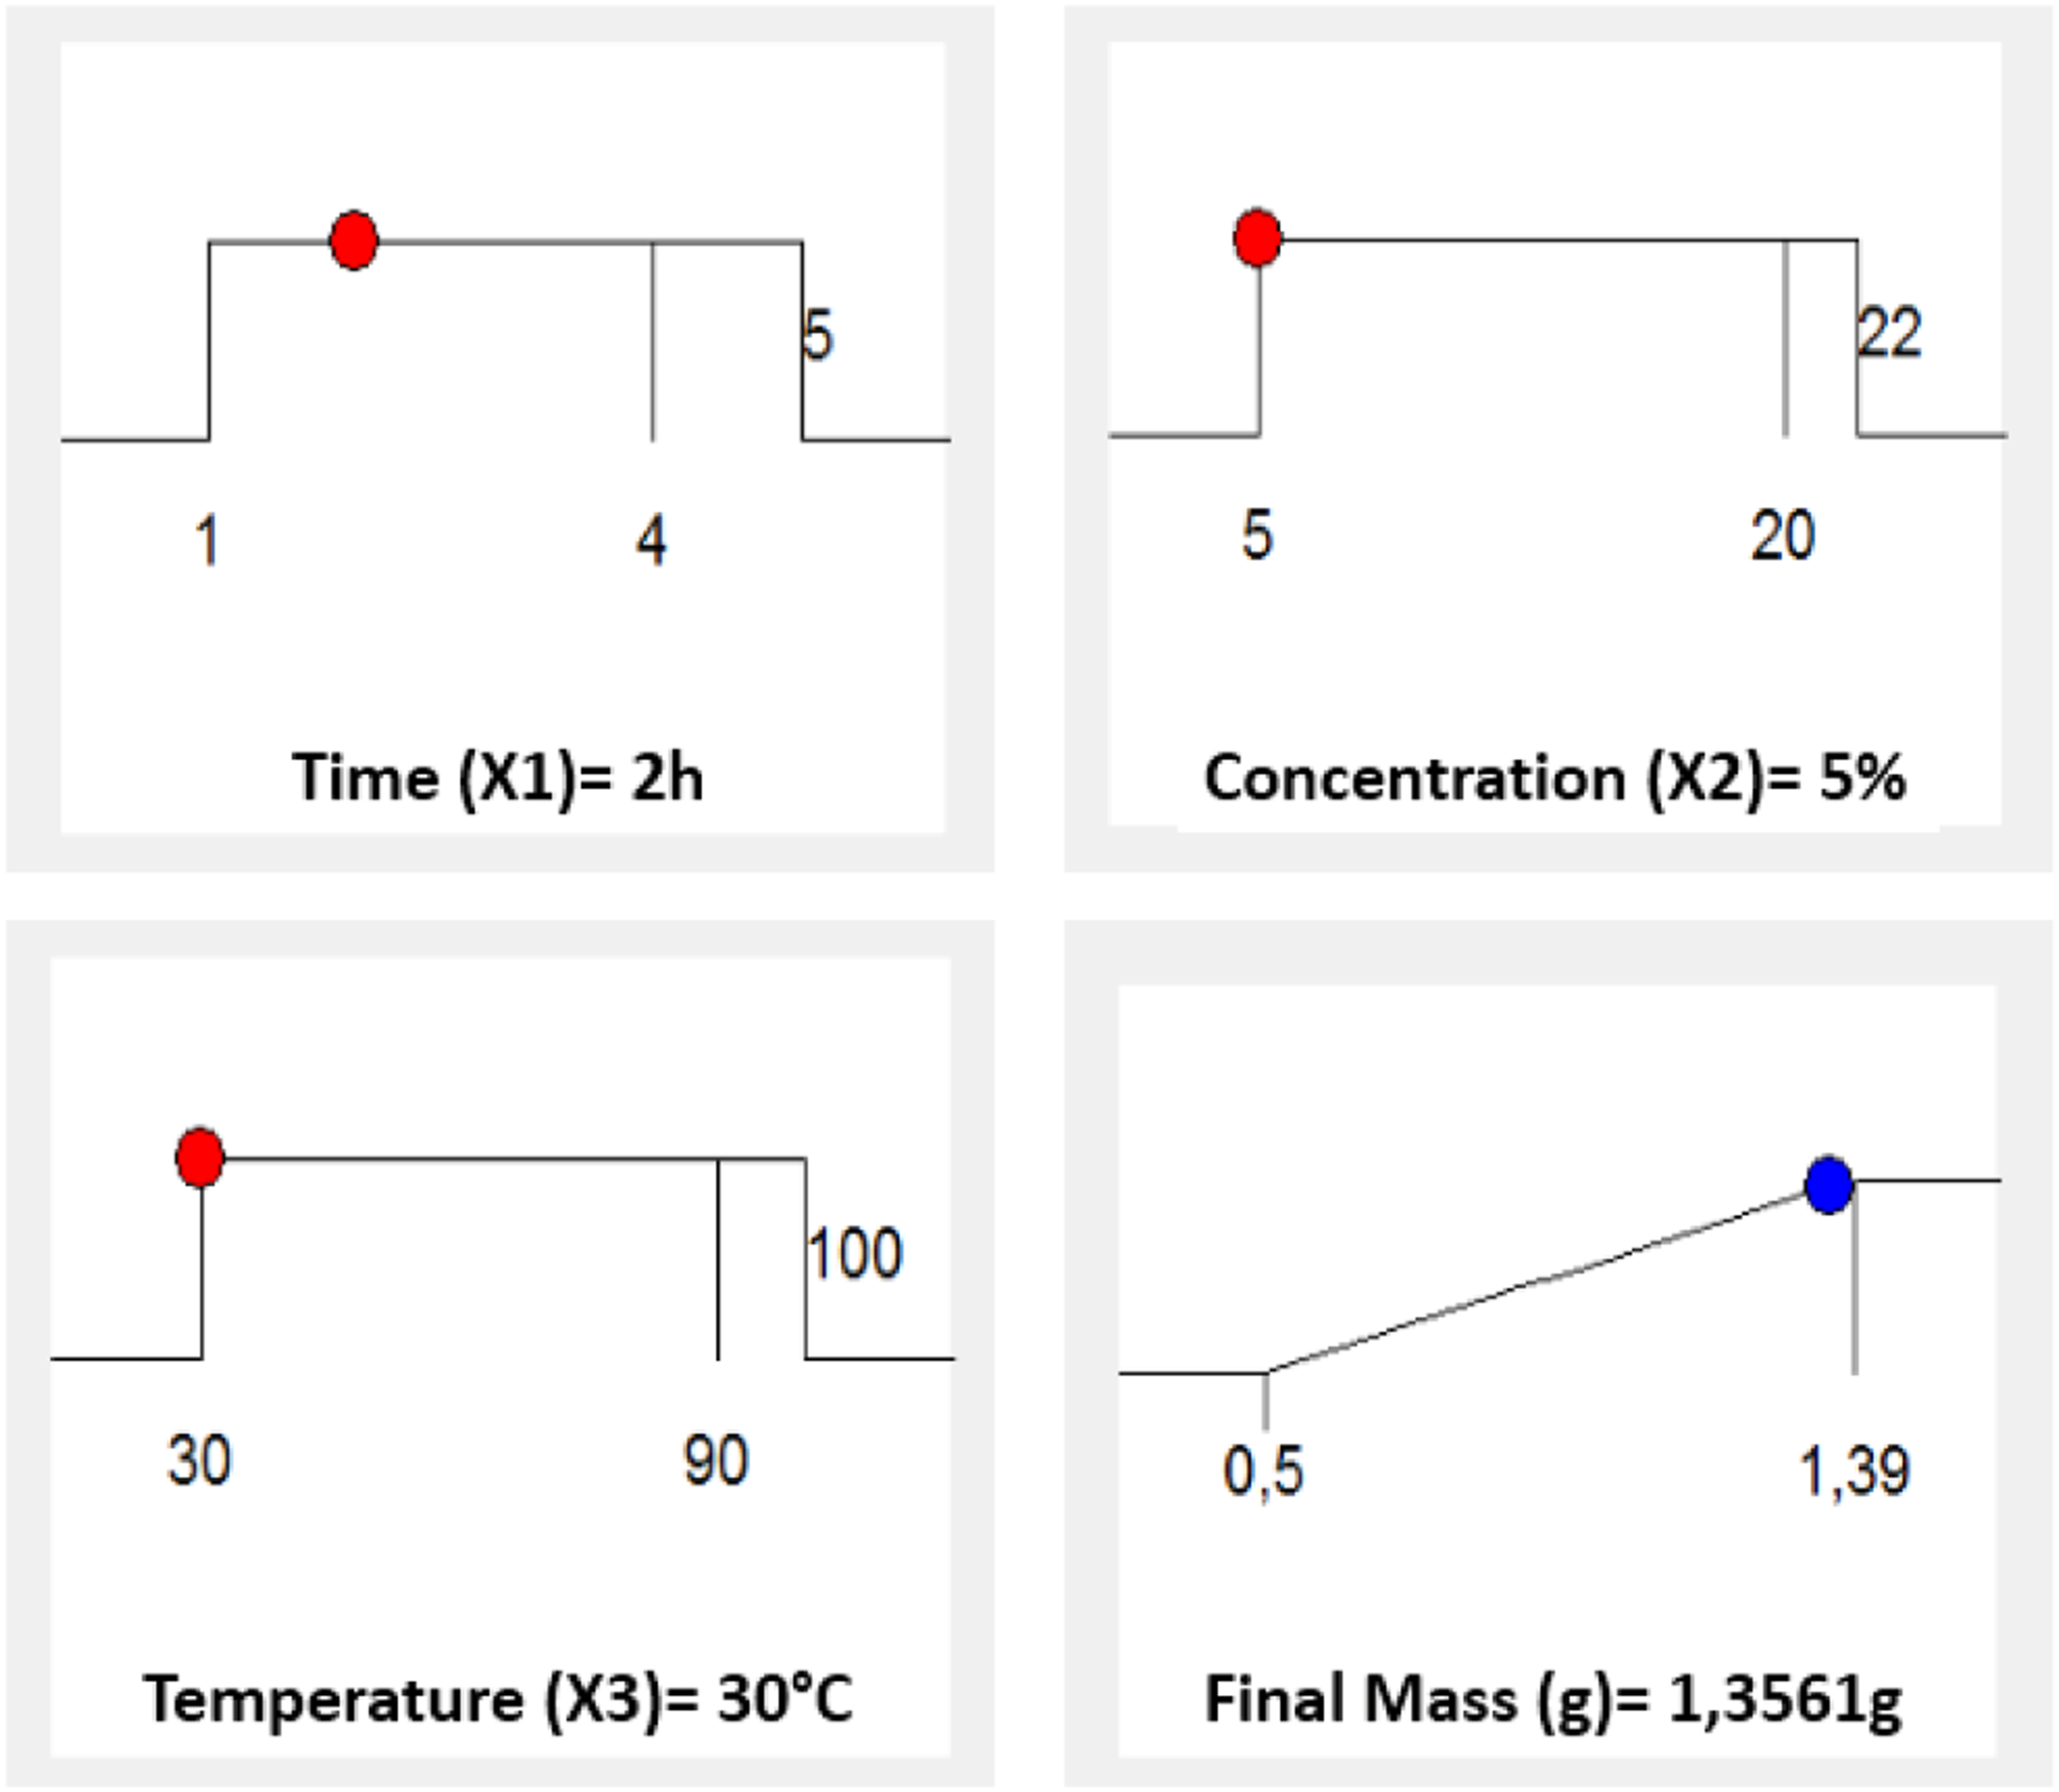
With a desirability value of 0.962, the model predicts a maximum response of 1356 g, indicating that the regression model for cellulose extraction was adequate and accurate (see Figures 10 and 11). Contour curve of the optimal extraction condition for cellulose. The optimal conditions for cellulose extraction.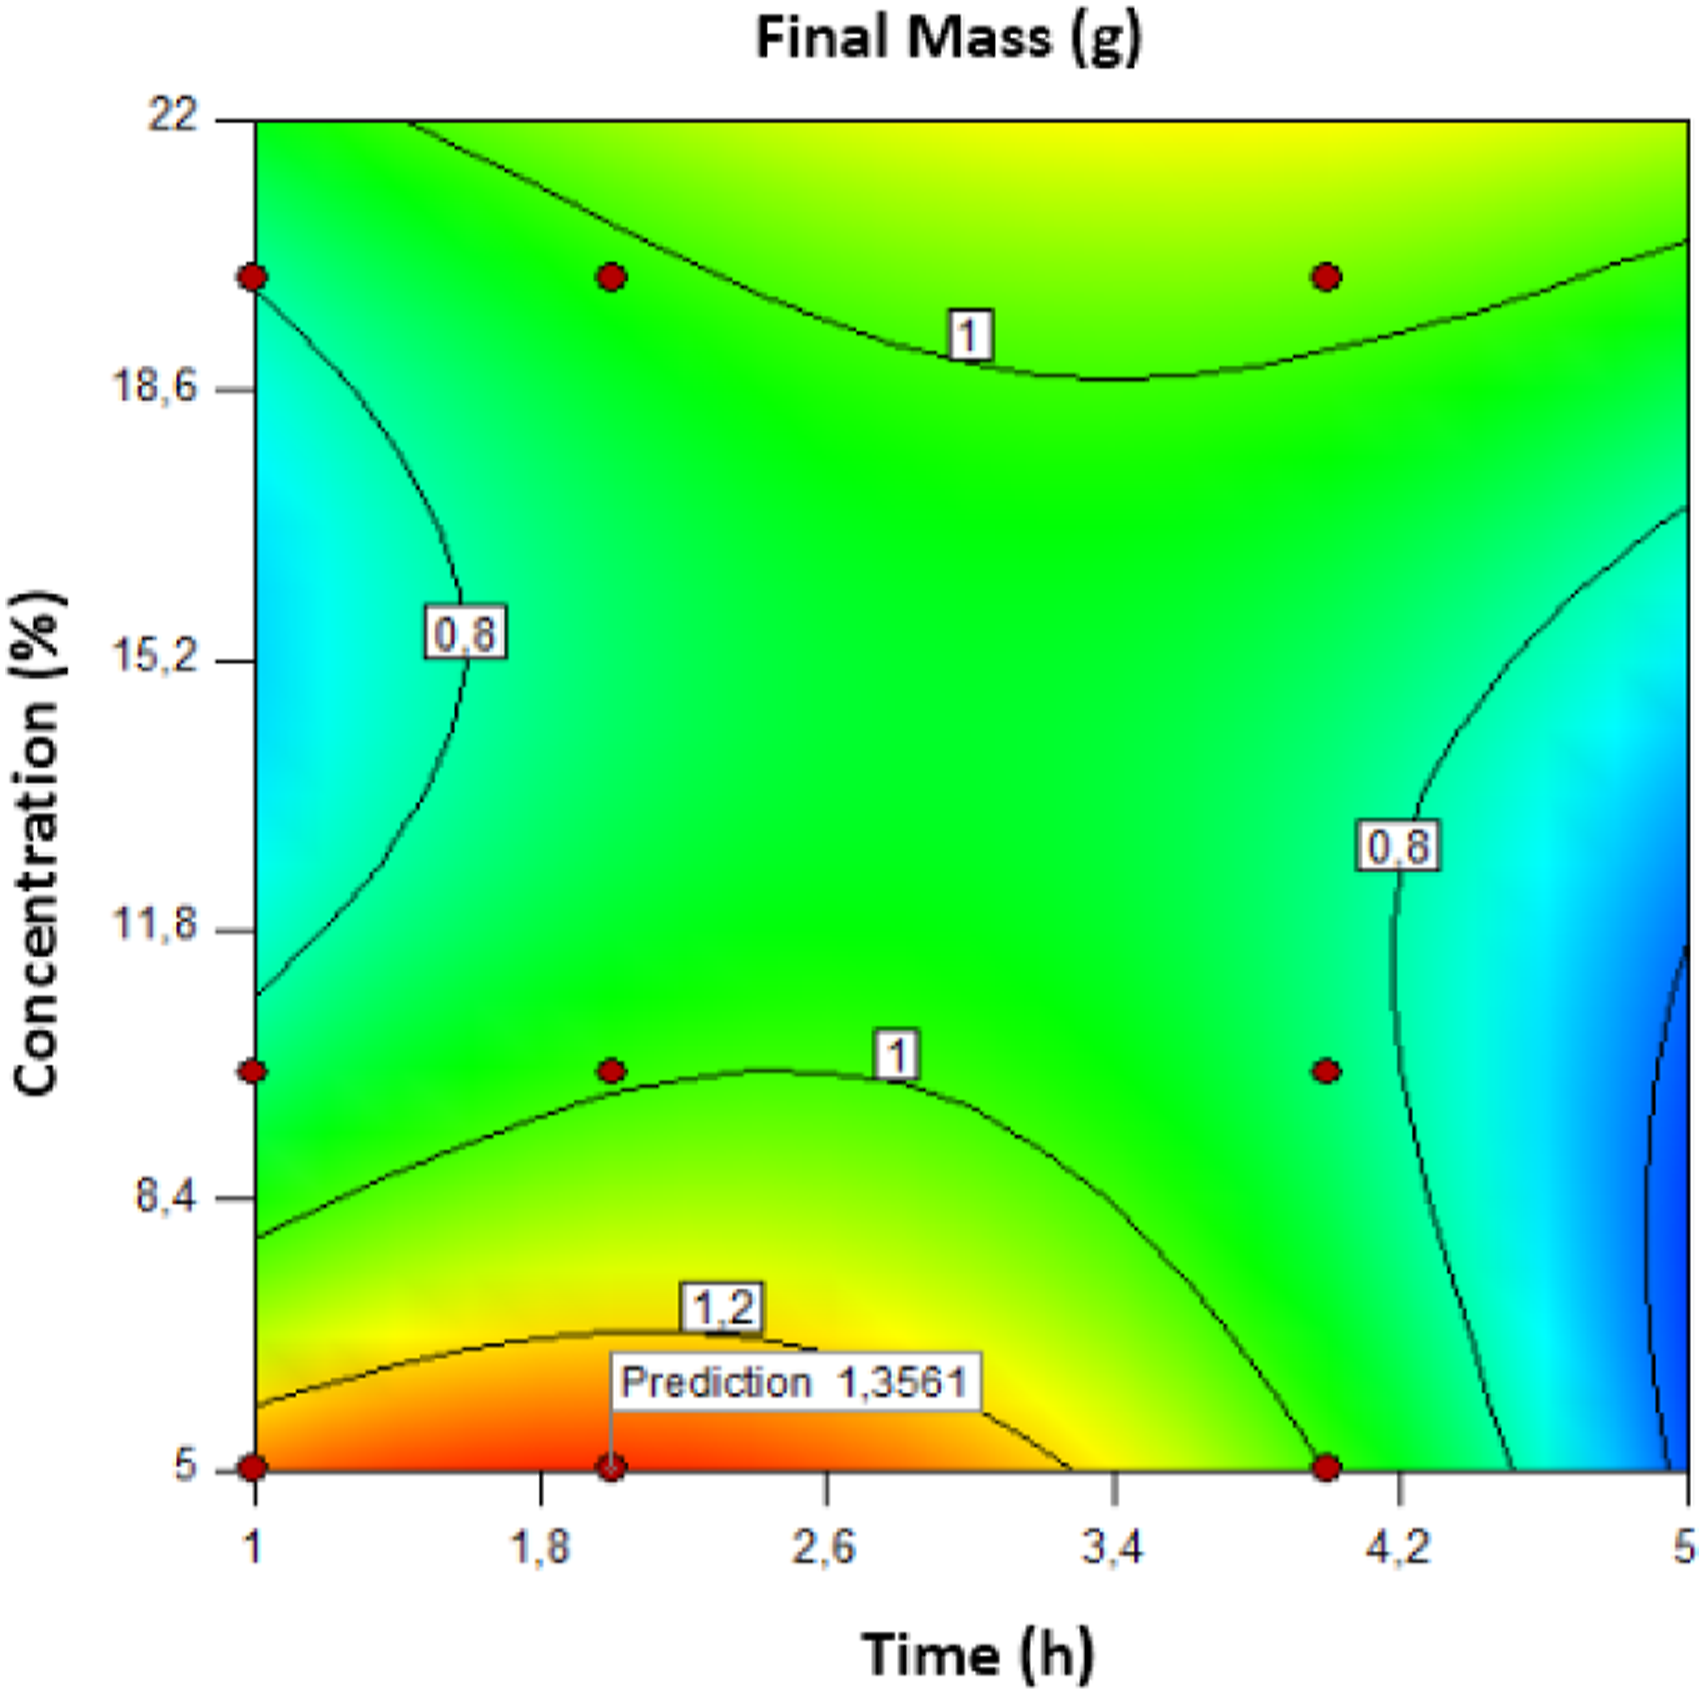
Conclusions
The present study investigated the potential of AG seeds as a sustainable and renewable biosource. An environmentally sustainable methodology was employed to extract high-purity cellulose from AG, ensuring the absence of lignin and hemicellulose. Subsequently, an analysis was conducted to investigate the different characteristics of the extracted cellulose. The ATR-FTIR spectroscopy analysis revealed the absence of lignin peaks at wavenumbers 1507 and 1595 cm−1. The thermal stability of cellulose was demonstrated using TGA analysis, revealing a notable maximum breakdown peak occurring at 311°C. Additionally, DSC data indicated a more significant endothermic peak observed at 305.63°C. The cellulose crystallinity index was evaluated using XRD analysis, yielding a value of 54%. In contrast to the raw material, the extracted cellulose exhibited increased surface roughness and enhanced purity, indicating the successful removal of hemicellulose and lignin components. The SEM image of AG cellulose reveals a morphology characterized by an elongated and threadlike structure. The RSM established the ideal parameters for the mass-producing extraction process. The coefficient of determination (R2) for the model equation was found to be 0.9096, with a p-value of .0028. These results suggest that the regression models employed in this study were highly statistically significant. When subjected to conditions of 30°C, 2 h, and a 5% NaOH solution, the quadratic equation model resulted in a maximum mass of 1356 g. The measured mass of 1350 g from the experiment agreed with the expected value. In summary, cellulose was effectively extracted, and the extraction technique employed by AG demonstrated excellent efficacy, suggesting that the extraction conditions were sufficient. The findings of this study indicate that AG exhibits a notable capacity for the synthesis of cellulose.
Footnotes
Author contributions
“All authors contributed to the study conception and design. All authors read and approved the final manuscript.”
Declaration of conflicting interests
The author(s) declared no potential conflicts of interest with respect to the research, authorship, and/or publication of this article.
Funding
The author(s) received no financial support for the research, authorship, and/or publication of this article.