
Abstract
Background:
Non-alcoholic fatty liver disease (NAFLD) is a prevalent condition characterized by the accumulation of fat in the liver. Nutrition, particularly micronutrients, plays a crucial role in the development and progression of NAFLD.
Objectives:
This study aimed to assess the impact of choline supplementation on oxidative stress, inflammation, and clinical outcomes in patients with NAFLD.
Design:
A randomized, controlled, single-blinded study.
Methods:
Eligible NAFLD patients were randomized to; choline group (n = 39), received conventional management plus phosphatidylcholine (PC) 2400 mg/day for 12 weeks, or control group (n = 40), received conventional management for 12 weeks, and 10 healthy volunteers were included. Anthropometric, clinical, and laboratory evaluations were performed at baseline and after treatment.
Results:
After 12 weeks, choline group showed significant differences versus controls by improvement in controlled attenuation parameter (304 vs 332 dB/m, p < 0.001) and fibrosis score (5.3 vs 6.8 kPa, p < 0.001), reduction in thiobarbituric acid reactive substances levels (1.9 vs 3.8 nmol/mL, p < 0.001), a decline in leptin levels (1.3 vs 2.1 ng/mL, p < 0.001) and liver enzyme (alanine aminotransferase and aspartate aminotransferase), p < 0.001 and 0.004 respectively). Also, the lipid profile improved by a significant decline in triglyceride levels in choline versus controls 133 versus 158, p = 0.048.
Conclusion:
Choline supplementation in NAFLD patients demonstrated a favorable impact on hepatic steatosis, oxidative stress, inflammatory markers, liver enzyme levels, and lipid profile. These findings suggest that choline may be a promising therapeutic option for NAFLD management. Further large-scale, long-term studies are warranted to investigate the clinical benefits of choline supplementation in NAFLD patients.
Trial registration:
The study was registered at clinicaltrials.gov and given the ID number: NCT05200156.
Plain language summary
Non-alcoholic fatty liver disease (NAFLD) is a prevalent condition characterized by the accumulation of fat in the liver. Nutrition, particularly micronutrients, plays a crucial role in the development and progression of NAFLD. This assessed the effects of choline supplementation in patients with NAFLD. After 12 weeks of choline administration, NAFLD patients demonstrated a favorable impact on hepatic steatosis, oxidative stress, inflammatory markers, liver enzyme levels, and lipid profile. These findings suggest that choline may be a promising therapeutic option for NAFLD management. Further large-scale, long-term studies are warranted to investigate the clinical benefits of choline supplementation in NAFLD patients.
Introduction
Metabolic dysfunction-associated steatotic liver disease (MASLD), formerly known as non-alcoholic fatty liver disease (NAFLD), is characterized by steatotic liver disease (SLD) in individuals with at least one cardiometabolic risk factor, excluding cases of significant alcohol consumption, as defined by the European Association for the Study of the Liver (EASL). MASLD encompasses a range of conditions, including simple steatosis, metabolic dysfunction-associated steatohepatitis (MASH, previously referred to as NASH), progressive fibrosis, cirrhosis, and hepatocellular carcinoma (HCC) linked to MASH. 1
MASLD is now recognized as the most prevalent chronic liver disease worldwide. Its estimated global prevalence in the general population has increased from 25% in 2016 to over 30% currently, with incidence rates continuing to rise. 2 It is estimated that around 10%–30% of individuals with isolated steatosis may develop steatohepatitis and advanced liver disease. However, the risk significantly increases in those with type 2 diabetes mellitus (T2D). 3
MASLD is strongly linked to cardiometabolic risk factors and often emerges prior to their development, particularly T2D. Conversely, the presence of multiple cardiometabolic risk factors significantly heightens the risk of progressive liver disease and severe liver-related complications. 4 Advanced age (>50 years), insulin resistance, and the presence of multiple cardiometabolic risk factors significantly add to the likelihood of MASH, severe fibrosis or cirrhosis, as well as overall and liver-related mortality. However, the influence of each cardiometabolic risk factor varies, with obesity and T2D being the primary drivers of cirrhosis and HCC risk. 5
Insulin resistance is a common feature in individuals with MASLD, impacting the liver, adipose tissue, and muscle. In adipose tissue, it results in increased free fatty acid release from adipocytes through lipolysis during fasting, a process that becomes more pronounced as MASLD progresses to MASH.6,7
Along with insulin resistance, oxidative stress (OS) plays a crucial role in the transition from simple steatosis to MASH. Elevated oxidative stress in the liver exacerbates tissue damage and contributes to the progression of MASH.8–10
The diagnosis of early-stage steatotic liver disease includes an abdominal ultrasound, assessment of lipid profile and liver function tests, exclusion of viral hepatitis and alcohol-related liver damage, and evaluation for insulin resistance. 11
Choline, a quaternary amine present in various tissues, plays a vital role in reducing liver damage linked to MASLD. It has been shown to lower lipid oxidation, inflammation, and oxidative stress while supporting lipid and glucose balance and aiding in mitochondrial repair.12,13
Choline-rich dietary sources include dairy products, liver, eggs, legumes, nuts, beef, leafy greens, seed oils, and grain germs. 13 While the human body can synthesize choline, inadequate dietary intake may result in choline deficiency. Additionally, individuals receiving long-term parenteral nutrition without sufficient choline have shown reversal in hepatic steatosis and reductions in serum aminotransferase levels when supplemented with choline.14,15
Animal models have provided valuable insights into the development of NAFLD. Rodents fed a high-fat, methionine- and choline-deficient diet exhibited steatosis, inflammation, hepatic necrosis, and, in some instants, hepatocellular carcinoma. Hepatic fibrosis was also observed in rodents on either a choline- and B12-deficient diet or a choline-deficient diet alone. Although the liver histology of rodents on a methionine- and choline-deficient diet resembles that of NASH, the overall phenotype of these models differs from human NAFLD.16,17
Regarding clinical studies, a survey conducted in American adults found that increased dietary choline intake was associated with a reduced risk of NAFLD in both men and women. 18 Similarly, a study conducted on Chinese adults demonstrated that higher choline consumption correlated with a lower risk of NAFLD, even after adjusting for various factors such as sociodemographic characteristics, lifestyle, and overall dietary intake. 19
Given the limited number of human studies investigating the effects of choline supplementation on oxidative stress and clinical outcomes in NAFLD patients, this study aimed to evaluate the influence of choline intake on oxidative stress, inflammation, lipid profile, and overall clinical outcomes in individuals with NAFLD.
Patients and methods
Study design and setting
This study was a prospective, randomized, controlled, single-blinded trial in which the physician conducting the clinical assessment was blinded to the participant’s group allocation, the randomization and preparation of the study intervention were performed by the clinical pharmacist. The study was conducted at the Tropical Medicine Department clinic, Ain Shams University Hospital from February 2022 to December 2023. The first patient was enrolled February 21, 2022. This study was conducted and reported in accordance with the Consolidated Standards of Reporting Trials (CONSORT) statement to ensure transparency and rigor in the reporting of clinical trials (Supplemental Material). 20
Patients
The study recruited adult patients diagnosed with NAFLD within the age range of 20–65 years. Diagnosis of NAFLD was confirmed by ultrasound examination, revealing the bright liver pattern of hepatic steatosis. Excluded patients were those with concurrent liver diseases (viral; hepatitis B virus (HBV) or hepatitis C virus (HCV) or autoimmune), malignancy, consuming alcohol exceeding 40 g/week over the past year, significant systemic disease (cardiovascular, renal, respiratory, or psychiatric illnesses or diabetes mellitus), pregnant or lactating women or receiving any other antioxidant or choline supplementation.
Eligible patients were randomly allocated in a (1:1) to either the choline or control groups. Simple randomization was employed to allocate patients into the study groups, ensuring an equal probability of assignment to each group.
The conventional therapy included; standardized protocol for lifestyle modification and weight loss. The intervention focused on dietary changes and physical activity standardized across participants to ensure consistency and reproducibility.
Additionally, a group of 10 healthy individuals was also included to provide baseline reference data for comparison with the intervention and control groups. Their role was to establish normative values for key biomarkers and clinical parameters, allowing us to better contextualize the metabolic and hepatic changes observed in participants.
Methods
Outcome measures
The primary outcome was the effect of choline supplementation on oxidative stress, assessed by the mean change in serum levels of thiobarbituric acid reactive substances (TBARS). TBARS levels were measured in mmol/μg at baseline and after 12 weeks of supplementation.
The secondary outcome was the effect of choline supplementation on inflammatory status, evaluated by the mean change in serum leptin concentrations. Leptin levels were measured in ng/mL at baseline and after 12 weeks of supplementation. All outcomes were evaluated at baseline and following 12 weeks of intervention.
Baseline assessment
At the beginning of the study, a comprehensive baseline assessment was conducted. This included gathering patients’ demographics, medical, social, and medication histories. Patients were provided with detailed education about the disease, the role of choline supplementation, and potential side effects. To aid in monitoring side effects, patients were given a side effect reporting card. Anthropometric measurements, such as height, weight, and waist circumference, were recorded to assess body composition.
Laboratory evaluations were performed using serum samples collected in the fasting state, encompassing a full range of tests, including complete blood count (CBC), hemoglobin A1c (HbA1c), homeostatic model assessment for insulin resistance (HOMA-IR), lipid profile, alanine aminotransferase (ALT) and aspartate aminotransferase (AST) as well as measurement of the oxidative stress marker, TBARS. Additionally, an assessment of the inflammatory marker leptin was performed. Phosphatidylcholine levels were evaluated to establish its baseline levels.
Phosphatidylcholine was determined using commercial Enzyme-linked immunosorbent assays (ELISA) kit manufactured by Cell Biolabs, Inc., San Diego, CA, USA (Catalog Number STA-600).
TBARS was determined using commercial ELISA kit manufactured by Bioassay Technology Laboratory, Shanghai, China (Catalog Number (E3642Hu)).
Leptin was determined using commercial ELISA kit manufactured by Bioassay Technology Laboratory (Catalog Number (E1559Hu)).
Clinical evaluation involved conducting a 2D abdominal ultrasound examination performed using a Toshiba device in addition to Transient elastography (FibroScan, Echosens, Paris, France) to determine the degree of steatosis, with all examinations performed by the same operator.
The Hepatic Steatosis Index (HSI) was assessed by calculation using the following equation:

Follow-up assessment
Throughout the 3-month study period, patients were followed up monthly. The follow-up allowed for ongoing monitoring of patients’ progress and any potential side effects. In between visits, patients were contacted via phone calls to ensure their well-being and to promptly address any concerns or the occurrence of any adverse reactions. Occurrence of adverse drug reactions was monitored by tracking patients’ side effect reporting cards.
End of study-assessment
A final assessment was conducted after 3 months. Anthropometric measurements were performed to evaluate any changes in body composition. A comprehensive laboratory evaluation, including CBC, hemoglobin AlC, HOMA-IR, lipid profile and liver function tests, as well as TBARS, leptin, and phosphatidylcholine levels were measured. Furthermore, Ultrasound and FibroScan examinations were reassessed to evaluate the impact of the intervention.
Sample size
The calculation of the sample size was performed using Power and Sample Size Calculation (PS) software version 3.1.2 according to a previous study by Bahrami et al., the difference of the change in leptin level between patients of non-alcoholic fatty liver disease receiving melatonin (as an antioxidant) compared to patients receiving placebo was 2.89 ng/mL with pooled standard deviation of 4.4 ng/mL. A minimum sample size of 37 cases in each group was required to elicit this difference at an alpha level of 0.05 and a power of the study of 80%. To guard against lost follow-up, the sample was increased to 40 cases in each group. 21
Statistical methods
Statistical analyses were performed using IBM SPSS® Statistics version 26 (IBM® Corp., Armonk, NY, USA). Numerical data were presented as mean ± standard deviation or median and range, depending on distribution. Categorical data were expressed as frequency and percentage. The relationship between qualitative variables was assessed using Pearson’s Chi-square test. Normality of data distribution was evaluated with the Kolmogorov–Smirnov and Shapiro–Wilk tests.
For comparisons between two groups, the student’s t-test was applied for normally distributed data, while the Mann–Whitney U test was used for non-normally distributed data. Changes in numerical variables between two consecutive measurements were analyzed using a paired t-test or the Wilcoxon Signed-Rank test, whereas categorical variables were compared using the Marginal Homogeneity test. Correlations between numerical variables were assessed using Spearman’s rho correlation. All statistical tests were two-tailed, with a p-value of <0.05 considered statistically significant.
Results
Baseline characteristics
Among the 126 patients initially screened, 84 met the inclusion criteria and were randomly assigned to either the choline group (n = 39) or the control group (n = 40). The CONSORT flow diagram illustrating the study process is presented in Figure 1.

Consort flow diagram.
Baseline demographic, clinical, imaging, and laboratory characteristics were comparable between the choline and control groups, with no statistically significant differences. The mean age was approximately 43 years in both groups (p = 0.93), and females comprised the majority (74.4% vs 62.5%; p = 0.25). Body weight and BMI were similar, with values of 93.4 ± 15.1 kg vs 91.5 ± 13.7 kg (p = 0.81) and 34.9 ± 5.5 kg/m² vs 34.1 ± 5.0 kg/m² (p = 0.52), respectively.
The prevalence of dyslipidemia, hypertension, and other comorbidities showed no significant differences between groups. Liver size assessed by ultrasound was also comparable, with median right lobe size of 18.5 cm versus 18.0 cm (p = 0.16) and left lobe sizes of 8.5 cm versus 8.8 cm (p = 0.81) in the choline and control groups, respectively.
Baseline laboratory assessments revealed no statistically significant differences between the choline and control groups, confirming good comparability prior to intervention.
Liver function tests were similar, with median ALT levels of 30 U/L versus 26.5 U/L (p = 0.30) and AST levels of 36 U/L versus 29 U/L (p = 0.13). Lipid profiles were also comparable: total cholesterol (193 vs 189.5 mg/dL, p = 0.30), triglycerides (148 vs 128 mg/dL, p = 0.36), LDL (129 vs 125 mg/dL, p = 0.27), and HDL (45 vs 44.5 mg/dL, p = 0.24).
Glycemic markers showed no significant differences. Median HbA1c was 6.0% in the choline group and 5.71% in the control group (p = 0.32). Fasting blood glucose was 91.2 ± 19.7 mg/dL versus 92 ± 17.2 mg/dL (p = 0.98), and fasting insulin was 7.6 ± 2.2 µU/mL versus 7.0 ± 1.7 µU/mL (p = 0.60), while HOMA-IR values were 1.02 versus 1.67, respectively (p = 0.31).
The HSI was also comparable between groups (42.7 vs 42.1; p = 0.58). All details are found in Table 1.
Baseline demographic, clinical, imaging, and biochemical data of the two study groups.

Data are presented as mean ± SD for normally distributed variables and median (range) for non-normally distributed variables.
Unpaired t-test
Mann–Whitney U test
Pearson Chi-Square test.
ALT, alanine transaminase; AST, aspartate aminotransferase; CBC, complete blood count; F Insulin, fasting insulin; FBG, fasting blood glucose; HDL, high-density lipoprotein; HOMA IR, homeostatic model assessment for insulin resistance; HSI, hepatic steatosis index; LDL, low-density lipoprotein; TG, triglyceride; TLC, total leukocyte count.
As for the fibro-scan findings, no statistically significant differences were observed between the choline and control groups. Median CAP scores were 348 dB/m in the choline group and 342.5 dB/m in the control group (p = 0.34). Similarly, liver stiffness measurements were comparable between groups, with median fibrosis scores of 6.3 kPa versus 6.7 kPa, respectively (p = 0.46) (Table 2).
Comparison of fibro-scan parameters and blood markers between choline and control groups at baseline.

Mann–Whitney U test (between-group comparisons).
CAP, controlled attenuation parameter; dB/m, decibels per meter; Kpa, kilopascals; PC, phosphatidylcholine; TBARS, thiobarbituric acid reactive substance.
Similarly, baseline serum levels of PC, TBARS, and leptin were not significantly different between groups. The median PC level was 145.4 mg/dL in the choline group compared to 154.4 mg/dL in the control group (p = 0.24). TBARS concentrations were 4.0 nmol/mL and 3.8 nmol/mL, respectively (p = 0.24), while leptin levels were 2.2 ng/mL in the choline group and 2.1 ng/mL in the control group (p = 0.79). Detailed results are presented in Table 2.
The impact of phosphatidylcholine intake over 12 weeks
After 12 weeks, there was a significant improvement in the median CAP in the choline group compared to the control group (304 vs 332 dB/m, p < 0.001), and the choline group CAP significantly declined after 12 weeks by 44 dB/m (p < 0.001). Fibrosis scores also improved in the choline group versus controls (5.3 vs 6.8, p < 0.001), with a significant decline in the choline group (p < 0.001) Figure 2(a) and (b) and Table 3.

Comparison between choline and control groups over time in the following parameters. (a) CAP score. (b) Fibrosis score. (c) AST. (d) ALT. (e) HbA1c. (f) HOMA-IR. (g) PC serum levels. (h) TBARS serum levels. (i) Leptin serum levels.
Changes in fibro-scan and ultrasound parameters after 12 weeks of intervention in choline and control groups.

Mann–Whitney U test (between-group comparisons).
Wilcoxon signed ranks test (within-group changes over time).
Statistically significant bold (p-value < 0.05).
CAP, controlled attenuation parameter; dB/m, decibels per meter; Kpa, kilopascals; Lt, left; Rt, right.
Regarding the ultrasound parameters, after 12 weeks, the choline group showed a significant decrease (p < 0.001) in both the median size of the right lobe of the liver by 1.5 cm and the left lobe of the liver by 1 cm, while the control group was not changed over time. Details are illustrated in Table 3.
As for the blood markers, the PC levels significantly increased in the choline group versus controls, (318.8 vs 163.7 mg/dL, respectively, p < 0.001). Moreover, there was a significant increase in the PC serum levels after 12 weeks only in the choline group (p < 0.001), Figure 2(g), Table 4.
Changes in serum biomarkers after 12 weeks of intervention in choline and control groups.

Mann–Whitney U test (between-group comparisons).
Wilcoxon signed ranks test (within-group changes over time).
Statistically significant bold (p-value < 0.05).
PC, phosphatidylcholine; TBARS, thiobarbituric acid reactive substance.
Regarding TBRAS levels, there was a significant decline in the median TBARS serum levels of the choline group at 12 weeks versus baseline (1.9 vs 4 nmol/mL, p < 0.001, respectively), while the control group remained unchanged. Comparison of both groups at week 12 revealed a significant decrease in TBARS serum levels in the choline versus control groups (1.9 vs 3.8 nmol/mL, p < 0.001), Figure 2(h), Table 4.
Moreover, Leptin serum levels showed a significant decline of 0.9 in the choline group at 12 weeks compared to baseline (1.3 vs 2.2 ng/mL, respectively, p < 0.001), while no change was observed in the control group. In addition, at 12 weeks, leptin levels were significantly lower by 0.8 ng/mL in the choline versus controls (p < 0.001), Figure 2(i), Table 4.
Over the 12-week period, there were no significant differences in weight or BMI between the groups. Baseline weights were similar, with slight, non-significant reductions by week 12 (92.6 ± 14.8 kg vs 91.3 ± 13.2 kg, p = 0.663). BMI values were also comparable at baseline and showed minor, non-significant decreases after 12 weeks (34.4 ± 5.3 vs 34.0 ± 4.8, p = 0.739). A trend toward BMI reduction was observed in the choline group (p = 0.08), but this was not statistically significant (Table 5).
Changes in clinical and biochemical parameters after 12 weeks of intervention.

Data are presented as mean ± SD for normally distributed variables and median (range) for non-normally distributed variables.
Unpaired t-test
Mann–Whitney U test
Wilcoxon signed ranks test
Paired T-test,
Statistically significant bold (p-Value < 0.05).
ALT, alanine transaminase; AST, aspartate aminotransferase; CBC, complete blood count; F Insulin, fasting insulin; FBG, fasting blood glucose; HDL, high-density lipoprotein; HOMA IR, homeostatic model assessment for insulin resistance; HSI, hepatic steatosis index; LDL, low-density lipoprotein; TG, triglyceride; TLC, total leukocyte count.
Regarding liver function tests, AST levels were significantly lower in the choline group compared to the control group at 12 weeks (28 vs 34 U/L, p = 0.004). Within the choline group, AST levels significantly declined from baseline (36 to 28 U/L, p < 0.001), while the control group showed a non-significant increase. Similarly, ALT levels significantly decreased in the choline group (30–22 U/L, p < 0.001), with no significant change in the control group. At 12 weeks, ALT levels were also significantly lower in the choline group than in the control group (22 vs 30 U/L, p < 0.001). Figure 2(c) and (d), Table 5.
In terms of lipid profile, the choline group showed a significant reduction in median cholesterol levels after 12 weeks (193 vs 185 mg/dL, p = 0.016), whereas the control group experienced a non-significant increase. Additionally, median triglyceride levels were significantly lower in the choline group compared to the control group at week 12 (133 vs 158 mg/dL, p = 0.048). However, no significant differences were observed between groups or over time in LDL and HDL values (Table 5).
In terms of glucose markers, findings shown in Table 5, HbA1C levels were significantly lower in the choline group compared to the control group after 12 weeks (5.47% vs 6%, p = 0.016). Additionally, the choline group experienced a significant reduction in median HbA1C levels by 0.53% from baseline (p < 0.001), while the control group showed a non-significant increase. Figure 2(e)
Fasting blood glucose levels showed a significant reduction in the choline group after 12 weeks (80.7 ± 9.8 mg/dL, p < 0.001), while the control group had a non-significant decrease (88.0 ± 14.2 mg/dL, p = 0.16), resulting in a significant between-group difference (p = 0.04).
Both groups experienced reductions in fasting insulin levels by week 12, with a greater decline in the choline group (5.9 ± 1.8 vs 6.8 ± 2.0 µU/mL), although the between-group difference was not statistically significant (p = 0.06).
The choline group showed a lower median HOMA-IR compared to the control after 12 weeks, though the between-group difference was not statistically significant (p = 0.16). Within-group analysis revealed a significant reduction in HOMA-IR in the choline group (p = 0.020), with no significant change in the control group (p = 0.53). Figure 2(f)
After 12 weeks, a significant decrease of 0.9 in the median HSI of the choline group was observed (p = 0.004), Table 5.
A significant inverse correlation was found between serum leptin and PC levels (r = −0.480; p < 0.001). Additionally, PC levels showed a strong inverse correlation with TBARS serum levels (r = −0.504; p < 0.001), indicating that lower phosphatidylcholine availability in NAFLD patients is associated with elevated leptin and TBARS levels. Conversely, a strong positive correlation was observed between serum leptin and TBARS levels (r = 0.642; p < 0.001; Figure 3).

Correlation between PC, leptin, and TBARS levels in both choline and control groups.
Figure 4 shows steatosis grade distribution at baseline and after 12 weeks. In the choline group, the proportion of patients with grade S3 steatosis dropped substantially from 84.6% at baseline to 51.3% at week 12. Correspondingly, the percentages in lower grades increased: S0 from 0% to 12.8%, S1 from 5.1% to 15.4%, and S2 from 10.3% to 20.5%, indicating decreased liver fat content. The control group showed minimal change, with grade S3 remaining high (89.5% to 92.3%) and only slight shifts in lower grades. Post-intervention steatosis distribution differed significantly between groups (p < 0.001), suggesting greater improvement with PC supplementation.
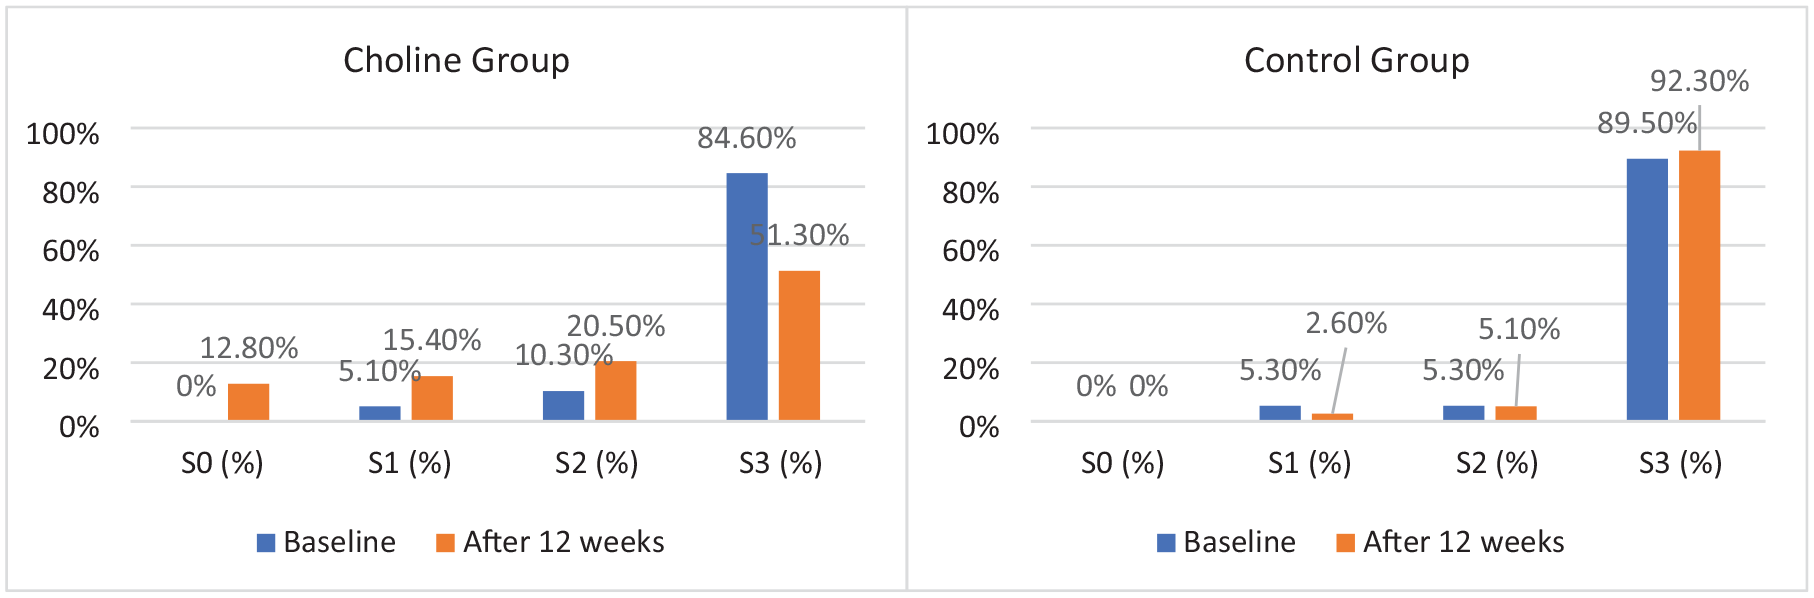
Changes in steatosis grade distribution over time in choline and control groups.
Figure 5 illustrates the proportion of responders and non-responders for hepatic and metabolic outcomes. Responders were defined as participants who achieved (1) a reduction of ⩾35 dB/m in liver steatosis as measured by CAP, (2) an improvement of ⩾1 fibrosis stage, and (3) a decrease of ⩾0.5% in HbA1c levels.
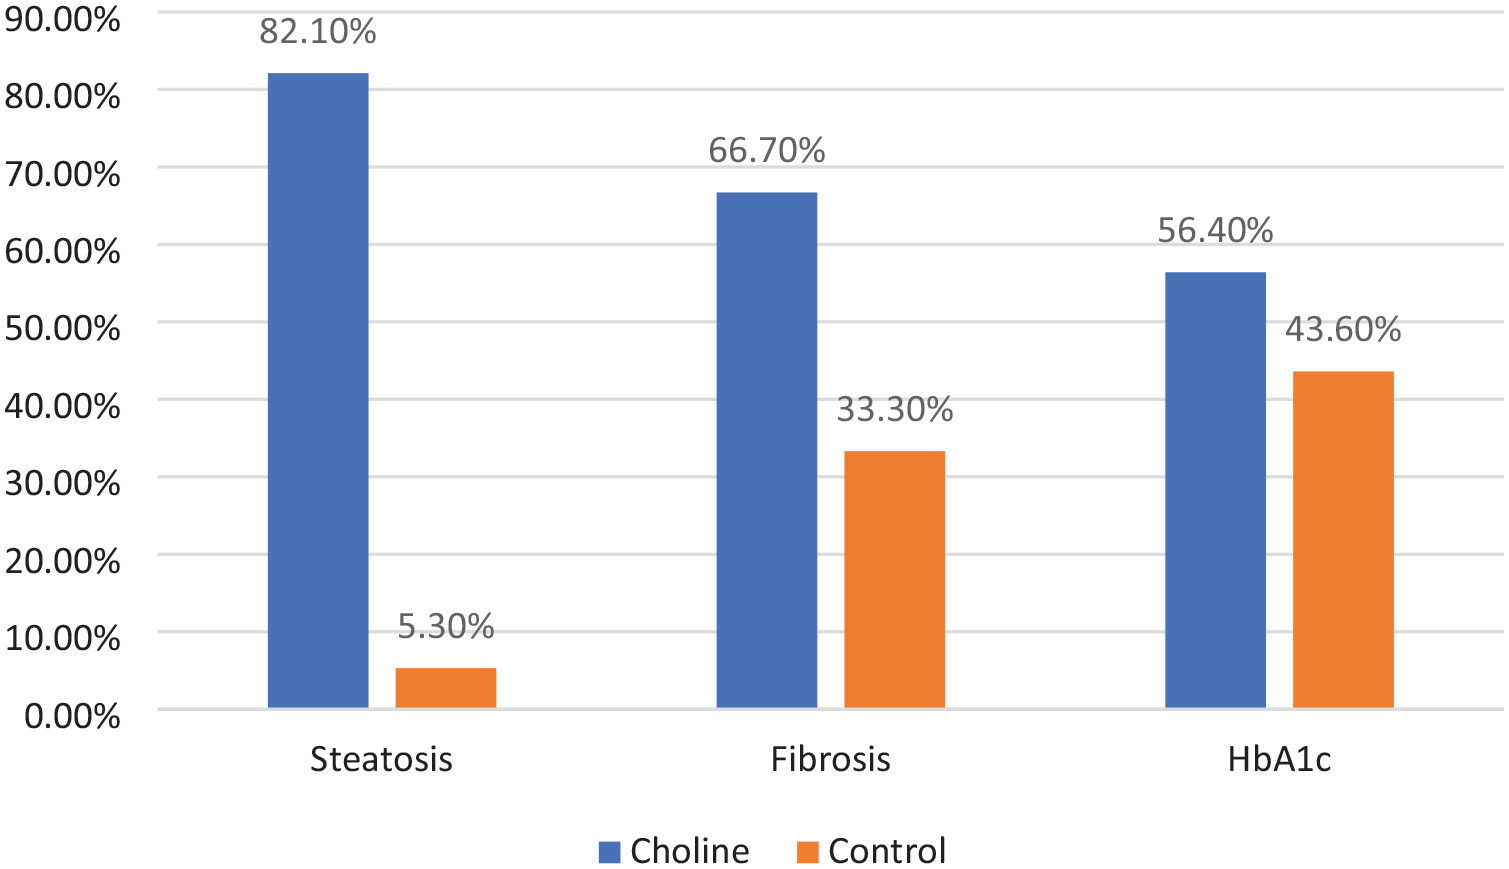
Percentage of responders in steatosis, fibrosis, and HbA1c levels in choline versus control groups after 12 weeks.
After 12 weeks, 82.1% of the choline group achieved a ⩾35 dB/m reduction in CAP-measured liver steatosis, compared to only 5.3% in the control group. Similarly, 66.7% of participants in the choline group showed an improvement of at least one stage in fibrosis, versus 33.3% in the control group. While 56.4% of participants in the choline group demonstrated a reduction of ⩾0.5% in HbA1c levels, compared to 43.6% in the control group. These findings suggest that PC supplementation may contribute to significant improvements in hepatic and metabolic parameters beyond the standardized lifestyle modifications and dietary counseling offered to both groups.
Figure 6 shows the percent change in key hepatic, oxidative, and metabolic parameters after 12 weeks of intervention. The choline group exhibited significantly greater improvements across all measures compared to the control group. Phosphatidylcholine levels increased by 116.18% versus 6.21% (p < 0.001; Figure 6(a)). Liver fat content, assessed by CAP, decreased by 14.62% in the choline group versus 1.84% in controls (p < 0.001; Figure 6(b)), while fibrosis scores dropped by 17.95% versus 1.69% (p < 0.001; Figure 6(c)). Liver size was also reduced in the choline group: right lobe by 4.88% and left lobe by 7.69%, with no change in the control group (p < 0.001 for both; Figures 6(d), (e)). Oxidative stress, indicated by TBARS, declined by 40.35% versus 2.05% (p < 0.001; Figure 6(f)), and serum leptin levels decreased by 39.51% versus 1.41% (p < 0.001; Figure 6(g)).

Percent change in choline and control groups after 12 weeks in the following parameters. (a) PC. (b) CAP. (c) Fibrosis score. (d) Right liver lobe size. (e) Left liver lobe size. (f) TBARS. (g) Leptin.
Discussion
Metabolic dysfunction-associated steatotic liver disease, formerly known as non-alcoholic fatty liver disease, was renamed to highlight its metabolic origins and reduce stigma. It is a multifactorial condition characterized by obesity, dyslipidemia, insulin resistance, and hypertension, which collectively disrupt liver function, lipid and glucose metabolism, and promote chronic inflammation.1,6
Recent attention has focused on the role of micronutrients in MASLD progression.22,23 This study is the first to systematically assess the effects of phosphatidylcholine supplementation on oxidative stress, inflammation, lipid profiles, and clinical outcomes in patients with NAFLD.
Preclinical studies provide strong evidence for the therapeutic potential of PC in MASLD.24,25 In high-fat diet-fed mice, PC supplementation reduced body weight gain, hepatic lipid accumulation, and serum levels of triglycerides, total cholesterol, leptin, ALT, and AST. 26 Additionally, in a diet-induced MASH model, PC significantly reduced inflammation and fibrosis by downregulating PPARγ2 and NF-κB signaling pathways. 27 Collectively, these findings suggest that PC mitigates oxidative stress, lipid peroxidation, and fibrotic progression, supporting its potential role in preventing MASLD progression.28–30
Building on these promising preclinical results, our study demonstrated that 12 weeks of PC supplementation significantly increased serum PC levels in the intervention group compared to both baseline and controls (p < 0.001). This increase corresponded with notable improvements in liver function, evidenced by significant reductions in ALT (from 30 to 22 U/L) and AST (from 36 to 28 U/L) levels (p < 0.001), while no significant changes occurred in the control group.
Consistent with our findings, multiple clinical studies have reported improvements in liver function with PC supplementation in NAFLD patients. In one trial, oral PC at 2100 mg/day significantly reduced ALT and AST levels after 6 months treatment (p ⩽ 0.05). 31 Similarly, Dajani et al. 32 observed significant reductions in transaminases (p < 0.01) and symptomatic improvement following treatment with essential phospholipids.
Another study showed that co-supplementation with Prunus mume and choline significantly lowered AST, ALT, and Gamma-glutamyl transferase (GGT) levels compared to placebo (p < 0.001). 33 Furthermore, in a 24-week trial, polyenylphosphatidylcholine (PPC) used as adjunctive therapy led to marked reductions in ALT, AST, and GGT (p < 0.001). The hepatoprotective effects of PPC were attributed to its ability to restore hepatic membrane integrity, reduce inflammation and fibrosis, and attenuate oxidative stress and lipid peroxidation. 34
In addition to improvements in liver enzymes, the current study demonstrated favorable effects on lipid metabolism. After 12 weeks of intervention, total cholesterol (p = 0.016) and triglyceride levels (p = 0.048) were significantly reduced, while no significant changes were observed in LDL or HDL concentrations.
Clinical evidence suggests that longer treatment durations are often required to observe broader lipid-modifying effects. For instance, a 6-month trial of oral PC supplementation at 2100 mg/day reported a significant decline in total cholesterol and triglycerides after 3 months (p < 0.05), while reductions in LDL and VLDL, along with increases in HDL, became apparent only after 6 months of treatment (p < 0.05). 31 Similarly, Butt et al. 33 reported significant reductions in cholesterol, LDL, and triglycerides (p < 0.001) after 24 weeks of the intervention in NAFLD patients. Another study found that PPC significantly lowered total cholesterol, LDL, and triglycerides while increasing HDL levels after 24 weeks (p < 0.05). 34 Together, these findings suggest that prolonged PC supplementation may yield broader improvements in lipid profiles beyond the early changes observed in this study.
In contrast to this study and others, a randomized trial by Cerletti et al. evaluated a choline-containing nutraceutical blend in NAFLD patients over 12 weeks. Although a modest AST reduction was observed, there were no significant improvements in liver enzymes, metabolic, or inflammatory markers compared to placebo. Notably, the intervention group showed a slight but significant (<10%) increase in cholesterol and fasting glucose levels. 35 These findings suggest that the efficacy of choline-based supplements may depend on dose, treatment duration, or formulation complexity.
While previous studies have shown both consistent and conflicting results regarding the lipid-modifying effects of PC, its role in glucose metabolism has been comparatively underexplored. However, emerging preclinical evidence supports its potential metabolic benefits. In high-fat diet-induced models, PC supplementation improved insulin sensitivity, reduced obesity, and lowered fasting glucose, in part by enhancing insulin signaling, reducing adipose inflammation, and modifying gut microbiota. 36 These findings are further supported by metabolomic studies showing that higher circulating PC levels are associated with a lower risk of type 2 diabetes. 37
Addressing this relative gap in clinical evidence, the present study provides novel findings that support a beneficial role for PC supplementation in glycemic regulation. Over a 12-week intervention period, PC administration resulted in significant improvements in glycemic markers. Patients in the PC group exhibited a substantial reduction in HbA1c levels compared to controls (5.47% vs 6.00%, p = 0.016). Furthermore, FBG levels declined significantly within the choline group (p < 0.001), with a statistically significant between-group difference (p = 0.04). Although the reduction in fasting insulin levels did not reach statistical significance (p = 0.06), the choline group experienced a significant improvement in HOMA-IR scores (p = 0.020), suggesting enhanced insulin sensitivity.
These results align with those from previous trials. Elwakil et al. 31 reported significant reductions in fasting blood glucose and insulin levels, along with improved HOMA-IR scores in NAFLD patients receiving PC over 3–6 months (p < 0.05). Similarly, a study investigating Prunus mume and choline supplementation in NAFLD patients observed significant reductions in fasting blood glucose at both 12- and 24-week follow-ups (p = 0.01). 33
Contrary to our findings of significant glycemic improvements, a recent two-month randomized, controlled trial in type 2 diabetes patients found that choline supplementation, alone or combined with magnesium, did not significantly alter fasting glucose, insulin, or other metabolic parameters. 38 This discrepancy may reflect differences in study populations, baseline metabolic status, intervention duration, or choline dosage and formulation.
A review article by Gundermann et al. offered a broader perspective on these inconsistencies by examining the role of essential phospholipids (EPL), particularly PC, in NAFLD treatment. The studies reported consistent improvements in hepatic biomarkers (ALT, AST, bilirubin) and lipid metabolism, while effects on glucose metabolism were less consistent, especially in shorter interventions (⩽3 months). Nonetheless, imaging and histological findings often confirmed reduced hepatic steatosis, reinforcing EPL’s hepatoprotective potential despite variable glycemic outcomes. 39
Mechanistically, PC contributes to the improvement of liver function, lipid metabolism, and systemic metabolic homeostasis in MASLD through multiple, interrelated pathways. At the hepatic level, PC plays a critical role in lipid regulation by facilitating the assembly and secretion of very-low-density lipoproteins, which promotes triglyceride export and prevents hepatic fat accumulation.40,41 It also activates peroxisome proliferator-activated receptor alpha (PPARα), thereby enhancing fatty acid β-oxidation, while simultaneously suppressing sterol regulatory element-binding protein-1c (SREBP-1c), a key regulator of de novo lipogenesis.27,42,43 PC also exhibits antioxidant and anti-inflammatory properties. It has been shown to decrease ROS production, downregulate pro-inflammatory cytokines, and stabilize hepatocyte membranes, thereby mitigating cellular injury and inflammation30,44
Beyond hepatic effects, PC supports systemic metabolic function by enhancing insulin sensitivity and glucose regulation. It modulates membrane phospholipid composition, improving membrane fluidity and insulin receptor activity, while attenuating inflammatory signaling pathways that contribute to insulin resistance. Through these mechanisms, PC contributes to better glycemic control and broader metabolic stability.45–48
In light of the observed biochemical and metabolic improvements, structural hepatic changes were evaluated using ultrasound and transient elastography. After 12 weeks of PC supplementation, the choline group exhibited a significant reduction in CAP scores compared to controls (304 vs 332 dB/m, p < 0.001), with a median within-group decrease of 44 dB/m (from 348 to 304 dB/m, p < 0.001). Ultrasound assessments further demonstrated significant reductions in liver size (right lobe: −1.5 cm; left lobe: −1.0 cm) and a downward shift in steatosis grading, changes not observed in the control group. Additionally, a significant improvement in liver stiffness measurements was observed between the choline and control groups at 12 weeks (5.3 kPa vs 6.8 kPa, p < 0.001), with 66.7% achieving at least a one-stage fibrosis reduction, compared to 18.4% in the control group (p < 0.001). These findings suggest that PC supplementation may promote both steatosis resolution and fibrosis regression in MASLD.
These findings are consistent with imaging outcomes from previous clinical studies. In a 24-week trial involving 324 NAFLD patients treated with 1800 mg/day of EPL, ultrasound revealed normalization of hepatic fat in 4.6% of patients and a 24% downgrade from Grade II to Grade I steatosis. Liver stiffness measurements also improved in 21.1% of patients, with an average reduction of 3.1 kPa per patient. 32 Similarly, a large observational study of 2843 patients receiving PPC at 1.8 g three times daily demonstrated significant improvements in liver echogenicity and morphology across various cardiometabolic subgroups. 49
A study by Chai et al. analyzed data from 2827 U.S. adults and found that higher dietary choline intake was inversely associated with CAP scores. Those with optimal choline intake had a significantly lower risk of developing NAFLD. 18 Another randomized trial combining PC supplementation with lifestyle intervention demonstrated that a higher proportion of participants showed improvements in steatosis grades at 3 and 6 months (48% and 76%) compared to controls (28% and 44%; p < 0.05). Similarly, fibrosis stage improvements were more frequent in the intervention group at 6 months (54% vs 30%, p = 0.015). 31
Another 2-month trial of oral regular or lycosome-formulated PC (L-PC, 450 mg daily) significantly reduced liver size at the mid-clavicular (16.0–15.1 cm; p = 0.021) and mid-sternal lines (7.2–6.8 cm; p = 0.018). 50 Collectively, the imaging findings underscore the therapeutic potential of PC supplementation in reducing hepatic steatosis and fibrosis. These structural improvements likely reflect the modulation of key pathogenic pathways, particularly oxidative stress, a central driver of hepatocellular injury and the progression from simple steatosis to MASH. Thiobarbituric acid reactive substances (TBARS), which measure malondialdehyde and related lipid peroxidation byproducts, serve as established indicators of oxidative damage.51,52
Elevated TBARS levels have been consistently reported in patients with NAFLD and NASH, particularly those with type 2 diabetes (p < 0.001), and are independently associated with NAFLD risk, even after adjusting for abdominal fat, insulin resistance, lipid profiles, and inflammation.53–55 Similarly, this study observed elevated baseline TBARS levels, which declined markedly in the choline group after 12 weeks (p < 0.001) and were significantly lower than in the control group at study end (p < 0.001).
Similar findings were observed in a previous study on Realsil (RA), containing silybin, PC, and vitamin E, which identified two NASH subgroups based on TBARS response. Patients with high baseline TBARS and milder disease showed greater reductions in TBARS, insulin resistance, and histological scores after treatment. In contrast, those with advanced disease and low TBARS had limited histological improvement, suggesting impaired export rather than reduced oxidative stress. 56
These findings suggest that PC supplementation reduces oxidative stress in NAFLD by stabilizing hepatocyte membranes, preserving phospholipid composition, and decreasing susceptibility to oxidative damage. By limiting lipid peroxidation and attenuating ROS accumulation, PC lowers the production of deleterious byproducts and contributes to an overall reduction in oxidative stress markers.10,41,57
While TBARS offers insight into oxidative stress in MASLD, additional biomarkers offer complementary perspectives on disease activity and progression. Notably, leptin, a hormone primarily secreted by adipocytes, plays a central role in regulating energy balance, insulin sensitivity, and inflammation. Dysregulated leptin signaling is implicated in obesity, metabolic syndrome, and type 2 diabetes, and contributes to hepatic lipogenesis, oxidative stress, inflammation, and fibrosis.58–61
Elevated serum leptin levels have been consistently linked to NAFLD severity. In a population-based NHANES III analysis (n = 4571), leptin concentrations rose significantly with increasing hepatic steatosis and fibrosis (p < 0.001). 62 Similarly, a systematic review and meta-analysis confirmed higher leptin levels in NAFLD patients compared to controls (p < 0.001), with a stepwise increase from steatosis to NASH. 63
In the current study, PC supplementation significantly reduced serum leptin levels at 12 weeks compared to both baseline and the control group (p < 0.001). Leptin levels showed a strong positive correlation with TBARS (r = 0.642; p < 0.001), while both were inversely correlated with PC levels (leptin: r = –0.480; TBARS: r = –0.504; p < 0.001).
To date, no clinical trials have directly examined the effect of PC supplementation on leptin levels in patients with NAFLD. However, preclinical studies provide supportive evidence for its potential role. In a high-fat diet-induced obese mouse model, PC significantly reduced weight gain, hepatic lipid accumulation, and serum triglyceride, cholesterol levels, and liver enzymes (AST, ALT). Importantly, PC also suppressed serum leptin and improved histological steatosis. 26 Another animal study assessing choline combined with caffeine and carnitine found significant reductions in body weight, fat pad mass, and serum leptin. Leptin levels closely correlated with body weight, fat mass, and glucose levels, suggesting that choline’s effect on leptin may be mediated through improvements in adiposity and glucose metabolism. 64
Collectively, these findings suggest that PC attenuates leptin-driven inflammation and metabolic dysfunction in MASLD through multiple, interrelated mechanisms. Elevated leptin levels are known to exacerbate oxidative stress by stimulating ROS production via NADPH oxidase and impairing mitochondrial function, leading to lipid peroxidation.65–67 Hyperleptinemia also promotes hepatic injury by inducing pro-inflammatory cytokines such as TNF-α and IL-6 and activating hepatic stellate cells, thereby advancing fibrosis through ROS-mediated pathways.68–70
PC modulates leptin dynamics through several interrelated mechanisms. By enhancing lipid metabolism, reducing lipid peroxidation, and improving insulin sensitivity, further contributing to normalized leptin signaling.46,71,72 It also maintains adipocyte membrane integrity, supporting proper hormone secretion,15,16,73 and exerts anti-inflammatory effects that mitigate leptin resistance driven by chronic inflammation and oxidative stress.74–76 These combined actions reinforce PC’s therapeutic potential in MASLD by disrupting the feedback loop between leptin dysregulation and metabolic dysfunction.
This study is limited by a relatively small sample size and short duration, as well as its single-blinded design, which was necessitated by the technical challenges of producing placebo soft gel capsules identical in appearance to those containing phosphatidylcholine. Additionally, potential confounding variables, such as dietary intake and physical activity, were not comprehensively assessed or controlled for in the study design.
Conclusion
This study provides encouraging evidence that phosphatidylcholine supplementation may offer therapeutic benefits in patients with NAFLD, as indicated by significant reductions in liver enzymes, serum leptin, and TBARS levels, as well as improvements in liver fibrosis and controlled attenuation parameter scores. These findings suggest that phosphatidylcholine may serve as a promising adjunctive therapy in the management of MASLD. Nevertheless, in light of the study’s limitations, larger, well-powered, and longer-term clinical trials with clearly defined clinical endpoints are needed to validate these results and further clarify phosphatidylcholine’s role in the prevention and treatment of MASLD and its progression to advanced liver disease.
Supplemental Material
sj-doc-1-taj-10.1177_20406223251358659 – Supplemental material for The impact of choline supplementation on oxidative stress and clinical outcomes among patients with non-alcoholic fatty liver disease: a randomized controlled study
Supplemental material, sj-doc-1-taj-10.1177_20406223251358659 for The impact of choline supplementation on oxidative stress and clinical outcomes among patients with non-alcoholic fatty liver disease: a randomized controlled study by Sylvia S. Sedhom, Lamia M. El Wakeel, Eman M. F. Barakat, Hend I. Shousha, Mostafa A. Shamkh, Salwa H. Salama, Doaa Z. Zaky and Amal A. El Kholy in Therapeutic Advances in Chronic Disease
Footnotes
References
Supplementary Material
Please find the following supplemental material available below.
For Open Access articles published under a Creative Commons License, all supplemental material carries the same license as the article it is associated with.
For non-Open Access articles published, all supplemental material carries a non-exclusive license, and permission requests for re-use of supplemental material or any part of supplemental material shall be sent directly to the copyright owner as specified in the copyright notice associated with the article.