
Abstract
Background:
Magnesium (Mg) deficiency is closely linked with proteinuria.
Objectives:
To assess the impact of oral Mg citrate supplementation on the clinical outcome of diabetic nephropathy (DN) patients.
Design:
This was a prospective, randomized, controlled, open-label study.
Methods:
Sixty DN patients were recruited from Nephrology and Endocrinology departments, Ain Shams University Hospitals, Cairo, Egypt. Patients were assigned by stratified randomization based on their Mg status, to either Mg citrate group, (n = 30), who received the standard regimen + oral Mg citrate 2.25 g/day or Control group, (n = 30), who received the standard regimen only. The primary endpoint was a change in urinary albumin to creatinine ratio (UACR) after 12 weeks. Secondary outcomes were insulin resistance, glycemic control, lipid profile, serum osteocalcin, quality of life (QoL) and Mg tolerability.
Results:
Out of a total of 60 patients enrolled, only 54 patients (26 in Mg citrate group and 28 in the control group) completed the study. Groups were comparable at baseline. The UACR median percent reduction was significantly higher in the Mg citrate group (−6.87%) versus (−0.9%) in the Control group, p = 0.001. After 12 weeks, the estimated glomerular filtration rate significantly improved in the Mg citrate group versus Control group (p = 0.001). Comparable change was observed in glycemic indices. Lipid profile significantly improved in the Mg citrate group versus Control group (p = 0.001). Serum osteocalcin levels significantly declined in the Mg citrate group (p = 0.001) versus control group. Regarding QoL, the total score and all domains significantly improved in the Mg citrate group compared to control. The Mg supplement was tolerable with only mild reported side effects that required no intervention.
Conclusion:
Oral Mg citrate supplementation improved microalbuminuria in DN patients. It also had favorable effects on serum osteocalcin, lipid profile and QoL with no reported major side effects.
Trial registration:
ClinicalTrials.gov identifier: NCT03824379.
Introduction
Diabetic nephropathy (DN) is the most frequent microvascular complication of type-2 diabetes mellitus affecting 30% to 40% of diabetic patients and is considered one of the major causes of end-stage renal disease (ESRD) worldwide with the pathogenesis being attributed to oxidative stress (OS) and inflammation. 1 Moreover, DN pathophysiology and progression to ESRD are significantly associated with hypomagnesemia.2,3 The estimated prevalence of hypomagnesemia in DN patients ranged from 13.5% to 47.7%. 4 Furthermore, higher magnesium (Mg) levels have been reported to improve survival among chronic kidney disease (CKD) and ESRD patients. 5
Microalbuminuria and clinical proteinuria, as well as poor glucometabolic control and atherogenic dyslipidemia were associated with Mg deficiency.6–8 Moreover, serum Mg was inversely correlated with serum creatinine and microalbuminuria, and positively correlated with glomerular filtration rate in DN patients. 2 Hypomagnesemia was associated with osteoporosis in rat models and high bone turnover biomarkers such as serum osteocalcin (OC) in sickle-cell anemia patients. 9 Besides, there was a positive correlation between serum Mg and bone mineral density (BMD) in postmenopausal women. 10 Generally, higher Mg levels were associated with improved quality of life (QoL). 11
Magnesium acts as a cofactor for several enzymes, regulating many functions such as mineral bone metabolism, energy production, glycemic control, lipid metabolism, OS and inflammation reduction. 12
Interestingly, previous studies showed positive clinical outcomes of Mg supplementation in normomagnesemia population13,14 which could be attributed to depletion in intracellular and serum ionized Mg with total serum Mg even in the normal range. 15 The current study was designed to evaluate the efficacy and safety of Mg supplementation in DN patients.
Patients and methods
Study design and setting
The study was a prospective, randomized, controlled, open-label study conducted at the department of Nephrology and the department of Endocrinology and Metabolism, Ain Shams University Hospitals, Cairo, Egypt.
Study population
All patients presented to the Nephrology and Endocrinology units were screened for eligibility according to specific inclusion and exclusion criteria. To be included in the study, patients had to be >18 years old and diagnosed with type II diabetes and CKD stage 3 (estimated glomerular filtration rate (eGFR) = 30 − 59 ml/min/1.73 m2) or stage 4 (eGFR = 15–29 ml/min/1.73 m2) with moderately increased urinary albumin to creatinine ratio (UACR) of 30–300 mg/g (microalbuminuria), low serum Mg levels (<1.8 mg/dl) to normal levels (1.8–2.4 mg/dl) and life expectancy >12 months. The patients should have been receiving oral antidiabetic agents for diabetes management. Patients were excluded if they were kidney donor/recipient or had any of the following: current or previous treatment with Mg supplements at least 3 months prior to inclusion, active malignancy, pregnancy or breastfeeding, cardiac arrythmias or hypersensitivity to Mg supplements.
Eligible patients were randomly assigned by stratified randomization equally according to their Mg status, to either Mg citrate group (n = 30) who received their standard regimen in addition to oral Mg citrate 2.25 g/day (equivalent to 15 mmol/360 mg of elemental Mg per day) for 12 weeks16,17 or Control group (n = 30) who received their standard regimen only for 12 weeks. Standard treatment included antihypertensives as angiotensin-converting enzyme inhibitors (ACE-I) or angiotensin II receptor blockers, beta blockers or calcium channel blockers, antidiabetics as metformin and sulfonylurea and lipid lowering drugs as statins.
Magnesium was supplied as sachets; each sachet contained 2.25 g of Mg citrate. The use of Mg citrate was under the trade name of Epimag® manufactured by EIPICO Company, Cairo, Egypt.
Methodology
At baseline, all patients were subjected to a full clinical examination together with demographic and clinical data collection. A sterile spot urine sample was collected at baseline and after 12 weeks to estimate UACR. Albumin-to-creatinine ratio was assayed by colorimetric/fluorometric technique using commercial kit manufactured by ‘LifeSpan BioSciences™, Washington, USA’ (Catalogue No.: LS-K562-100). The test was reported in milligrams of albumin per gram of creatinine (mg/g) found in one deciliter of urine. Besides, serum creatinine was assayed colorimetrically with ‘BioAssay systems™, California, USA’ assay kit and blood urea nitrogen (BUN) was assayed colorimetrically with ‘BioSystems™, Cairo, Egypt’ commercial kit. Triglycerides (TG), total cholesterol (TC), low density lipoprotein cholesterol (LDL-C) and high-density lipoprotein cholesterol (HDL-C) were assayed colorimetrically using commercial kits supplied by ‘HUMAN Diagnostics™, Wiesbaden, Germany’. Serum Mg, calcium (Ca) and phosphorus (P) were assayed colorimetrically using ‘Elabscience™, Texas, USA’ commercial kits. All the variables were assessed at baseline and after 12 weeks. Notably, eGFR was calculated using the Modification of Diet in Renal Disease equation [eGFR = 175 × (SCr)−1.154 × (age)−0.203 × 0.742 (if female) × 1.212 (if Black)]. 18
Glycated hemoglobin (HbA1c) was assayed at baseline and after 12 weeks by Enzyme Linked Immunosorbent Assay (ELISA) technique using ‘MyBioSource™, California, USA’ research kit. Fasting blood glucose (FBG) was assayed colorimetrically using ‘Cayman Chemical™, Michigan, USA’ commercial kit and fasting insulin was assayed by ELISA technique using research kit supplied by ‘RayBiotech™, Georgia, USA’. Both HbA1c and FBG were assessed at baseline and after 12 weeks to evaluate Homeostatic Model Assessment of Insulin Resistance (HOMA-IR) according to the following formula: 19

Moreover, a blood sample was withdrawn for each patient at baseline and after 12 weeks to assess serum OC by ELISA technique using ‘FineTest™, Wuhan, China’ research kit (Catalogue No.: EH3468). Patients’ sera were stored at −80°C till analysis.
QoL assessment was performed for both groups at baseline and after 12 weeks using Diabetes 39 (D-39) assessment questionnaire. The questionnaire was administered by a blinded nurse using printed paper questionnaire. The questionnaire is comprised of 39 items that assess QoL with respect to five domains: energy and mobility (15 items), diabetes control (12 items), anxiety and worry (4 items), social burden (5 items) and sexual functioning (3 items). It also includes two items ‘overall ratings’ to evaluate the perceived overall QoL and the severity of diabetes. The questionnaire is available in validated Arabic form. 20 Questions responses are on a Likert scale from 1 to 7 with 1 representing QoL not affected at all, and 7 extremely affected. The domain score was calculated by simple summation of the domain’s questions score and the overall score was obtained by the summation of the domains’ score. Each domain scores and the overall score were transformed linearly from 0 to 100 scales by applying the following formula: [(gross classification − minimum value)/(maximum value − minimum value) × 100]. 21
Patients were educated about the expected adverse effects and were required to report the incidence of any of them. The patients were followed up through weekly phone calls and monthly visits to assess patients’ compliance and asking the patients to report any adverse effects. In addition, to ensure compliance, patients were given a different number of sachets each time and the number of remaining sachets was counted at each visit. Patients with less than 85% compliance were dropped out from the study.
Urinary albumin to creatinine ratio was the study primary outcome, while the other biomarkers, safety and QoL were the study’s secondary outcomes.
Statistical analysis
Numerical data were represented as mean ± standard deviation or median and interquartile range (IQR) as appropriate while categorical data were summarized as frequency and percentages. Numerical data were tested for normality using Shapiro-Wilk and Kolmogorov-Smirnov tests. For normally distributed data, Student’s t-test was used for comparison between two groups while paired t-test was used for within-group comparisons. For non-normally distributed data, Mann–Whitney test was used for comparison between two groups while Wilcoxon signed-rank test was used for within-group comparisons. Categorical data were compared by chi-square or Fisher’s exact test as appropriate. Percent change was calculated as follow {[(after treatment values − baseline values)/baseline values]*100} and was compared between the two groups using Student’s t-test or Mann–Whitney test as appropriate. All p values were 2-sided and p value < 0.05 was considered significant. The statistical analysis was performed by Statistical package for Social Science (SPSS 19.0.1 for windows; SPSS Inc, Chicago, IL, USA, 2001).
Sample size calculation
Owing to lack of previous studies examining the effect of Mg on microalbuminuria in DN patients at the time of the study conduction, and since Mg might improve UACR through its antioxidant/anti-inflammatory effect, sample size was calculated based on a previous study evaluating thiamine effect as an antioxidant on microalbuminuria in type 2 diabetes. 22 The difference in the microalbuminuria level between high dose thiamine and placebo groups was 5.4 with pooled standard deviation of 6.4. Based on these findings, a minimal sample size of 23 subjects in each group (46 total) is required at an alpha level of 0.05 and power of 80%. To compensate for dropouts, the sample will be increased by 30% to be 30 subjects in each group (total sample size of 60 subjects). Sample size was estimated using NQuery statistical package, version 7.0, Los Angeles, CA, USA.
Results
From February 2019 till March 2020, a total of 148 patients were assessed for eligibility and 60 DN patients fulfilled the eligibility criteria and were included in the study. Six patients dropped out from the study due to non-compliance (n = 3), moving to another city (n = 2) and death due to myocardial infarction (n = 1). The study flow chart is represented in Figure 1.

The study flow chart.
Baseline demographic and clinical characteristics evaluation
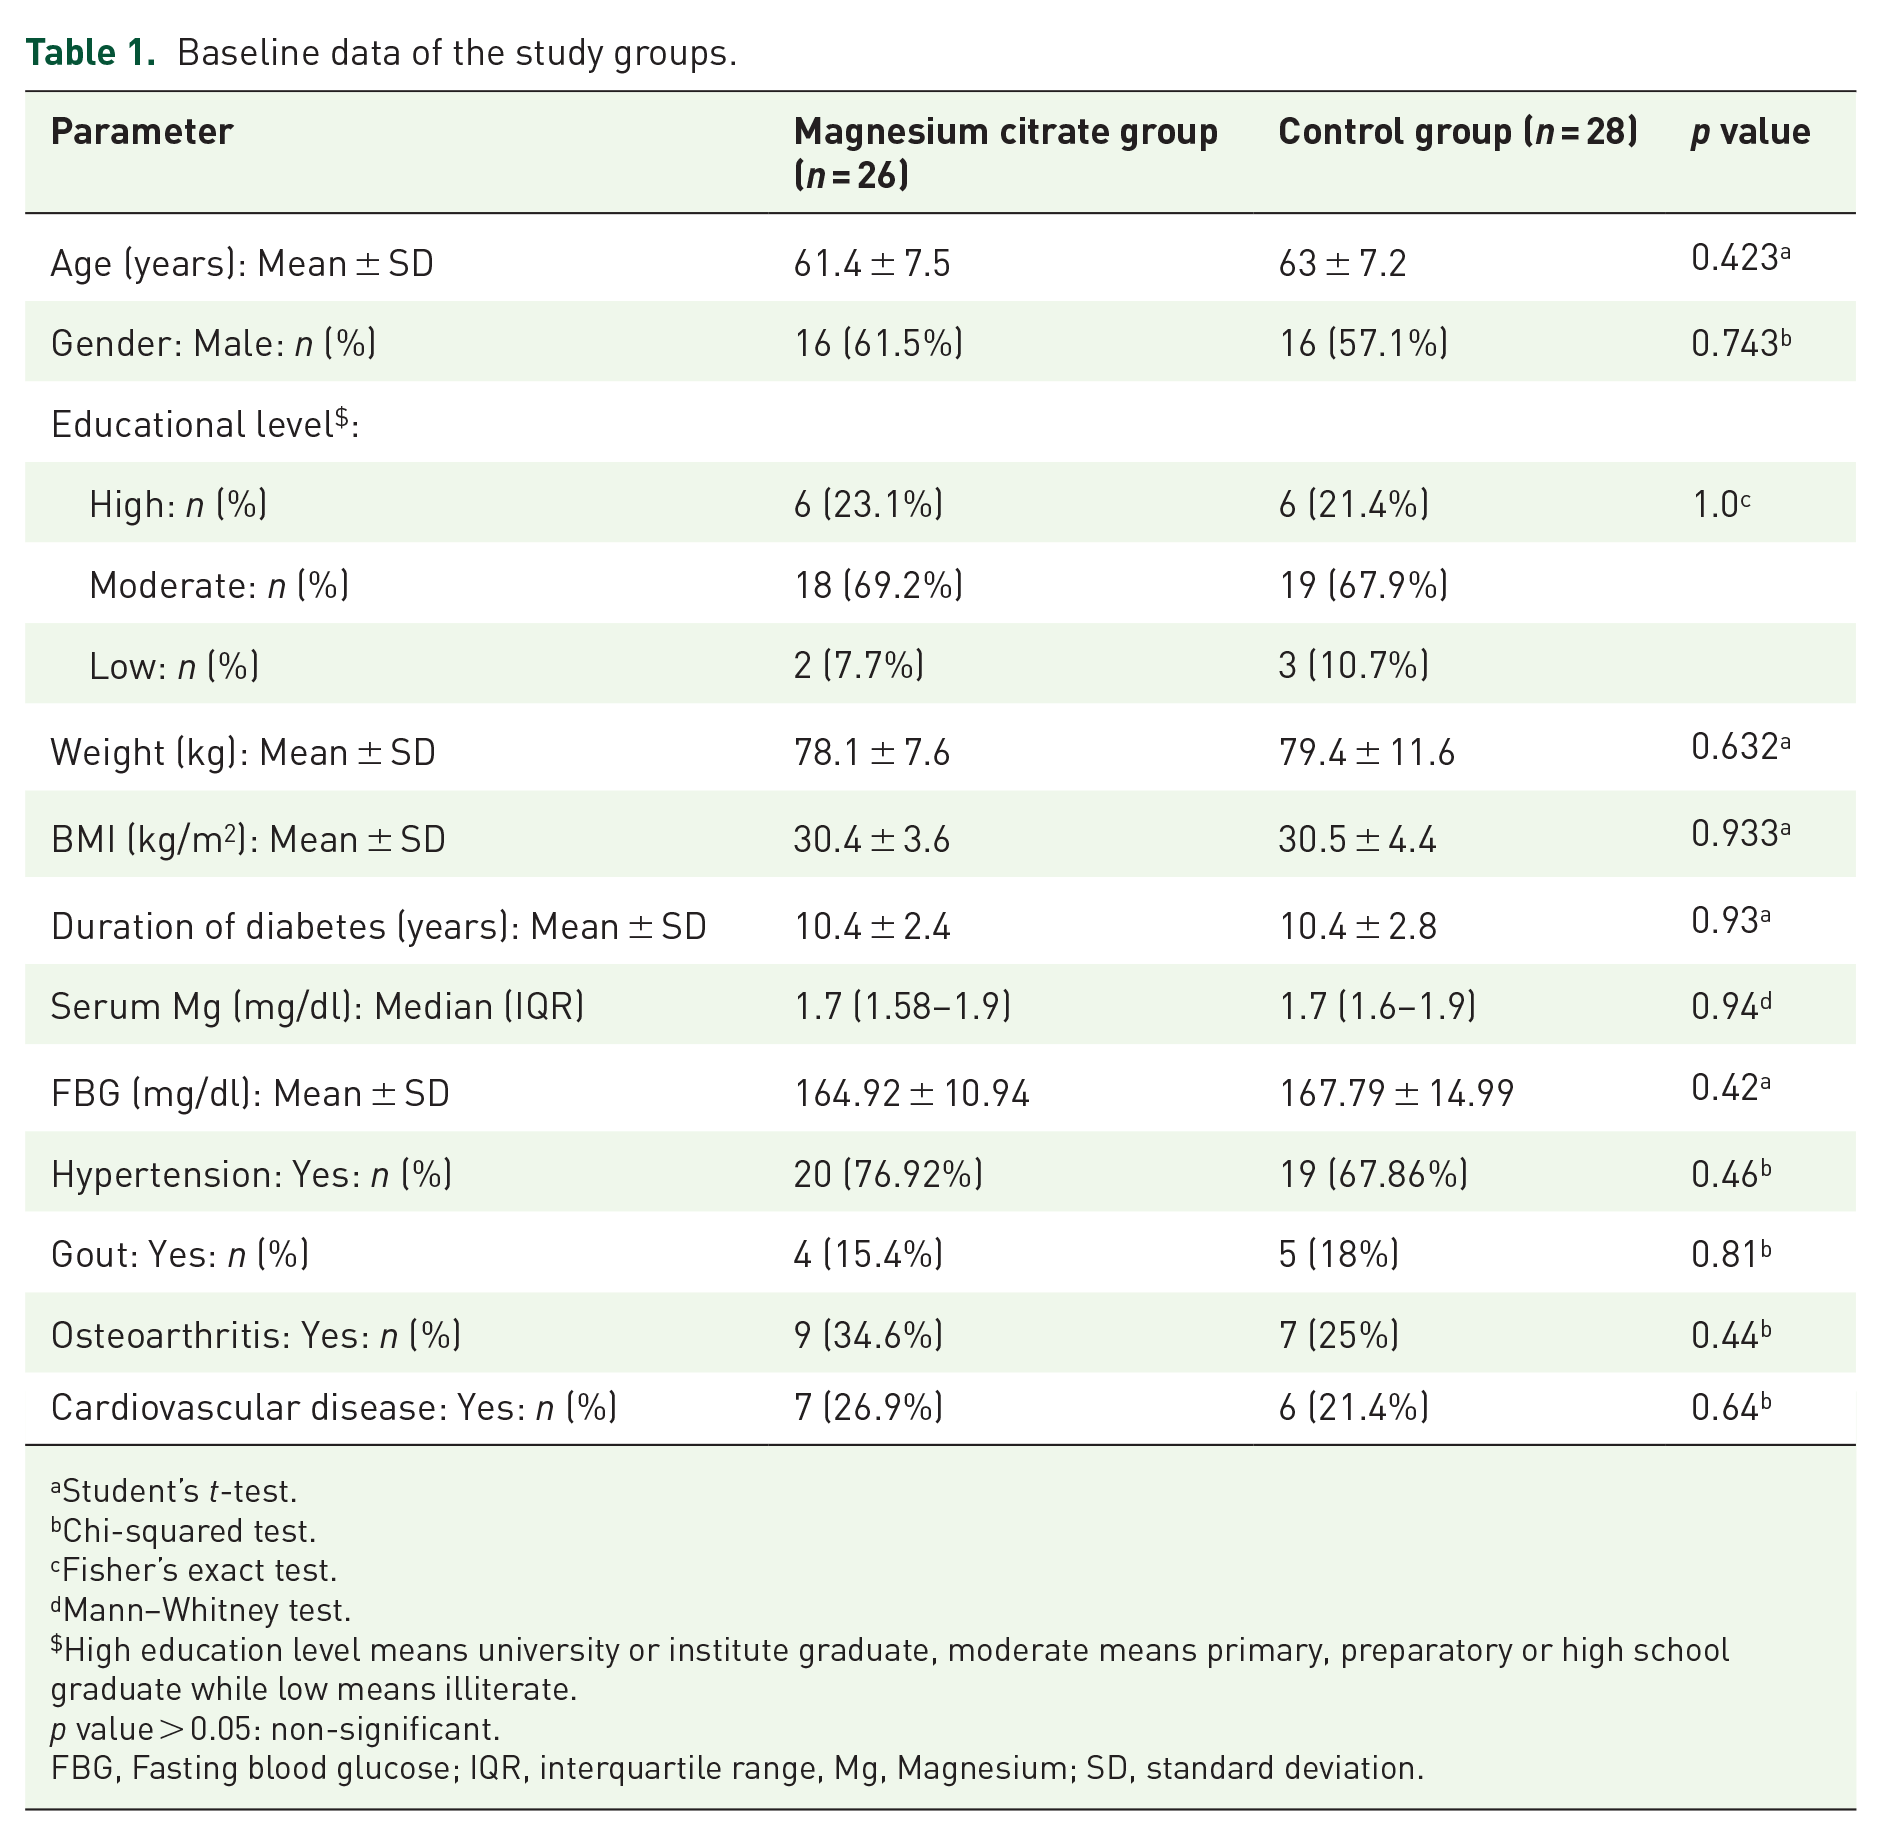
Baseline data are summarized in Table 1. The age range of the study participants in both groups was from 44 to 78 years old with male gender representing 59% of the study participants. Most patients were obese with mean BMI of all participants equal to 30.5 kg/m2 and around 69% of them received moderate education. Baseline demographic data was comparable between the two groups. Overall, the duration of diabetes ranged from 7 to 17 years and hypertension represented the major comorbidity reported among the study participants (72.2%) with no statistical significance between the two groups regarding duration of diabetes, FBG and comorbidities. Around 54% of patients were hypomagnesemic distributed equally in each group. Regarding the routine therapy of the study groups, 85% of the participants received sulfonylurea as the major antidiabetic drug used, 72.2% received metformin and 5.6% received sodium-glucose cotransporter-2 (SGLT-2) inhibitors (one patient in Mg citrate group and two in control). Around 40.7% of them received ACE-I as the major antihypertensive drug and none of the patients were on diuretic therapy. Both groups were comparable with respect to the routine therapy used.
Baseline data of the study groups.
Student’s t-test.
Chi-squared test.
Fisher’s exact test.
Mann–Whitney test.
High education level means university or institute graduate, moderate means primary, preparatory or high school graduate while low means illiterate.
p value > 0.05: non-significant.
FBG, Fasting blood glucose; IQR, interquartile range, Mg, Magnesium; SD, standard deviation.
End of study evaluation
Kidney function parameters
Table 2 summarizes the UACR and eGFR data of the study groups. At baseline, both groups were comparable with no significant difference between groups. Within-group comparisons revealed a significant reduction in UACR in the Mg citrate group only. However, comparisons between the two groups after 12 weeks showed a non-significant difference. Hence, percent change was calculated and compared. Patients receiving Mg citrate had a significantly larger UACR median percent reduction (−6.87%) versus (−0.9%) in Control group; p = 0.001.
Kidney function parameters at baseline and after 12 weeks of treatment for the study groups.
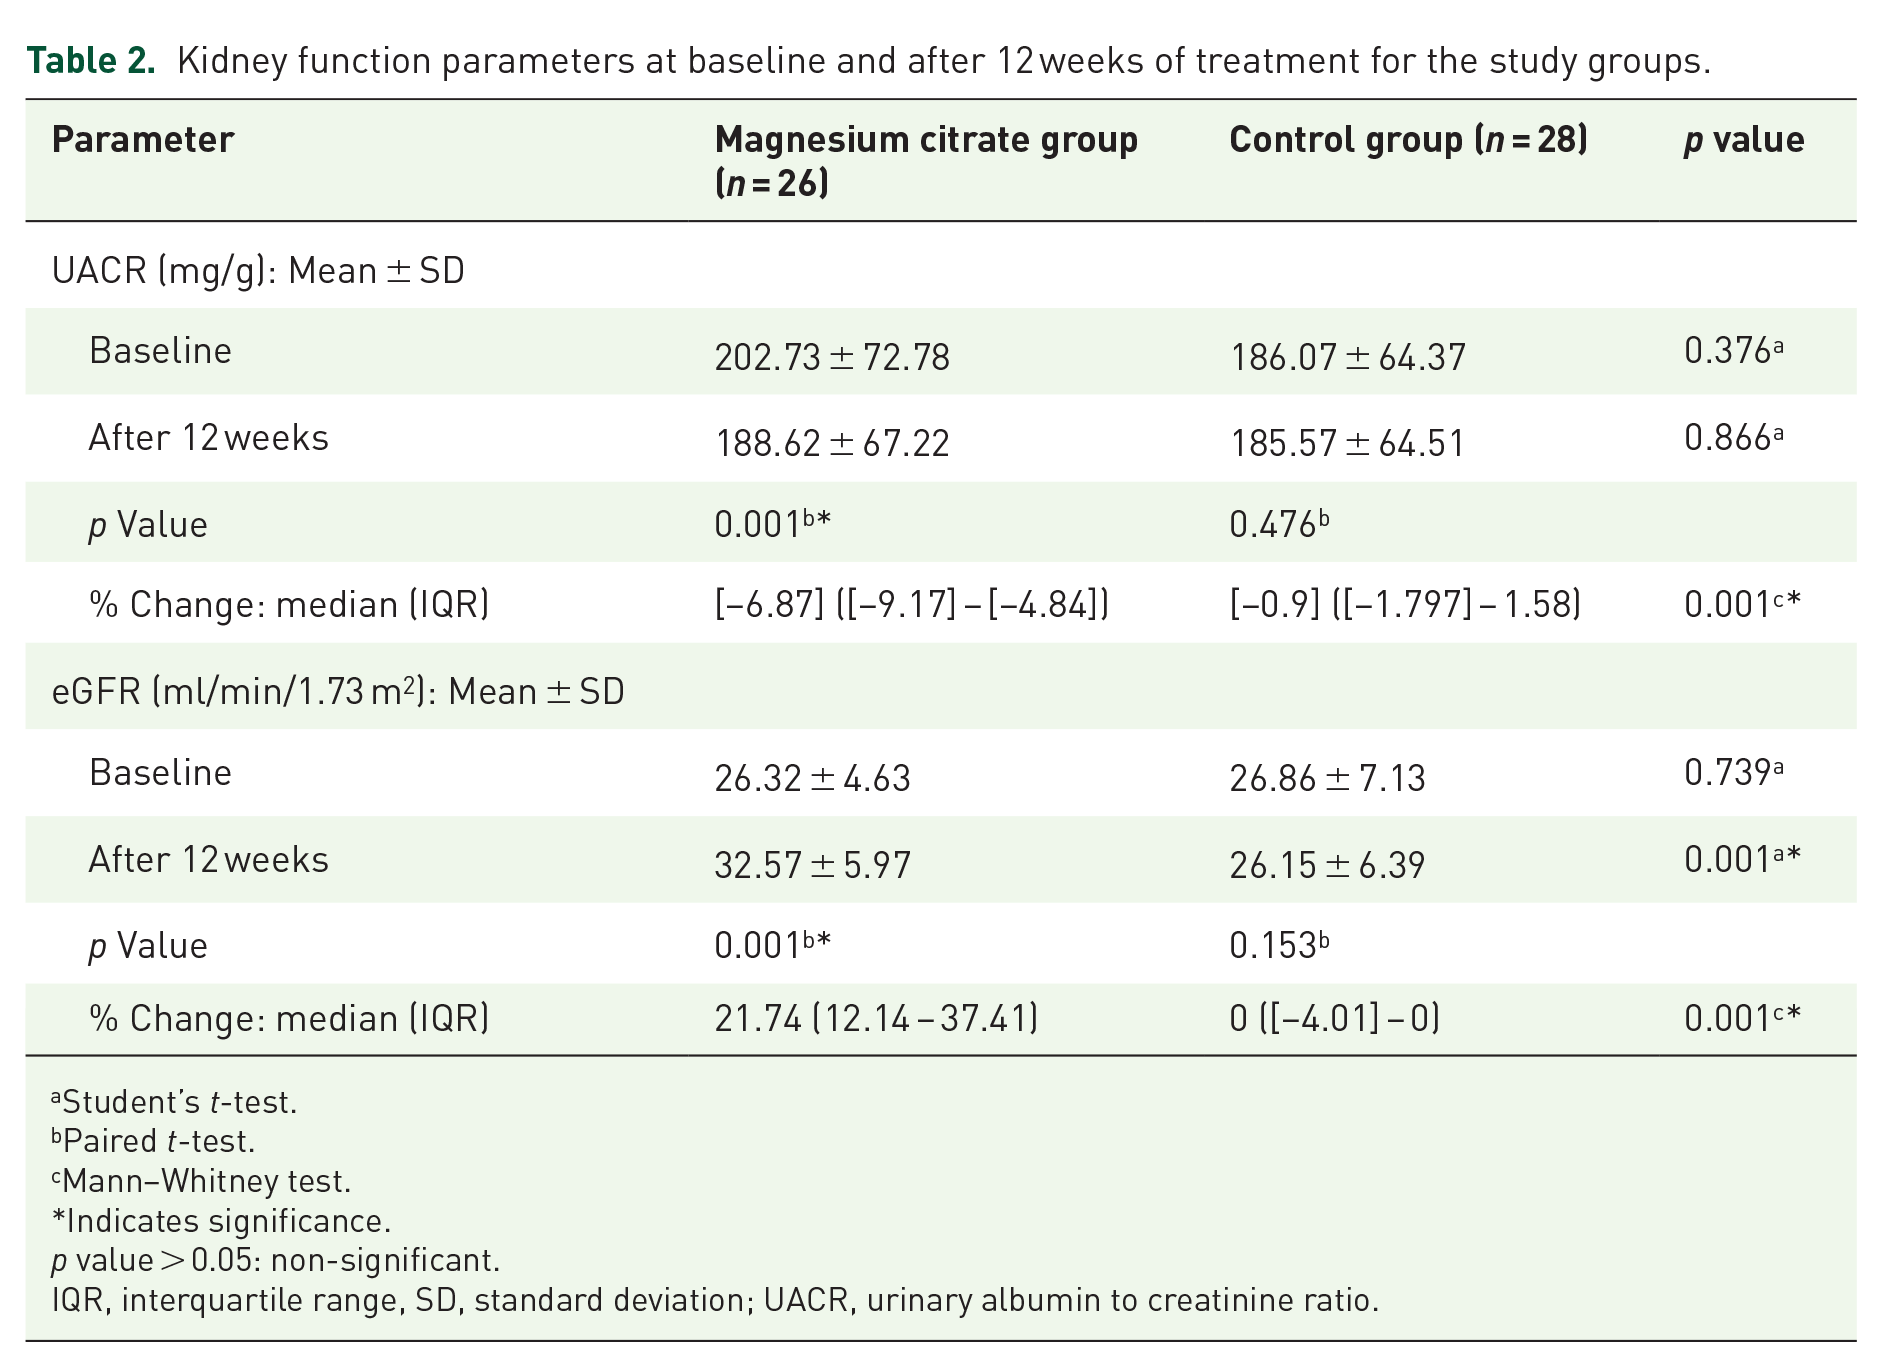
Student’s t-test.
Paired t-test.
Mann–Whitney test.
Indicates significance.
p value > 0.05: non-significant.
IQR, interquartile range, SD, standard deviation; UACR, urinary albumin to creatinine ratio.
Regarding eGFR, at baseline, the two groups were comparable with a range of 17.7 ml/min/1.73 m2 to 42.7 ml/min/1.73 m2 among the participants. There was a significant difference between the two groups after 12 weeks; p = 0.001. In the Mg citrate group, after 12 weeks, eGFR increased significantly from baseline values (p = 0.001) versus a non-significant decrease in control (p = 0.153). Percent change analysis showed significant higher increase in eGFR in Mg citrate group compared to control.
Metabolic profile
Metabolic profile comparisons between the study groups are summarized in Table 3. Since Control group had a significantly higher HOMA-IR levels at baseline, comparisons between groups were based on the percent change to compensate for baseline difference. It was found that the median percent reduction was approximately 6% in both groups. Regarding HbA1c, no significant difference was observed between the two groups at baseline and after 12 weeks. However, after 12 weeks, the mean HbA1c values were reduced significantly within both groups. The median percent reduction was comparable between both groups.
Metabolic profile parameters at baseline and after 12 weeks of treatment for the study groups.

Student’s t-test.
Mann–Whitney test.
Paired t-test.
Indicates significance.
p value > 0.05: non-significant.
HbA1C, Glycated hemoglobin; HDL-C, high-density lipoprotein cholesterol; HOMA-IR, Homeostatic Model Assessment of Insulin Resistance; IQR, interquartile range; LDL-C, low density lipoprotein cholesterol; SD, standard deviation.
Concerning the lipid profile, at baseline both groups were comparable with respect to TC, LDL-C and TG. In comparison with baseline, after 12 weeks, TC dropped significantly in the Mg citrate group (−19.61 ± 1.79; p = 0.001) versus (−0.79 ± 1.88; p = 0.38) in control group. The same was observed for LDL and triglyceride where the reduction was (−17.54 ± 0.14; p = 0.001 and −35.27 ± 6.21; p = 0.001) for LDL-C and TG in the Mg citrate group, respectively versus an increase by (0.18 ± 0.28; p = 0.877 and 0.82 ± 1.29; p = 0.482) for LDL-C and TG in the Control group, respectively. Percent changes comparisons for TC, LDL-C and TG revealed statistically significant improvement in Mg citrate group compared to control. With respect to HDL, despite the Control group having significantly higher levels compared to the Mg citrate group, HDL-C had a mean percent increase of 23% in the Mg citrate group compared to 0.49% in the Control group (p = 0.001).
Serum osteocalcin
At baseline, serum OC levels were comparable in both groups with mean values ± SD of 36.32 ± 5.92 in the Mg citrate group versus 36.79 ± 5.78 in the Control group (p = 0.77). However, after 12 weeks, serum OC levels were significantly lower in the Mg citrate group (32.38 ± 5.75) compared to the Control group (36.96 ± 5.32) with p = 0.004. Besides, within-group comparisons revealed a significant reduction in serum OC in the Mg citrate group only. These data are presented in Figure 2.

Box plot showing serum osteocalcin level at baseline and at the end of the study in the two groups. p Values provided are for comparisons between baseline and after 12 weeks in each group.
Quality of life
There was a significant improvement in the overall score of the QoL questionnaire in the Mg citrate group compared to the Control group. The same was observed for the analysis of the five domains. These data are represented in Table 4.
Diabetes 39 (D-39) assessment questionnaire for the study groups.

Student’s t-test.
Paired t-test.
Mann–Whitney test.
Indicates significance.
p Value > 0.05: non-significant.
IQR, interquartile range; SD, standard deviation.
Subgroup analysis based on serum magnesium level
Subgroup analysis based on serum Mg level is represented in Supplemental 1. The analysis has shown similar results indicating that the effect of Mg was the same for patients with hypomagnesemia and normomagnesemia.
Safety evaluation
Safety evaluation data are summarized in Table 5. Despite the significant elevation of serum Mg in the Mg citrate group, none of the patients developed hypermagnesemia. In addition, there was no significant difference between the two groups at baseline and after 12-weeks in serum Ca and phosphorus. Using Chi-squared test, there was a significant difference between the study groups regarding occurrence of diarrhea (84.6% versus 25%,), abdominal cramp (65.4% versus 32.1%), and flatulence (65.4% versus 35.7%) with higher percent reported in the Mg citrate group. However, no significant difference between the study groups was found with regard to the occurrence of vomiting (p = 0.135). The reported side effects were mild and required no intervention.
Safety profile for the study groups.

Mann–Whitney test.
Wilcoxon signed-rank test.
Student’s t-test.
Paired t-test.
Chi-squared test.
Fisher’s exact test.
Indicates significance.
p value > 0.05: non-significant.
IQR, interquartile range, Mg, Magnesium; SD, standard deviation.
Discussion
The current study used Mg supplementation in the form of Mg citrate since it has been reported that it is more absorbable and bioavailable than Mg oxide and Mg sulfate.23,24 The aim of the current study was to evaluate the effect of Mg supplementation on microalbuminuria which is considered an important index to assess the progression of DN and albuminuria reduction is considered a treatment target in DN as recommended by KDIGO guidelines. 25
Mg deficiency causes endothelial cell injury, mostly in the glomerular vessel, due to inflammation and OS leading to proteinuria. 26 In the current study, in both hypomagnesemia and normomagnesemia subjects, a significant decrease in microalbuminuria and improvement in eGFR were observed in the Mg citrate group in line with the results of a previous trial on hypomagnesemic DN patients. 27 On the contrary, a recent study conducted on DN patients irrespective of Mg status, showed no significant improvements in renal outcomes. This could be attributed to the use of lower doses of elemental Mg (250 mg), less bioavailable form (Mg oxide) and a non-significant increase in serum Mg levels after 12 weeks of intervention compared to the current trial. 28
There was a significant improvement in HbA1c and HOMA-IR observed in both groups with no significant difference between them. This could be justified by the rigorous follow up of patients’ compliance throughout the study. This was similar to previous results reported in two systematic reviews and meta-analyses29,30 where Mg supplementation did not show any positive outcomes on HbA1c and HOMA-IR in accordance with the results of current study.
It is well known that dyslipidemia is associated with CKD progression and high cardiovascular disease (CVD) morbidity and mortality in DN patients. 31 Many experimental studies provided possible mechanisms of dyslipidemia due to Mg deficiency. Decreased TG clearance, reduced lipoprotein lipase activity, increased β-hydroxy β-methylglutaryl-CoA reductase activity and reduced insulin sensitivity appear to be the major mechanism of hyperlipidemia.32,33 Besides, Mg deficiency enhances catecholamine secretion which increases lipolysis and subsequent elevation of plasma free fatty acids and TG. 34 This study showed significant improvement in lipid profile including LDL-C, HDL-C, TC and TG in the Mg citrate group in both hypomagnesemia and normomagnesemia subjects compared to controls. A recent systemic review and meta-analysis done on type 2 diabetic patients reported a significant reduction in LDL-C with no effect on other lipid profile. However, a significant improvement of HDL-C was observed in subgroup analysis in those receiving more than 300 mg/day elemental Mg supporting the observed beneficial effects in the current study where subjects received 360 mg/day elemental Mg. 35
Abnormalities in bone turnover prevail in CKD–mineral and bone disorder (CKD–MBD), with high turnover due to secondary or tertiary hyperparathyroidism and low turnover, such as adynamic bone disease and osteomalacia. 36 Osteocalcin is a bone matrix protein synthesized by mature osteoblasts and constitutes about 15% of non-collagenous bone matrix proteins. 37 Serum OC has been routinely used as an osteoblastic bone turnover marker. 38 An inverse correlation of OC and BMD is well documented in postmenopausal women and ovariectomized rats.39,40 Osteocalcin levels correlated positively with bone remodeling in CKD patients, where higher OC levels were reported compared to normal, reflecting the severity of the bone lesions. 41
To our knowledge, this is the first study evaluating the effect of Mg supplementation on bone turnover, assessed by serum total OC, in DN patients. However, previous studies on CKD patients on hemodialysis have shown that Mg supplementation increased bone mass and reduced the fracture risk. 42 In the current work, a significant decrease in serum OC level was observed in the Mg citrate group in both hypomagnesemia and normomagnesemia subjects compared to control, which possibly indicates a decreased bone turnover and a positive outcome in these patients. This could be supported by an in vitro study where Mg reduced OC expression and delayed osteoblast biomineralization. 43 A previous study in healthy normomagnesemia subjects reported that Mg significantly reduced serum OC levels and bone turnover. 44 On the contrary, another study reported that oral Mg supplementation had no effect on serum OC level in healthy females. However, that study had shorter duration (28 days) and used inorganic form of magnesium [Mg (OH)2]. 45 The beneficial effects of Mg on serum OC levels and bone turnover may be attributed to Mg affecting bone directly (increasing bone stiffness and osteoblasts and decreasing osteoclasts) and indirectly (interfering with parathormone hormone and vitamin D and suppressing inflammation/OS). 46
DN is associated with decreased overall QoL compared with the general population. 47 In the current work, The D-39 instrument was chosen because it is a valid, reliable, highly sensitive and simple diabetes-specific QoL assessment tool. 48 The findings of this study showed significant improvement of all five domains and the overall score of QoL in Mg citrate group in both hypomagnesemia and normomagnesemia study subjects compared to control. Despite the importance of Mg in human physiology, data on the effect of Mg supplementation on QoL are scarce. A previous trial on stressed but otherwise healthy adults showed that Mg improved QoL using Short Form-36 Health Survey. 49
In the current study, the only reported side effects were gut-related, frequent diarrhea, that were mild to moderate and required no intervention with no signs of overt hypermagnesemia (none exceeded levels post 4.87 mg/dl). Similarly, withdrawals due to adverse events were poorly reported in most trials and the most common reported side effects were gastrointestinal. 50
The current study has some limitations. It was single-centered and conducted on a small sample size, with a short follow-up period. Long-term future studies on larger population are recommended. Further studies are needed to evaluate Mg supplementation in type 1 diabetes.
Conclusion
Oral Mg citrate supplementation was safe, tolerable and improved microalbuminuria. It also had favorable effects on lipid profile, bone and QoL among type 2 DN patients.
Supplemental Material
sj-docx-1-taj-10.1177_20406223231214641 – Supplemental material for Impact of magnesium supplementation on clinical outcome and disease progression of patients with diabetic nephropathy: a prospective randomized trial
Supplemental material, sj-docx-1-taj-10.1177_20406223231214641 for Impact of magnesium supplementation on clinical outcome and disease progression of patients with diabetic nephropathy: a prospective randomized trial by Nihal Halawa, Tamer Wahid Elsaid, Lamia Mohamed El Wakeel and May Ahmed Shawki in Therapeutic Advances in Chronic Disease
Footnotes
References
Supplementary Material
Please find the following supplemental material available below.
For Open Access articles published under a Creative Commons License, all supplemental material carries the same license as the article it is associated with.
For non-Open Access articles published, all supplemental material carries a non-exclusive license, and permission requests for re-use of supplemental material or any part of supplemental material shall be sent directly to the copyright owner as specified in the copyright notice associated with the article.