
Abstract
Background:
The ciliary muscle plays a role in changing the shape of the crystalline lens to maintain the clear retinal image during near work. Studying the dynamic changes of the ciliary muscle during accommodation is necessary for understanding the mechanism of presbyopia. Optical coherence tomography (OCT) has been frequently used to image the ciliary muscle and its changes during accommodation in vivo. However, the segmentation process is cumbersome and time-consuming due to the large image data sets and the impact of low imaging quality.
Objectives:
This study aimed to establish a fully automatic method for segmenting and quantifying the ciliary muscle on the basis of optical coherence tomography (OCT) images.
Design:
A perspective cross-sectional study.
Methods:
In this study, 3500 signed images were used to develop a deep learning system. A novel deep learning algorithm was created from the widely used U-net and a full-resolution residual network to realize automatic segmentation and quantification of the ciliary muscle. Finally, the algorithm-predicted results and manual annotation were compared.
Results:
For segmentation performed by the system, the total mean pixel value difference (PVD) was 1.12, and the Dice coefficient, intersection over union (IoU), and sensitivity values were 93.8%, 88.7%, and 93.9%, respectively. The performance of the system was comparable with that of experienced specialists. The system could also successfully segment ciliary muscle images and quantify ciliary muscle thickness changes during accommodation.
Conclusion:
We developed an automatic segmentation framework for the ciliary muscle that can be used to analyze the morphological parameters of the ciliary muscle and its dynamic changes during accommodation.
Introduction
Contraction of ciliary muscle is the first movement of the eye in accommodation. With aging, others and our previous study demonstrated that presbyopia is attributed mainly to changes in the lens and capsule. In addition, previous studies suggested that age-related changes in the ciliary muscle may also be involved in the development of presbyopia.1–5 Therefore, quantification of the ciliary muscle contraction is important to investigate the mechanism of presbyopia and the potential of accommodative ability.
Previously, the movement of ciliary muscle during accommodation was evaluated by dynamic imaging using optical coherence tomography (OCT).6–10 In our previous study, changes in ciliary muscle morphology were calculated using an exponential function, and age-related change of ciliary muscle contraction was found in a pre-presbyopic population. 4 Dynamic analysis of the ciliary muscle in recent studies mostly relies on manual segmentation, and large-volume image data sets are very time-consuming.11–14 Development of a fully automatic segmentation method is valuable for studying changes in ciliary muscle contractions.
Deep learning–based semantic segmentation has rapidly developed in the field of ophthalmic medical imaging. These techniques have been widely used for segmentation of the cornea, optic nerve head, retinal layers, and choroid from OCT images.15–18 U-Net has been widely applied for biomedical image segmentation and can generally be divided into four operations that complete the image encoding and decoding processes during segmentation: convolution, downsampling, upsampling, and concatenation. 19 In addition, owing to its U-shaped structure and skip connection, this approach combines low-resolution information (providing global information) and high-resolution information (providing precise segmentation), making it suitable for ciliary muscle image segmentation.
Here, we present a U-Net-based ciliary muscle segmentation framework named CMS-NET (Ciliary Muscle Segmentation U-Net) to automatically segment the upper surface of the sclera and the upper and lower boundaries of the ciliary muscle. The purpose of this study was to accurately and fully automatically segment and quantify the ciliary muscle to achieve a better understanding of its structure and function.
Materials and methods
Study participants
This was a cross-sectional study. The participants were recruited from among students at Wenzhou Medical University from July 5, 2021 to April 16, 2022, and included eight males (mean age 25.3 years) and 23 females (mean age 30.4 years) with mean spherical equivalent refractive errors of –1.83 ± 1.93 D and –1.87 ± 1.94 D, respectively. Astigmatic refractive error was ⩽1D. The best-corrected distance Snellen visual acuity was at least 6/6 (20/20) in each eye. Before the measurements, participants were informed about the aims, procedure, and possible risks of the accommodation experiment in this study, and thereafter signed their written informed consent. Individuals with ocular pathologies or binocular disorders as well as those taking medication that could possibly influence the accommodative response were excluded from the trial. This study was approved by the ethics committee board of the Wenzhou Medical University and conducted according to the tenets of the Declaration of Helsinki.
OCT image acquisition
We obtained images of the ciliary muscle in real-time at the temporal horizontal meridian of the left eye by using a custom-built SS-OCT system (SS-OCT). This system uses a vertical-cavity surface-emitting laser (VCSEL) light source (SL132120; Thorlabs Inc., Newton, NJ) operating at a central wavelength of 1300 nm, bandwidth of 100 nm, and scan rate of 200 kHz. Thirty frames were recorded in 6 s, with 80 repeated scans in each frame, and 512 A-lines in a single scan. The axial resolution was 7.3 μm, and the scan width and depth were 13.02 and 7.99 mm in air, respectively.
As described in the previous study, an accommodative stimulus system was combined with the OCT system to provide monocular step stimuli to the tested eye. 4 During accommodation process, the far viewing channel was illuminated at first, and the illumination alternated to near viewing channel 1 s after the onset of image acquisition. The whole process lasted for 6 s. During disaccommodation, the illumination was on in near viewing channel at first and then alternated to far viewing channel. Each measurement was repeated twice.
Overview
As illustrated in Figure 1, our pipeline is divided into four stages: data set building, images labeling (tissue boundaries segmentation), training, and testing.

Overview of the pipeline to automatically segment ciliary muscle images.
Image preprocessing
Visible boundary checking
The sample size was calculated by considering α = 0.5 and power = 95%; 760 images were required to achieve this power, and 3720 images were included in this study. After a ciliary muscle OCT image is acquired, it may not have the expected quality to perform the segmentation. Therefore, all images (3720 images) were checked manually to select only the images where the CM boundary was visible as shown in Figure 1. There were 3500 eligible images.
Image labeling
All images were segmented manually using a custom-developed MATLAB program to generate the data sets needed for training and testing CMS-NET. Manual segmentation was performed by a single examiner (Wen Chen) familiar with anterior segment anatomy as the ground-truth segmentation. Another custom-developed MATLAB program was used for semi-automatic CM segmentation and thickness measurements, as described previously.4,5 Three tissue boundaries were segmented: (a) the air-conjunctiva interface; (b) the outer surface of the ciliary muscle (i.e. the interface between the sclera and ciliary muscle), where the origin point is the scleral spur; and (c) the inner surface of the ciliary muscle (i.e. the interface between the ciliary muscle and pigmented epithelium/ciliary muscle-ciliary body).
Image optical distortion correction
After segmentation of all three tissue boundaries (air-conjunctiva, sclera-ciliary muscle, and ciliary muscle-ciliary body) and correcting for image optical distortion, the maximum thickness of the ciliary muscle (CMTMAX) and lines were drawn through points at 1 mm (CMT1), 2 mm (CMT2), and 3 mm (CMT3) posterior to the scleral spur (along the length of the outer boundary of the muscle) that were perpendicular to the local curvature of the sclera and extended to the inner surface of the ciliary muscle thickness were calculated (Figure 2).

Example of ciliary muscle segmentation and measurement.
Each pixel was categorized into background, upper surface of sclera, and ciliary muscle regions based on the boundary curves. The contrast and brightness of all images were adjusted using the MATLAB inline function (i.e. imadjust) before labeling. After the labeling process, the initial 1024 × 512-pixel images were rescaled to 512 × 512 pixels before being fed to the network. During imaging training, the left boundary of the segmented region was defined as the 30th A-line on the left side of the scleral spur process, which means that the entire scleral region above the ciliary muscle required for segmentation and image correction was included.
Data set building
The ciliary muscle OCT image data set was divided randomly into three sets: 70% (2450 images) as a training set, 10% (350 images) as a validation set, and 20% (700 images) as a test set. For the 31 subjects, 25 were used for training and validation and six for testing. The number of images varies by subjects, with a minimum of 100 and a maximum of 120 images recorded per subject.
Network architecture
CMS-NET consists of multiple layers of extended multi-plane convolution filters, residual connections, and dropout layers. The network architectures are listed in Table 1. Figure 3 illustrates the overall architecture of CMS-NET.
Model characteristics of our proposal.
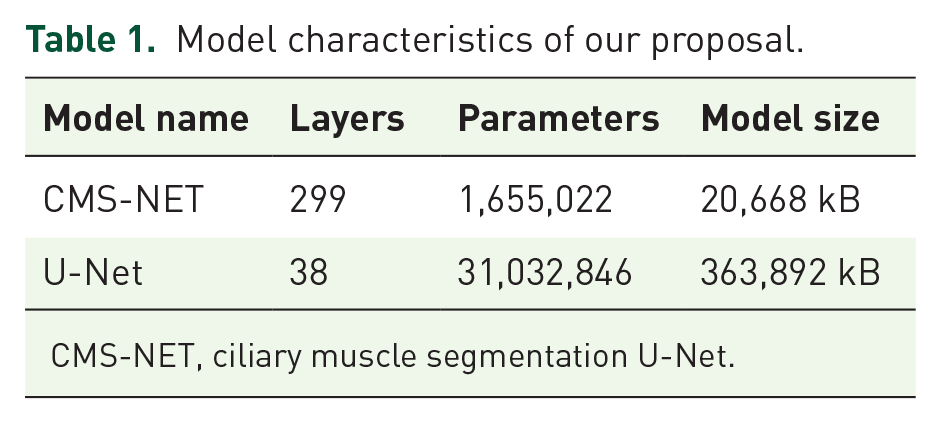
CMS-NET, ciliary muscle segmentation U-Net.

The overall architecture of CMS-NET. (a) Model pipeline follows U-shaped network and generally can be divided into encoding and decoding stages. (b) Separable dense module combines separable convolution and dense block shown in (c) and connects depth-wise separable convolution through dense connection mode.
CMS-NET uses U-Net as the backbone, as displayed in Figure 3(a). 19 The main architecture of U-Net contains a contracting path (left part) with encoding operators and an expansive path (right part) with decoding operators. Each dense module is followed by an activation unit and a 2 × 2 max pooling operation with stride 2 for encoding. Ciliary muscle images contain only pixels, full context is available in the input image, and the feature channels in the decoding part enable this context information to be propagated to higher resolution layers.
Ciliary muscle images have poor contrast: the boundary pixel values of the target and background regions do not change significantly, and ciliary muscle images are also affected by noise and artifacts in the actual semantic segmentation. Therefore, based on a widely used U-Net, 19 the left side follows a fundamental convolutional network. The typical convolutional layers are substituted with depth-wise separable convolution (DSC) for feature extraction and point convolution for feature combination, which reduced the amount number of multiplication and addition operations in the convolution process, as shown in Figure 3(b). 20
We also took advantage of the inherent benefits of the residual learning framework, adding the dense connection mode to transfer feature information more effectively and avoid gradient diffusion and explosion issues, as shown in Figure 3(c), thus providing a good segmentation effect with fewer trainable parameters.20–22 The U-shaped jump connection captures local and contextual information simultaneously, offering more benefits for identifying regional distribution. Based on these two techniques, the network can have more deep neural layers, which is beneficial for segmenting the boundaries in OCT images. Instead of ordinary convolution, the dropout layers were added to the encoding process to prevent overfitting. To further improve accuracy, we replaced the ReLU activation function in the residual block with a Swish activation function, which is formulated as

where
A custom weighted loss function that combines distribution-based focal loss and region-based Dice loss is designed to make the model more discriminating between the ciliary muscle and background regions

where α is a hyper-parameter to balance two losses. TP, FP, and FN are the true positives, false positives, and false negatives between the prediction and ground truth, respectively. ‘gt’ and ‘pr’ are the corresponding pixel values of the ground truth and prediction, respectively. Finally, CMS-NET was trained by ADAM with back propagation in an end-to-end paradigm.
Model training
We used ADAM as the optimizer with an initial learning rate of 0.0001. 23 In all the previous studies and our proposal, we used step decay to decrease the learning rate during the training process; that is, when the loss value did not decrease after five iterations, the learning rate was attenuated to 0.8 times the original value. The EarlyStopping function was also used to enable early termination of training. We set the parameter patience in the EarlyStopping function to 100, indicating that training would be stopped if the loss value did not decrease in 100 iterations. We set α in the loss function as 0.2.
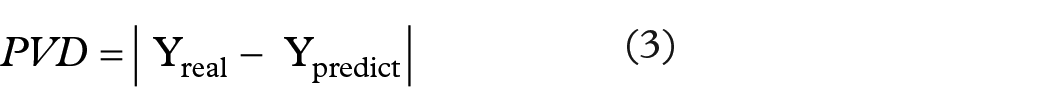
Evaluation method
Four metrics were used to evaluate the segmentation performance of each model: the pixel value difference (PVD), Dice coefficient, intersection over union (IoU), and sensitivity. For PVD, the classification results yielded three boundaries, as mentioned previously. In an image, we established a rectangular coordinate system whose zero point was the lower-left corner of the image, and the X- and Y- axes were the long and wide sides, respectively. In this setting, Yreal and Ypredict correspond to the true and predicted values of x, respectively. The pixel distance is equal to the difference between Yreal and Ypredict, as shown in equation (3). Therefore, PVD-0 is the pixel distance between 0 and 2 pixels (excluding 2 pixels), PVD-1 is the pixel distance between two and five pixels (including 2 pixels, excluding 5 pixels), and PVD-2 is the pixel distance between 5 and 8 pixels (including 5 pixels, excluding 8 pixels). PVD-3 indicates that the pixel distance is greater than or equal to eight pixels. The Dice coefficient was used to measure the spatial overlap between the manual and automatic segmentation. Its value was between 0 and 1, where 0 represents no overlap and 1 represents a complete overlap. IoU is a statistical verification tool, also known as the Jaccard index. Sensitivity is also a useful indicator of prediction success, particularly when the data are unbalanced. The formulation of the PVD, Dice coefficient, IoU, and sensitivity are as follows


We asked two anterior anatomy specialists (Jue Lin and Xinyuan Cao) with 3 and 4 years of experience, respectively, to independently segment the ciliary muscle in the testing data and then compared their performance with those of the deep learning models.
Implementation
The proposed method was implemented in Python 3 using the publicKeras front-end package with the TensorFlow 24 package as the backend. The training method was implemented with two NVIDA TITAN RTX graphic cards, and the specific configuration of the computer was Intel(R) Core (TM) i9-10940X CPU @3.30 GHz 3.31 GHz with 128GB RAM.
Results
Performance of the deep learning models
We measured the location of the sclera and ciliary muscle boundaries using deep learning algorithms (Figure 4) and traditional U-Net and compared the results with the ground truth to assess the efficiency of CMS-NET (Figure 5). In order to have a comprehensive and fair comparison, we conducted five independent and random runs of all methods and reported their average performance. We quantitatively analyzed PVDs ranging from 0 to 3 and compared the results with the ground truth. Table 2 shows that the proposed method achieved a PVD-0 of 75.4%, whereas specialists 1 and 2 obtained a PVD-0 of 78.4% and 73.3%, respectively. The PVD was subdivided into three interfaces, and Table 3 shows the results of PVD in the manual and different automatic segmentation methods on the scleral surface, outer and inner surface of the ciliary muscle, and the total mean difference. Region segmentation results of ciliary muscle images are shown in Figure 6.

(a) Original ciliary muscle image and (b) the segmentation result, in which the upper line is the upper scleral boundary, the middle line is the upper boundary of ciliary muscle, and the lower line is the lower boundary of ciliary muscle.

Segmentation result of the ciliary muscle image. (a) Original image. (b) Manual label. (c) The segmentation result obtained by CMS-NET.
Results of PVD for CMS-NET versus specialists in the test sets.
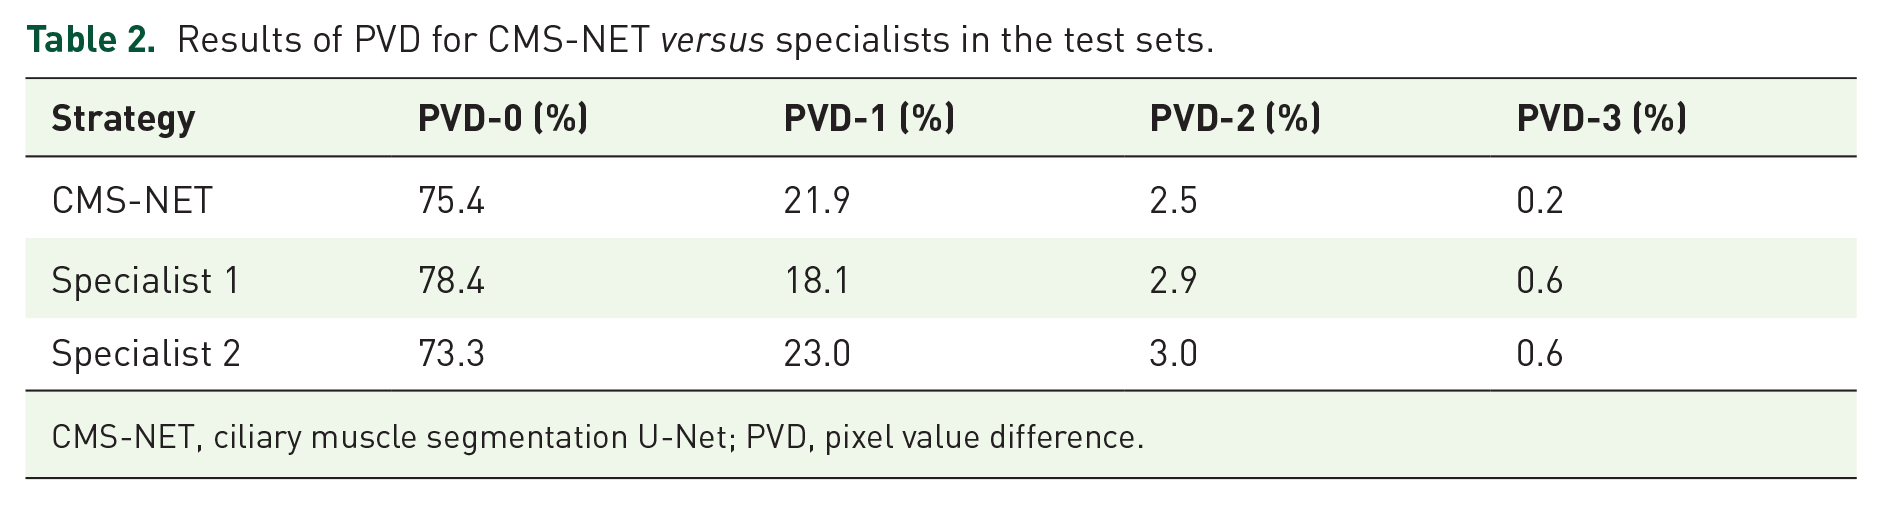
CMS-NET, ciliary muscle segmentation U-Net; PVD, pixel value difference.
Pixel value differences between three surfaces and total mean difference between CMS-NET and two examiners with the ground-truth segmentation in the test sets.

CM, ciliary muscle; CMS-NET, ciliary muscle segmentation U-Net.

Validation scores for the ciliary muscle segmentation.
Ablation study
Comparing with the basic U-Net, CMS-NET mainly has the following improvements: (a) using DSC for feature extraction, and (b) adding the dense connection (DC) mode to transfer feature information. To analyze the effects of two module designs, we conducted experiments on four different architectures: U-Net, DSC U-Net, DC U-Net, and CMS-NET. Then, we evaluated all the models on test data (Table 4). The performance of the network was significantly improved by the DSC and DC modes.
Evaluation of each ablation model compared with CMS-NET.

CMS-NET, ciliary muscle segmentation U-Net; DC, dense connection; DSC, depth-wise separable convolution; IoU, intersection over union.
Use of CMS-NET for segmentation of the ciliary muscle during accommodation
Figure 7 shows that the CMS-NET can be used to detect and quantify the dynamic deformation of the ciliary muscle during accommodation. After the accommodative stimulus was administered, the ciliary muscle showed a consistent increase in the CMT until reaching a stable status.

Dynamic deformation in the maximum thickness of the ciliary muscle (CMTMAX) for two subjects (a and b) during accommodation are plotted as a function of time.
The accuracy of CMS-NET was evaluated by comparing the differences in six ciliary muscle parameters measured using the proposed method and manual segmentation. The difference between the automatic and manual values is shown using Bland–Altman analysis (Figure 8). The results show that the value 0 was included in the limits of agreement.

Differences between automatic and manual segmentation in ciliary muscle images on various parameters (Bland–Altman plots). (a) The coordinate point of the scleral spur (SS). (b) The maximum thickness of the ciliary muscle (CMTMAX). (c)–(e) Thickness of the ciliary muscle 1 mm (CMT1), 2 mm (CMT2), and 3 mm (CMT3) posterior to the scleral spur.
Discussion
We present CMS-NET, a custom deep-learning approach that can segment and quantify the ciliary muscle structure in SS-OCT images. Automatic segmentation with large data sets can be performed with a high accuracy rate (Dice coefficient, 0.938; IoU, 0.887; sensitivity, 0.939).
The inner boundary of the ciliary muscle is very similar in density and texture to the background in which it is located, making it difficult to accurately depict its boundaries. Traditional image-segmentation algorithms, such as edge detection-based segmentation, threshold-based segmentation, region-based, and specific filter-based algorithms, cannot readily segment the sub-ciliary muscle boundary and the ciliary muscle tip area because of the weak contrast and blurred boundaries, whereas manual segmentation is time-consuming, laborious, and shows poor stability. 25 Cabeza et al. 26 proposed a U-Net with EfficientNetb2 as the backbone to segment the ciliary muscle in OCT images with a CM-IoU of 90.23%, which was slightly higher than ours (88.7%). However, only 1039 relatively clear images were selected from 16,640 images for development of the full convolutional network (FCN). Moreover, large variation of the number of images between subjects (5 to 51 images per recording, and 100 to 120 in ours) was documented in Cabeza’s study. These implied that the difficulty in clinical application of ciliary muscle segmentation, and this might be more challenging for Asian older patients who had more melanin in ciliary muscle than Caucasians. To further improve the generalization and robustness of the network, which might be more suitable for segmentation in older subjects with poor image quality, we dealt with ciliary muscle segmentation as follows. Since the ciliary muscle region is very small compared with other OCT images, it is a pixel-level semantic segmentation. A misclassification of each pixel results in an incomplete ciliary muscle region. Low-level image features retain image detail features, which is conducive to distinguish relatively fuzzy edges. To better preserve the details, we use residual connection not only between each layer of the U-Net but also in dense module.
In this study, we segmented the ciliary muscle by deep learning, and the method exhibited better performance than traditional manual segmentation methods, especially when a large data set was used for training. However, non-smooth boundaries are often obtained during actual segmentation, mainly because of multiple downsampling operations in the network construction. These downsampling operations reduce the number of features between the target and background, and once these features are lost, they cannot be easily recovered in later steps. This problem significantly limits the accurate segmentation of ciliary muscle. To solve this downsampling problem, we used dense concatenation (which connects each layer to every other layer in a feed-forward fashion) with additional element addition to achieve accurate segmentation. For each layer, the feature maps of all preceding layers were used as inputs, and its own feature maps were used as inputs into all subsequent layers. These approaches alleviated the vanishing-gradient problem, strengthened feature propagation, encouraged feature reuse, and substantially reduced the number of parameters, as mentioned in a previous article. 22 The advantage of deep learning methods over manual or semi-automatic segmentation in previous studies is that they can automatically learn a large number of image features and combine them optimally through convolution and activation operations.5,10,11,25,27 Deep learning can thus capture patterns of pixel changes that are undetectable by the human eye and thereby segment the ciliary muscle tip according to processes used by doctors.
In terms of semantic segmentation, each pixel in an image corresponds to image classification. Therefore, we measured the number of correct and incorrect classifications by determining the Dice coefficient, IoU, and sensitivity values. The higher these indexes are, the better the result returned by the model. However, when the segmentation precision reaches a certain level, these indices do not provide convincing estimates of the segmentation precision boundary. In such situations, the PVD can be used to judge the position deviation of the boundary pixels, making it suitable for the quantitative evaluation of the reliability of the network. Therefore, when the Dice coefficient shows a minimal difference, PVD is chosen as the evaluation index for the final model performance. Thus, we chose PVD as the final evaluation index, and the Dice coefficient, IoU, and sensitivity as auxiliary evaluation indexes. The outcomes of the method proposed in this study are closer to those obtained in manual segmentation by two specialists (Tables 2 and 3).
There are a few limitations in this study. First, the ciliary muscle cannot be imaged directly in the vertical direction owing to the occlusion of the iris. Instead, the ciliary body was below the sclera, and light attenuation of the sclera and ciliary body decreased the signal-to-noise ratio and contrast of the OCT image. 25 As a result, a relatively small number of images could not be segmented and trained. Second, the sample size was relatively small. Moreover, the subjects selected in this study were healthy young adults, and there were more females than males. In the future, elderly adults will be included to improve the feasibility of the algorithm, and the sex ratio will be balanced.
Conclusion
In this study, we present CMS-NET, a system for automatically detecting and segmenting the ciliary muscle in OCT images. Automated analysis of large numbers of images can provide a deeper understanding of the age-related degeneration of ciliary muscle contraction, facilitating accommodation therapy of patients with presbyopia.