
Abstract
“Ivy sign” is a special imaging manifestation of moyamoya disease (MMD), which shows continuous linear or punctate high intensity along the cortical sulci and subarachnoid space on magnetic resonance images. Ivy sign was reported to reflect the development of compensatory collaterals, and to be closely related to hemodynamic changes and clinical symptoms, and to indicate the postoperative prognosis, in MMD patients. It is a unique and critical marker for MMD. However, due to the lack of consistent criteria, such as definition, grading, and identification standards, ivy sign has not received much attention. We undertook a comprehensive literature search and summarized the current situation regarding ivy sign in MMD in terms of baseline characteristics, detection methods, definition, regional division and distribution patterns, grading criterions, incidence, related factors, the mechanism of ivy sign, and the effects of treatments. We also provided related concerns raised and future prospects relevant to studies about ivy sign in MMD.
Introduction
Moyamoya disease (MMD) is a chronic cerebrovascular occlusive disease that is characterized by progressive stenosis or occlusion at the end of bilateral internal carotid artery (ICA) and/or the beginning of anterior cerebral artery (ACA) and middle cerebral artery (MCA), accompanied by compensatory dilation of the perforating artery, and formation of dense vascular networks (“moyamoya vessels”). 1 “Ivy sign” is defined as the continuous linear or punctate high intensity along the cortical sulci and subarachnoid space on magnetic resonance images (MRI) in MMD patients. In 1995, Ohta et al. first reported this finding in three pediatric MMD cases on postcontrast T1-MRI 2 ; they named it “ivy sign” as it resembled ivy creeping on stones. Similar imaging features (as hyperintensities in the subarachnoid space of cortical convexity sulci) were then found on fluid-attenuated inversion recovery (FLAIR) MRI.3,4 “Ivy sign” is a special imaging manifestation of MMD reported to reflect the development of compensatory collaterals, to be closely related to hemodynamic changes and clinical symptoms, and to indicate postoperative prognosis in MMD patients.
Despite all this, generally, there are few studies on this topic. The sample sizes are also relatively small, only few studies have >100 patients. Furthermore, because of the inconsistency in definition, detection methods, grading criterions, etc., among different studies,3,5–8 there is still much confusion when we take a look at this field. This review provides an overview of current situation, concerns raised, and future prospects associated with ivy sign in MMD.
Methods
A literature search in PubMed, Embase and Ovid was performed via terms with all possible combinations of “Moyamoya”, “Ivy” and “Leptomeningeal” up to 1 April 2020. References in identified articles were also manually screened.
Inclusion criteria: (1) Patients with MMD diagnosis confirmed by radiological and clinical criteria; (2) confirmed diagnosis of “ivy sign” by radiological criteria. Exclusion criteria: (1) study presented in languages other than English; (2) incomplete data; (3) study population already included in another study; (4) review articles or technical notes.
Two reviewers independently examined and selected qualified studies, and extracted data such as baseline characteristics (affected hemispheres, age, onset), related factors (angiography, hemodynamics, clinical symptoms), effects of treatments, detection methods, criterions of ivy sign definition, grading, and regional division, as well as the incidence and distribution patterns from the included studies. A third investigator double-checked the extracted data, resolved discrepancies, and corrected errors.
Finally, 27 studies including eight case reports and 19 clinical trials about ivy sign in MMD were included (Figure 1). Relevant information is summarized in Tables 1–3. The description of the current situation regarding ivy sign in MMD and the presentation of related concerns were based on these summaries.
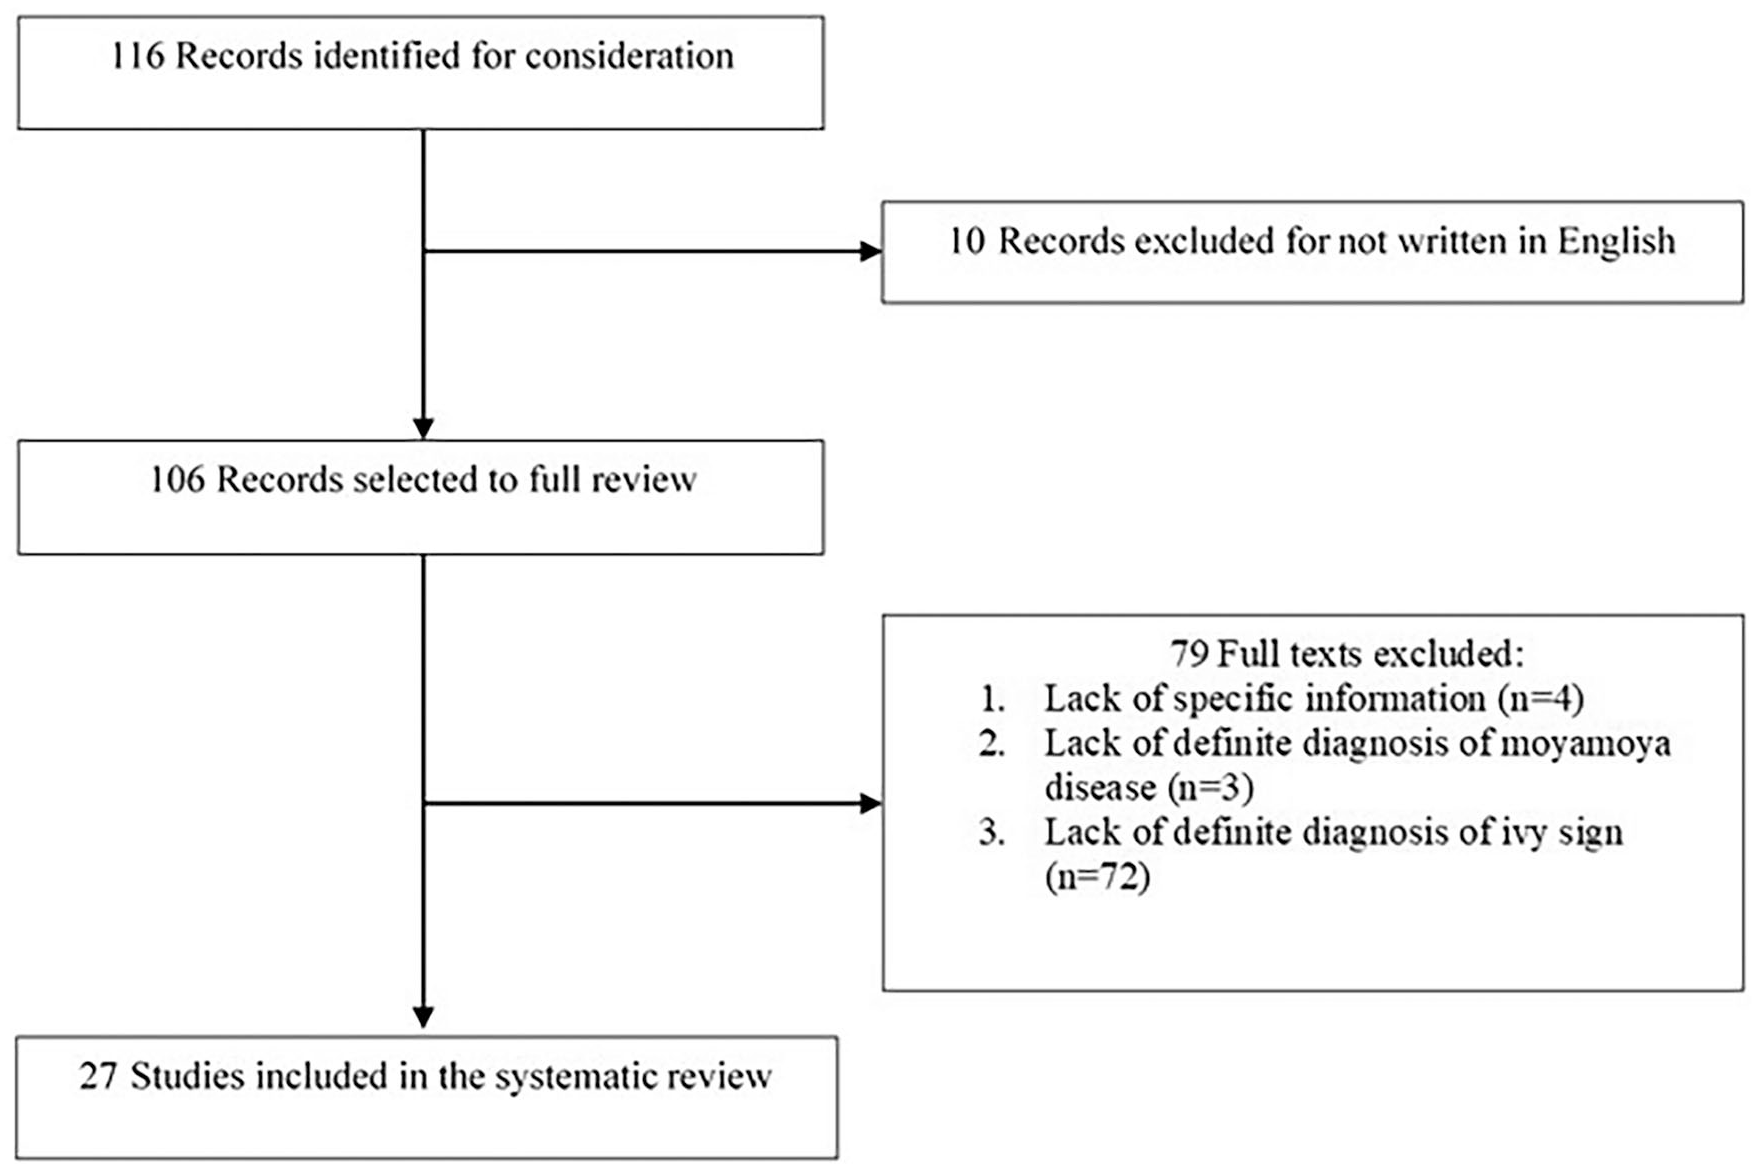
Flow chart for search strategy and study selection.
Case reports regarding ivy sign in MMD.

ACA, anterior cerebral artery; CBF, cerebral blood flow; EGS, encephalogaleosynangiosis; EMS, encephalomyosynangiosis; FLAIR MRI, fluid-attenuated inversion recovery magnetic resonance imaging; MCA, middle cerebral artery; MMD, moyamoya disease; MMS, moyamoya syndrome; Postcontrast T1-WI with Gd-DTPA, postcontrast T1-weighted image with gadolinium-diethylene triamine penta-acetic acid; STA, superficial temporal artery; T1-W MRI, T1-weighted magnetic resonance imaging.
Baseline characteristics, related factors and effects of treatments regarding ivy sign in MMD.

ACA, anterior cerebral artery; ant-MCA, anterior half of the MCA region; CBF, cerebral blood flow; CBV, cerebral blood volume; CVR, cerebral vascular reserve; EDAS, encephalo-duro-arterio-synangiosis; FLAIR MRI, fluid-attenuated inversion recovery magnetic resonance images; MCA, middle cerebral artery; MMD, moyamoya disease; OEF, oxygen extraction fraction; PCA, posterior cerebral artery; post-MCA, posterior half of the MCA region; STA, superficial temporal artery; TNS, transient neurologic symptoms; T1-WI, T1-weighted imaging.
Detection, incidence and distribution patterns of ivy sign in MMD.
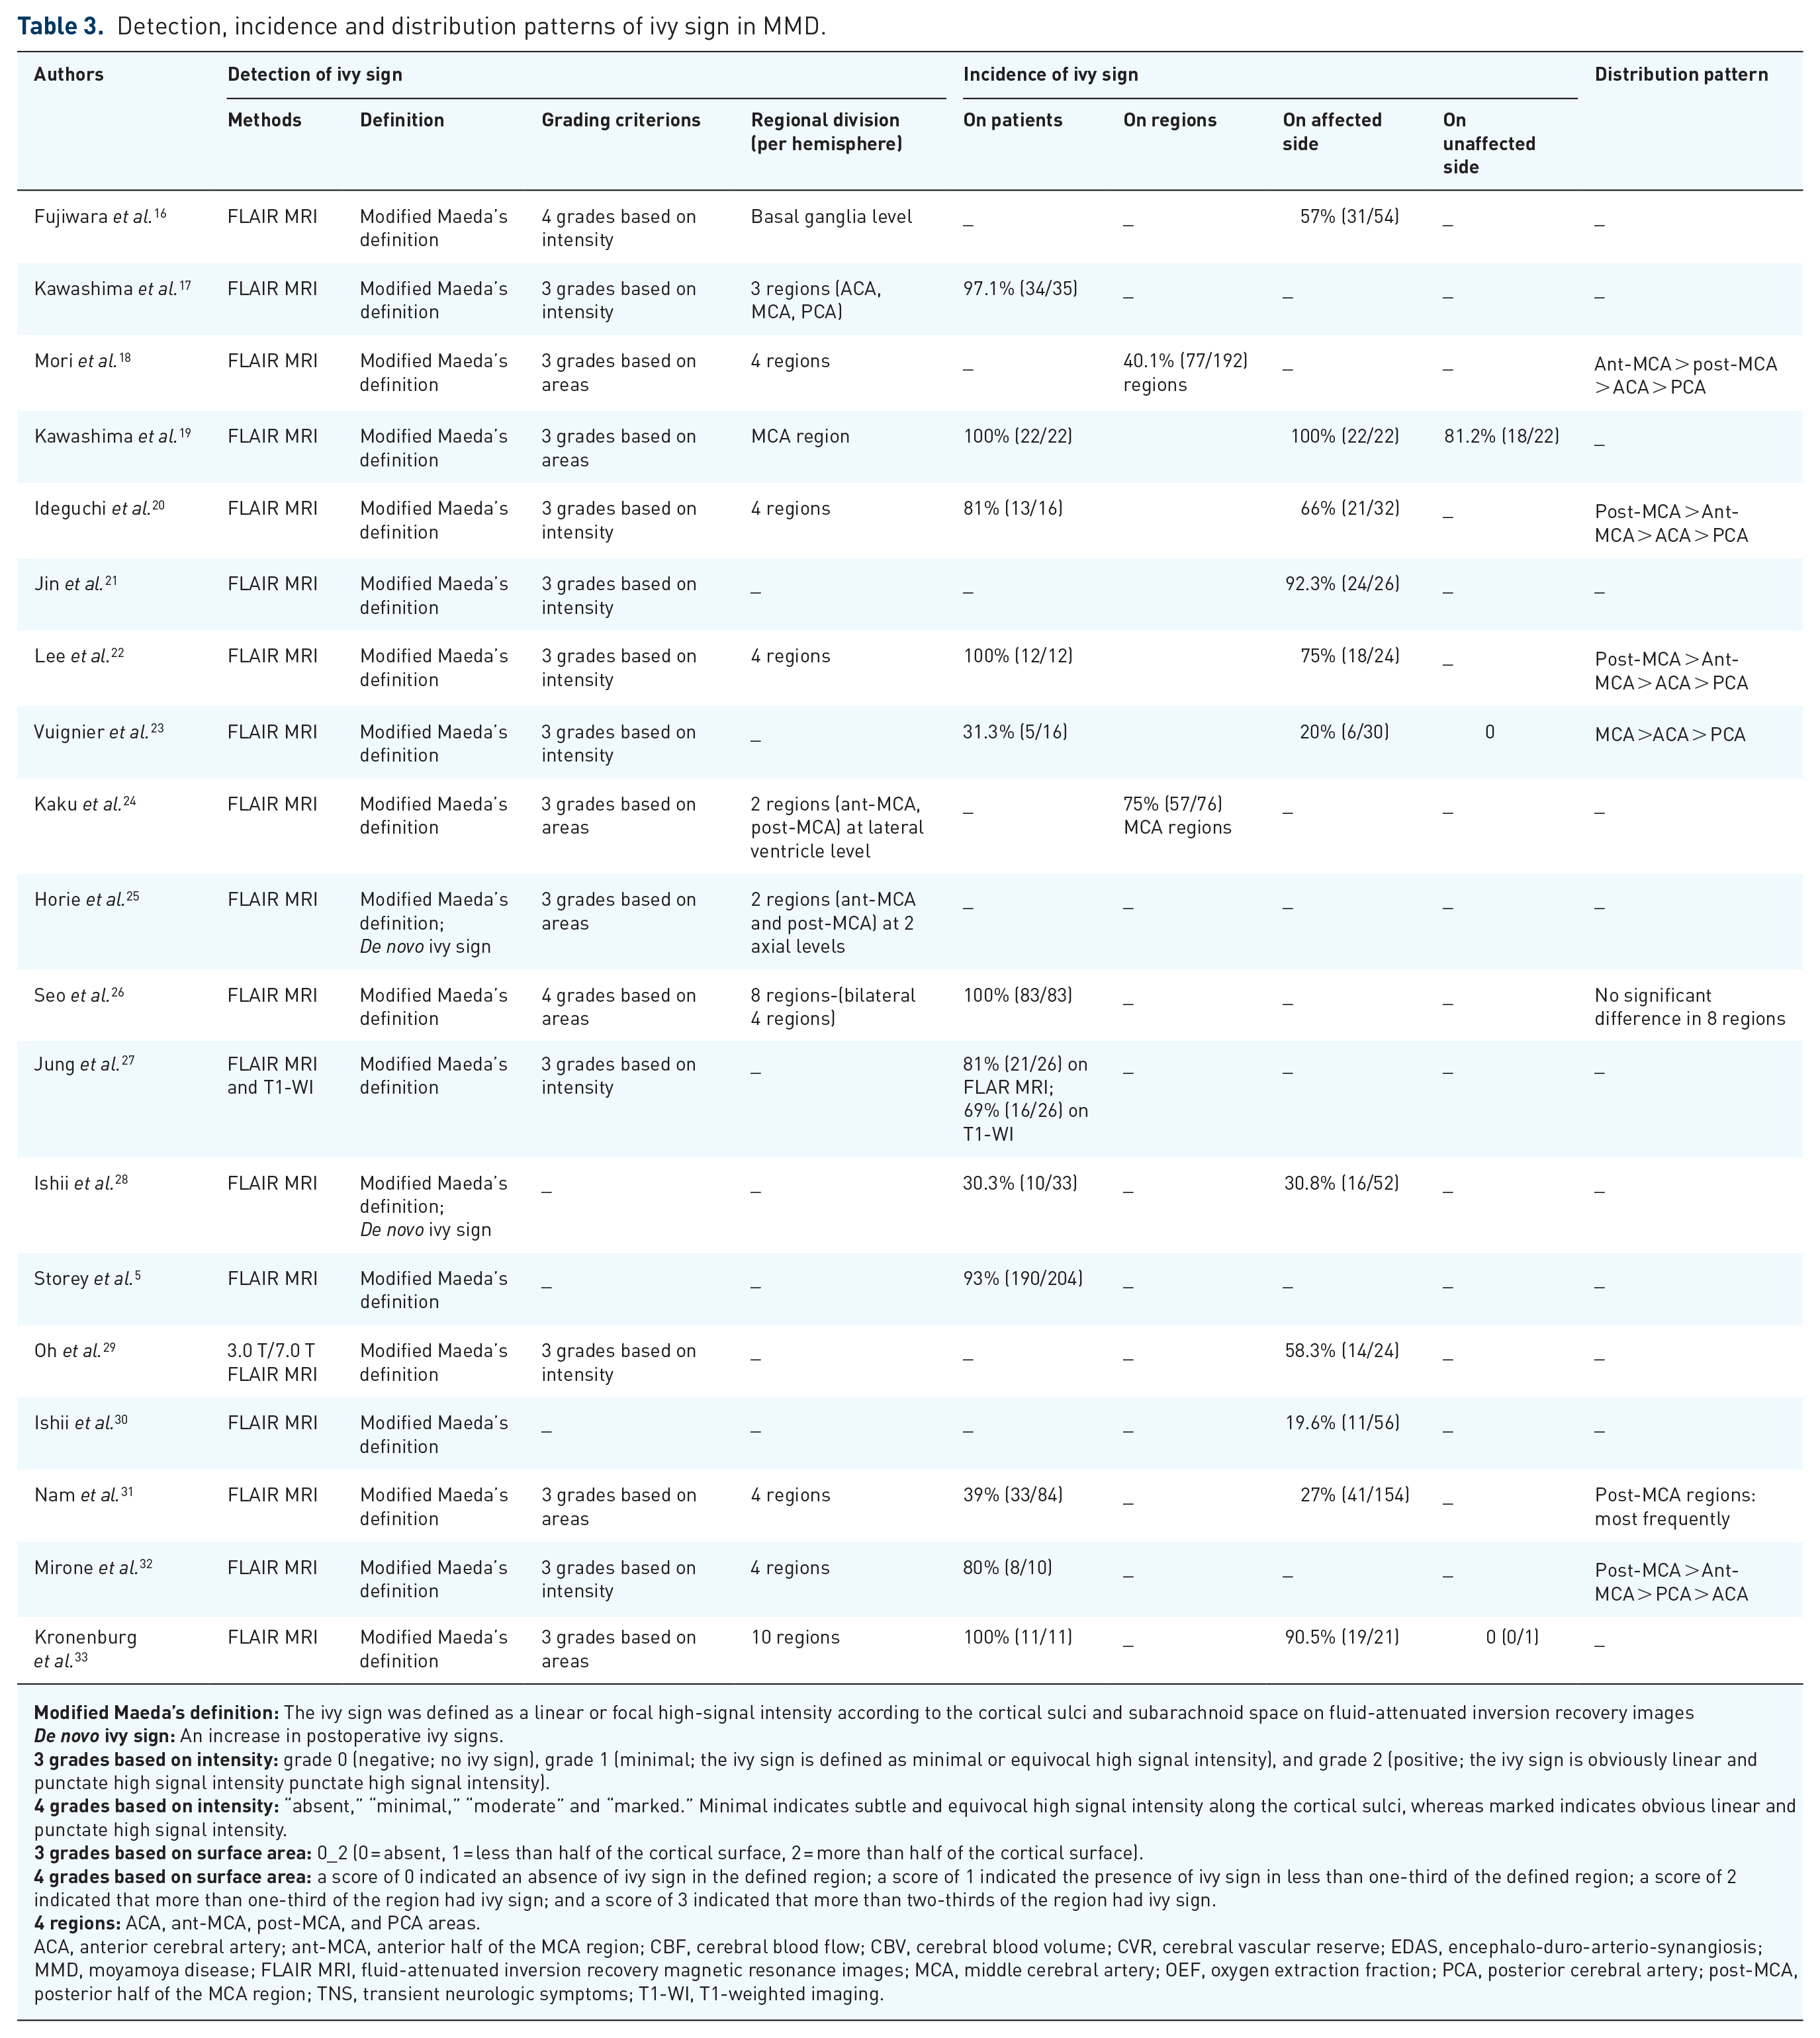
ACA, anterior cerebral artery; ant-MCA, anterior half of the MCA region; CBF, cerebral blood flow; CBV, cerebral blood volume; CVR, cerebral vascular reserve; EDAS, encephalo-duro-arterio-synangiosis; MMD, moyamoya disease; FLAIR MRI, fluid-attenuated inversion recovery magnetic resonance images; MCA, middle cerebral artery; OEF, oxygen extraction fraction; PCA, posterior cerebral artery; post-MCA, posterior half of the MCA region; TNS, transient neurologic symptoms; T1-WI, T1-weighted imaging.
Current situation and related concerns
Baseline characteristics in included studies
There are 10 individual case reports that described ivy sign (Table 1).2,9–15 Among them, seven cases are bilateral MMD and two are unilateral MMD (one left and one right). Notably, there are three moyamoya syndrome (MMS) patients combined with sickle cell disease, 11 β-thalassemia intermedia, 12 and neurofibromatosis type 1, 14 respectively. Overall, the proportion of pediatric (<16 years) MMD/MMS patients is 8/10. Symptoms vary from non-specific symptoms (headache and seizure), transient neurologic symptoms (TNS) (transient motor weakness, limb weakness, aphasia), to severe performance (bilateral pare-sis). Notably, three case reports of MMS were included; however, it is not yet known whether MMD and MMS have the same mechanism of collateral formation.
In 19 clinical studies,5,16–33 the sample size ranges from 10 to 204 patients. Among them, 11 studies involve MMD patients of all ages (range from 2 to 69 years), 4 include only adult MMD, and 3 focused on pediatric MMD. Clinical onset present with ischemic, hemorrhagic, or asymptomatic, but ischemic onset accounts for a major proportion in all samples (Table 2).
Detection methods
Contrast-enhanced T1-WI and FLAIR images are eligible to detect ivy sign. Yoon et al. compared these two methods, and found that contrast-enhanced T1-WI had a higher frequency of visualization in depicting the leptomeningeal ivy sign in MMD. 34 However, Jung et al. observed the opposite result. 27 Regardless of these, almost all involved studies in this review preferred to adopt FLAIR images (Table 3).
FLAIR images may have the following advantages: (1) overall diffuse enhancements (including leptomeningeal, perforating arteries, etc.) on contrast-enhanced T1-WI may interfere with the clear identification of ivy sign. 9 However, FLAIR imaging employs long repetition and echo times to create heavy T2-WI with cerebrospinal fluid (CSF) nulling, thereby providing excellent contrast between the CSF and the brain surface. 35 Because of the so-called “flow-void” phenomenon, normal arteries are not visible against the dark CSF background on FLAIR sequences. 36 Thus, hyperintense vessels on FLAIR images can be considered as an indicator of slow flow and inadequate collateral circulation. (2) Without the need to administer contrast agent, the FLAIR imaging procedure takes less than 10 min, causes fewer side effects, costs less, do not lead to patients feeling hunger, and is less invasive.16,22
Besides, there was no significant difference between 7.0 T and 3.0 T FLAIR imaging, although 7.0 T imaging showed better visualization of ivy sign for some lobes. 29
Comparable presentation ( “sulcal hyperintensity”, “leptomeningeal hyperintensity”, “hyperintensity within the subarachnoid space”, “hyperintense vessel sign”, “leptomeningeal contrast enhancement” or “leptomeningeal enhancement”) can also be observed in other situations such as acute cerebral infarction,37,38 subarachnoid hemorrhage, 39 meningitis, or meningeal carcinomatosis,40,41 but they differ at least in three points: (1) MMD is a chronically progressing disorder and the meningeal enhancement may be chronically observed, whereas the enhancement in acute cerebral infarction or subarachnoid hemorrhage is observed only in a specific stage. (2) The enhancement in MMD is not localized in a specific area but is diffusely seen in every sulcus. (3) Characteristic findings of MMD such as occlusion of the ICA, or flow voids in the basal ganglia, are clues that differentiate MMD from other conditions.2,16
Definition
Ivy sign is defined as the diffuse leptomeningeal enhancement along the cortical sulci on postcontrast T1-WI,2,34 or the continuous linear or punctate high signal intensity along the cortical sulci and subarachnoid space on FLAIR images (Figure 2).9,16

Since it was Maeda et al. who first depicted this finding on FLAIR imaging, subsequently adopted by later studies with/without slight modification, we named it “Modified Maeda’s definition”. It should be noted that there was another term called “de novo ivy sign”,25,28 with the indication for an increase of ivy signs after revascularization surgery, that differs from the preoperative ivy sign.
Another concern should be noted: do the bright vessels observed on FLAIR correspond to arteries or small superficial cortical veins? Although arteries usually follow the invaginated deep cortical surfaces, veins tend to move away from the cortical surface to reach for sinus. Accordingly, only distal hyperintensities that remain deep in the cortical sulcus on at least two adjacent slices should be quoted as “hyperintense vessels sign positive”, and those localized away from the cortical surface should be excluded. 35
Regional division and distribution patterns
To describe the distribution of ivy sign conveniently, researchers divided the cortical and subcortical sections of each cerebral hemisphere into four regions according to the distribution of major cerebral vessels: namely, the regions of ACA, MCA and PCA. 17 The MCA region was further divided by the central sulcus into the anterior half of the MCA region (anterior-MCA) and the posterior half of the MCA region (posterior-MCA) (Figure 3).18,24
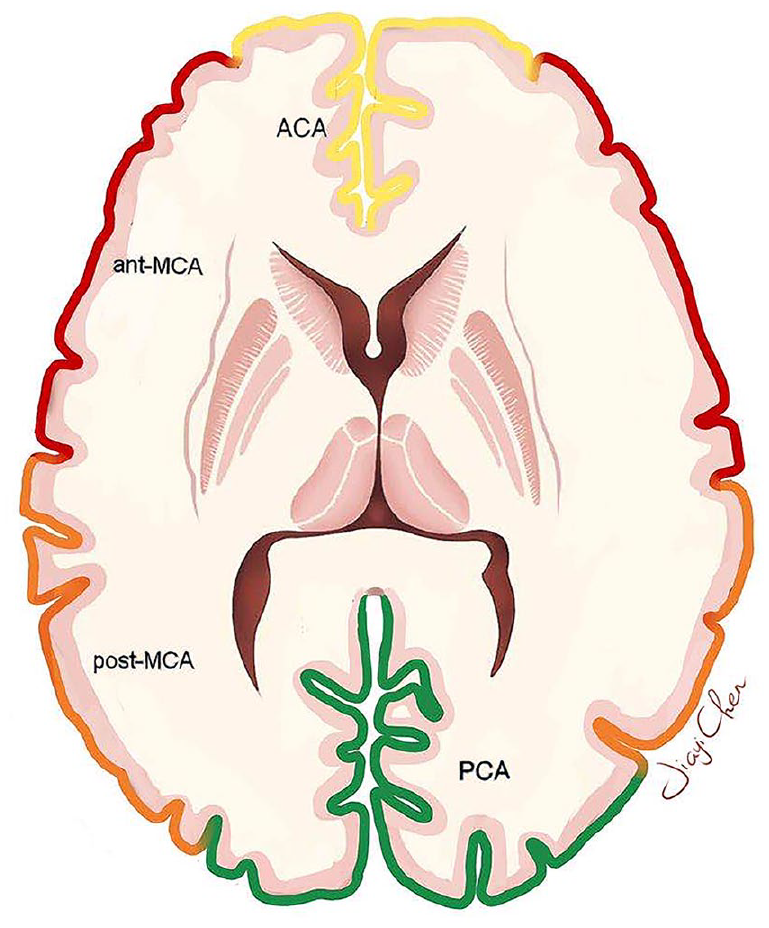
Classification of four regions in each hemisphere at the level of the body of lateral ventricle.
Among the eight studies that have reported the ivy sign distribution patterns, four found that the ivy sign was observed most frequently in the post-MCA region than the ant-MCA and the other two regions. But the opposite result, with a more frequent occurrence in the ant-MCA than the post-MCA region, was reported by Mori et al. 18 Furthermore, Seo et al. 26 reported no significant difference in eight regions in terms of the total ivy score.
The distribution pattern observed in most studies may support the speculative origin of ivy sign. In MMD patients, leptomeningeal collaterals originate mostly from PCA because the distal ICA and MCA are occluded with disease progression.42–44 Accordingly, a higher ivy sign frequency in the post-MCA region should be observed if the ivy sign really reflects leptomeningeal collaterals from the PCA. In our latest study, we also observed that PCA contributed mostly to the hemodynamic sources of the recipient parasylvian cortical arteries (PSCAs) in MMD patients. 45
Some researchers fixed the axial sections at the level of the lateral ventricles body and basal ganglia when performing regional division.16,24,25 Axial level fixation may be more conducive for radiological observations, but may also cause omissions. Furthermore, when analyzing the association between ivy sign and hemodynamic changes, we need to select the slice of FLAIR images with typical ivy signs and compare that with the cerebral vascular reserve (CVR) on the same slice of the SPECT images, 22 which makes axial level fixation inflexible.
Grading criteria
The degree of ivy sign burden in each divided region was evaluated either via the “signal intensity” or the “area of occurrence” on FLAIR images.16,18 We reviewed and summarized these ivy sign grading criteria into four types:
(i) Three grades based on intensity: grade 0 (negative; no ivy sign), grade 1 (minimal; ivy sign defined as minimal or equivocal high signal intensity), and grade 2 (positive; ivy sign obviously linear and punctate high signal intensity).
(ii) Four grades based on intensity: “absent,” “minimal,” “moderate” and “marked.” Minimal indicates subtle and equivocal high signal intensity along the cortical sulci, whereas marked indicates obvious linear and punctate high signal intensity.
(iii) Three grades based on areas: 0 = absent, 1 = less than half of the cortical surface, 2 = more than half of the cortical surface.
(iv) Four grades based on areas: 0 indicated an absence of ivy sign in the defined region; 1 indicated the presence of ivy sign in less than one-third of the defined region; 2 indicated that more than one-third of the region had ivy sign; 3 indicated that more than two-thirds of the region had ivy sign.
The first type was adopted most frequently (eight studies), followed by the third (five studies), the fourth (one study) and the second type (one study) (Table 3).
According to our summary, these four different grading types did not lead to any obvious difference when analyzing ivy-sign-related factors. However, we propose that the degree of ivy sign may not be fully revealed, either singly by signal intensity or by occurrence area. The signal intensity grading may indicate the extent of dilated pial vasculatures, while the area grading may reflect the scope supplied by the slow leptomeningeal collateral flow. A better way is to combine the two methods together, but feasibility in clinic process must also be considered, which needs more studies to explore. Besides, Kaku et al. and Seo et al. also recommended the total ivy score (TIS),24,26 defined as the sum of scores of the four regions from each or bilateral hemispheres, to evaluated ivy sign degree more accurately.
Incidence
The incidence of ivy sign in MMD on the term “patients” ranged from 30.3% to 100%. However, if we exclude the three studies23,28,31 that reported incidence less than 40%, the remaining nine studies all reported a very high incidence: more than 80%.
This variation may be due to the different composition of onset types of the samples included in each study. For example, Vuignier et al. reported an 31.3% incidence; however, all the patients were clinical asymptomatic MMD. 23 Another reason may be that some studies count the number of patients,17,19 or the number of hemispheres,16,21 while others count the regions where ivy sign occurs.18,24
Thus, we further summarized the incidence of ivy sign in MMD in the terms of regions, affected side, and unaffected side (Figure 4). Generally, ivy sign is common in MMD patients, especially in the hemisphere on the affected side.

Incidence of ivy sign in MMD.
Related factors
Angiography
The correlation of ivy sign with MMD angiography, although studied through digital subtraction angiography (DSA) or magnetic resonance angiography (MRA), is still controversial (Table 2). Fujiwara et al. found that hemispheres with poorly MRA-visualized cortical branches of the MCA had prominent ivy sign. 16 However, results from Jin et al., Jung et al. and Nam et al. found no significant correlation between ivy sign and the stenosis sites/severity of intracranial arteries.21,27,31 A positive correlation between the appearance of ivy sign and the development of leptomeningeal collaterals was discovered by Kawashima et al., 17 while Kronenburg et al. found no correlation via DSA and arterial spin labeling (ASL) MRI. 33 Besides, Ishii et al. found the postoperative reduction of ivy sign was not significantly correlated with good collateral circulation from bypass surgery. 30
CVR
The progressive nature of MMD leads to complicated hemodynamic changes. The sustained reduction of cerebral perfusion pressure (CPP) causes the reduction of cerebral blood flow (CBF). 46 However, CBF can still be normal due to vascular autoregulation. This capacity by which intracranial vessels dilate reflexively to maintain CBF is known as the CVR. 47 When the autoregulation cannot offset the effect of decreased CPP, CBF will decrease as well, accompanied by compensatory increases in oxygen extraction fraction (OEF) and cerebral blood volume (CBV). 48 Among these, CVR may be the most valuable indicator to reflect the cerebral hemodynamic changes of MMD patients. 46
In order to compensate for the decreased cerebral perfusion, three major collateral pathways develop49,50: (1) basal moyamoya perforator vessels arising from the anterior two-thirds of the circle of Willis. (2) Leptomeningeal collateral vessels from the posterior cerebral artery (PCA), and (3) trans-dural collateral vessels richly investing the leptomeninges from the external carotid artery (ECA) circulation. Thus, the complicate hemodynamic changes detected by parameters such CVR, CBV, CBF, and OEF, etc., indicate the progressive nature of the dilated pial vasculature, or the slow flow of developed leptomeningeal collaterals.
Indeed, in 2009, Kawashima et al. found that unilateral hemispheric ivy proliferation correlated highly with the existence of an ipsilateral decreased CVR associated with the development of leptomeningeal collaterals in patients with MMD. 17 Mori et al. found the degree of the ivy sign showed a negative relationship with the resting CBF. 18 Vuignier et al. also showed a significant positive correlation between the presence of ivy sign and CBV increase. 23 These were confirmed by subsequent studies.20,24,31 By using positron emission tomography, Vuignie et al. also found that ivy sign was significantly correlated with the increase OEF. 23 Consistently, the improvement of CVR after direct or indirect bypass surgery brought about a decrease in ivy sign.19,20,22
Thus, all the above results were considered as critical evidence that the ivy sign originates from slow retrograde flow of engorged pial arteries via leptomeningeal anastomosis compensating for decreased perfusion pressure. However, to be note, there were still two studies that found ivy sign was not related to impaired CVR or elevated OEF.24,33 Kronenburg et al. found that ivy sign was not related to the absence of CVR. However, their regional division method (10 regions) was very different from that of the other studies. In 19 MMD patients with ivy sign, Kaku et al. found no significant differences in cerebral metabolic rate of oxygen and OEF between ivy sign scores. However, the small sample size may limit that conclusion.
Clinical severity
MMD patients with ivy sign showed significant ischemic symptoms [frequent transient ischemic attacks (TIAs) and completed stroke], especially on the ipsilateral hemisphere, while those patients/hemispheres without ivy sign had mild or no symptoms.22,24,26 However, Ishii et al. found that postoperative de novo ivy sign had no significant association with postoperative transient neurologic symptoms (TNS). 28 Due to there being only a few studies with small sample size on this topic, more clinical studies are needed.
The mechanism of ivy sign
Three main mechanisms of the ivy sign on FLAIR images has been proposed, including slow retrograde flow of engorged pial arteries via leptomeningeal anastomosis,9,16 maximally dilated pial vasculature compensating for decreased perfusion pressure,17–20 and congestive thickening of the leptomeninges. 9 However, these possible mechanisms can only explain part of the performances of ivy sign. Based on the summary of previous studies, we tend to explain ivy sign as follows.
Figure 5A shows the sagittal and cross-sectional perspectives of the brain in normal conditions without stenosis or occlusion at the end of ICA. The antegrade blood flows from MCA via the normal pial vessels to supply the cerebral parenchyma. However, as shown Figure 5B, stenosis or occlusion at the distal ICA in MMD patients significantly reduces the blood flow in MCA and ACA, while the PCA usually remains normal.18,51 In order to maintain the blood supply to the hypoperfusion sites, arterioles and perforating arteries expanded. As the disease progresses, however, the ability of this autoregulatory system or CVR to preserve adequate perfusion is lost when compensatory arteriolar dilation reaches a maximum. Further increases in vascular resistance at the stenosis ultimately lead to tissue oligemia and possible ischemia. 52 To compensate for the intracranial ischemia, leptomeningeal collaterals subsequently anastomosed between PCA and MCA (mainly post-MCA).53–55 Slow retrograde flow from PCA via the leptomeningeal anastomosis into the maximally dilated pial vasculatures compensates for decreased perfusion pressure. The combination of slow flow (with resultant decreased intravoxel phase dispersion and time-of-flight effects), flow-related enhancement (slow, but not static flow), and T1 shortening in some cases (development of methemoglobin) leads to continuous linear or punctate high signal intensity along the cortical sulci and subarachnoid space on MR images, which resembles ivy creeping on stones. The rapid blood flow from the ECA introduced by revascularization surgery, which can not only overcome the slow and retrograde flow, but also relieves arterioles from the continuously dilated state and restore the impaired CVR,56–58 finally leads to the reduction of ivy sign in MMD patients.
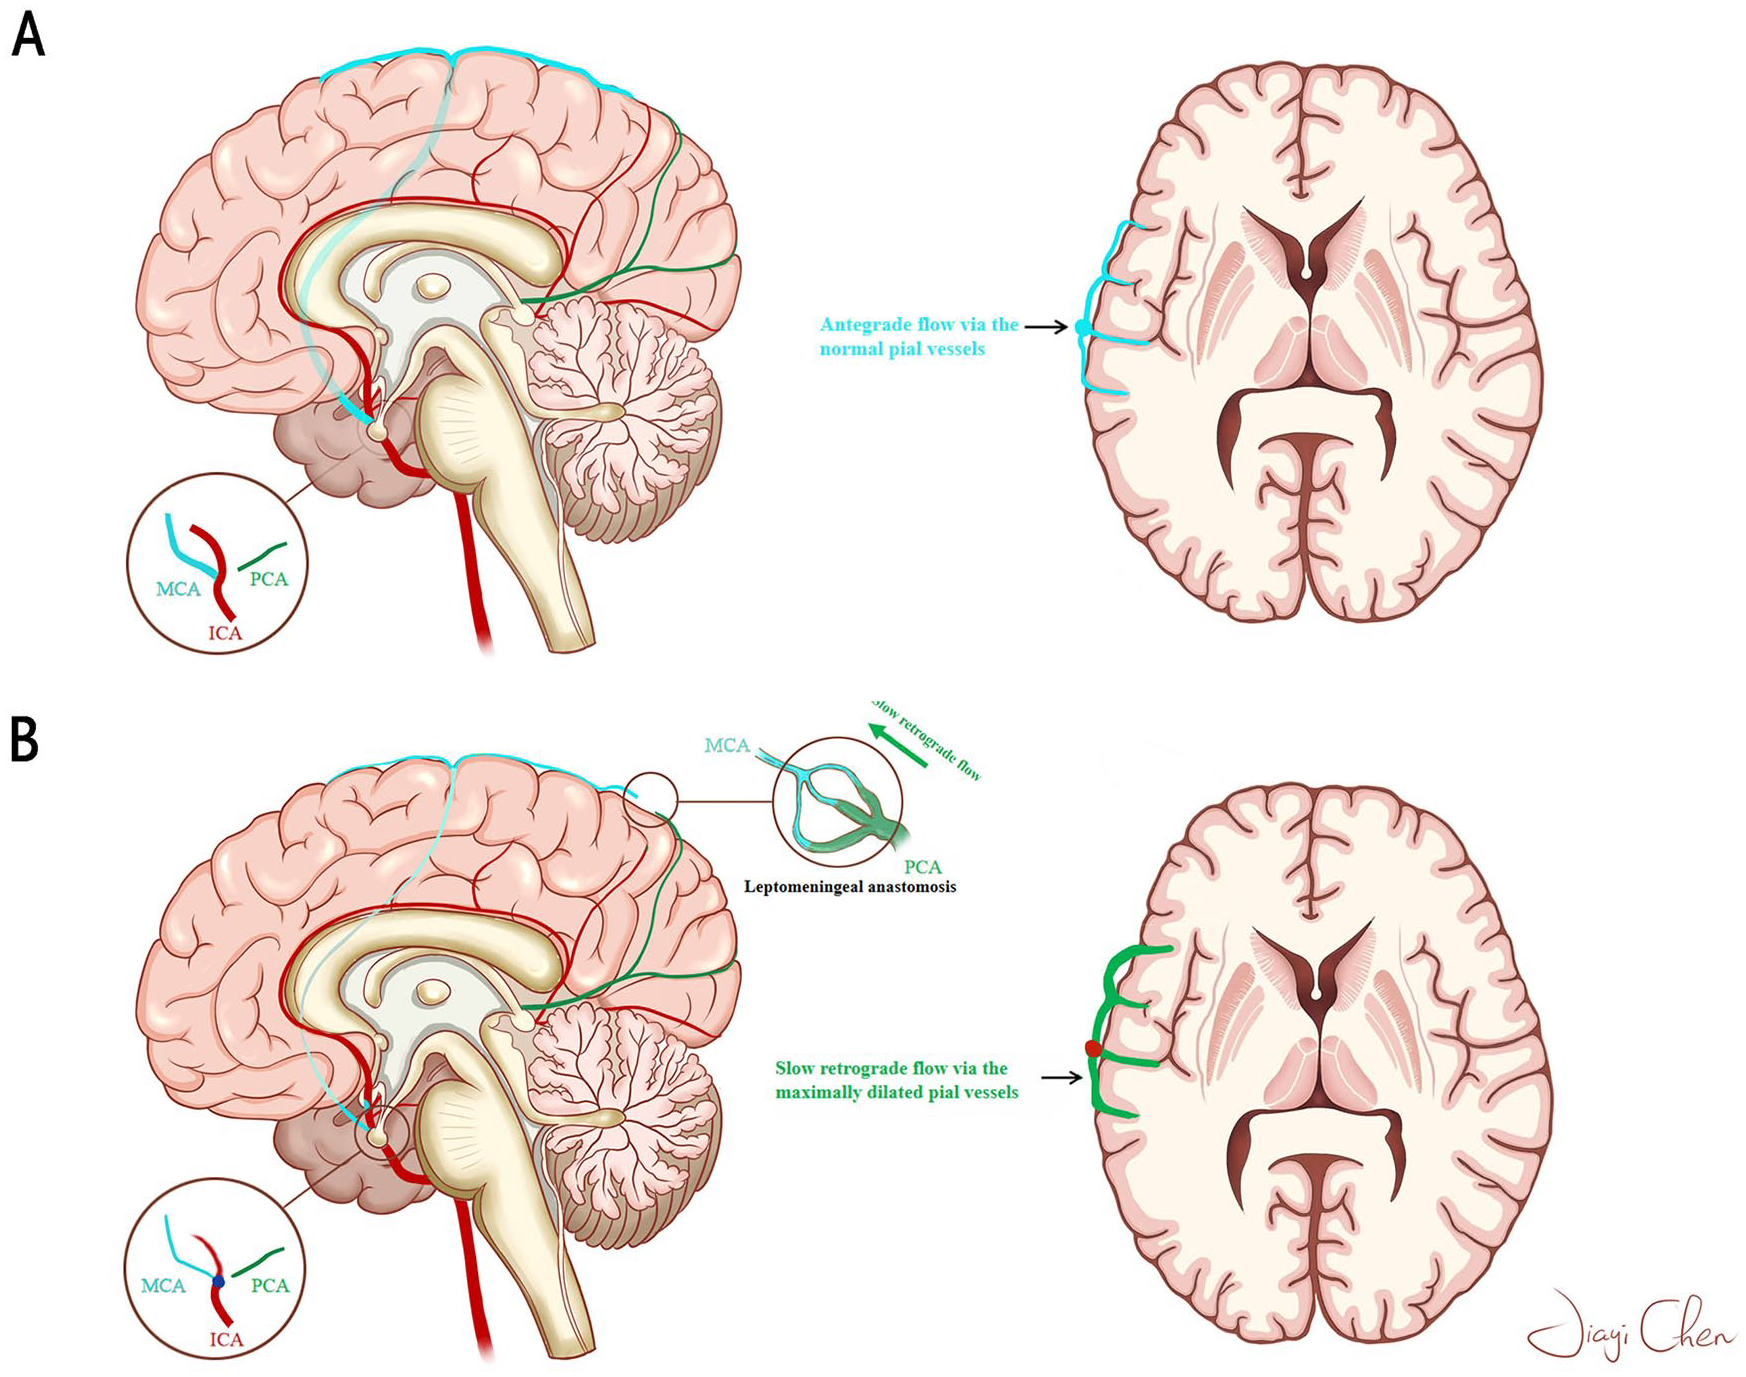
The speculative mechanism of ivy sign.
The pathological mechanism of the de novo ivy sign is uncertain but is MMD specific. Horie et al. 25 speculate that the sign could indicate a focal increase in CBF in pial vessels in MMD because bypass flow through the anastomosed superficial temporal artery (STA) is reportedly larger in MMD than in atherosclerosis owing to a larger gradient pressure. 59 Therefore, this differs from the preoperative ivy sign, showing chronically engorged pial vasculature because of ischemia. Results from Horie et al. also showed that the postoperative de novo ivy sign diminished in the follow up, indicating that the de novo ivy sign is a transient hemodynamic change after bypass surgery. Therefore, one should note that bypass surgery causes dynamic changes in postoperative cortical hemodynamics in MMD, and careful postoperative monitoring and management is mandatory for patients with MMD.
Effects of treatments
Direct bypass surgery (STA–MCA), indirect bypass surgery (such as Multiple Burr-Hole Surgery), or conservative treatment can effectively reduce ivy sign on affected side,15,17,19,20,22,23,30,32 while the contralateral side remains unchanged. 19
Postoperative ivy sign improvement can be observed on 55.6–100% of affected hemispheres, mostly in the post-MCA region, and is significantly associated with improvement of CVR (Table 2).19,20,22 For asymptomatic MMD patients, ivy sign decrease in 33% of the patients who received surgery. 23 Furthermore, in the conservative treatment group, ivy sign is an independent predictor of ipsilateral 3-year ischemic recurrence. 31 Interestingly, Ishii et al. and Horie et al. observed that, instead of decreasing, ivy sign increased after operations.25,28 These de novo ivy signs were observed in more than 50% hemispheres on affected sides, and were significantly related to postoperative hyperperfusion. In general, the decrease of ivy sign may be a marker of postoperative CVR improvement and perfusion change according to current studies.
Future prospects
Although, up to now, many researches have explored the performance and significance of ivy sign in MMD, there are many issues to be addressed.
(1) As mentioned above, a well-defined grouping (e.g., onset, age, or hemisphere classification) of MMD patients is necessary when studying the ivy sign. On the one hand, the recruitment and anastomoses of extra- and intra- cranial arterial collateral circulations are closely related to the chronic hypoperfusion due to arterial flow restrictions. 55 However, fragile and underdeveloped collaterals also represent potential risk sources of cerebral hemorrhage.60,61 It is far from clear whether the incidence, as well as the correlation with clinical severity and pathological processes, of ivy sign are different between hemorrhagic and ischemic MMD.
(2) Is there any specific feature of ivy sign in MMD patients with PCA stenosis? Ivy sign is considered to originate from leptomeningeal anastomosis between MCA and unaffected PCA. However, stenosis or occlusion of the proximal part of the PCA also affects about 25% of patients with MMD.62,63 In these MMD patients, trans-dural collateral vessels from the ECA circulation should be more obvious, as well as the distribution pattern should be different. Thus, a cohort study of ivy sign in MMD patients with PCA stenosis or occlusion may give us more information to understand the origination of ivy sign.
(3) Hyperintensity in arteries and collateral vessels may represent slow flow, but its presence might represent an adequate compensatory response to proximal stenosis or occlusion. 64 For example, Pantano et al. suggest that marked vascular enhancement and increased cerebral blood volume might indicate good compensatory hemodynamic response via collaterals in MCA in the setting of acute stroke. 65 However, there are limited data addressing the question of prognosis between MMD patients with and without ivy sign under conservative treatment, although the “Ivy sign (+) group” showed a higher ischemic recurrence rate than did the “Ivy sign (–) group” in Nam et al.’s study. 31
(4) In previous studies, perfusion “abnormalities” are reported to correspond to ivy sign dominant regions. While perfusion parameters such as CVR, CBF, CBV, and OEF may reflect an abnormality, clinical relevance between ivy sign and perfusion “abnormalities” is not yet clear. For example, unilateral hemispheric proliferation of ivy signs may correlate with ipsilateral hemispheric decrease of CVR, but how much of a decrease signifies ivy sign appearance and the brain tissue at risk?
(5) Studies have shown that a better preoperative CVR indicated a better postoperative prognosis. For example, Antonucci et al. 66 found impaired CVR on preoperative imaging was independent risk factors for severe ischemic complications following STA-MCA bypass in MMD. Furthermore, ivy sign appears not only in symptomatic patients, but also in asymptomatic patients. Combined with the positive correlation between the degree of ivy sign and the impairment of CVR, it is suggested that ivy sign may be able to predict the degree of impaired CVR in asymptomatic MMD patients. Thus, is it possible to detect the serious imbalance of energy supplies and demands via ivy sign before the occurrence of irreversible lesions so as to timely implement the intervention measures to obtain the maximum clinical effect?
(6) The grading system of ivy sign is based on the extent of vascular intensity or the area in the sylvian fissure and over vascular territories, but the vessels evaluated are primarily over cortical surfaces, whereas areas of hypoperfusion using perfusion techniques are more directly measurable. Subcortical ischemia may not be well represented by ivy sign. The relationship between parenchymal ischemic lesions and ivy sign has not been elucidated.
(7) The most important goal in research into ivy sign is to know what this sign is clinically indicative of. In other words, it is necessary to clarify (1) how ivy sign can accurately access hemodynamic abnormality in MMD, (2) whether ivy sign is a sufficient evaluation method to determine surgical indication, and (3) whether ivy sign is reliable as an evaluation method after treatment. To clarify this point of view, it is better to have more studies with abundant sample amounts about how the ivy sign and CVR or clinical severity correlate.
Conclusion
As a special imaging manifestation in MMD patients, “Ivy sign” depicts a continuous linear or punctate high intensity along the cortical sulci and subarachnoid space on MR images. During the last 25 years, many related explorations have been made. Ivy sign is positively related to clinical ischemic severity and impaired CVR. Ivy sign reflects the development of compensatory collaterals, and indicates postoperative prognosis in MMD patients. However, many questions still need to be clearly answered in the future.
Footnotes
Acknowledgements
The authors thank all participants in the study.
Conflict of interest statement
The authors declare that there is no conflict of interest.
Funding
The authors disclosed receipt of the following financial support for the research, authorship, and/or publication of this article: This work was supported by the National Natural Science Foundation of China (grant number 81771280).