
Abstract
Background:
We applied a network Mendelian randomization (MR) framework to determine the causal association between body mass index (BMI) and coronary heart disease (CHD) and explored whether glycated hemoglobin (HbA1c) and lipid parameters (total cholesterol, TC; low-density lipoprotein cholesterol, LDL; high-density lipoprotein cholesterol, HDL; triglycerides, TG) serve as causal mediators from BMI to CHD by integrating summary-level genome-wide association study data.
Methods:
Network MR analysis, an approach using genetic variants as the instrumental variables for both the exposure and mediator to infer causality was performed. Summary statistics from the GIANT consortium were used (n = 152,893) for BMI, CARDIoGRAMplusC4D consortium data were used (n = 184,305) for CHD, Global Lipids Genetics Consortium data were used (n = 108,363) for TC, LDL, HDL and TG, and MAGIC consortia data were used (n = 108,363) for HbA1c.
Results:
The inverse-variance-weighted-method estimate indicated that the odds ratio (95% confidence interval) for CHD was 1.562 (1.391–1.753) per 1 standard deviation (kg/m2) increase in BMI. Results were consistent in MR Egger method and weighted-median methods. MR estimate indicated that BMI was positively associated with HbA1c and TG, and negatively associated with HDL, but was not associated with TC or LDL. Moreover, HbA1c, TC, LDL, and TG were positively associated with CHD, yet there was no causal association between HDL and CHD. HbA1c was positively associated with TC, LDL, and HDL, but was not associated with TG.
Conclusions:
Higher BMI conferred an increased risk of CHD, which was partially mediated by HbA1c and lipid parameters. HbA1c and TG might be the main mediators in the link from BMI to CHD.
Introduction
Coronary heart disease (CHD) is a major cause of morbidity and mortality and its prevalence is increasing worldwide. 1 Targeting modifiable risk factors, including body weight, HbA1c and lipid metabolism for CHD prevention is a key public health priority. 2 Observational studies have identified associations between adiposity and the risk of CHD. 3 A Mendelian randomization (MR) analysis revealed that both general adiposity (identified as body mass index, BMI) and central adiposity (identified as waist:hip ratio adjusted for BMI) have causal effects on CHD. 4 So the causality of the association between BMI and CHD had been proved previously, yet the underlying mechanisms remain to be elucidated. Randomized controlled trials (RCTs) showed that abnormal lipid parameters, including elevated triglycerides (TG), low-density lipoprotein cholesterol (LDL), glucose and blood pressure increased the risk of CHD.5,6 As for causal associations between lipid parameters and CHD, the genetic findings supported causal effects of TG and LDL on CHD risk. 7 Observational evidence suggested that glycated hemoglobin (HbA1c) was positively associated with CHD, 8 and a recent MR study revealed that HbA1c likely causes CHD, though the underlying mechanisms remain to be elucidated. 9 Thus, both lipid parameters and HbA1c may act as potential mediators between BMI on CHD.
MR, using genetic variants as instrumental variables to test for causality, can infer credible causal associations. Causal inference from an MR study relies on the instrumental variable assumptions, which require that the genetic variant is robustly associated with the exposure, independent of confounders of the exposure–outcome relationship, and influences the outcome through the exposure only and not through any alternative causal pathway (Figure 1). 10

The network Mendelian randomization analysis framework.
We applied a network MR framework to determine the causal association between BMI and CHD and explored whether HbA1c and lipid parameters (total cholesterol, TC; LDL; high-density lipoprotein cholesterol, HDL; TG) serve as causal mediators from BMI to CHD by integrating summary-level genome-wide association study (GWAS) data.
Methods
Summary of GWAS data
We included summary data from any array-based analysis, including targeted and untargeted arrays, with or without additional imputation for single nucleotide polymorphisms (SNPs). We also collected published GWAS associations that comprise only the significant hits of a GWAS after applying stringent p value thresholds (e.g. p < 5 × 10⁻⁸, a conventional threshold for declaring statistical significance in GWAS), using the clumping algorithm (r2 threshold = 0.05 and window size = 1 Mb). Summary statistics from the GIANT consortium were used (n = 152,893) for BMI, 11 CARDIoGRAMplusC4D consortium data were used (n = 184,305) for CHD, 12 Global Lipids Genetics Consortium data were used (n = 108,363) for TC, LDL, HDL, and TG, 13 and MAGIC consortia data were used (n = 108,363) for HbA1c. 14 Details of studies and datasets used for analyses are presented in Table 1. We obtained SNPs strongly (p < 5 × 10⁻⁸) associated with BMI from the largest and most recent GIANT consortium. Linkage disequilibrium between SNPs was identified from the ‘clump data’ R package. All SNPs as instrumental variables were defined as being independent of each other using the clumping method implemented in PLINK1.9 and 1,000 Genomes Project phase III (European: Europea) reference population. The genetic instruments were applied to the largest publicly available GWAS of TC, LDL, HDL, TG, and HbA1c.
Details of studies and datasets used for analyses.

BMI, body mass index; CHD, coronary heart disease; GLGC, Global Lipids Genetics Consortium; HDL, high-density lipoprotein cholesterol; ID, identification number; LDL, low-density lipoprotein cholesterol; NA, not available; SD, standard deviation; TC, total cholesterol; TG, triglycerides.
Data extraction and harmonization
The summary-level GWAS data for the diseases were computed from two independent community-based studies with individual-level SNP genotypes. We also requested the following metrics of SNP genotype quality from disease and risk factor studies: strong evidence of between-study heterogeneity in the SNP-trait association (p ⩽ 0.001), Hardy–Weinberg disequilibrium (p ⩽ 0.001), or imputation quality metric (info or r2) ⩽ 0.90. We harmonized the summary data for diseases and risk factors so that the effect allele reflected the allele associated with exposure. When SNPs were palindromic, that is, A/T or G/C, we used information on allele frequency to resolve strand ambiguity. We excluded SNP-trait associations from the GWAS catalog if they were missing a p value, beta or a standard error (SE) for the beta.
Two-sample MR and causal effect assessment
We performed MR in a strategy known as two-sample MR (2SMR) by using results from the GWAS. 15 Here, the SNP-exposure effects and the SNP-outcome effects were obtained from separate studies. With the summary data alone, it is possible to estimate the causal influence of exposure on outcome.
We explored the causal associations 16 by the conventional MR approach (IVW) method, MR Egger method and the weighted-median method. We conducted heterogeneity tests in MR analyses using IVW and MR Egger methods. Horizontal pleiotropy refers to when genetic variants associated with traits on discrete pathways are also causal in disease. 17 Unbalanced horizontal pleiotropy distorts the association between the exposure and the outcome, and the effect estimate from the IVW method can be exaggerated or diminished. Unbalanced horizontal pleiotropy can be formally assessed by the MR Egger method, which provides a valid MR estimate that takes into account presence of unbalanced horizontal pleiotropy. 18
The ‘causal’ relationship was rigorous in this study, for it was identified only when the observed association passed the IVW, MR Egger, and weighted-median methods.
Network MR for ‘exposure–mediator–outcome’ analyses
The MR framework with 2SMR and network MR design analysis is used to obtain effect estimates of the exposure–outcome, exposure–mediator, and mediator–outcome associations. 19 The framework of the network MR analysis is described in Figure 1. A network MR analysis consists of three 2SMR tests: (a) the causal effect of genetically determined exposure on outcome is estimated; (b) the causal effects of genetically determined exposure on the potential mediators are analyzed; (c) the causal effects of the possible mediators on outcome are estimated. First, the causal effect of genetically determined BMI on CHD is estimated. Next, the causal effects of genetically determined BMI on the risk factors [the potential mediators (TC, LDL, HDL, TG and HbA1c)] are analyzed. Finally, the causal effects of the possible mediators on CHD are estimated. If causal associations are observed in all three steps, the conclusion can be drawn that the specific risk factor is a mediator.
Rather than a direct causal relationship between the independent variable and the dependent variable, a mediation model proposes that the independent variable influences the (nonobservable) mediator variable, which, in turn, influences the dependent variable. Thus, the mediators serve to clarify the nature of the relationship between BMI and CHD. If causal associations are observed in all above steps, the potential mediators are confirmed in the causal link between exposure and outcome.
Statistical analysis
To make the data suitable for MR, we converted odds ratios (ORs) to log ORs and inferred SEs from reported 95% confidence intervals (CIs) or (if the latter were unavailable) from the reported p value using the Z distribution. For binary traits, the beta corresponded to the log OR per copy of the effect allele. For quantitative traits, the beta corresponded to the SD change in the trait per copy of the effect allele.
p values were two sided, and evidence of association was declared at p < 0.05. Where indicated, Bonferroni corrections were used to make allowance for multiple testing, although this is likely to be overly conservative given the non-independence of many of the outcomes tested. All analyses were performed in R 3.2.4 (http://www.r-project.org), and Stata release 13.1 (StataCorp LP, Texas City, USA).
Results
Causal associations between genetically determined BMI and CHD
The inverse-variance weighted (IVW)-method estimate indicated that the OR (95% CI) for CHD was 1.562 (1.391–1.753) per 1 standard deviation (SD; kg/m2) increase in BMI (Table 2). Results were consistent with the MR Egger method (OR, 1.653; 95% CI, 1.246–2.192; p = 0.001) and weighted-median methods (OR, 1.473; 95% CI, 1.267–1.711; p = 0.000; Table 2). Thus, we had strong power to identify that the genetically predicted BMI was positively associated with CHD and the causal influence of the BMI on the CHD was true. Both IVW and MR Egger estimates indicated that there was heterogeneity among these 79 SNPs in the causal effect between BMI and CHD, so it was better to exclude some possible SNPs which might be responsible for the heterogeneity. Moreover, there was no evidence of directional horizontal pleiotropy in the MR Egger regression [MR Egger intercept = −0.0017, standard error (SE) = 0.004, p = 0.667].
Causal associations between genetically determined BMI and CHD.

Strong evidence for heterogeneity among SNPs (Cochran’s Q value = 41.78, pheterogeneity = 3.6 × 10⁻⁶), suggesting that at least some of the SNPs exhibit horizontal pleiotropy.
There was no evidence of directional horizontal pleiotropy in the MR Egger regression [−0.018 (SE = 0.015), p = 0.278].
BMI, body mass index; CI, confidence interval; CHD, coronary heart disease; IVW, inverse-variance weighted; MR, Mendelian randomization; OR, odds ratio; SD, standard deviation; SE, standard error; SNP, single nucleotide polymorphism.
Causal associations between genetically determined BMI and HbA1c
Both the IVW method (OR, 1.064; 95% CI, 1.029–1.100; p = 0.000) and weighted-median method (OR, 1.099; 95% CI, 1.042–1.159; p = 0.001) estimate indicated that BMI was positively associated with HbA1c (Table 3). There was the same trend with the MR Egger method, though not statistically significant (OR, 1.078; 95% CI, 0.994–1.171; p = 0.075). With no heterogeneity nor directional horizontal pleiotropy detected, we believed that there were causal associations between genetically determined BMI and HbA1c.
Causal associations between genetically determined BMI and HbA1c.

BMI, body mass index; CI, confidence interval; HbA1c, glycated hemoglobin; IVW, inverse-variance weighted; MR, Mendelian randomization; OR, odds ratio; SD, standard deviation; SE, standard error; SNP, single nucleotide polymorphism.
Causal associations between genetically determined BMI and lipid parameters
The MR analyses (MR Egger, weighted-median and IVW methods) showed that BMI was positively associated with TG and negatively associated with HDL but was not associated with TC or LDL (Table 4).
Causal associations between genetically determined BMI and lipid parameters.

BMI, body mass index; CI, confidence interval; HDL, high-density lipoprotein; IVW, inverse-variance weighted; LDL, low-density lipoprotein; MR, Mendelian randomization; OR, odds ratio; SD, standard deviation; SE, standard error; SNP, single nucleotide polymorphism; TC, total cholesterol; TG, triglycerides.
Causal associations between HbA1c and CHD
The MR analyses (MR Egger, weighted-median and IVW methods) showed that HbA1c was positively associated with CHD, with no heterogeneity nor directional horizontal pleiotropy (Table 5).
Causal associations between HbA1c and CHD.

CHD, coronary heart disease; CI, confidence interval; HbA1c, glycated hemoglobin; IVW, inverse-variance weighted; MR, Mendelian randomization; OR, odds ratio; SE, standard error; SNP, single nucleotide polymorphism.
Causal associations between lipid parameters and CHD
The MR analyses (MR Egger, weighted-median and IVW methods) showed that both TC and LDL were positively associated with CHD. It seemed that there was no causal association between HDL and CHD (Table 6). Both the IVW method and weighted-median method estimate indicated that TG was also positively associated with CHD. There was the same trend with the MR Egger method, though it was not statistically significant.
Causal associations between lipid parameters and CHD.
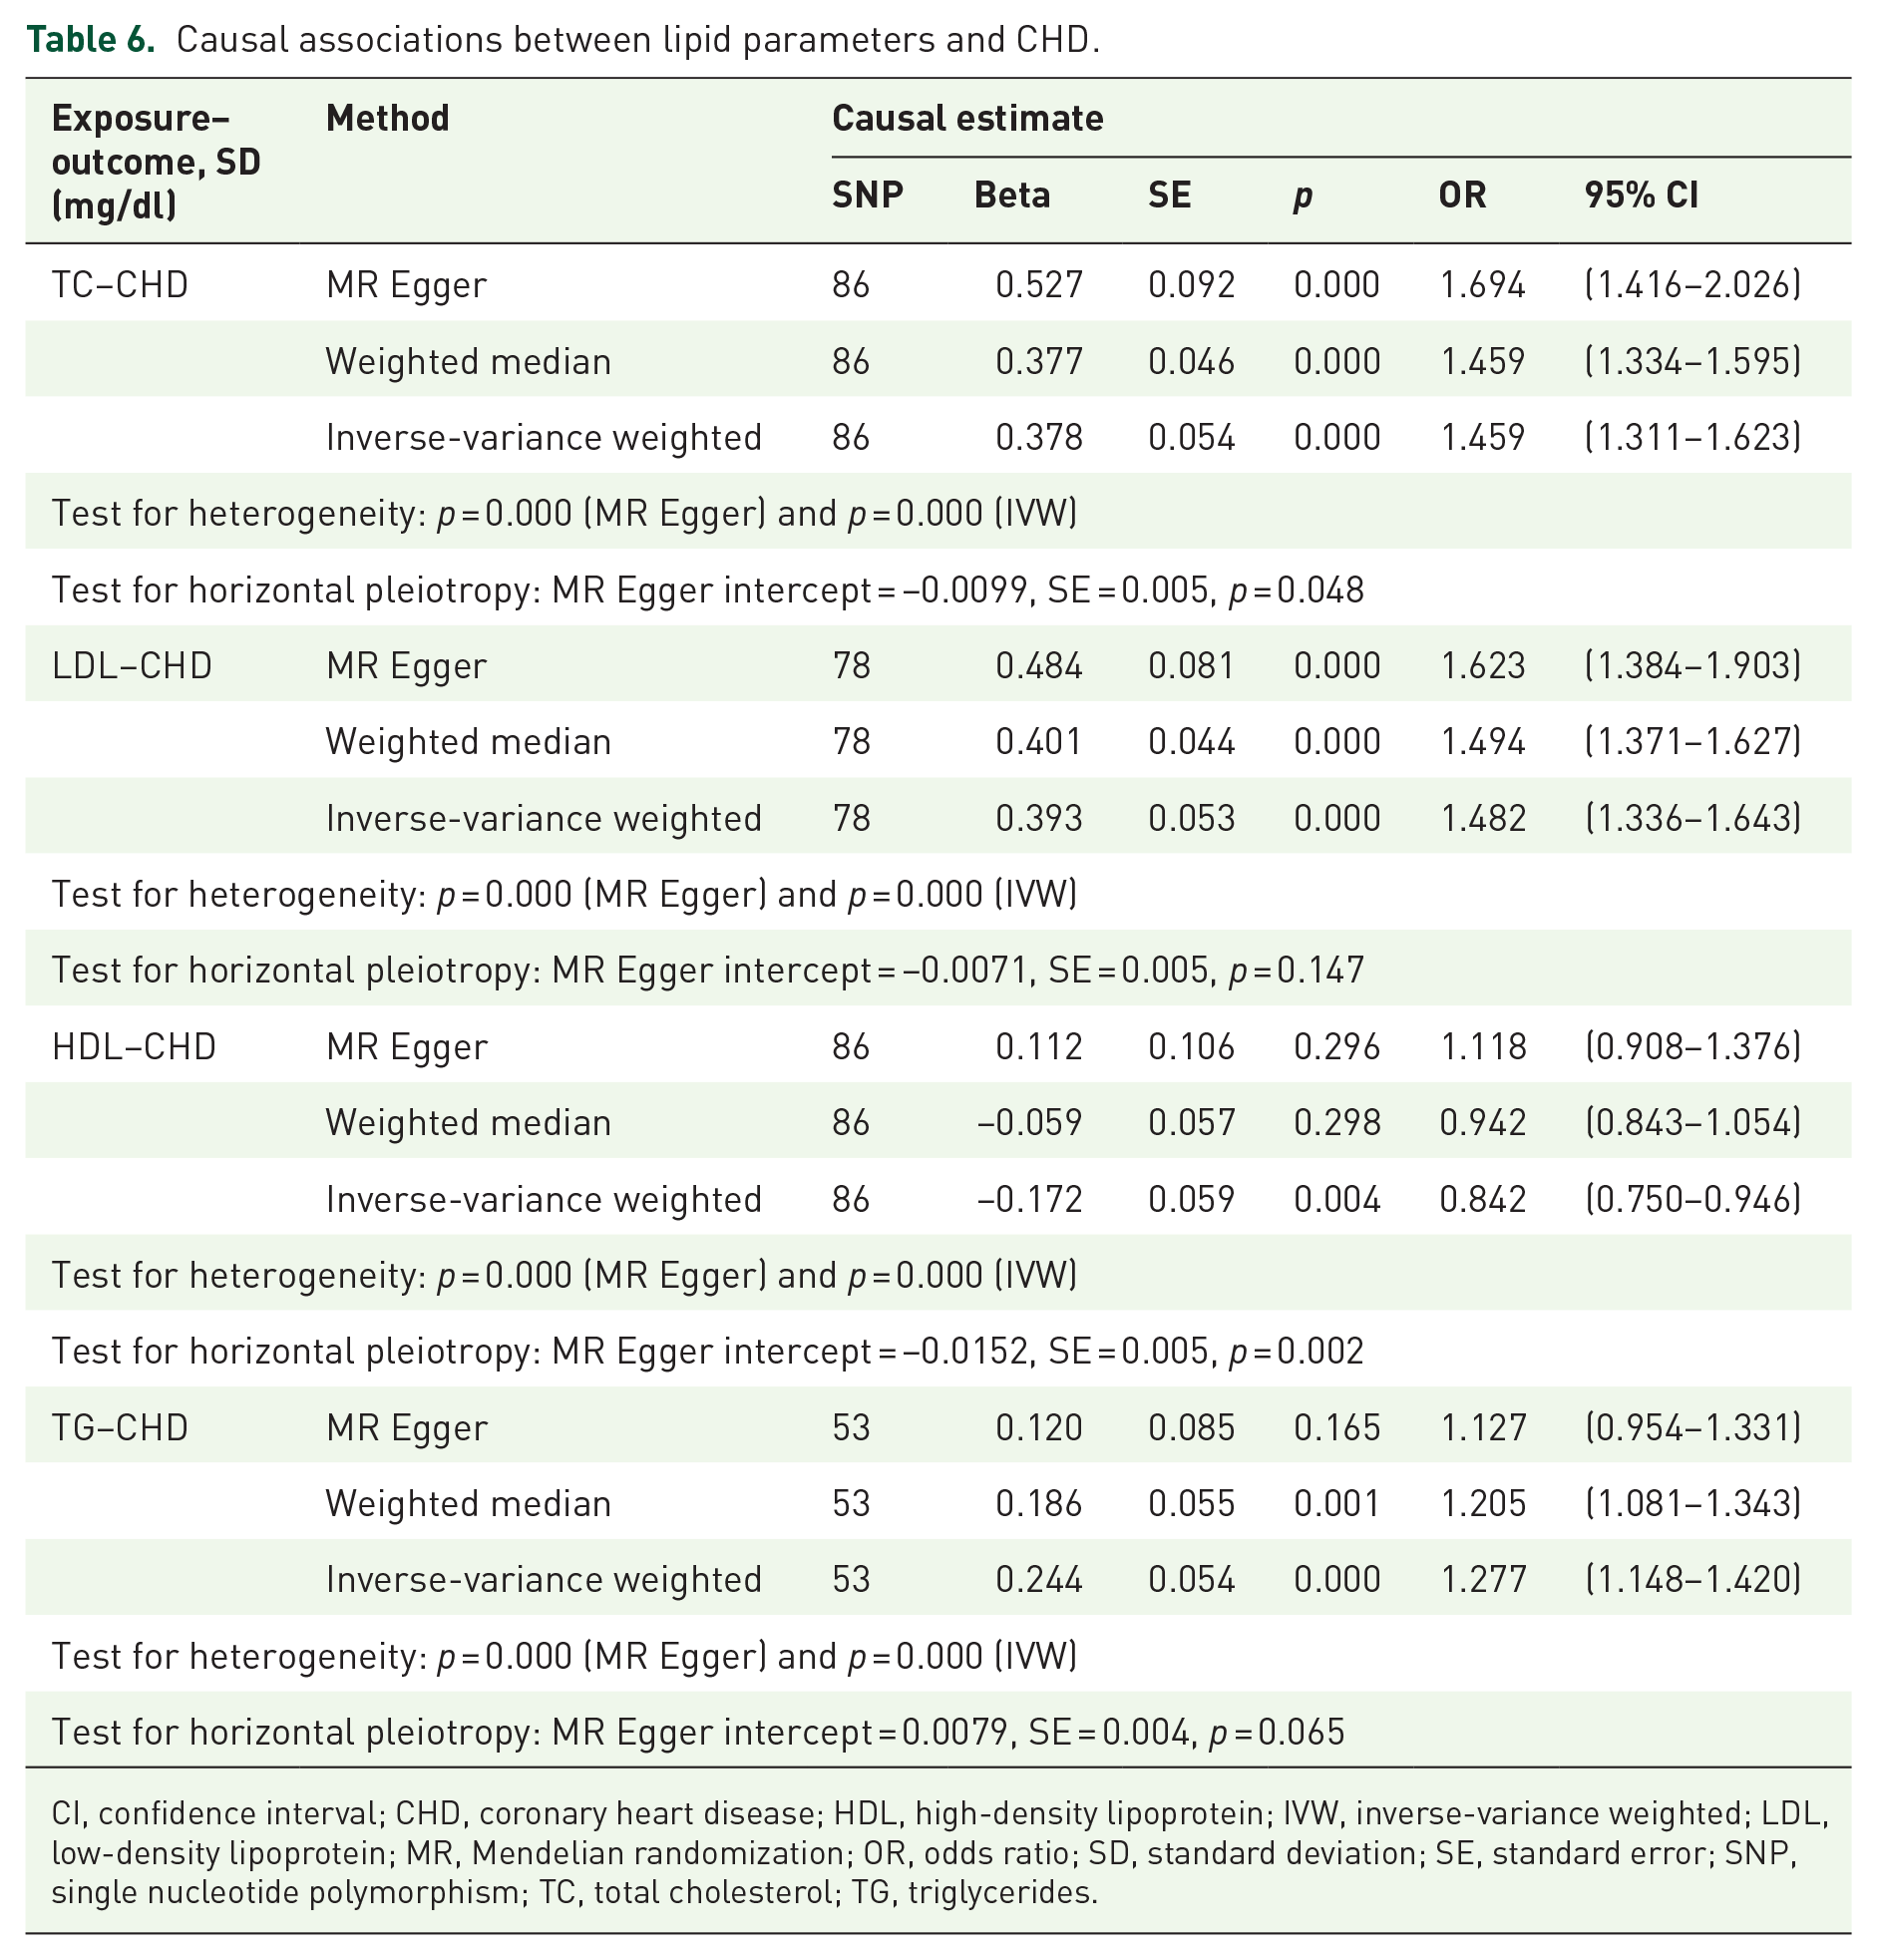
CI, confidence interval; CHD, coronary heart disease; HDL, high-density lipoprotein; IVW, inverse-variance weighted; LDL, low-density lipoprotein; MR, Mendelian randomization; OR, odds ratio; SD, standard deviation; SE, standard error; SNP, single nucleotide polymorphism; TC, total cholesterol; TG, triglycerides.
Causal associations between HbA1c and lipid parameters
The MR analyses (MR Egger, weighted-median and IVW methods) showed that HbA1c was positively associated with TC, LDL and HDL, but was not associated with TG (Table 7).
Causal associations between HbA1c and cholesterol metabolism.

CI, confidence interval; HbA1c, glycated hemoglobin; HDL, high-density lipoprotein; IVW, inverse-variance weighted; LDL, low-density lipoprotein; MR, Mendelian randomization; OR, odds ratio; SE, standard error; SNP, single nucleotide polymorphism; TC, total cholesterol; TG, triglycerides.
Causal associations between lipid parameters and HbA1c
The MR analyses (MR Egger, weighted-median and IVW methods) showed that there were no causal associations between lipid parameters (TC, LDL, HDL or TG) and HbA1c (Table 8).
Causal associations between lipid parameters and HbA1c.

CI, confidence interval; HbA1c, glycated hemoglobin; HDL, high-density lipoprotein; IVW, inverse-variance weighted; LDL, low-density lipoprotein; MR, Mendelian randomization; OR, odds ratio; SD, standard deviation; SE, standard error; SNP, single nucleotide polymorphism; TC, total cholesterol; TG, triglycerides.
Discussion
The main result of this study was that genetic variants predisposing to higher BMI conferred an increased risk of CHD, with specific emphasis on HbA1c and lipid parameter risk mediators for CHD. We concluded that glycosylated hemoglobin and TG might be the main mediators in the link from BMI to CHD. Besides, poor HbA1c likely caused poor lipid parameters, yet the reverse causal association was not established. This finding was obtained from a network MR design.
There is currently no gold standard MR analysis method. Available methods have advantages and limitations that balance precision and adjustment for bias. In the present study, several MR approaches (MR Egger, weighted-median and IVW methods) were applied to evaluate the robustness of the causal associations between BMI and CHD and its potential mediators (HbA1c and lipid parameters). In this way, we have more power to identify the true associations.
The association between adiposity and CHD has been extensively studied in recent decades. Adiposity, as indicated by BMI, has been associated with risk of cardiovascular diseases in an epidemiological study. 20 Previous MR studies have proved the positive associations between BMI and CHD were causal.4,21 Our results add more evidence supporting how genetically predicted BMI is positively associated with CHD (Table 2), indicating the importance of body weight control for CHD prevention in the general population.
A polygenic risk score reported for increased waist:hip ratio, adjusted for BMI, was significantly associated with adverse cardiometabolic traits and higher risks for both type 2 diabetes and CHD, indicating a causal association between abdominal adiposity and type 2 diabetes and CHD. 22 Moreover, higher BMI was reported as associated with higher risk for type 2 diabetes, higher levels of fasting glucose, HbA1c and fasting insulin. 23 Au Yeung and colleagues examined the relationship between HbA1c and cardiovascular disease and its subtypes in the UK Biobank and revealed that HbA1c was associated with increased CHD risk. 9 Based on the above, we had the hypothesis that HbA1c might act as a risk mediator from BMI to CHD. Thus, we further analyzed the causal associations between genetically determined BMI and HbA1c, HbA1c and CHD. As expected, the MR analyses indicated that BMI was positively associated with HbA1c (Table 4) and HbA1c was also positively associated with CHD (Table 5). We concluded that the causal relationship from BMI to CHD was partially mediated by the increasing HbA1c level.
As for other possible mediators from BMI to CHD, a recent MR study found a causal effect of BMI and a wide range of lipid metabolites, including all LDL metabolites, but was conducted in a younger, healthier population. 24 However, we found BMI was positively associated with TG and negatively associated with HDL, but was not associated with TC or LDL (Table 4), consistent with some but not all earlier studies.25,26 We guessed this might due to a different population, including in the MR analysis.
The lipid parameters were causal factors for CHD, yet there were different causal roles of different kind of cholesterols on CHD. Analyses of LDL and lipoprotein were unambiguous, as there were genetic variants that associated exclusively with these risk factors that had well-understood biology; however, analyses for TG and HDL were less clear. 27 Meanwhile, some genetic findings supported a causal effect of TG on CHD risk, but a causal role for HDL, though possible, remains less certain. 7 Our results showed that both TC and LDL were positively associated with CHD, yet there was no causal association between HDL and CHD. Both the IVW- and weighted-median-method estimate indicated that TG was also positively associated with CHD. There was the same trend with the MR Egger method, though it was not statistically significant (Table 6). Combining the results in Table 4, the lipid parameters pathway might serve as a causal mediator from BMI to CHD, especially with increasing TG level.
Both HbA1c and lipid parameters were potential mediators between BMI and CHD, so we further investigated the bidirectional causality between HbA1c and lipid parameters. The MR analyses showed that HbA1c was positively associated with TC, LDL and HDL, but was not associated with TG (Table 7). Meanwhile, there were no causal associations between lipid parameters (TC, LDL, HDL, or TG) and HbA1c (Table 8). This indicated that poor HbA1c likely caused poor lipid parameters, yet the reverse causal association was not established. The HbA1c and lipid parameters summary from BMI to CHD are shown in Figure 2.
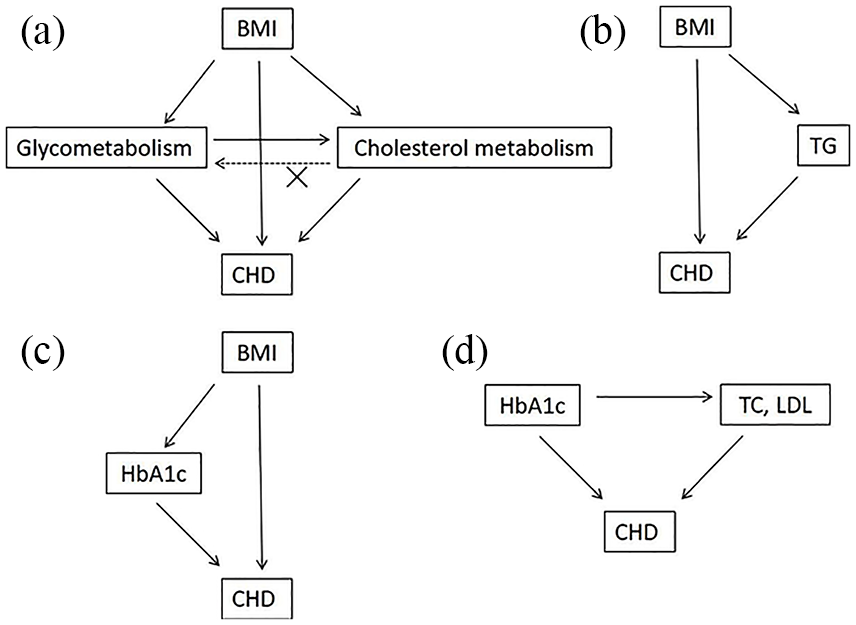
MR diagram of HbA1c and lipid parameters summary from BMI to CHD.
Our study has some limitations. First, if the exposure is a composite trait that comprises multiple subphenotypes, we could not rule out the possibility that the effect of exposure on disease is driven by one of the subphenotypes. For example, TC is made up of cholesterol proteins with different subtypes, and HbA1c can be affected by both blood glucose levels and erythropoiesis. Therefore, the causative associations identified in this study are not definitive and need to be confirmed by follow-up RCTs in the future. Second, our study assumed a linear shape of association between traits and CHD for the limited information from GWAS summary data, whereas the association curve could be ‘J’ or ‘U’ shaped. Finally, we cannot rule out other unmeasured factors and pathways due to the limitation of the number of variables and data.
Conclusion
In summary, using a network MR framework, we provide evidence supporting higher BMI conferring an increased risk of CHD, which is partially mediated by HbA1c and lipid parameters. HbA1c, TG might be the main mediators in the link from BMI to CHD. Also, poor HbA1c likely caused poor lipid parameters, yet the reverse causal association was not established. Further largescale studies or longitudinal studies are required to validate these findings.
Footnotes
Authors’ contributions
Authors Xun Hu and Xiao-dong Zhuang contributed equally to the study. Xun Hu, conception and design of the study; Xiao-dong Zhuang, analysis and interpretation of the data; Wei-Yi Mei, critical revision of the article for important intellectual content; Gang Liu, drafting of the article; Zhi-min Du, Logistic support; Xin-xue Liao, acquisition of data; Yi Li, conception and design of the study.
Funding
The author(s) received no financial support for the research, authorship, and publication of this article.
Conflict of interest statement
The author(s) declared no potential conflicts of interest with respect to the research, authorship, and/or publication of this article.
Data availability
All main figures and tables are shown in the manuscript. More data that support the findings of this study are available on reasonable request from the corresponding author (Yi Li,