
Abstract
Background:
Progress in improving risk stratification methods for patients with cytogenetically normal acute myeloid leukaemia (CN-AML) remains limited. This study investigates the prognostic significance and potential functional mechanism of malic enzyme 1 (ME1) in CN-AML.
Methods:
Gene expression and clinical data of patients with CN-AML were obtained from the Cancer Genome Atlas (TCGA) and Gene Expression Omnibus (GEO) datasets, which were subjected to analysis. The prognostic significance of ME1 was assessed through Kaplan–Meier survival analysis, as well as univariate and multivariate Cox regression analyses. A novel risk model based on ME1 expression levels was developed using TCGA data for predicting CN-AML prognosis. Furthermore, the impact of ME1 silencing on AML cell lines was investigated using the Cell Counting Kit-8 assay and flow cytometry. Gene set enrichment analysis (GSEA) analysis and Western blotting were performed to explore the mechanism of ME1 in CN-AML.
Results:
CN-AML patients expressing higher ME1 levels exhibited shorter event-free survival (EFS) and overall survival (OS) compared to those with lower ME1 expression in the TCGA and multiple GEO datasets (all p < 0.05). Univariate and multivariate Cox regression analyses indicated that ME1 expression served as an independent prognostic factor for the EFS (p = 0.024 in TCGA, p = 0.035 in GSE6891) and OS (p = 0.039 in TCGA, p = 0.008 in GSE6891) in patients with CN-AML. The developed risk model demonstrated that patients with CN-AML in the high-risk group had worse survival than those in the low-risk group (hazard ratio: 2.67, 95% confidence interval: 1.54–4.65, p < 0.001) and exhibited strong predictive accuracy for 1-, 3- and 5-year OS (area under the curve = 0.69, 0.75, 0.79, respectively). ME1 knockdown significantly inhibited proliferation and increased apoptosis in AML cells (all p < 0.05). GSEA and Western blotting demonstrated that ME1 regulates the IL-6/JAK2/STAT3 pathway in CN-AML.
Conclusion:
Elevated ME1 expression serves as an indicator of poorer prognosis in patients with CN-AML, potentially facilitating leukaemogenesis through the IL-6/JAK2/STAT3 pathway. This suggests that ME1 could be a promising prognostic biomarker and therapeutic target for CN-AML.
Plain language summary
Keywords
Introduction
Patients with acute myeloid leukaemia (AML) exhibit heterogeneity and are categorised into favourable-, intermediate- and adverse-risk groups based on cytogenetical and molecular abnormalities. 1 Cytogenetically normal AML (CN-AML) constitutes nearly half of all AML cases, and their prognosis varies significantly. Previously identified genes with dysregulated expression, such as PDE7B, STAB1, NCALD, ACTL10, HSPA8 and CPT1B, have been linked to the prognosis of CN-AML.2–7 The exploration of novel molecular biomarkers holds potential benefits for advancing risk stratification and therapeutic interventions for these patients.
Malic enzyme 1 (ME1) encodes a cytosolic protein with nicotinamide adenine dinucleotide phosphate-dependent enzyme activity and participates in various biological processes. 8 Recently, ME1 has been implicated in the progression of various cancer types, including breast cancer and gastric cancer.9–11 Additionally, it has been associated with mediating chemotherapy resistance in AML, 12 and high ME1 expression has been identified as a molecular predictor of post-transplant survival in patients with AML. 13 However, the precise role of ME1 in CN-AML remains incompletely elucidated.
This study delves into the prognostic significance of ME1 in CN-AML patients using multiple public datasets. Furthermore, the potential functional mechanism of ME1 was explored, providing evidence supporting its role as a prognostic biomarker and therapeutic target in patients with CN-AML.
Methods
Expression data and clinical information of patients with CN-AML
Data were retrieved from 79 patients with CN-AML, encompassing gene expression and complete clinical information, from the Cancer Genome Atlas (TGCA; https://portal.gdc.cancer.gov/) for analysis. Three CN-AML microarray datasets from the Gene Expression Omnibus (GEO) database were acquired and examined: GSE6891 (n = 187), GSE71014 (n = 104), GSE12417 (n = 162). Expression and clinical data were downloaded from the GEO database (http://www.ncbi.nlm.nih.gov/geo/), and the survival data for GSE6891 were provided by Prof. Peter J. M. Valk. Additionally, BeatAML2.0 dataset 14 (http://vizome.org/aml2/) was screened and analysed as the validation cohort for the risk model.
Clinical characteristics and survival analysis
Patients with CN-AML within the TCGA and GEO datasets were divided into low- and high ME1 expression groups based on the median ME1 expression. Specifically, 79 and 187 patients with CN-AML from TCGA and GSE6891, respectively, were included in the analysis to investigate the association between the ME1 expression and various clinicopathological factors, such as French-American-British (FAB) subtypes and gene mutation. Univariate and multivariate analyses were conducted on event-free survival (EFS) and overall survival (OS) in both CN-AML cohorts to determine the independent prognostic significance for survival. EFS was defined as the time from diagnosis to the first event, encompassing death (any cause), disease progression, relapse and the last follow-up. OS was defined as the time from diagnosis to death (any cause) or the last follow-up.
Construction of a risk model for the OS of patients with CN-AML
After multivariate Cox regression analysis was performed to investigate independent prognostic factors for the OS in patients with CN-AML within the TCGA database, age, the DNMT3A mutation status and ME1 expression were incorporated into the development of a prognostically relevant risk model. Subsequently, a nomogram for OS prediction, integrating these factors, was constructed using the ‘rms’ R package developed by Frank E. Harrell Jr.
Cells culture, antibodies and reagents
THP-1, NB4, Kasumi-1, HL-60 and MOLM-13 cell lines were cultured in RPMI-1640 medium, while MV4-11 cells were maintained in IMDM medium. All media were supplemented with 10% foetal bovine serum (FBS) and 1% penicillin/streptomycin. The cells were incubated in 5% CO2 at 37°C.
The antibodies used in this study included mouse anti-PARP/Cleaved PARP (Proteintech, Chicago, USA, 66520), rabbit anti-caspase 3 p17/p19 (Proteintech, Chicago, USA, 19677), mouse anti-ME1 (Proteintech, Chicago, USA, 68117), rabbit anti-IL6 (Affinity Biosciences, Changzhou, China, 6087), rabbit anti-JAK2 (Affinity Biosciences, Changzhou, China, AF6022), rabbit anti-p-JAK2 (Tyr1007, Affinity Biosciences, Changzhou, China, AF3002), rabbit anti-STAT3 (Affinity Biosciences, Changzhou, China, AF6294), rabbit anti-p-STAT3 (Ser727, Changzhou, China, Affinity Biosciences, AF3294) and mouse anti-β-actin (Proteintech, Chicago, USA, 20526).
Knocking down and overexpressing ME1 gene
Small interfering RNAs (siRNAs) targeting ME1, along with a negative control (si-NC) were synthesized and purchased from GenePharma (Shanghai, China), while plasmids for overexpressing ME1 (OE) and the negative control (NC) were obtained from WZ Bioscience (Shandong, China). The transfection reagent Lipofectamine™ RNAiMAX (Thermo, Waltham, USA, 13778150) and Lipofectamine™ 3000 (Thermo, Waltham, USA, L3000001) were used according to the manufacturer’s instructions to knocking down or overexpressing ME1, respectively. The efficacy of knockdown or overexpression for ME1 gene was assessed after cells with transfection for 48 h.
Cell Counting Kit-8 assay and cell apoptosis analysis
After cells were incubated in a medium containing 10% FBS for 24, 48 and 72 h, 10 μl of Cell Counting Kit-8 (CCK-8) reagent (EnoGene, Nanjing, China, E1CK-000208) was added to each well and incubated for an additional 4 h. The optical density value was then measured at 450 nm absorbance using a Spectromax reader (BIOTEK 800TS, Winooski, USA).
After 48 h of transfection, cells were collected at 2000 rpm, washed once with PBS and stained with Annexin V-PE and 7-AAD solution (Vazyme, Nanjing, China, A213) at room temperature for 10 min, avoiding exposure to light. The percentage of apoptotic cells was assessed using the BD Accuri C6 flow cytometer (BD Biosciences, San Jose, CA, USA).
Real-time quantitative polymerase chain reaction assay
Total RNA was isolated from AML cell lines, and cDNA synthesis was performed according to the manufacturer’s instructions (Thermo, K1622). Real-time quantitative polymerase chain reaction (RT-qPCR) was performed using Bimake™ 2 × SYBR Green qPCR Master Mix (Bimake, B21203). The RT-qPCR primers used in this study were as follows: ME1 forward primers: GGGAGACCTTGGCTGTAATGG, ME1 reverse primers: TTCGGTTCCCACATCCAGAAT; GAPDH forward primers: AATGAAGGGGTCATTGATGG; GAPDH reverse primers: AAGGTGAAGGTCGGAGTCAA. The RT-qPCR experiments were performed with triplicates, and the relative ME1 expression was determined using the 2−ΔΔct method.
Western blotting
Cells were collected and lysed on ice for 30 min with RIPA lysis buffer (Beyotime, Shanghai, China, P0013B) supplemented with protease inhibitors (CWBIO, Beijing, China, CW2200). Phosphorylated proteins were detected with the addition of phosphorylase inhibitors (CWBIO, Beijing, China, CW383). The protein concentration was determined using the BCA protein quantification assay (Beyotime, Shanghai, China, P0012). Subsequently, 40 μg of protein were separated into the SDS-PAGE gels and transferred onto the PVDF membrane, which were then blocked with 5% non-fat milk. The membranes were incubated with the corresponding primary and secondary antibodies. Protein expression was examined using the chemiluminescence method with the Super ECL Plus kit (Abbkine, Wuhan, China, BMU102), and images were captured using the image analysis system (VILBER FUSION-SOLO.6S, Marne-la-Vallée, France).
Gene set enrichment analysis
Functional enrichment analysis comparing the low- and high ME1 expression groups was conducted using the GSEA 4.2.2 software (Broad Institute of MIT and Harvard, Cambridge, Massachusetts, USA). Significance in enrichment was established with a normal p value (NOR) <0.05 and a false discovery rate (FDR) q value of <2.5.
Statistics
The R software (v4.1.3) (R Core Team, Vienna, Austria) was employed to establish a risk model, while statistical analysis was performed using SPSS 24.0 software (IBM Corporation, Armonk, New York, USA). For comparing clinicopathological factors between groups, nonparametric tests or chi-square tests were applied based on the data types. Survival analysis for OS and EFS used Kaplan–Meier and univariate and multivariate Cox analyses. Statistical significance was set at p < 0.05.
Results
Clinicopathological characteristics of patients with CN-AML in the TCGA and GEO datasets
The 79 patients with CN-AML from the TCGA database were divided into two groups based on ME1 expression levels, and various clinicopathological characteristics were analysed. In parallel, we conducted similar analyses for 187 CN-AML patients from the GSE6891 dataset. In TCGA database, parameters such as sex, age, race, white blood cell count, bone marrow blasts, FAB subtype and several recurrent gene mutations in AML did not show significant differences between the two groups (Supplemental Table S1). Meanwhile, in GSE6891 dataset, patients in the high ME1 group exhibited a higher prevalence of FMS-like tyrosine kinase 3 internal tandem duplication (FLT3-ITD) gene mutation and a lower incidence of CCAAT/enhancer-binding protein alpha (CEBPα) gene with double mutation (Supplemental Table S2). We summarized the significant clinical characteristics derived from the TCGA database and the GSE6891 dataset in Table 1. In the TCGA cohort, a higher proportion of patients with EFS exceeding 2 and 3 years, as well as OS exceeding 2 and 3 years, were observed in the low ME1 expression group. Similarly, in the GSE6891 dataset, patients with EFS and OS greater than 1, 2 and 3 years were more prevalent in the low ME1 expression group. Kaplan–Meier survival analyses were conducted based on ME1 expression levels in these datasets. Patients in the TCGA cohort with low ME1 expression demonstrated significantly improved EFS (Figure 1(a)) and OS (Figure 1(c)), with similar trends observed in the GSE6891 dataset (Figure 1(b) and (d)). Additionally, CN-AML patients with high ME1 expression in the GSE71014 and GSE12417 datasets also exhibited a shorter OS (Figure 1(e) and (f)). In summary, the above results suggest an association between ME1 expression and the prognosis of patients with CN-AML.
Significant clinical characteristics of patients with CN-AML from TCGA database and GSE6891 between ME1Low and ME1High group.

CN-AML, cytogenetically normal acute myeloid leukaemia; EFS, event-free survival; FAB, French-American-British subtypes; ME1, malic enzyme 1; OS, overall survival; TCGA, The Cancer Genome Atlas.
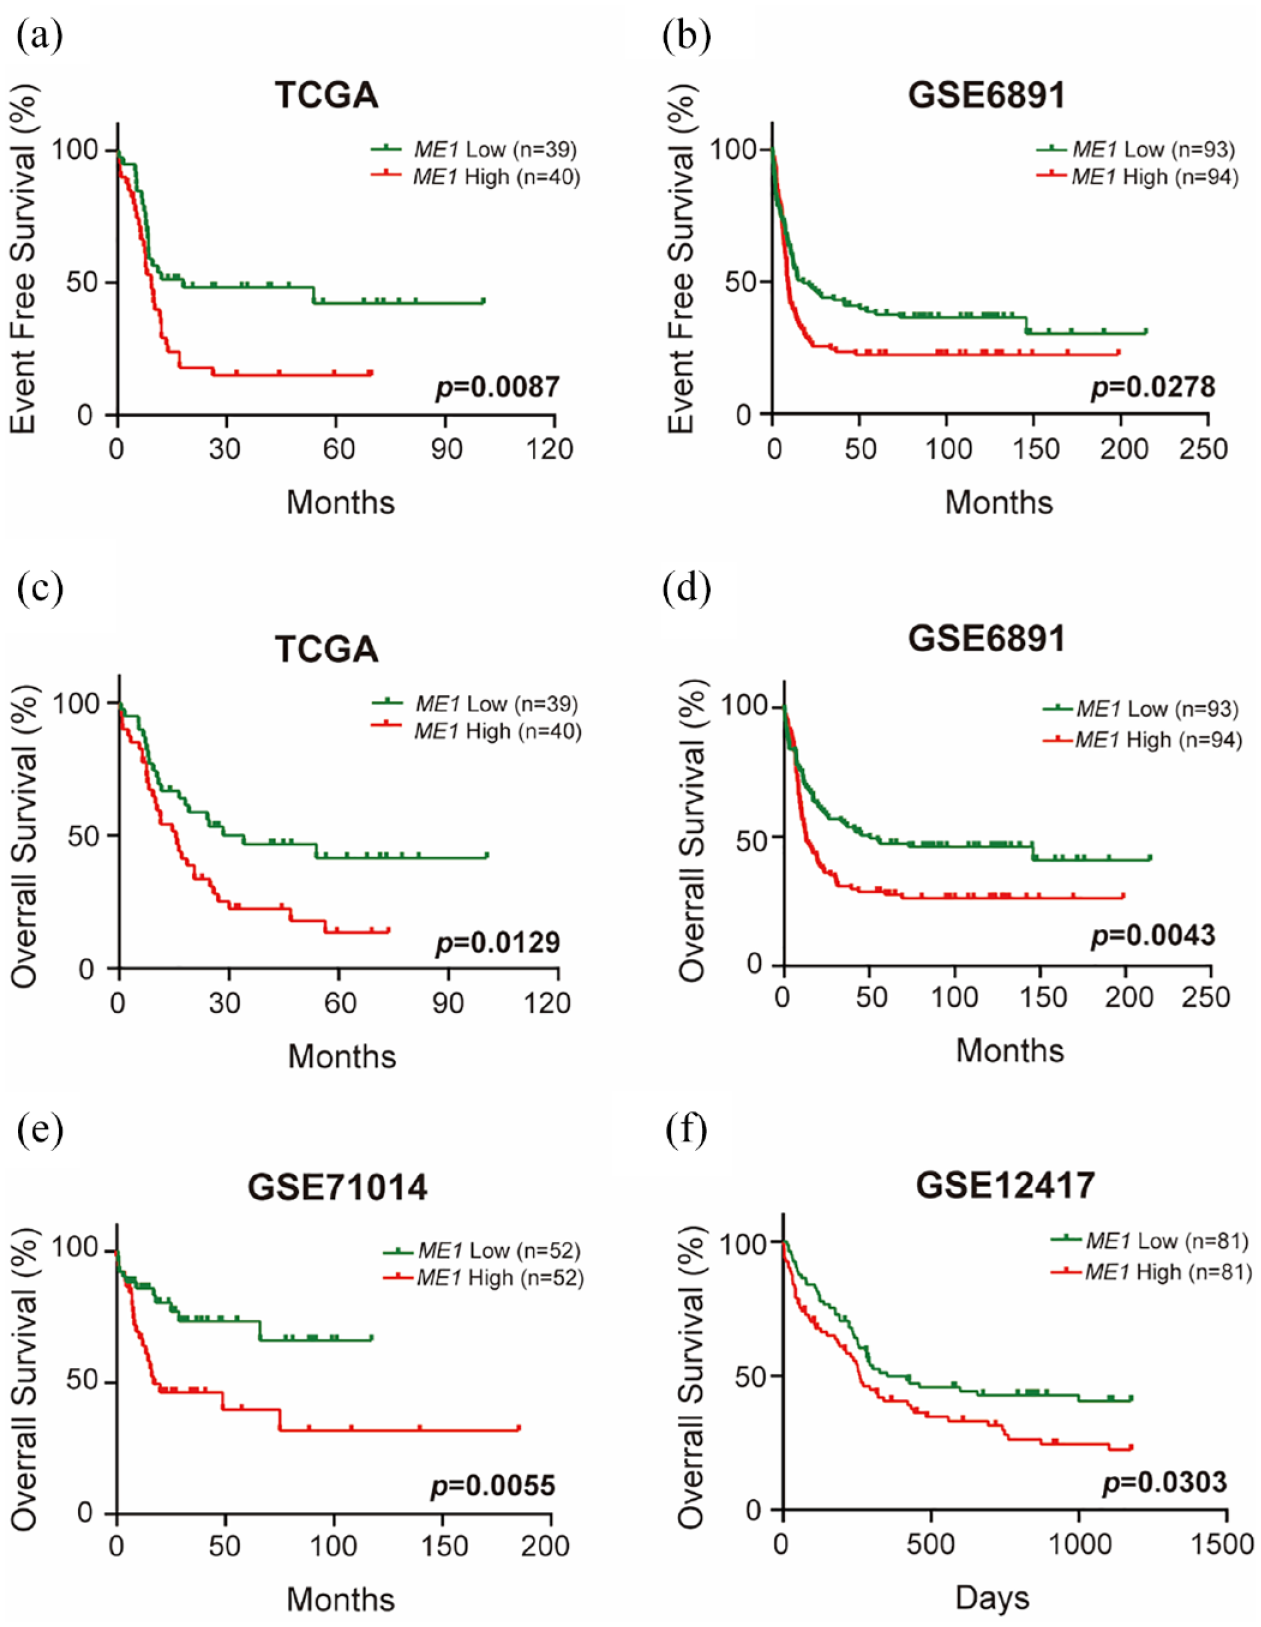
High ME1 expression is associated with worse survival in patients with CN-AML. (a) EFS analysis based on ME1 expression in patients with CN-AML from TCGA database. (b) EFS analysis based on ME1 expression in patients with CN-AML from GSE6891 dataset. (c) OS analysis based on ME1 expression in patients with CN-AML from the TCGA database. (d) OS analysis based on ME1 expression in patients with CN-AML from the GSE6891 dataset. (e) OS analysis based on ME1 expression in patients with CN-AML from the GSE71014 dataset. (f) OS analysis based on ME1 expression in patients with CN-AML from the GSE12417 dataset.
ME1 is an independent predictor for the EFS and OS in patients with CN-AML
To assess the effect of various factors on EFS and OS in patients with CN-AML, univariate Cox regression analysis was performed based on the clinicopathological factors and ME1 expression data from the TCGA database (Supplemental Table S3). In the TCGA database, patients with high ME1 expression (hazard ratio (HR): 2.390, 95% confidence interval (CI): 1.329–4.295, p = 0.004), DNMT3A mutation (HR: 2.186, 95% CI: 1.216–3.929, p = 0.009) and FLT3-ITD mutation (HR: 2.040, 95% CI: 1.119–3.721, p = 0.020) exhibited worse EFS. Meanwhile, patients aged ⩾60 years (HR: 1.989, 95% CI: 1.143–3.462, p = 0.015) and those with high ME1 expression (HR: 1.972, 95% CI: 1.143–3.401, p = 0.015) exhibited notably poorer OS. Subsequently, multivariate Cox regression analysis was conducted in the TCGA database, including age, the DNMT3A mutation status and ME1 expression (Table 2). The results indicated that CN-AML patients with DNMT3A mutation and high ME1 expression had a significantly worse EFS (HR: 2.509, 95% CI: 1.280–4.919, p = 0.007; HR: 2.010, 95% CI: 1.095–3.691, p = 0.024). Moreover, patients aged ⩾60 years, those with DNMT3A mutation, and those with high ME1 expression had unfavourable OS outcomes (HR: 2.169, 95% CI: 1.163–4.043, p = 0.015; HR: 1.945, 95% CI: 1.073–3.525, p = 0.028; HR: 1.823, 95% CI: 1.030–3.228, p = 0.039). Although patients with CN-AML in GSE6891 dataset are all younger than 60 years old, results of multivariate Cox regression analysis also revealed the independently prognostic role of ME1.These findings underscore the independent predictive significance of ME1 for EFS and OS in patients with CN-AML.
Multivariate analysis of EFS and OS for patients with CN-AML from TCGA database and GSE6891 dataset.

CI, confidence interval; CN-AML, cytogenetically normal acute myeloid leukaemia; EFS, event-free survival; HR, hazard ratio; ME1, malic enzyme 1; NA, not available; OS, overall survival; TCGA, The Cancer Genome Atlas. Bold font means stastical significance.
A novel risk model based on the ME1 expression exhibits good predictive power for OS in patients with CN-AML
Based on the outcomes of multivariate Cox regression analysis, a novel risk model for predicting OS in CN-AML patients using data from the TCGA database was developed. The risk model incorporated age (<60 years old or not), the DNMT3A status (yes or no) and ME1 expression (low or high), along with OS time and survival status. The resulting concordance index (C-index) of our model was 0.680 with a 95% CI of 0.610–0.751 (p < 0.001). A nomogram illustrating 1-, 3- and 5-year OS was constructed (Figure 2(a)). Employing this novel risk model, the 79 patients with CN-AML in the TCGA database were divided into low- and high-risk groups, revealing a significantly worse outcome in the high-risk group (HR: 2.670, 95% CI: 1.54–4.65, p < 0.001; Figure 2(b)). Additionally, the 1-, 3- and 5-year receiver operating characteristic (ROC) curves and area under the curve (AUC) values were used to assess the sensitivity and specificity of the model (Figure 2(c)). To validate the risk model, we utilized the BeatAML2.0 dataset (OHSU, Portland, Oregon, USA) as the validation cohort. A total of 70 newly diagnosed CN-AML patients were finally included in the analysis. The results of Kaplan–Meier survival analysis (Supplemental Figure S2A) and the ROC analysis (Supplemental Figure S2B) suggest that our risk model performs well.

A novel risk model for the OS of patients with CN-AML based on TCGA database. (a) Nomogram that integrated clinical factors and ME1 expression predicted the probability of the 1-, 3- and 5-year OS of patients with CN-AML from TCGA database. (b) Kaplan–Meier survival analysis of the OS for patients with CN-AML belonging to the low- and high-risk groups. (c) The sensitivity and specificity of the novel risk model for patients with CN-AML were assessed using the 1-, 3- and 5-year ROC curves and AUC values.
ME1 knockdown inhibits proliferation and induces apoptosis in AML cell lines
To explore the functional role of ME1 in AML, ME1 expression in several AML cell lines was initially examined. The RT-qPCR results indicated a relatively higher expression of ME1 in NB4 and THP-1 cells. In contrast, MV4-11 cells exhibited the lowest ME1 expression (Supplemental Figure S1). Therefore, siRNAs were used to knock down the ME1 gene in NB4 and THP-1 cells, while MV4-11 cell line was utilized to overexpress ME1 gene. The knockdown efficiency confirmed by RT-qPCR (Figure 3(a)) and Western blotting (Figure 3(b)). Notably, for subsequent experiments, siRNA2 (Si2) and siRNA3 (Si3) targeting ME1 were selected.
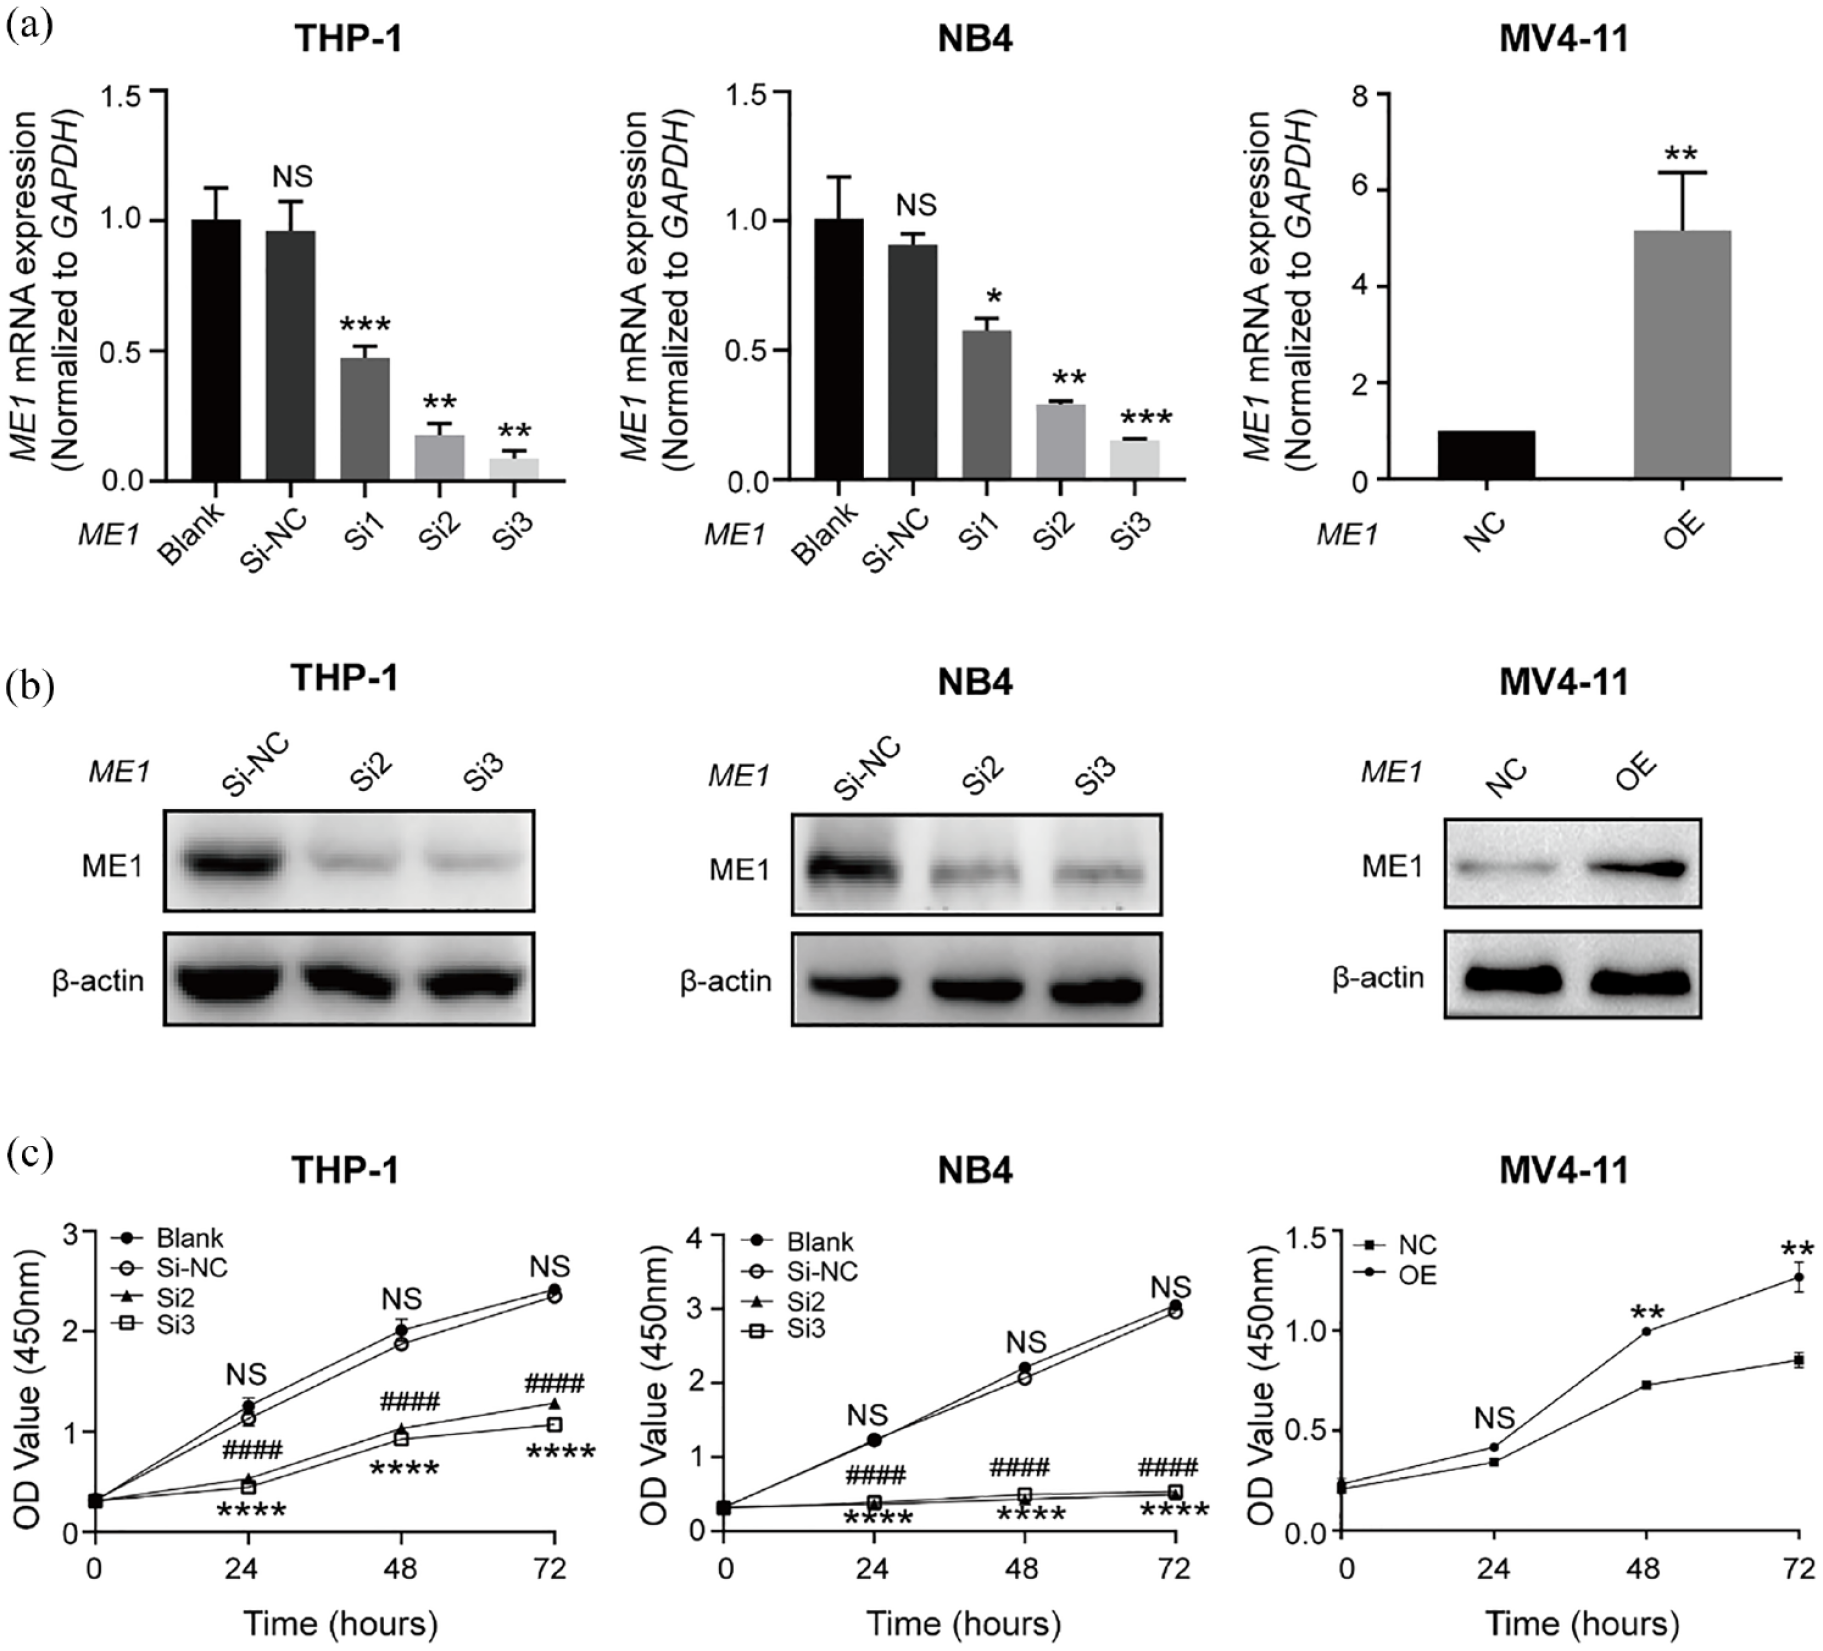
Knockdown of ME1 inhibits proliferation of AML cells. (a) RT-qPCR to analyse the ME1 mRNA expression after the transfection with specific siRNAs or overexpression plasmid. (b) Western blotting to detect ME1 protein expression after the transfection with specific siRNAs or overexpression plasmid. (c) CCK-8 assay was performed to investigate cells proliferation after ME1 knockdown or overexpression for 24, 48 and 72 h. **p < 0.01, ****p and ####p < 0.001.
Cell viability, assessed by the CCK-8 assay, revealed that ME1 knockdown significantly inhibited the proliferation of THP-1 and NB4 cells, while overexpression of ME1 significantly promoted the proliferation of MV4-11 cells (Figure 3(c)). Flow cytometry analysis of apoptosis demonstrated a substantial induction of apoptosis in THP-1 and NB4 cells (Figure 4(a) and (b)). Apoptosis-related proteins were assessed by Western blotting after transfection of AML cells with siRNAs targeting ME1 for 48 h (Figure 4(c)). Notably, MV4-11 cells transfected with a negative control plasmid (NC) did not exhibit significant apoptosis, and overexpression of ME1 only resulted in a slight decrease in apoptosis (Figure 4(a) and (b)). Accordingly, the levels of apoptosis-related proteins in MV4-11 cells did not show significant changes (Figure 4(c)). Overall, these results confirm the role of ME1 in regulating proliferation and apoptosis in AML cells.
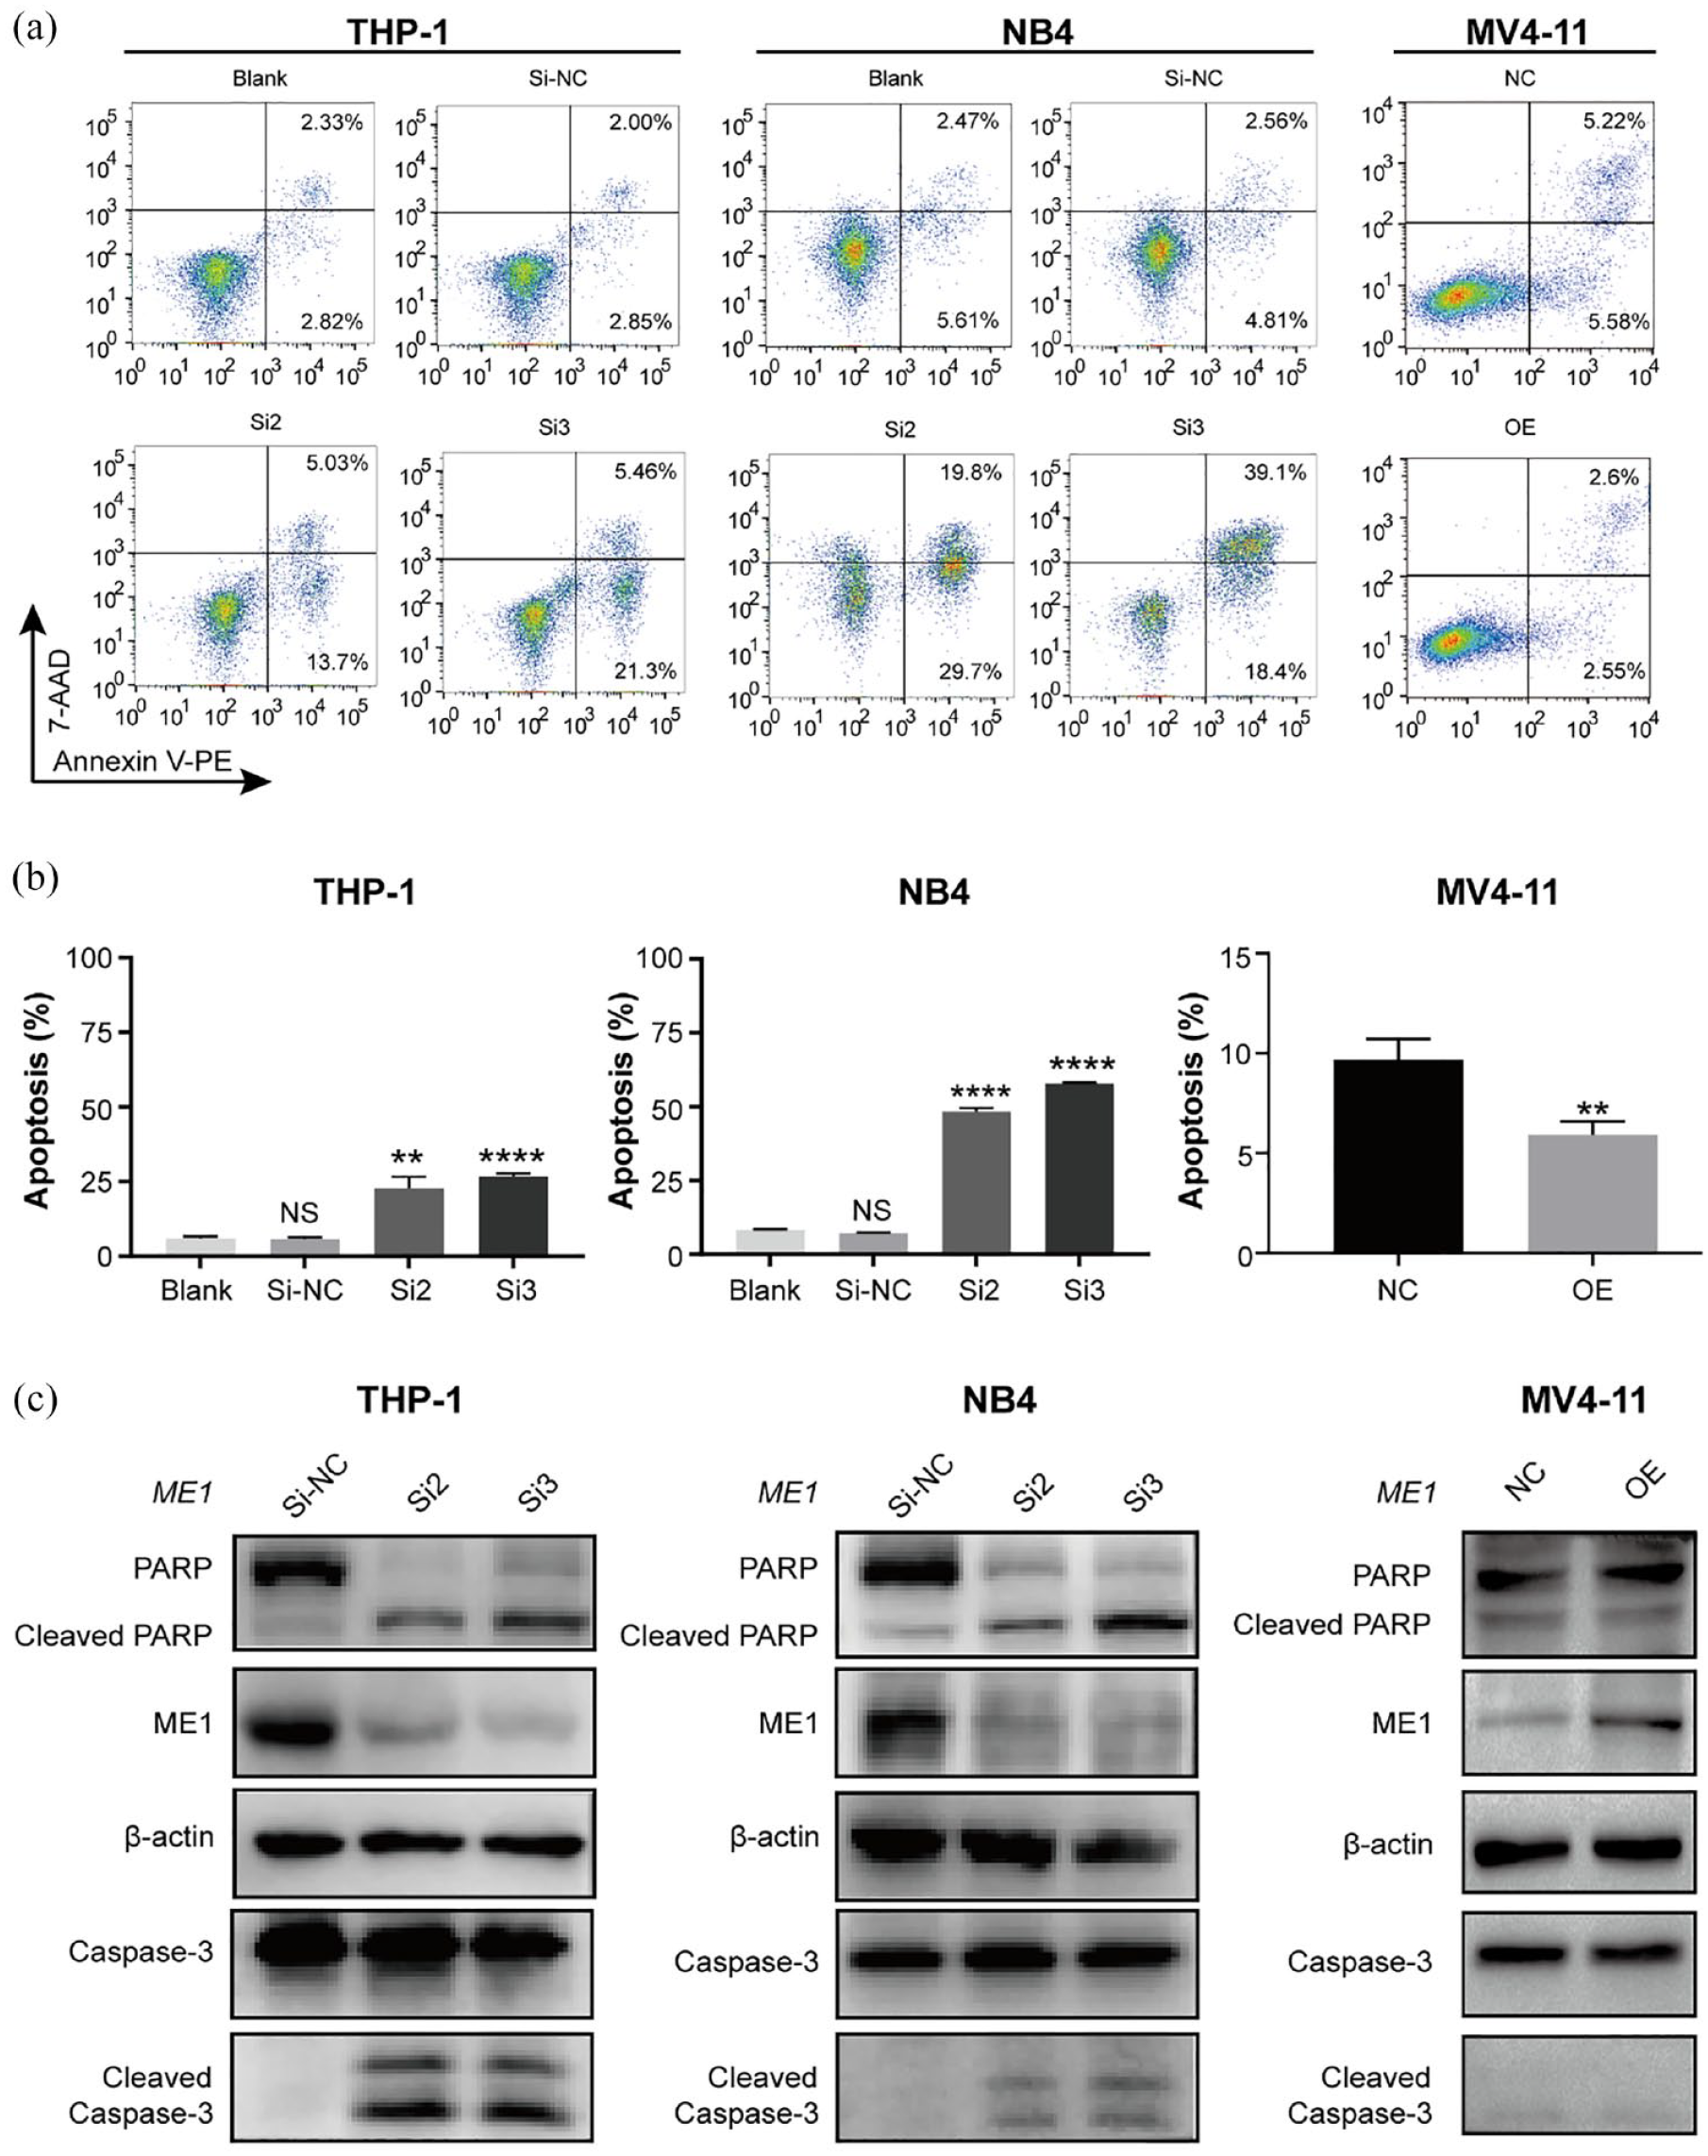
Knockdown of ME1 induces significant apoptosis in AML cells. (a, b) Apoptosis was analysed using flow cytometry after ME1 knockdown or overexpression for 48 h in AML cells. (c) Western blotting to detect the expression of apoptosis-related proteins after ME1 knockdown or overexpression in AML cells. **p < 0.01, ****p < 0.001.
IL-6/JAK2/STAT3 pathway is involved in the high expression of ME1
To gain a deeper understanding of the underlying mechanism of the ME1 gene in CN-AML, 79 and 187 patients with CN-AML from the TCGA and GSE6891 datasets were categorised into two groups based on the ME1 expression, respectively. Subsequently, several hallmark gene sets were identified in the ME1 high-expression group, with the top 10 from the TCGA and GSE6891 datasets shown in Figure 5(a). Notably, the IL-6_JAK_STAT3_SIGNALLING gene set was significantly enriched both in the TCGA database (normalised enrichment score (NES) = 1.848, p = 0.002, FDR = 0.074) and the GSE6891 dataset (NES = 1.585, p = 0.004, FDR = 0.043; Figure 5(b)).

ME1 regulates the IL-6/JAK2/STAT3 pathway in AML cells. (a) GSEA for CN-AML patients with high ME1 expression in TCGA database and GSE6891 dataset. (b) IL-6/JAK/STAT3 signaling is enriched in the TCGA database and GSE6891 dataset. (c) Western blotting to investigate the effect of ME1 silencing or overexpression on the IL-6/JAK2/STAT3 pathway in AML cells. (d) THP-1 cells with or without ME1 knockdown treated with exogenous IL-6 and the IL-6/JAK2/STAT3 pathway were detected by Western blotting.
To validate the gene set enrichment analysis (GSEA), we first analysed the correlation between ME1 and IL6 expression in 151 AML patients from the TCGA database and found a moderate correlation (R = 0.347, p < 0.05). Further analysis of the CN-AML subgroup showed that ME1 and IL6 maintained a moderate correlation (R = 0.464, p < 0.05; Supplemental Figure S4). Next, RT-qPCR and Western blotting assays were performed in THP-1, NB4 and MV4-11 cells. RT-qPCR showed that reducing ME1 expression decreases IL6 mRNA levels, while increasing ME1 expression raises IL6 mRNA levels (Supplemental Figure S5). The result of Western blotting revealed that ME1 knockdown significantly decreased IL-6, p-JAK2 and p-STAT3 levels. In contrast, overexpressing ME1 led to an increase in these proteins (Figure 5(c)). Furthermore, exogenous IL-6 into THP-1 cells with or without ME1 knockdown were introduced to confirm the regulatory relationship between ME1 and the IL-6/JAK2/STAT3 pathway (Figure 5(d)). In brief, in the negative control groups (NC), adding exogenous IL-6 activated the IL-6/JAK2/STAT3 pathway, while ME1 expression remained largely unchanged, suggesting that IL-6/JAK2/STAT3 pathway does not regulate ME1 expression. In the ME1 knockdown groups (siRNA-ME1), silencing ME1 significantly reduced the activity of the IL-6/JAK2/STAT3 pathway. When IL-6 was added to the ME1 knockdown cells (siRNA-ME1 + IL-6), the pathway activity was partially restored, but ME1 expression remained unchanged. These findings indicate that ME1 serves as an upstream regulator in the IL-6/JAK2/STAT3 pathway. Meanwhile, we knocked down ME1 and added IL-6 in THP-1 cells and observed that the addition of IL-6 could rescue the effects of ME1 knockdown, further validating that ME1 regulates proliferation (Supplemental Figure S3A) and apoptosis (Supplemental Figure S3B) through the IL-6/JAK2/STAT3 pathway.
Discussion
Research on CN-AML has gained considerable attention due to the heterogeneity of these patients. By using public databases, several potential genes with prognostic or therapeutic significance in CN-AML have been identified. In this study, univariate and multivariate Cox regression analyses were conducted to demonstrate the independent prognostic role of the ME1 gene in patients with CN-AML across the TCGA database and three independent GEO datasets. Notably, while the GSE71014 dataset primarily comprises Asians, 15 the three other cohorts (TCGA and two GEO datasets) predominantly comprise Europeans, suggesting the universal applicability of ME1 as a prognostic marker in patients with CN-AML.
Furthermore, prognostic models incorporating gene signatures have been developed to enhance risk stratification in patients with CN-AML.16–20 Herein, a novel prognostic risk model for OS in patients with CN-AML was constructed based on ME1 gene expression. The prognosis-related risk model incorporated age, the DNMT3A mutation status and ME1 expression. In this study, we used the C-index to assess the difference between the predicted and actual values of the COX model in survival analysis. This metric is commonly employed to evaluate the predictive accuracy of patient prognosis models. Generally, a C-index value between 0.5 and 0.7 reflects lower accuracy, whereas a value exceeding 0.9 signifies higher accuracy, thereby providing a clearer context for our findings.21,22 Our C-index result was 0.680, with a 95% CI of 0.610–0.751 (p < 0.001), suggesting that the model has a reasonable accuracy for predicting OS in patients with CN-AML. Additionally, validation through the construction of the AUC-ROC survival model further confirmed the significance of ME1 expression as a crucial variable in predicting the survival prognosis of CN-AML, establishing its role as a robust predictor of OS in patients with CN-AML.
Several studies have documented ME1 as a pro-oncogenic gene across various cancer types. Suppression of ME1 gene expression has been associated with decreased proliferation, epithelial-to-mesenchymal transition and migration while promoting oxidative stress and apoptosis in tumour cells.10,23,24 Inhibitors targeting ME1 have been designed, demonstrating the ability to inhibit the growth of human colorectal cancer cells in vitro.25,26 Notably, a recent discovery identified a highly selective small-molecule inhibitor of ME1, AS1134900, providing compelling evidence for the potential of drug targeting ME1 in cancer. 27 Despite previous studies highlighting novel potential markers in CN-AML, few have delved into the underlying molecular mechanisms of these prognostic genes. 3 In this study, ME1 knockdown induced the inhibition of proliferation and apoptosis in AML cell lines. Additionally, GSEA based on ME1 expression in TCGA and GSE6891 revealed a significant enrichment of the IL-6/JAK/STAT3 signature. The IL-6/JAK/STAT3 pathway plays a crucial role in the growth and development of various human cancers, including AML, with its activation leading to downstream target genes such as cyclin D1 and B-cell lymphoma-extra-large (BCL-xL), promoting tumour proliferation and survival.28,29 Consistent with GSEA results, downregulation of IL-6, p-JAK2 and p-STAT3 after ME1 silencing was observed, whereas overexpressing ME1 increased the levels of these proteins. Notably, the use of exogenous IL-6 rescued the effects of ME1 silencing, confirming the regulatory role of ME1 on the IL-6/JAK2/STAT3 pathway.
While this study revealed important discoveries, it has some limitations. First, analyses for patients with CN-AML in the datasets were grouped based on the median expression of the ME1 gene without absolute cut points. Second, due to the challenges in tracking patients with CN-AML and the limited sample size, the ME1 expression was not examined and long-term follow-up for patients with CN-AML in the real-world setting was not conducted. Further, larger studies are warranted to establish a standardised method for quantifying ME1 expression and validating its prognostic role in patients with CN-AML.
Conclusion
The prognostic significance and functional mechanism of the ME1 gene in patients with CN-AML was first explored, offering evidence that ME1 could serve as a potential therapeutic target for individuals with CN-AML.
Supplemental Material
sj-docx-1-tah-10.1177_20406207241301948 – Supplemental material for High expression of malic enzyme 1 predicts adverse prognosis in patients with cytogenetically normal acute myeloid leukaemia and promotes leukaemogenesis through the IL-6/JAK2/STAT3 pathways
Supplemental material, sj-docx-1-tah-10.1177_20406207241301948 for High expression of malic enzyme 1 predicts adverse prognosis in patients with cytogenetically normal acute myeloid leukaemia and promotes leukaemogenesis through the IL-6/JAK2/STAT3 pathways by Chang Zhang, Wenlu Li, Fei Wu, Zhongwei Lu, Piaorong Zeng, Zeyu Luo, Yixiong Cao, Feng Wen, Junjun Li, Xi Chen and Fujue Wang in Therapeutic Advances in Hematology
Footnotes
Acknowledgements
We thank Prof. Peter J. M. Valk and for providing survival data of the GSE6891 dataset and members working for the TCGA-AML group. We also thank Bullet Edits Limited for the linguistic editing and proofreading of the manuscript.
Declarations
Supplemental material
Supplemental material for this article is available online.
References
Supplementary Material
Please find the following supplemental material available below.
For Open Access articles published under a Creative Commons License, all supplemental material carries the same license as the article it is associated with.
For non-Open Access articles published, all supplemental material carries a non-exclusive license, and permission requests for re-use of supplemental material or any part of supplemental material shall be sent directly to the copyright owner as specified in the copyright notice associated with the article.