
Abstract
Background:
Erythropoiesis stimulating agents (ESAs) are the first-line therapy in patients with lower-risk myelodysplastic syndromes (LR-MDS). Some predictive factors for ESAs response have been identified. Type and number of somatic mutations have been associated with prognosis and response to therapies in MDS patients.
Objectives:
The objective was to evaluate the outcomes after ESAs in patients with LR-MDS and to address the potential predictive value of somatic mutations in ESAs-treated patients.
Design:
Multi-center retrospective study of a cohort of 722 patients with LR-MDS included in the SPRESAS (Spanish Registry of Erythropoietic Stimulating Agents Study) study. Retrospective analysis of 65 patients with next generation sequencing (NGS) data from diagnosis.
Methods:
ESAs’ efficacy and safety were evaluated in patients receiving ESAs and best supportive care (BSC). To assess the potential prognostic value of somatic mutations in erythroid response (ER) rate and outcome, NGS was performed in responders and non-responders.
Results:
ER rate for ESAs-treated patients was 65%. Serum erythropoietin (EPO) level <200 U/l was the only variable significantly associated with a higher ER rate (odds ratio, 2.45; p = 0.036). Median overall survival (OS) in patients treated with ESAs was 6.7 versus 3.1 years in patients receiving BSC (p < 0.001). From 65 patients with NGS data, 57 (87.7%) have at least one mutation. We observed a trend to a higher frequency of ER among patients with a lower number of mutated genes (40.4% in <3 mutated genes versus 22.2% in ⩾3; p = 0.170). The presence of ⩾3 mutated genes was also significantly associated with worse OS (hazard ratio, 2.8; p = 0.015), even in responders. A higher cumulative incidence of acute myeloid leukemia progression at 5 years was also observed in patients with ⩾3 mutated genes versus <3 (33.3% and 10.7%, respectively; p < 0.001).
Conclusion:
This large study confirms the beneficial effect of ESAs and the adverse effect of somatic mutations in patients with LR-MDS.
Keywords
Background
Lower-risk myelodysplastic syndromes (LR-MDS) patients usually present with cytopenias (mainly anemia), and absence of excess blasts or poor prognosis cytogenetic abnormalities. These patients have a substantially longer overall survival (OS) than higher-risk MDS (HR-MDS),1,2 but their expectancy and quality of life are compromised by the severity of anemia and the need of red blood cell (RBC) transfusions, with the consequent risk of iron overload, alloimmunization, and cardiovascular disease.
Most patients with LR-MDS and symptomatic anemia receive erythropoiesis stimulating agents (ESAs) as first line treatment. However, the probability of erythroid response (ER) and its duration are highly variable. Predictive factors for ESAs response include serum erythropoietin (EPO) level, severity of RBC transfusion dependency (RBC-TD), and International Prognostic Scoring System (IPSS)/IPSS Revised (IPSS-R) score.3–7 The absence of ER and a shorter duration of response have been associated with poor OS and higher risk of acute myeloid leukemia (AML) transformation. 8 Apart from lenalidomide in patients with deletion 5q or luspatercept in MDS with ring sideroblasts and SF3B1 mutations, no alternative treatment for most anemic LR-MDS patients refractory or intolerant to ESAs has been approved by regulatory agencies.
Several somatic mutations have been associated with poor prognosis in LR-MDS, like TP53, SRSF2, RUNX1, ASXL1, EZH2, or NRAS mutations, while only isolated SF3B1 mutations have been clearly associated with a good prognosis.9–12 Also, the presence of somatic mutations could influence the response to therapies in MDS patients.12–21 The main purposes of this study were to evaluate the outcomes after ESAs and to compare them with those obtained with the best supportive care (BSC) in a large series of anemic patients with LR-MDS from the Spanish group of MDS (GESMD), and to address the potential predictive value of somatic mutations in ESAs-treated patients.
Design
From April to December 2013, 959 patients with MDS from the RESMD (Spanish Registry of MDS) were included in the SPRESAS (Spanish Registry of Erythropoietic Stimulating Agents Study) study. Patients should have (1) de novo MDS, (2) hemoglobin level <11 g/dl, (3) lower-risk according to the IPSS (low and intermediate-1), (4) not have received any disease modifying treatment, (5) be diagnosed before December 2011, and (6) have sufficient available data. In total, 237 cases were excluded from the study (23 treated with disease modifying agents, 38 with secondary MDS, 21 with IPSS > intermediate-1 risk, 97 with hemoglobin level >11 g/dl, 31 diagnosed after December 2011, 3 progressing to HR-MDS, and 24 with incomplete data). The 722 remaining patients constituted the subject of this study (Table 1). The primary endpoint was to evaluate the efficacy of ESAs (ER rate, ER duration, OS length, and cumulative incidence of AML transformation). Second endpoints were to address the safety of ESAs treatment and to determinate the potential influence of somatic mutations on outcomes in ESAs-treated patients.
Main characteristics of ESA and BSC patients in SPRESAS study.

CMML, chronic myelomonocytic leukemia; ECOG, Eastern Cooperative Oncology Group; ESA, erythropoietic stimulating agents; IPSS, international prognostic scoring system; IPSS-R, IPSS revised; MDS-U, myelodysplastic syndrome unclassifiable; MDS/MPN, myelodysplastic syndrome/myeloproliferative neoplasm; NOS, not otherwise specified; RAEB, refractory anemia with excess blasts; RARS, refractory anemia with ringed sideroblasts; RCMD, refractory cytopenia with multilineage dysplasia; RCUD, refractory cytopenia with unilineage dysplasia; SC, supportive care; SPRESAS, Spanish Registry of Erythropoietic Stimulating Agents Study.
We also retrospectively analyzed data from 65 patients treated with ESAs from five participating centers and diagnosed between 1997 and 2011. Date of last follow-up was updated to August 2019. Only patients with at least 12 months of ER duration and non-responders were included in the analysis, based on the results of a prior study demonstrating similar outcomes between non-responders and responders with a shorter ER duration. 8
Methods
Definitions
ER rate was defined according to the International Working Group 2006 criteria. 22 OS was calculated from date of diagnosis to date of death from any cause or last follow up for living patients. Transformation to AML was defined as the presence of ⩾20% of blast in bone marrow (BM) or peripheral blood.
Mutations sub-analysis
We selected genomic DNA from BM mononucleated cells at diagnosis; only in one case we used peripheral blood. DNA extraction was performed with QIAgen (Qiagen©, Venlo, Netherlands) and quantification by fluorometry with Qubit 2.0 (Life Technologies©, Carlsbad, CA, USA). Detection of somatic mutations was performed by next generation sequencing (NGS), using a capture sequencing strategy with MiSeq platform (Illumina©, San Diego, CA, USA) and a 117 myeloid genes panel (Table 2) designed with DesignStudio software (Illumina©) using 3259 probes targeting 1740 regions, including exons, splicing regions, and UTR 3′/5′ regions. Only those variants located in exonic or splicing regions that cause a change in the protein sequence were considered; polymorphisms, defined as variants with a minor allele frequency in the healthy people higher than 1%, were also excluded.
117 genes NGS panel used in the study.

NGS, next generation sequencing.
Sequencing was performed in two steps: first, capture and enrichment using a Nextera Rapid Capture Enrichment Custom methodology, starting from 50 ng of DNA from each sample; and second, generating clusters and sequencing with the MiSeq platform, using a 300 cycles reagent kit (obtaining an average coverage of 500–600 lectures). Minimum median coverage of sequenced exons was 50–100 reads with more than 10–20 mutated reads. IGV software (Broad Institute©, Cambridge, MA, USA) was used for the variant analysis. All variants were aligned with the reference genome (GRCh37/hg19). Variant calling and annotation were performed with VarScan (v2.4) (McDonnell Genome Institute, St. Louis, MO, USA), SAMTools v1.3.1 (Genome Research Limited, Hinxton, Saffron Walden, UK), and ANNOVAR (Center for Applied Genomics, Philadelphia, PA, USA). We used databases COSMIC and ClinVar and predictors SIFT, PolyPhen-2, and Mutation Taster to evaluate the oncogenic potential of variants. Variants with a variant allele frequency (VAF) <5% were validated re-sequencing amplicons with GS-Junior (Roche©, Basel, Switzerland) and those with a VAF >5% with Sanger method.
Statistical analysis
Comparisons of proportions and ranks in different variables were made with the Chi-square test and Fisher’s exact test. OS was analyzed by the Kaplan–Meier method and curves were compared by the log-rank test. A Cox multivariable model was used to adjust for clinical characteristics. For SPRESAS study, a landmark analysis was performed. Patients in the BSC arm were censored if they died before day 100 from diagnosis (the median time to ESAs treatment onset in our series). The cumulative incidence of AML progression (CI of AML) was calculated using competing risks and compared using the Gray test. A two-side 0.05 p value was considered as statistically significant. Calculations were performed using R (v3.1.1) (The R Foundation for Statistical Computing, Vienna, Austria), IBM SPSS v20.0 and v25.0 (IBM Corporation©, Armonk, NY, USA), and Xlstat version 2018.6 (Microsoft Corporation©, Redmond, WA, USA) statistical packages.
Equator network guideline accordance
This paper is in accordance with the Strengthening the Reporting of Observational Studies in Epidemiology statement 23 (Supplemental Material).
Results
SPRESAS study
Patients and disease characteristics
From the entire cohort of 722 patients, 530 were treated with ESAs and 192 managed only with BSC. Median follow up was 2.9 years (range, 0.02–25.5), 3.1 years for ESAs-treated group, and 2.4 years for BSC group (p = 0.002). Median age at diagnosis was 76 years (range, 19–101). Patients and disease characteristics from SPRESAS study are summarized in Table 1.
Outcome
ER in ESAs-treated patients
Data on ER were available in 478 patients, of whom 310 (64.8%) responded, with a median ER duration of 1.8 years (range, 0.23–10.4) in the 284 patients with ER duration available. Two-hundred sixty-five (93%) and 213 (75%) sustained the response at 6 and 12 months, respectively. No differences in ER rate and ER duration were observed among ESAs compounds: darbepoetin (n = 243), epoetin α (n = 24), epoetin β (n = 75), and others (n = 15). ER was similar in patients with serum EPO level <100 U/l (67.9%) and <200 U/l (66.6%).
Serum EPO level <200 U/l was the only variable independently associated with a higher ER rate in the multivariable analysis [odds ratio, 2.45; 95% confidence interval (CI): 1.06–5.64; p = 0.036] (Table 3).
Univariable and multivariable analysis for erythroid response (SPRESAS study).
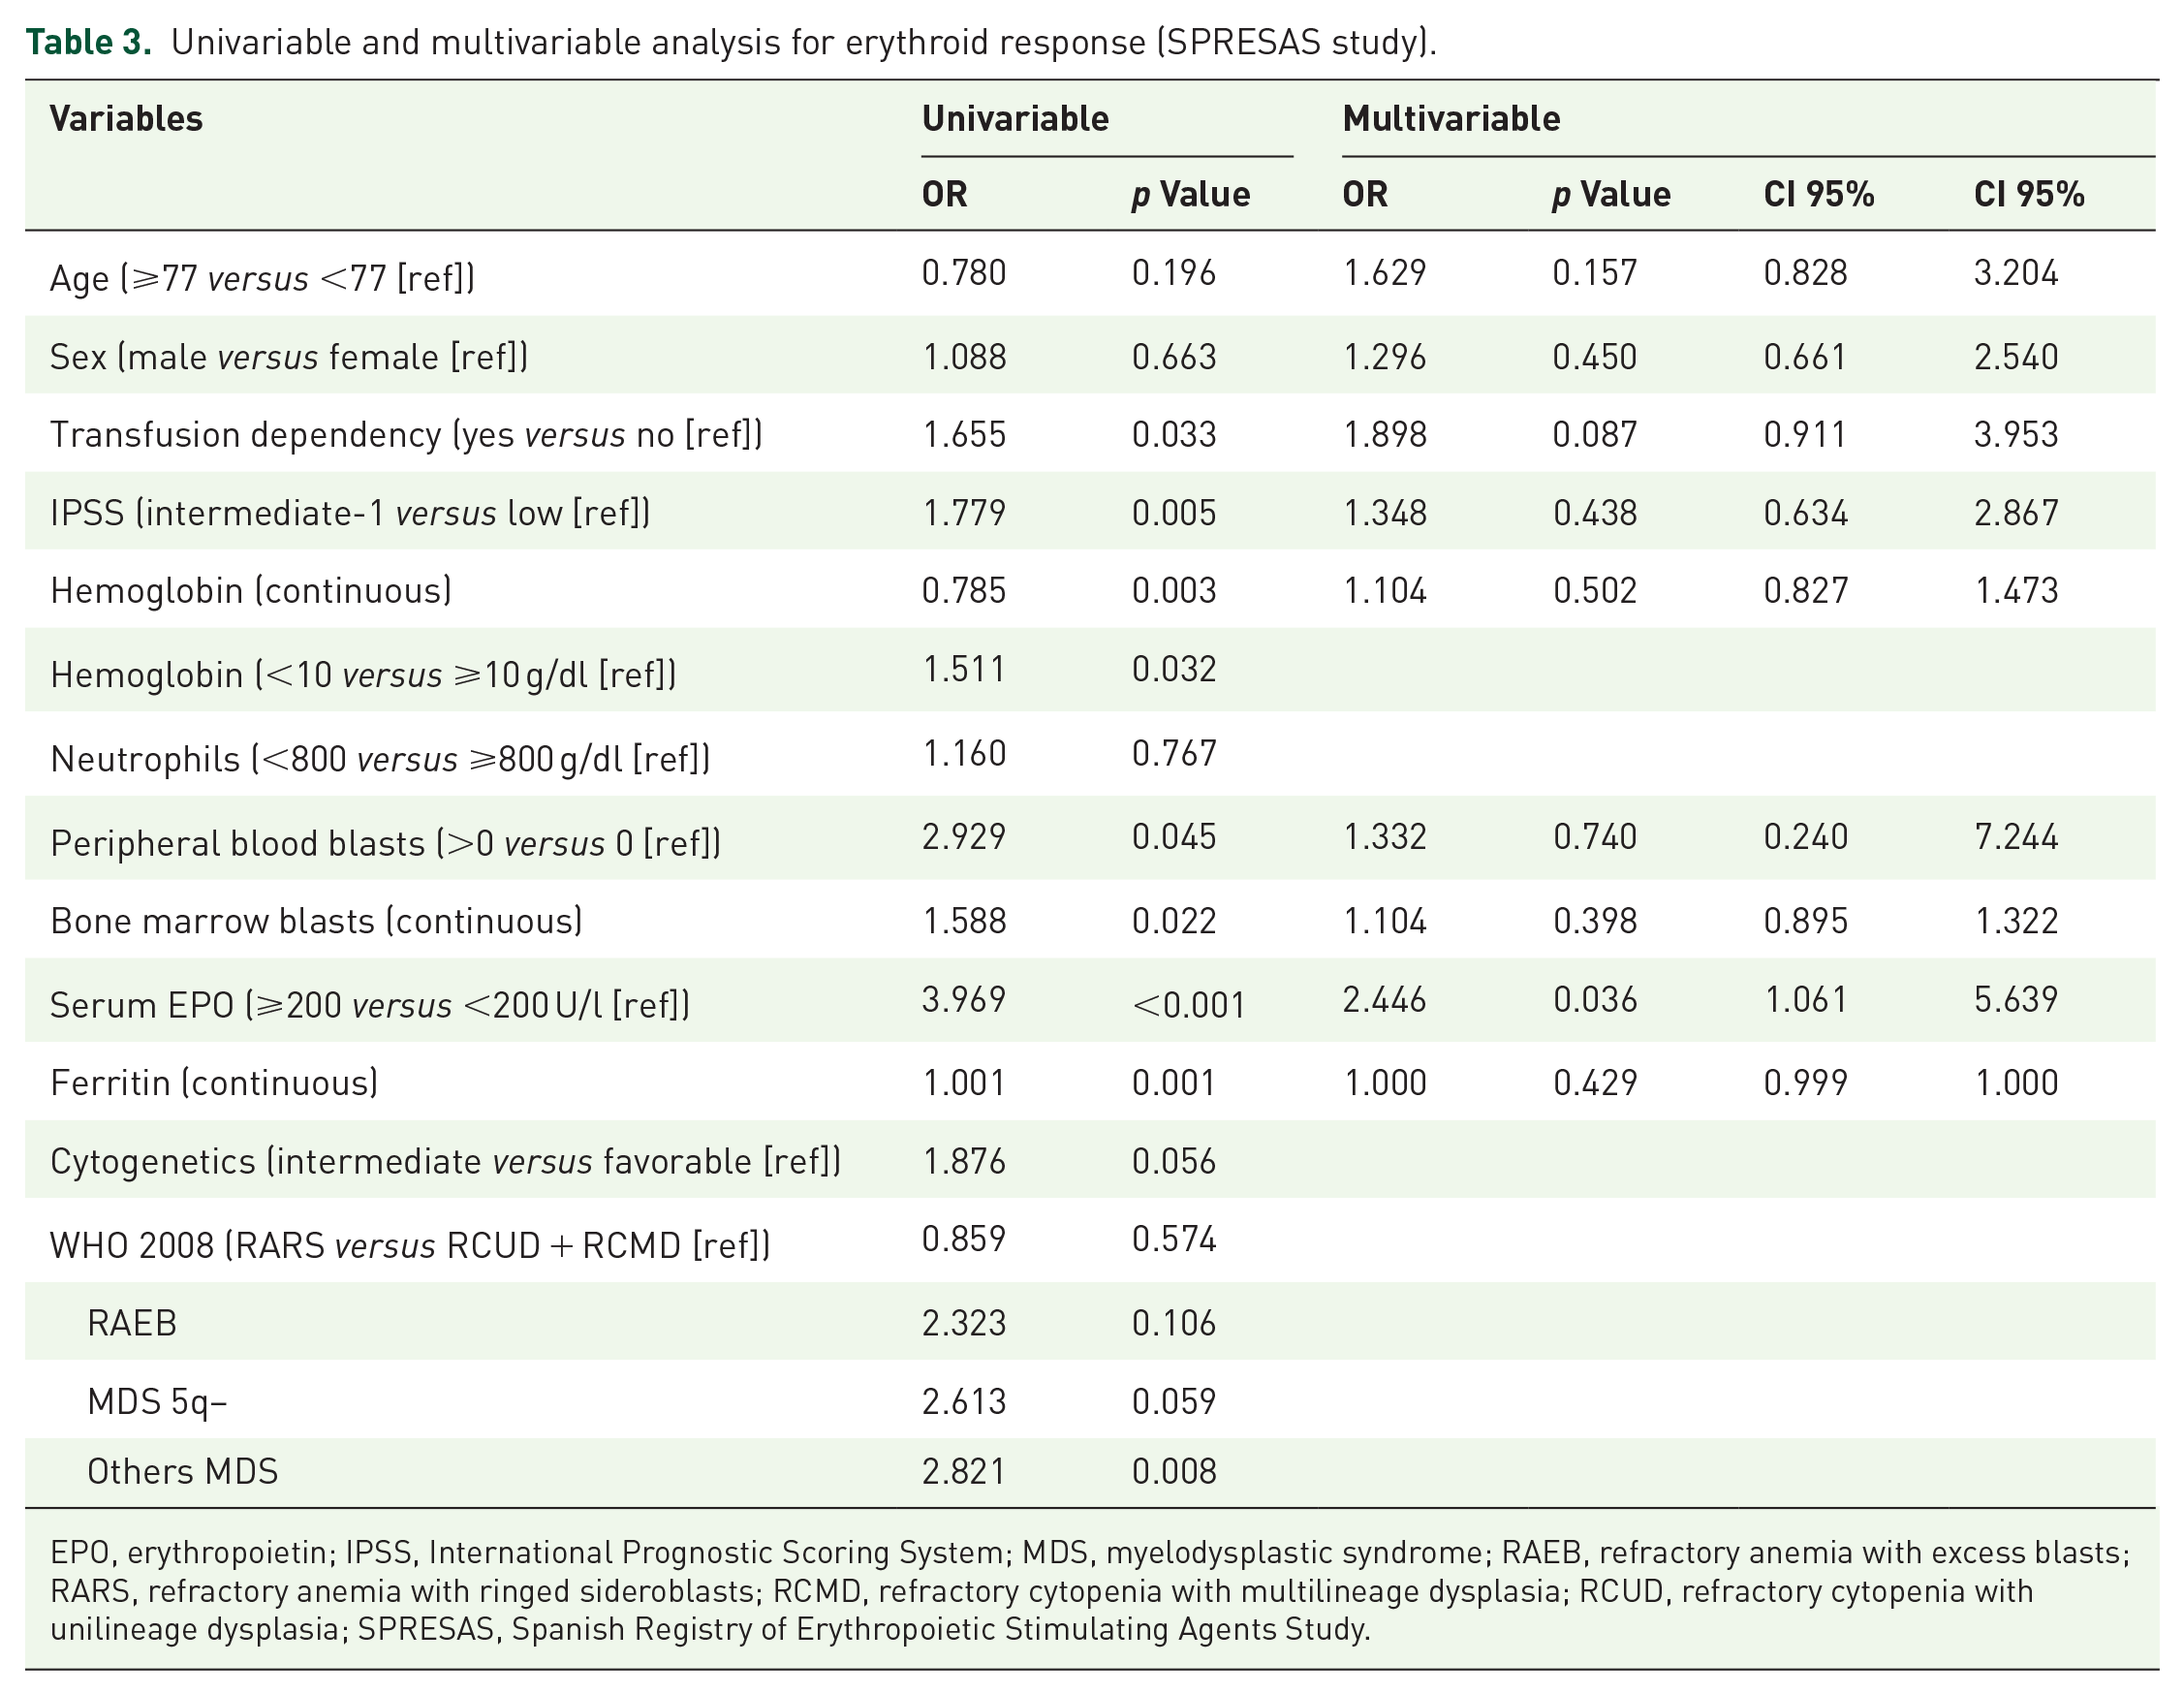
EPO, erythropoietin; IPSS, International Prognostic Scoring System; MDS, myelodysplastic syndrome; RAEB, refractory anemia with excess blasts; RARS, refractory anemia with ringed sideroblasts; RCMD, refractory cytopenia with multilineage dysplasia; RCUD, refractory cytopenia with unilineage dysplasia; SPRESAS, Spanish Registry of Erythropoietic Stimulating Agents Study.
Safety of ESAs treatment
Adverse events were reported in 10 patients, of which 3 were severe adverse events (thrombocytopenia, mucocutaneous bleeding, and traumatic fall). None of them were considered as treatment-related by the investigator.
Overall survival
Median OS from diagnosis was 6.7 years (95% CI, 5.5–7.2) for ESAs-treated patients and 3.1 years (95% CI, 2.6–4.4) for BSC patients (p < 0.001) (Figure 1). OS at 5 years was 58% and 37% for each group, respectively. Among ESAs-treated patients, median OS from ESAs onset was 6.8 years (95% CI, 5.7–not reached) and 3.1 years (95% CI, 2.4–3.8) for each group, respectively (p < 0.001) (Figure 2).

Overall survival in SPRESAS study according to the management strategy: best supportive care versus ESAs treatment (landmark analysis).
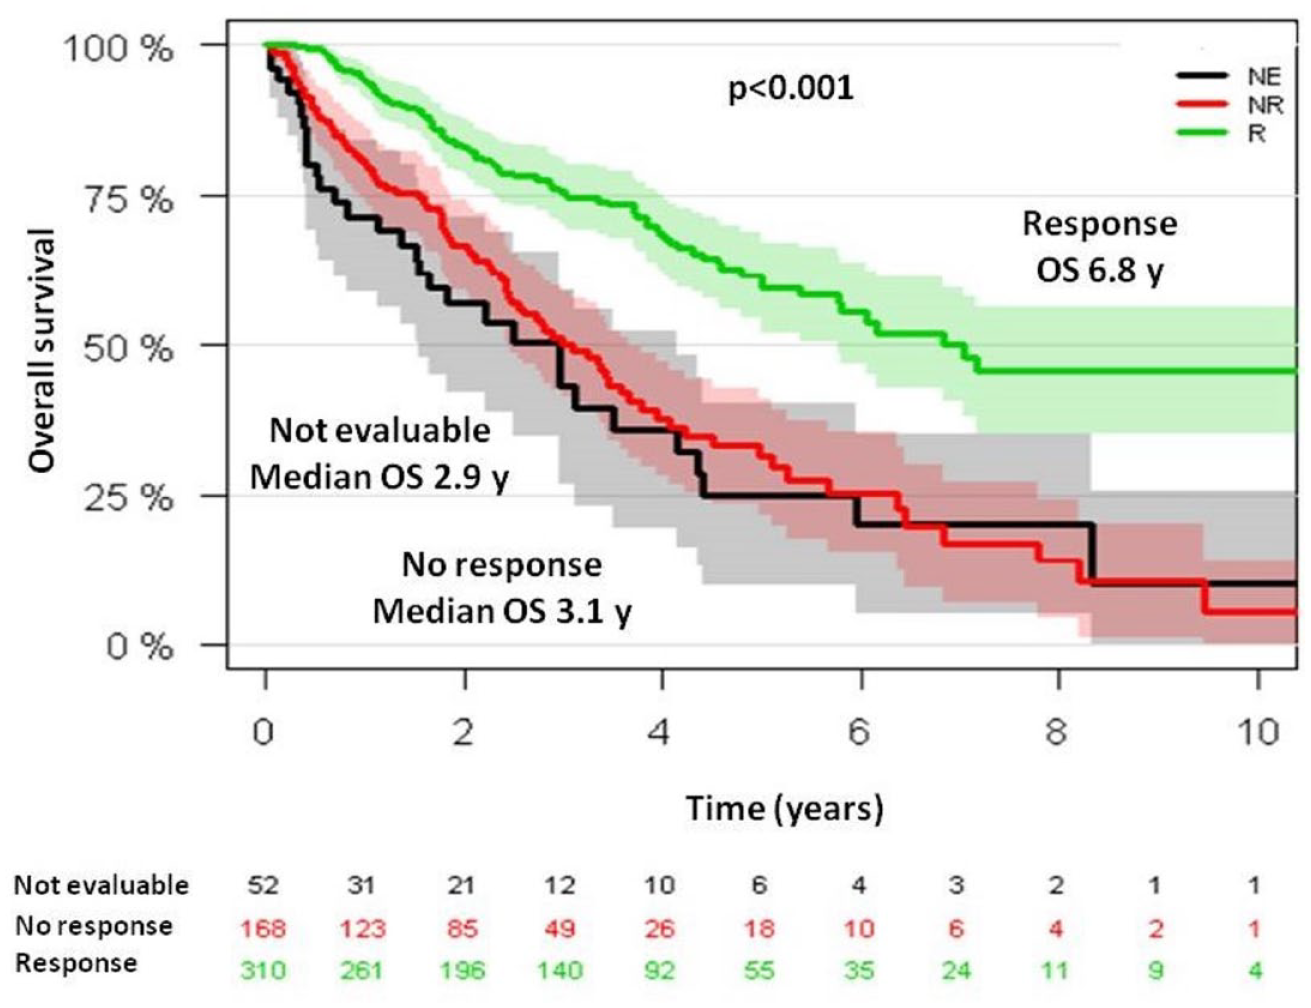
Overall survival from ESAs onset in SPRESAS study according to erythroid response.
Variables significantly associated with a better OS in the multivariable analysis were younger age (hazard ratio, 1.05; 95% CI, 1.01–1.04; p < 0.001), female gender (hazard ratio, 0.67; 95% CI, 0.53–0.85; p = 0.036), higher hemoglobin level (hazard ratio, 0.874; 95% CI, 0.804–0.951; p = 0.001), lower leukocyte count (hazard ratio, 1.02; 95% CI, 1.02–1.04; p = 0.003), low-risk IPSS (hazard ratio, 1.91; 95% CI, 1.51–2.41; p < 0.001), and ESAs treatment (hazard ratio, 0.65; 95% CI, 0.51–0.83; p < 0.001).
Non-responders had similar outcome to responders with ER duration <12 months and <6 months, with a median OS from ESAs onset and from 12 and 6 months after ESAs onset, respectively, of 3.09, 2.5 (p = 0.851), and 2.37 years (p = 0.238). Conversely, responders with ER duration ⩾12 and ⩾6 months had longer OS: 6.2 years (p < 0.001) and 6.5 years (p < 0.001), respectively.
CI of AML at 5 years from diagnosis was 18% for ESAs-treated patients and 20% for BSC patients (p = 0.350). According to response to ESAs, CI of AML was 13% for responders and 28% for non-responders (p < 0.001). Variables significantly associated with a lower CI of AML in the multivariable analysis were female gender (hazard ratio, 0.61; 95% CI, 0.40–0.92; p = 0.02), lower BM percentage of blasts (hazard ratio, 1.23; 95% CI, 1.13–1.33; p < 0.001), and low-risk IPSS (hazard ratio, 1.99; 95% CI, 1.20–3.30; p = 0.007). Among ESAs-treated patients, CI of AML at 5 years from ESAs onset was 20% in responders versus 37% in non-responders (p < 0.001).
Mutations sub-analysis
Patients and disease characteristics
Among 65 patients with available samples at diagnosis for NGS, 23 (35%) were ESAs-treated patients with ER duration ⩾12 months and 42 (65%) were non-responders. Among responders, 13 patients (57%) sustained ER until the date of last follow-up while 10 (43%) lost their response. Median ER duration was 4.6 years (range, 1–11.9). Median ESAs onset from diagnosis was 0.4 years (range, 0–14.1). There were 15 patients (23.1%) receiving granulocyte-colony stimulating factor (G-CSF) concomitant with ESAs.
The most frequent cytogenetic abnormality was del(5)(q13q31), that was present in five patients (7.7%), all of them categorized as MDS with del(5q−). Other cytogenetic abnormalities were: −Y and +8 in three patients, del(11q) in two patients and del(20q), +17, and inv(9) in one patient each abnormality. In one case del(7q) was detected by fluorescence in situ hybridation (FISH) but not by conventional karyotype.
Clinical characteristics of responders and non-responders are resumed in Table 4. Comparing patients from ESAs-treated cohort from SPRESAS registry with patients from mutations sub-analysis, we found that both groups were similar regarding most of variables.
Main characteristics of responders and non-responders in mutations sub-analysis.

CMML, chronic myelomonocytic leukemia; EPO, erythropoietin; IPSS, International Prognostic Scoring System; IPSS-R, IPPS Revised; MDS/MPN, myelodisplastic syndrome/myeloproliferative neoplasm; MDS-U, myelodysplastic syndrome unclassifiable; RAEB, refractory anemia with excess blasts; RARS, refractory anemia with ringed sideroblasts; RCMD, refractory cytopenia with multilineage dysplasia; RCUD, refractory cytopenia with unilineage dysplasia; WHO, World Health Organization.
Eight patients (12.3%) had no mutations while 57 patients (87.7%) had at least one mutation. Twenty patients (30.8%) had one mutated gene, 19 (29.2%) had two, 6 (9.2%) had three, 7 (10.8%) had four, and 5 patients had five mutated genes (7.7%). The median number of somatic mutations per patient was 2. Only three patients have two mutations in the same gene: two in SF3B1 and one in TP53. The median VAF was 34.6% (range, 2.7–92.7). For the statistical analysis, patients were divided in two groups: <3 and ⩾3 mutated genes.
Most frequently mutated genes were: SF3B1 (54.8%, 35 patients), DNMT3A (16.9%, 11 patients), TET2 (13.8%, 9 patients), SRSF2 (10.8%, seven patients), ZRSR2 (9.2%, 6 patients), ASXL1 (7.7%, 5 patients), IDH2 (7.7%, 5 patients), EZH2 (6.2%, 4 patients), STAG2 (6.2%, 4 patients), and TP53 (6.2%, 4 patients). Other frequently reported mutations in MDS were detected in <5% patients. There were 47 patients (72.3%) with mutations in splicing genes, being the most frequently mutated group; only three patients had two splicing genes simultaneously mutated: two with SF3B1 and SRSF2 and one with SF3B1 and ZRSR2. Mutations in TET2 and DNMT3A frequently co-occurred with other mutations: 8 out of 9 patients with TET2 mutations and 9 out of 11 patients with DNMT3A mutations presented mutations in splicing genes, mostly SF3B1 (6/9 and 9/11, respectively). Mutations in signaling pathways and transcription factors genes, described commonly associated with disease progression, were infrequent (16.9% and 26.2%, respectively) but nearly always associated to other mutations (9/11 patients with mutations in transcription genes and 17/17 with mutations in signaling genes). Particularly, from patients with mutations in signaling pathways genes, only 17.6% presented <3 mutated genes, as compared to patients with mutations in splicing genes, in which only 35.4% presented ⩾3 mutated genes (Figure 3).

Patients with LR-MDS treated with ESAs: somatic mutations and cytogenetics.
Outcome
ER and mutational status
ER was 40.4% among patients with <3 mutated genes and 22.2% in ⩾3 (p = 0.170) (Figure 4). The percentage of patients with <3 mutated genes was 82.6% among responders versus 66.7% among non-responders. No mutation proved to be clearly related to ER rate, however, we observed a trend toward a better response in patients with TET2 mutations versus TET2 wild-type patients: 66.7% (6/9 patients) versus 30.4% (p = 0.057). Variables related with ER rate in the univariable analysis were RBC-TD (p < 0.001), cytogenetics (p = 0.034), serum EPO level (p = 0.025), hemoglobin level (p = 0.032), and BM percentage of blasts (p = 0.015). None of them reached the statistical signification in the multivariable analysis.
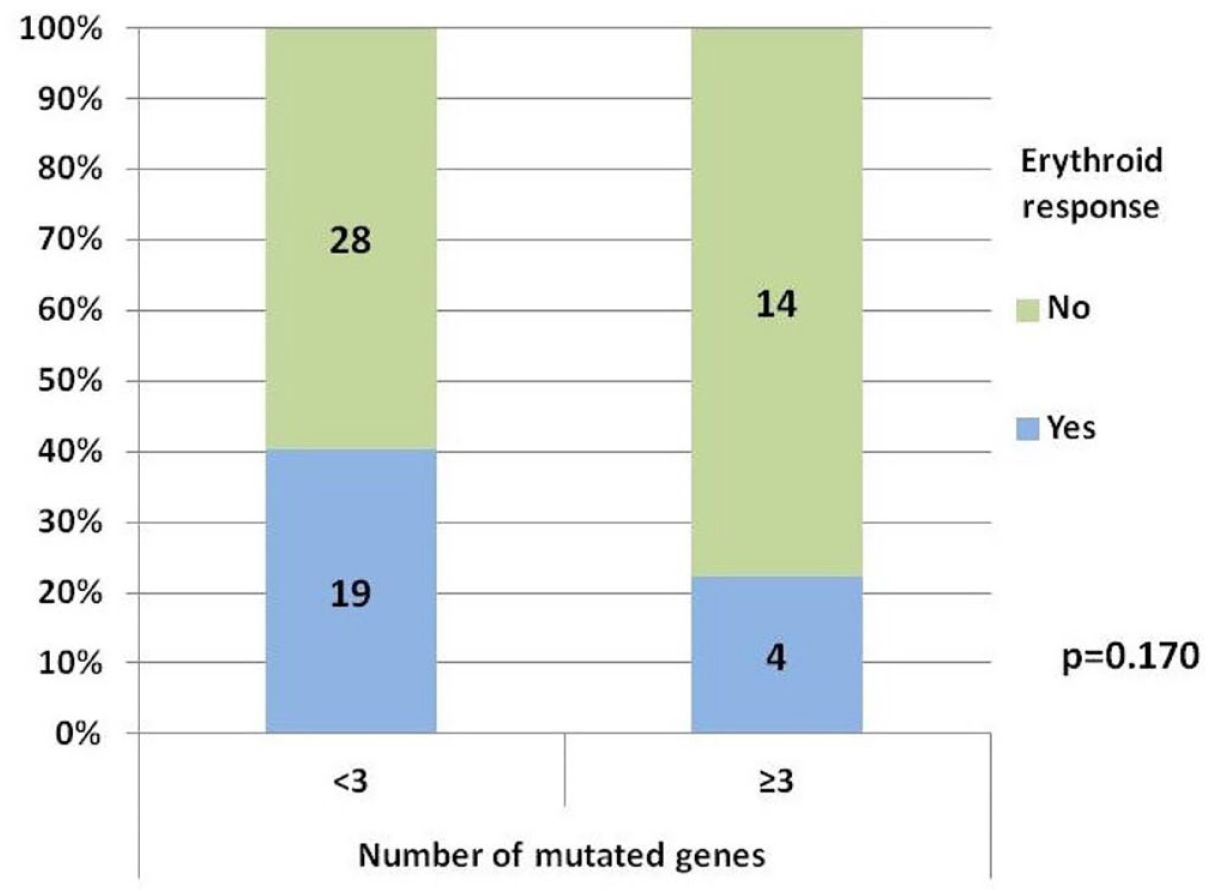
Erythroid response according to the number of mutated genes.
Only two variables were significantly associated with ER duration in the univariable analysis, RBC-TD (hazard ratio, 3.53; 95% CI, 1.04–12.0; p = 0.043), and ⩾3 mutated genes (hazard ratio, 4.37; 95% CI, 1.07–18.78; p = 0.047), but none of them retained their impact on multivariable analysis.
Overall survival
After a median follow-up in alive patients of 9.5 years (range, 2.7–17.6), 50 patients (76.9%) have died (14 responders and 36 non-responders), with a median OS from the diagnosis of 5.9 years (95% CI, 4.1–7.7) in the entire cohort, 8.0 years (95% CI, 7.0–9.0) in responders, and 4.4 years (95% CI, 2.18–6.69) in non-responders (p = 0.007) [Figure 5(a)]. In multivariable analysis variables independently associated with lower OS were older age (hazard ratio, 1.1; 95% CI, 1.05–1.15; p < 0.001), male gender (hazard ratio, 2.41; 95% CI, 1.15–5.10; p = 0.02), RBC-TD (hazard ratio, 3.49; 95% CI, 1.42–8.60; p = 0.007), intermediate-1 IPSS (hazard ratio, 2.83; 95% CI, 1.28–6.25; p = 0.01), and having ⩾3 mutated genes (hazard ratio, 2.8; 95% CI, 1.22–6.43; p = 0.015). Co-variables with a disproportionately high CI (WHO 2018 diagnosis, STAG2 mutations, GNAS mutations) were excluded from the multivariable analysis (Table 5). STAG2 mutations were always subclonal.

Overall survival: entire cohort (a) and according to the number of mutated genes (b), SRSF2 mutational status (c), and STAG2 mutational status (d).
Univariable and multivariable analysis for overall survival (mutations sub-analysis).

CMML, chronic myelomonocytic leukemia; EPO, erythropoietin; IPSS, International Prognostic Scoring System; IPSS-R, IPSS Revised; WHO, World Health Organization.
STAG2 and GNAS were not included in the multivariable analysis because of a disproportionally high CI.
Patients with <3 mutated genes showed an improved outcome, with a median OS of 6.8 years and a 5-years OS of 60.3% versus 2.7 years and 4% in patients with ⩾3 mutated genes, respectively; p = 0.014) [Figure 5(b)]. Among responders, the higher number of mutated genes retained its unfavorable prognosis (5-years OS 75% for ⩾3 mutated genes versus 84% for <3 mutated genes; p = 0.012).
CI of AML
Eighteen patients (27.7%) transformed into AML, 3 responders, and 15 non-responders. CI of AML was 17.5% at 5 years (95% CI, 9.9–29.2), 10.7% in patients with <3 mutated genes (95% CI, 4.7–24.5), and 33.3% in patients with ⩾3 mutated genes (95% CI, 17.5–63.4; Gray test, p = 0.006) (Figure 6). Additionally, mutations in STAG2 gene were associated with an increased risk of AML at 5 years: 75% in mutated patients (95% CI, 42.6–1.3) versus 13.2% (95% CI, 6.9–25.2) in non-mutated (Gray test, p < 0.001) [Figure 6(c)].

Cumulative incidence of acute myeloid leukemia: entire cohort (a), according to the number of mutated genes (b), and according to STAG2 mutational status (c).
Discussion
In the current study, we report the results of a large analysis on the use of ESAs in anemic LR-MDS patients. The proportion of patients responding to ESAs was 64.8%, similar to that observed in most previous retrospective studies, including an article by Messa with 1145 low-risk patients receiving ESAs versus BSC.3,6,7,24–27 Median duration of ER was 1.8 years, also close to previous reports. The only variable significantly associated with better ER rate in the multivariable analysis was a serum EPO level <200 U/l, validating the results of prior studies (500 U/l in Hellström-Lindberg score, 200 U/l in Park and Santini studies, and 100 U/l in Buckstein and Houston studies).3–6 This cut-off value has been also selected by the European Medicines Agency for the approval of ESAs in LR-MDS, based on the results from the clinical trial with epoetin-α performed by Fenaux. 28 We also confirmed that ESAs were safe and not related with AML progression. In addition to serum EPO level, both IPSS and IPSS-R and RBC-TD have been consistently associated with ER rate,3–6 but in our study these variables were only significant in the univariable analysis.
OS in our series was similar to previously reported. 21 We confirmed a higher OS among responders to ESAs, which has also been previously observed, although it was slightly higher in our study, probably due to a longer follow-up, a lower proportion of patients with RAEB treated with ESAs in our study (3.8%) comparing with others (19–38%) and the inclusion of patients with low and intermediate-1 IPSS exclusively, while other studies also included patients with intermediate-2 and high risk IPSS (11–24%).3,4,27,29 Among responders to ESAs, OS was inferior for patients with an ER duration lower than 6 and 12 months, confirming the data reported by Kelaidi et al., 8 who observed that ER <6 months was associated with a higher mortality and progression to AML and similar to the one seen in non-responders. By contrast, Messa did not observe any difference in OS between responders and non-responders. We argue that this could be due to that they did not differentiate patients according to ER duration. 21
AML transformation was similar in BSC and ESAs-treated patients; nevertheless, we observed that non-responders had a higher CI of AML (37% at 5 years), even higher than that observed in BSC-treated patients (20% at 5 years). The lower incidence of AML among responders could be explained by baseline disease characteristics and mutational profile.
Prevalence of somatic mutations was similar to that observed by Kosmider et al. 30 (87%) in their study about the impact of somatic mutations in LR-MDS patients receiving ESAs. In our study, however, SF3B1 mutations were more frequent (54.8% versus 40.5% in Kosmider’s study), maybe because we included more patients with low IPSS comparing to intermediate-1 (69% versus 45%, respectively). Most of patients have two or more mutations, suggesting that cooperation between mutations could be, almost partially, necessary for the phenotypic disease evolution. We observed that mutations in DNMT3A and TET2, typically related with clonal hematopoiesis, frequently coexisted with mutations in SF3B1 and other genes. We also found that mutations in signaling pathways and transcription factors gene were rare and nearly always associated with mutations in other genes. These data support the hypothesis that disease development and transformation to higher-risk forms are consequence of acquisition and accumulation of successive different mutations.
We observed that a higher number of mutated genes (⩾3) in LR-MDS patients tended to be associated with a lower rate of ER, although statistical signification was not reached, probably because of the limited sample size. Also, ER response duration seemed to be inversely related to the number of mutated genes. Thus, a higher genetic complexity could be associated with refractoriness and could be a predictive factor of response to ESA, similar to serum EPO, RBC-TD, or IPSS. In the same way, adverse impact of somatic mutations in OS was assessed, even among responders to ESAs, according with Kosmider et al. 30 Further studies including a higher number of patients are needed to confirm these findings.
Mutations in three genes were associated with a worse OS in univariable analysis: STAG2, GNAS, and SRSF2 [Figure 5(c) and (d)], all previously described as associated with poor prognosis and high risk features.31–35 Conversely, we did not find clear differences in OS regarding the presence of SF3B1 mutations. In any case, we cannot draw definitive conclusions about the role of isolated mutations, given the small sample size and the difficulty of isolating the role of each mutation separately. Patients with ⩾3 mutated genes also presented a higher incidence of transformation to AML, as well as those with mutations in STAG2. In fact, although only four patients had mutations in this gene, all of them had almost other three mutated genes; in all cases, STAG2 mutations were subclonal. These findings support the hypothesis that AML transformation is commonly caused by secondary or cooperative mutations, which emerged during disease evolution over a prior non-leukemic clone, according to a recently published paper from our group about the role of RAS pathway and cohesin complex mutations in AML evolution among LR-MDS patients. 35
Conclusion
To sum up, ESAs are a safe and efficient first-line treatment for symptomatic anemia in LR-MDS, and ER is associated with favorable outcome. A higher number of somatic mutations in these patients was associated with an adverse prognosis. The absence of response to ESAs, which could be partly related to an adverse mutational profile, might be considered as a warning signal for disease progression and a lower OS expectancy. To better clarify the impact of somatic mutation on the outcome after ESAs treatment in LR-MDS, it should be evaluated in larger series through an international cooperative study.
Supplemental Material
sj-docx-1-tah-10.1177_20406207231218157 – Supplemental material for Outcomes and effect of somatic mutations after erythropoiesis stimulating agents in patients with lower-risk myelodysplastic syndromes
Supplemental material, sj-docx-1-tah-10.1177_20406207231218157 for Outcomes and effect of somatic mutations after erythropoiesis stimulating agents in patients with lower-risk myelodysplastic syndromes by Juan Carlos Caballero, Julio Dávila, María López-Pavía, Esperanza Such, Teresa Bernal, Fernando Ramos, Marisa Calabuig, Jesús María Hernández Sánchez, Helena Pomares, Mercedes Sánchez Barba, María Abáigar, Bernardo González, Brayan Merchán, Reyes Sancho-Tello, Marta Callejas, Carolina Muñoz-Novas, Carlos Cerveró, Guillermo Sanz, Jesús María Hernández Rivas and María Díez Campelo; in Therapeutic Advances in Hematology
Footnotes
References
Supplementary Material
Please find the following supplemental material available below.
For Open Access articles published under a Creative Commons License, all supplemental material carries the same license as the article it is associated with.
For non-Open Access articles published, all supplemental material carries a non-exclusive license, and permission requests for re-use of supplemental material or any part of supplemental material shall be sent directly to the copyright owner as specified in the copyright notice associated with the article.