
Abstract
Background:
Acute graft-versus-host disease (aGVHD) is a major complication following hematopoietic stem cell transplantation (HSCT).
Objective:
This study aimed to explore the risk factors for the incidence of aGVHD in patients post-HSCT.
Design:
This was a retrospective study.
Methods:
A total of 407 patients were enrolled. The patients’ data were recorded from the medical records. The exposure of cyclosporine was estimated based on a population pharmacokinetics model. The occurrence of aGVHD was clinically graded and staged in severity from grades I to IV. A proportional odds model that estimated the cumulative probabilities of aGVHD was used to analyze the data using a nonlinear mixed-effects model. Then, the model parameters and plausibility were evaluated by bootstrap and visual predictive checks.
Results:
The typical probabilities were 18.9% and 17.9% for grade II and grades III–IV, respectively. The incidence of grade II and grade III–IV aGVHD for human leukocyte antigen (HLA) haplo sibling donor patients was higher than that for HLA-matched donor patients. The incidence of grade II and grade III–IV aGVHD decreased with increasing early cyclosporine trough concentration; however, cyclosporine exposure was not associated with the incidence of aGVHD.
Conclusion:
HLA matching and early cyclosporine trough concentration were important factors for the occurrence of aGVHD.
Introduction
Hematopoietic stem cell transplantation (HSCT) is a potentially curative treatment for various hematological malignancies and disorders. 1 In recent years, the technology of HSCT has become more advanced and has greatly improved the outcome. 1 However, graft-versus-host disease (GVHD) is also a major complication and remains an important source of morbidity and mortality.2 –4 Acute GVHD (aGVHD) was defined as occurring within 100 days after HSCT.2–5 The incidence of aGVHD varies widely and can be as high as 20–80%. 6 Numerous risk factors associated with the occurrence of aGVHD have been described, such as human leukocyte antigen (HLA) disparity, donor/recipient age and sex, donor parity, total body irradiation (TBI), conditioning regimen intensity, etc.4–8 Several studies have tried to explore risk factors for aGVHD using Cox proportional hazard regression models.6,7,9–11 and artificial intelligence models.12–15 There are also some contradictions regarding risk factors for aGVHD. Cyclosporine (CsA), a calcineurin inhibitor, is a pharmacologic strategy to prevent GVHD.2,9,16 CsA has high interindividual variability, 17 and its pharmacokinetics are affected by numerous factors, including demographic characteristics, hematocrit, liver function, and triazole antifungal agents.18–21 In a previous study, a population pharmacokinetic (PopPK) model for CsA was established in Chinese HSCT patients, 18 and the exposure (area under the concentration–time curve, AUC) of CsA could be estimated by this model. Some previous studies have explored the relationship between the concentration of CsA and the occurrence of aGVHD.9,22,23 One study tried to explore the effect of CsA exposure on the occurrence of aGVHD, and CsA exposure was estimated using a validated limited sampling strategy. 24 The purpose of this study was to explore the risk factors for aGVHD and to explore whether the trough concentration of CsA or its exposure affected the occurrence of aGVHD.
Patients and methods
Patients
This was a retrospective study. All patients underwent HSCT for various hematological malignancies. The graft source was from marrow and/or peripheral blood. The administration, sampling, and analysis of CsA were consistent with a previous study. 18 In addition, demographic characteristics, donor source, graft source, disease type, conditioning regimen, pretransplantation state, disease risk index, and drug regimen for GVHD prophylaxis were also recorded from the patient’s electronic medical records. The disease risk index was diagnosed by a hematologist following the National Comprehensive Cancer Network guidelines for various blood diseases when the patient was admitted to the hospital. The reporting of this study conforms to the Strengthening the Reporting of Observational Studies in Epidemiology statement. 25
The inclusion criteria were as follows: (1) patients who underwent allogeneic hematopoietic stem cell transplantation (allo-HSCT), (2) patients who were treated with CsA as a component of prophylactic immunosuppression therapy to prevent GVHD, and (3) patients with therapeutic drug monitoring (TDM) data for CsA after HSCT. The exclusion criteria were as follows: (1) patients who underwent autologous HSCT, (2) patients whose follow-up information was incomplete, and (3) patients whose data were incomplete.
Conditioning regimens and aGVHD prophylaxis
In this study, the conditioning regimens of the HSCT patients included TBI, busulfan (0.8 mg/kg, q6h), Me-CCNU (250 mg/m2, qd), cyclophosphamide (1.8 g/m2, qd), decitabine (20 mg/m2, qd), fludarabine (30 mg/m2, qd), and cytarabine (2 g/m2, q12h). The aGVHD prophylaxis treatments consisted of CsA, mycophenolate mofetil (MMF), anti-thymocyte globulin (ATG), methotrexate (MTX), and methylprednisolone. CsA was administered at 3 mg/kg/day via an intravenous continuous infusion within 7 days before HSCT, and the dosage was adjusted according to the whole blood steady-state trough levels.
aGVHD assessment
The occurrence of aGVHD was clinically graded and staged in severity from grades 0 to IV depending on the extent of the skin, liver, upper gastrointestinal tract, and gut involvement.4,26 Grade 0 was defined as no aGVHD, grade I as mild aGVHD, grade II as moderate aGVHD, grade III as severe aGVHD, and grade IV as life-threatening aGVHD. 5 Systemic treatments, such as topical treatment for cutaneous aGVHD, were unlikely to be prescribed in patients with grade I aGVHD. 27 Therefore, in subsequent data analyses, grade 0 and grade I aGVHD were classified as a category, grade II as a category, and grades III and IV as a category.
Statistical analysis
aGVHD was categorized into three ordered categories: first order (grade 0 and I aGVHD, flag as 1), second order (grade II aGVHD, flag as 2), and third order (grade III and IV aGVHD, flag as 3). The data were described using a proportional odds model for the probabilities of aGVHD. The model estimated the cumulative probabilities of aGVHD after logit transformation. The corresponding probability formulas are shown in the Supplemental Eqs S1–S7.
The logistic analysis was performed using the nonlinear mixed-effects modeling (NONMEM, version 7.5.0; ICON Development Solutions, USA) tool with the first-order conditional estimation method with the likelihood (LAPLACE) options. The auxiliary software used with NONMEM included wings for NONMEM (version wfn751, wfn.sourceforge.net), xpose4 (cran.r-project.org), R (version 4.3.0, cran.r-project.org/src/base/R-4/), and Pirana (version 2.9.4, Certara).
The potential covariates were divided into continuous and categorical variables. The covariates were introduced into the model as linear (Supplemental Eq. S8) or power models (Supplemental Eq. S9) for the continuous covariates and Supplemental Eq S10 for the categorical covariates.
The AUC of CsA was calculated as AUC = daily dose/clearance (CL) based on each patient’s daily dose and individual CL, which was estimated according to the previously established PopPK model. 18 All the covariates that were included in the previously established PopPK model were screened from the present study. Then, the individual CL was estimated by setting MAXEVAL = 0 in NONMEM.
All the covariates were introduced into the basic model individually to identify whether the covariate had statistical significance for the parameters. The significance level was set to 0.05 [df = 1, change in objective function value (OFV) = 3.84]. Then, the analysis of potential covariates with statistical significance for the parameters was performed using a stepwise procedure based on the changes in OFV. During forward selection, the significance level was set to 0.05 (df = 1, change in OFV = 3.84). During backward elimination, the significance level was set to 0.01 (df = 1, change in OFV = 6.63). A nonparametric bootstrap analysis was further performed for the covariates. A 95% bootstrap confidence interval (CI) was used to determine whether the covariate explained part of the variability in the parameter, and the covariate was eliminated if the 95% CI included a value indicating no effect of the covariate as a predictor of individual differences. 28
The bootstrap resampling technique and visual predictive check (VPC) were used to evaluate the accuracy and robustness of the final model. The average values and 95% CI of the parameter estimation obtained from the bootstrap replications were compared to the final model parameter estimates that were obtained from the original dataset.
Results
Patient demographic data
A total of 407 patients were enrolled in the present study. The flow chart of patient inclusion is shown in Figure 1. The hematopoietic stem cells were sourced from peripheral blood for 186 patients (45.7%), or marrow and peripheral blood for 221 patients (54.3%). In addition, 105 patients (25.8%) received cord blood infusion. A total of 357 patients (87.8%) were diagnosed with complete remission, and 50 patients (12.3%) were diagnosed with partial remission or no remission after chemotherapy treatments before HSCT. A total of 145 patients (35.6%) were diagnosed as standard risk, and 262 patients (64.4%) were diagnosed as high risk.
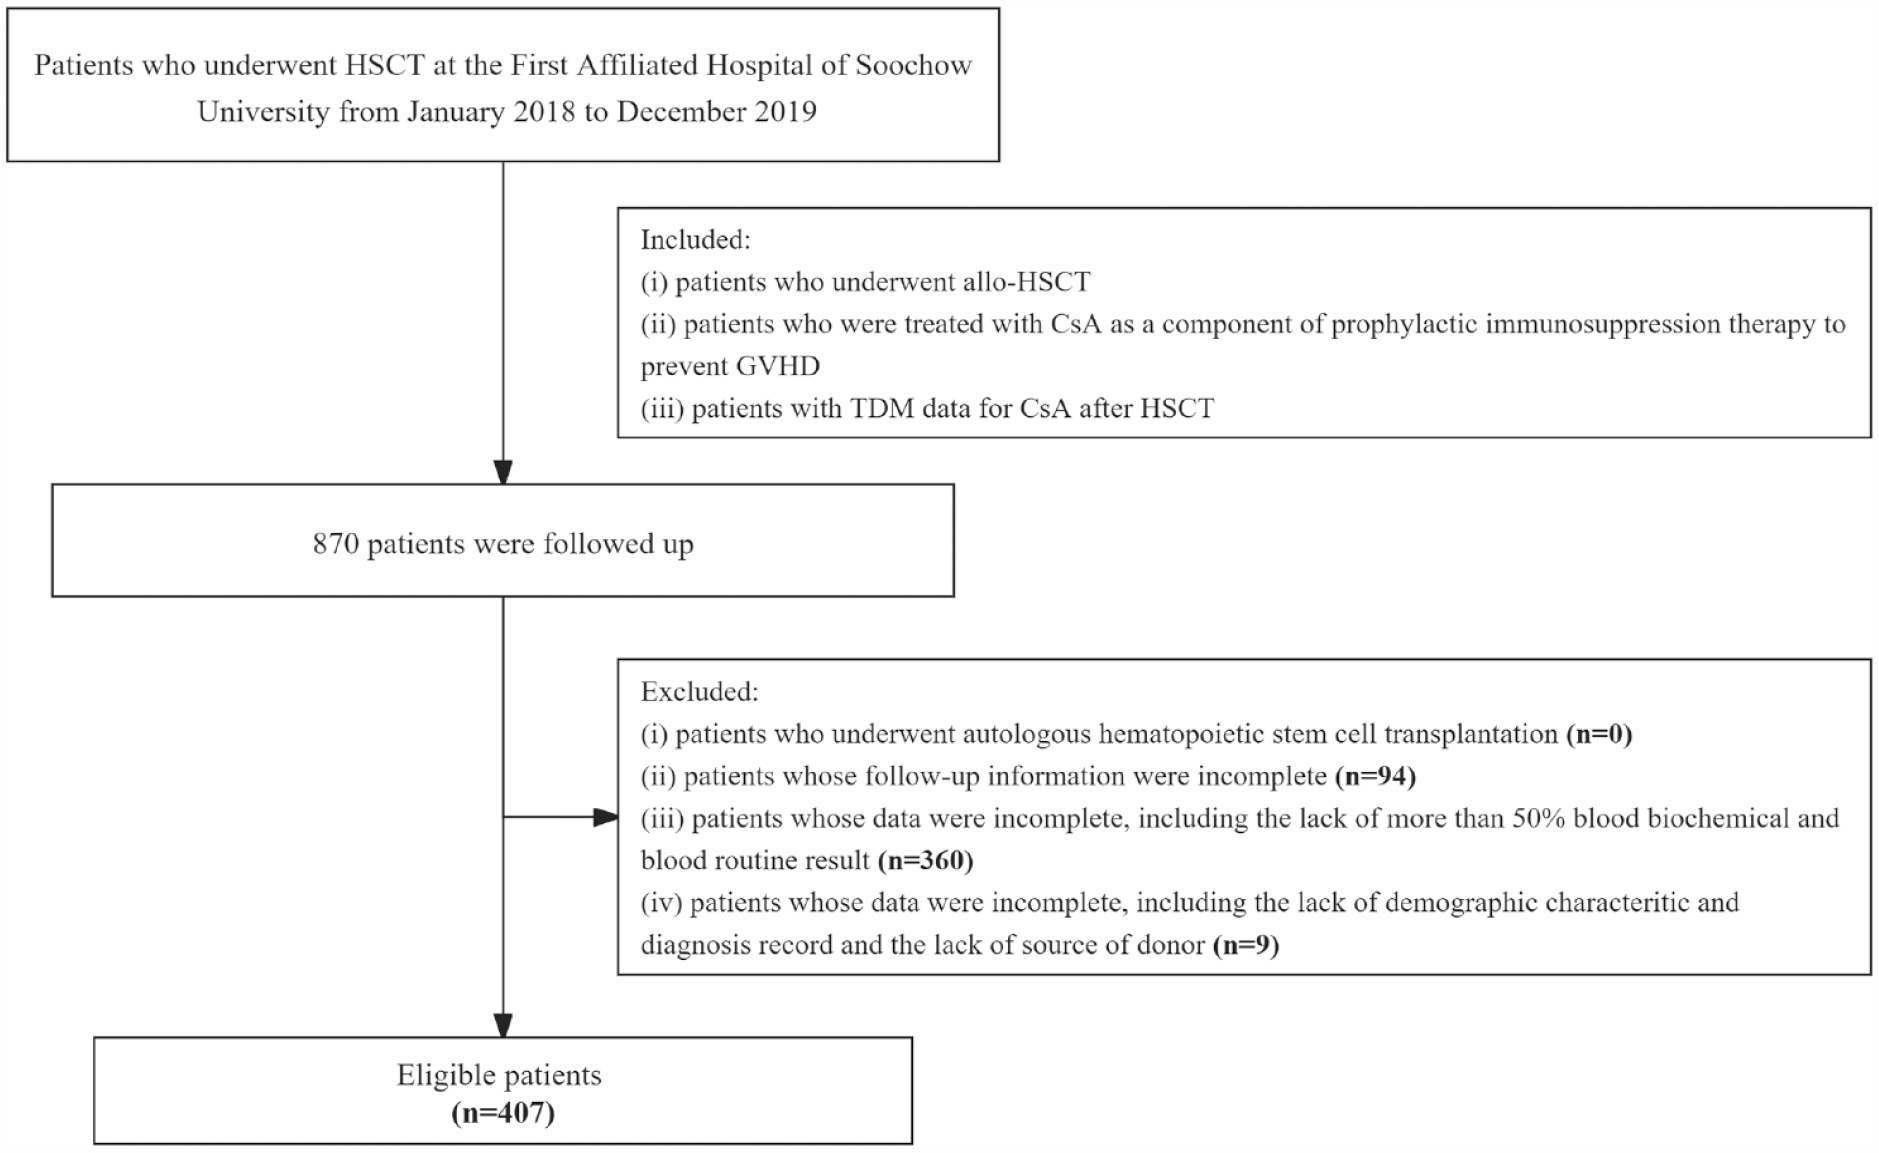
Flow chart of patient selection.
All patients were evaluated for the state of aGVHD within 100 days post-HSCT, and the patients included 184 patients (45.2%) with grade 0, 73 patients (17.9%) with grade I, 77 patients (18.9%) with grade II, 40 patients (9.8%) with grade III, and 33 patients (8.1%) with grade IV. The demographic characteristics of the patients are presented in Table 1. The days of aGVHD occurrence were 45 [interquartile range (IQR): 41–57.5] days for grade I, 24 (IQR: 18.5–32) days for grade II, 26 (IQR: 20–37.8) days for grade III, and 22 (IQR: 16–30.5) days for grade IV. The patients without aGVHD (grade 0) were followed for 100 days for aGVHD; however, the data records were recorded for the period of CsA use in the hospital.
Demographic characteristics of the patients.

ALL, acute lymphoblastic leukemia; AML, acute myelocytic leukemia; ATG, anti-thymocyte globulin; CI, confidence interval; HLA, human leukocyte antigen; MDS, myelodysplastic syndrome.
aGVHD prophylaxis and assessment
High-dose TBI and high-dose busulfan combined with cyclophosphamide were regarded as the myeloablative conditioning protocols. Protocols in which the dosage of alkylating agents or TBI was generally reduced by ⩾30% compared with the myeloablative regimen were regarded as reduced-intensity conditioning protocols. Fludarabine combined with busulfan or cyclophosphamide was regarded as the nonmyeloablative conditioning protocol. A total of 379 patients (93.1%) received a myeloablative conditioning regimen, 23 patients (5.7%) received a nonmyeloablative conditioning regimen, and 5 patients (1.2%) received a reduced-intensity conditioning regimen. A total of 282 patients (69.3%) and 377 patients (92.6%) were prescribed ATG and MTX as conditioning regimens, respectively.
Statistical analysis
The concerned issue, the incidence of aGVHD occurrence, was ordered into categorical data; therefore, a proportional odds model was adopted in the present study. The between-subject variability parameter η was estimated close to 0 by bootstrapping for 95% CI in the base model, so η was fixed to 0.
Compared with the patients with HLA-matched donors, the incidence of grade II and grade III–IV aGVHD for patients with HLA haplo sibling donors was increased (OFV decreased by 10.11, chi-square df = 1, p = 0.001479). The exposure to CsA was represented by the daily AUC. The trough concentration of CsA was the routinely observed trough concentration. The exposure and trough concentration were considered continuous variables. Here, different periods of trough concentration and exposure to CsA were analyzed in the present study, including the previous day of aGVHD occurrence and the average of the first 7 and 14 days post-HSCT. The trough concentration and exposure of CsA of grade 0 aGVHD were recorded as the last day of follow-up with the CsA administration record for the previous day of GVHD occurrence. The characteristics of the trough concentration and exposure to CsA for different periods are shown in Table 2. The incidence of grade II and grade III–IV aGVHD decreased with increasing average CsA trough concentration in the first 14 days post-HSCT (OFV decreased by 6.78, chi-square df = 1, p = 0.009239). The parameter estimates and bootstrap evaluation of the final proportional odds model are shown in Table 3.
The trough concentration or exposure to cyclosporine in the same period (median, IQR).

aGVHD, acute graft-versus-host disease; AUC, area under the concentration–time curve; HSCT, hematopoietic stem cell transplantation; IQR, interquartile range.
The parameter estimates and bootstrap of the final proportional odds model.

CI, confidence interval; FCON_CSA14, estimated coefficient of the average CsA trough concentration in the first 14 days post-HSCT; FHLA, estimated coefficient of HLA; RSE, relative standard error.
In the different formulas (linear or power), there were some differences for continuous covariates. The average CsA exposure of the first 7 days post-HSCT using a linear and power formula decreased the OFV by 0.17 (chi-square df = 1, p = 0.68) and 4.2 (chi-square df = 1, p = 0.040021), respectively. The average CsA exposure of the first 14 days post-HSCT using a linear formula and power decreased the OFV by 0.201 (chi-square df = 1, p = 0.6539) and 7.30 (chi-square df = 1, p = 0.006899), respectively. The AUC14, as a covariate using a power formula, was introduced into the model during the stepwise procedure. AUC14 decreased the OFV by 4.67 (chi-square df = 1, p = 0.03064) in the forward inclusion step, which fit the setting significance level (p < 0.05, df = 1, change in OFV > 3.84). However, when AUC14 was removed from the model, the change in OFV did not fit the setting significance level (p < 0.01, df = 1, change in OFV >6.63).
The average CsA exposure and trough concentration using the linear formula when aGVHD occurred decreased the OFV by 9.14 (chi-square df = 1, p = 0.002495) and 0.293 (chi-square df = 1, p = 0.5883), respectively. The average CsA trough concentration of the first 7 days post-HSCT using a linear formula decreased the OFV by 11.39 (chi-square df = 1, p = 7.344E−4). Although these covariates were statistically significant (except the average CsA trough concentration using the linear formula when aGVHD occurred) when introduced into the model as covariates, the meanings of the coefficients for these covariates have questionable physiological significance. This means that the incidence of aGVHD increases with increasing average CsA exposure and trough concentration. In addition, glucocorticoids and MMF, as the covariates that were introduced into the model, also had statistical significance, and the coefficients of these covariates also had no physiological significance (Supplemental Table S1). Therefore, these covariates were eliminated from the model.
Furthermore, the VPC of different covariates was used to evaluate the model. The VPCs for the covariates of HLA-matched donors and the average CsA trough concentration of the first 14 days post-HSCT are shown in Figures 2 and 3, respectively.

Logistic regression of the probability of different grades of aGVHD versus HLA for the visual predictive check. The median (circle) and 95% CIs (shaded area) obtained from 500 simulations are shown. In addition, the actual observations with 95% CIs are shown.
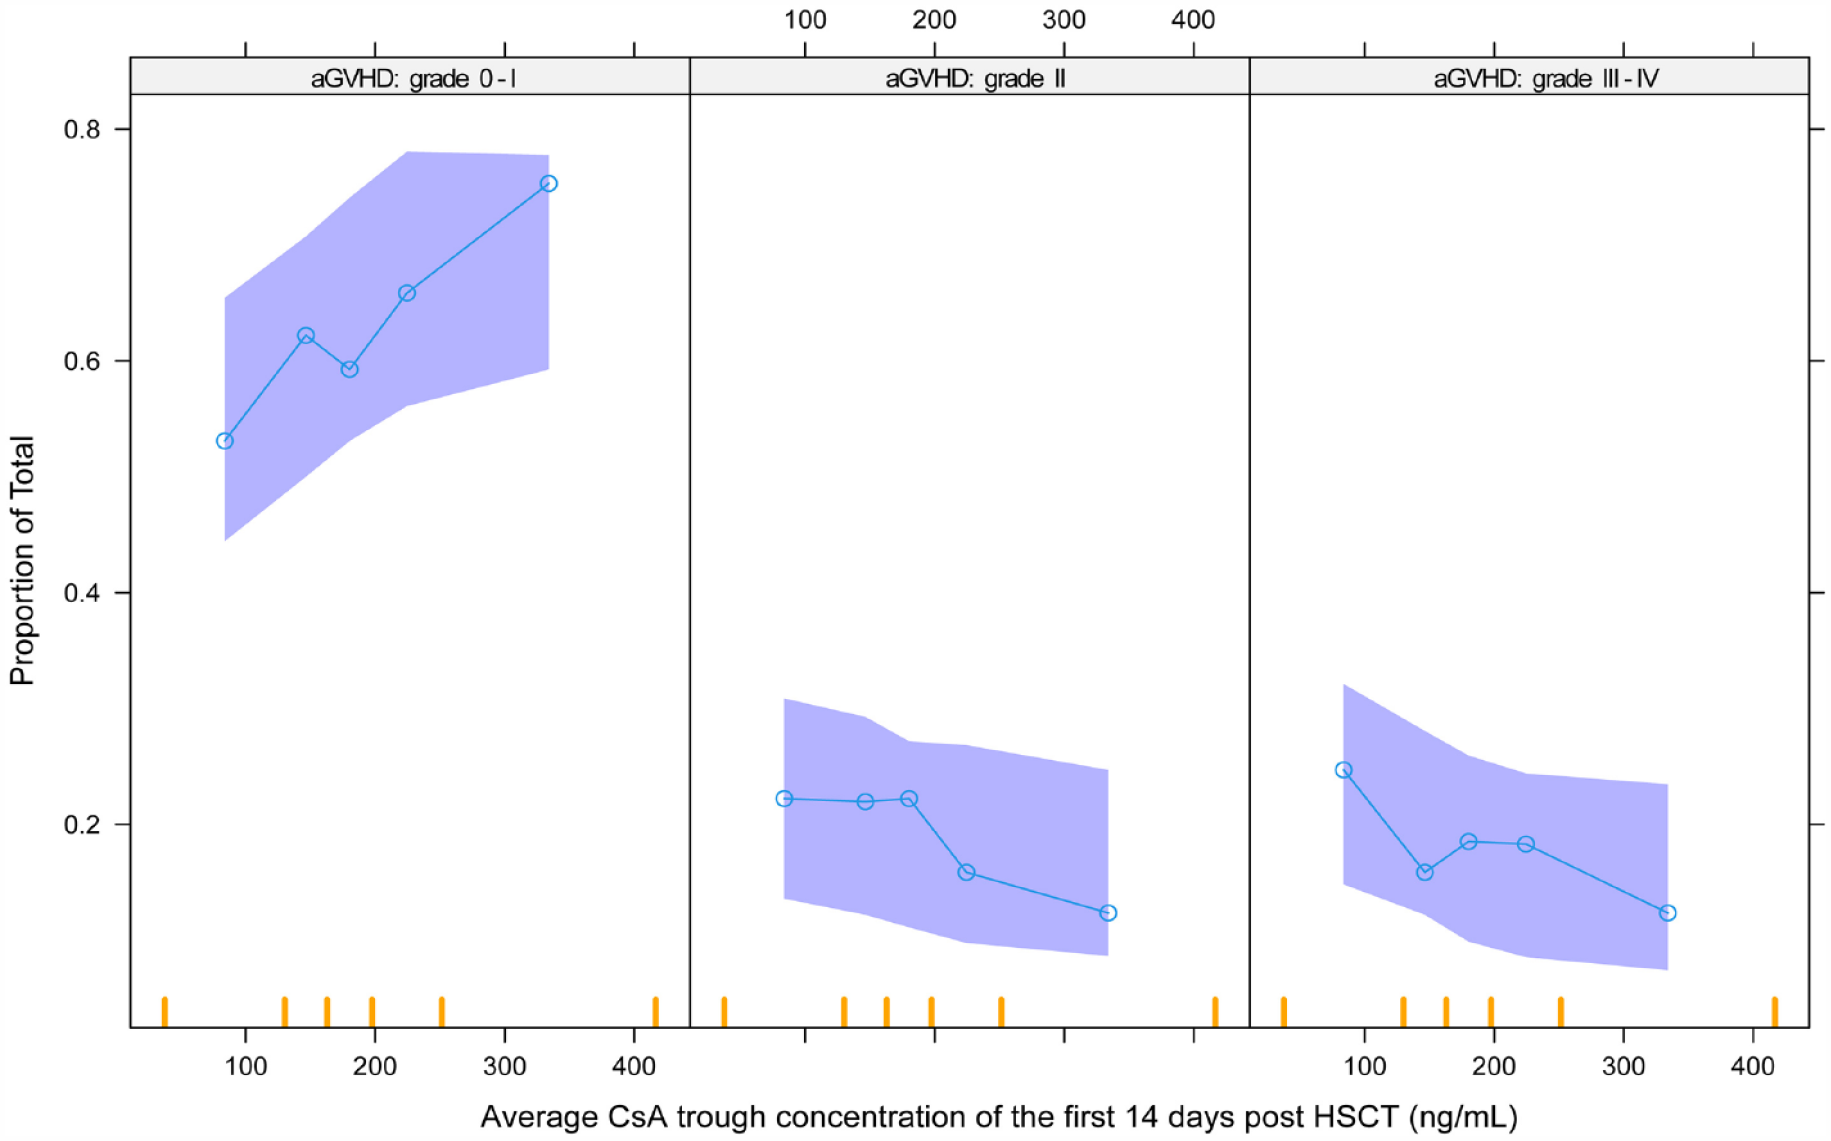
Logistic regression of the probability of different grades of aGVHD versus average CON_CsA14 for the visual predictive check. The median (circle) and 95% CIs (shaded area) obtained from 500 simulations are shown. In addition, the actual observations with 95% CIs are shown.
The average CsA trough concentration in the first 14 days post-HSCT is shown in Table 4 for different scenarios. The trough concentrations of CsA were significantly different between grades 0–I and grades II–IV for all patients (median: 189.4 ng/mL versus 170.2 ng/mL, p = 0.0030). Compared with patients with grades 0–I, trough concentrations of CsA of patients with grades II–IV significantly decreased for HLA haplo sibling donor (median: 191.8 ng/mL versus 168.6 ng/mL, p = 0.0015). However, trough concentrations of CsA indicated no significant difference between grades 0–I and grades II–IV for HLA matched (Figure 4, median: 187.7 ng/mL versus 175.2 ng/mL, p = 0.4939). The average CsA trough concentration in different groups was compared using the Mann–Whitney test on GraphPad (version 8.0.2, Dotmatics).
Average CsA trough concentration in the first 14 days post-HSCT for different scenarios.

CsA, cyclosporine; HLA, human leukocyte antigen; IQR, interquartile range.

Average CsA trough concentration in the first 14 days post-HSCT of different grades of aGVHD for different HLAs.
Discussion
This study tried to explore the risk factors for aGVHD in patients with HSCT. aGVHD, as one of the major life-threatening causes, is affected by numerous risk factors. 4 Some studies have tried to explore the risk factors for aGVHD using mathematical models. It was reported that the risk factors associated with an increased incidence of aGVHD included the diagnosis of chronic myeloid leukemia6,7 or myelodysplastic syndrome, 6 CD34+ cell dose,6,8 prednisolone, CD3+ cell dose, 6 cyclophosphamide with TBI, Karnofsky performance score, recipient–donor cytomegalovirus-seronegative, 7 neutrophils, 11 C-reactive protein, platelets, etc. 13 The initial purpose of the present study was to explore the relationship between CsA and aGVHD, and the results showed that the following factors were associated with an increased incidence of grade II and grade III–IV aGVHD: HLA haplo sibling donor (versus HLA-matched donor) and the average CsA trough concentration for the first 14 days post-HSCT using a power formula. The difference might be due to the different antirejection treatment regimens used in different study groups.
Few studies have explored the effect of CsA exposure on aGVHD. 24 CsA remains the most widely used immunosuppressive agent for graft rejection therapy for the majority of patients post-HSCT.29–31 Some studies have demonstrated an inverse relationship between the trough CsA concentration and the incidence of GVHD. 30 Early achievement of a high CsA concentration post-HSCT could reduce the incidence of aGVHD. 23 However, the trough CsA levels did not correlate with the exposure represented by AUC, and some studies showed that AUC monitoring would be a better predictor of clinical outcomes for toxicities and infections. The classical AUC calculation method is to collect the blood samples of patients at different times after drug administration to detect the concentration, 24 and use the linear trapezoidal method for calculation, which is inapplicable in clinical practice. 31 In this study, the AUC was calculated according to the previously established PopPK model of CsA in HSCT patients. 18 The individual pharmacokinetic parameter CL of CsA could be derived from the PopPK model using empirical Bayes estimation, and then the AUC was derived through the daily dosage of CsA divided by the individual CL.
The typical probabilities were 18.9%, and 17.9% for the second order and third order, respectively, in the present study. This result was consistent with other reports.10,32 All the recorded covariates were analyzed during the covariate screening step. The results of the covariates that had a statistically significant effect on the probability of grades II–IV are shown in Supplemental Table S1. Different formulas (linear or power) were tested for continuous covariates. There were some differences for different formulas; for example, AUC14 (average AUC of the first 14 days post-HSCT) using the linear formula decreased the OFV by 0.201 (chi-square df = 1, p = 0.6539); however, AUC14 using the power formula decreased the OFV by 7.30 (chi-square df = 1, p = 0.006899). Although some covariates had statistical significance during the step of screening covariates, the meaning of the coefficients of these covariates conflicted with the physiological significance (Supplemental Table S1). Therefore, these covariates were eliminated from the model. We tried to introduce the AUC14 as a covariate using a power formula into the model by a stepwise procedure. AUC14, which decreased the OFV by 4.67 (chi-square df = 1, p = 0.03064), was introduced into the model in the forward inclusion step according to the setting significance level. Unfortunately, however, when AUC14 was eliminated from the model, the change in OFV did not fit the setting significance level (Supplemental Table S2). Some trials also did not find any association between AUC and the occurrence of GVHD or its severity. 31
Simultaneously, Con_CsA14, which represented the average CsA trough concentration of the first 14 days post-HSCT, was also introduced into the model using a linear or power formula. Either the linear or power formula for Con_CsA14 satisfied the set significance level during the stepwise procedure (Supplemental Tables S3 and S4). However, the relative standard error of θ1 was larger (159.8%) for Con_CsA14 as a covariate using the linear formula when the parameters were evaluated by bootstrapping (Supplemental Table S5). Therefore, Con_CsA14 as a covariate was finally introduced into the model using the power formula. Con_CsA (the last CsA concentration of aGVHD occurrence), Con_CsA7 (the average CsA trough concentration of the first 7 days post-HSCT), and AUC (AUC of the previous day of aGVHD occurrence) did not affect the occurrence of aGVHD. This might be because the dosage of CsA was tapered post-HSCT when patients had no GVHD. It was reported that the target trough concentration was 200–300 ng/mL during the first 3 weeks and then 100–200 ng/mL until 3 months following HSCT. 4 Although increasing the concentration of CsA could reduce the occurrence of aGVHD, a high CsA concentration could increase the risk of renal insufficiency, microangiopathy, and neurological problems. 4 The present study showed that the incidence of grade II and grades III–IV was decreased by 1.7% and 2.9% for HLA haplo sibling patients, and 1.8% and 1.7% for HLA-matched patients (Supplemental Table S6), respectively, when Con_CsA14 was increased from 200 to 300 ng/mL.
HLA molecules are the most important immunogenic proteins contributing to the severity of the GVHD reaction. Donor T-cell recognition of host HLA can give rise to GVHD, and host recognition of donor HLA may increase the risk of graft failure. HLA antigens from host tissues are recognized by donor T cells which are critical for the development of GVHD. 33 The incidence of aGVHD is related to the degree of HLA mismatch. It was reported that the incidence of aGVHD was 35–45% and 60–80% for HLA full match and HLA mismatch, respectively. 4 The effect of HLA on the occurrence of aGVHD was confirmed, and it was shown that the incidence of grade II and grade III–IV aGVHD was increased by 6.3% and 8.8% for HLA haplo sibling donor patients, respectively, in the present study. Because CsA is the primary immunosuppressant for the prevention of GVHD in the clinical, the average CsA trough concentration in the first 14 days post-HSCT might be kept in the range of 155.6–247.4 ng/mL (target 191.8 ng/mL) in HLA haplo sibling donor patients for aGVHD prevention.
The limitations of this study included the following: first, all data were retrospectively screened from medical records, and the error of medical records was not excluded; second, this was a single-center study, and the sample was relatively small. Furthermore, multicenter data for this study and a model-informed randomized controlled trial should be performed.
Conclusion
In conclusion, to decrease the incidence of grade II-IV aGVHD, clinical hematologists should try their best to choose HLA-matched donors as the source of hematopoietic stem cells for patients, and the trough concentration of CsA in the first 2 weeks post-HSCT should be increased in clinical practice. The average level of cyclosporine exposure at any period post-HSCT might have no correlation with the occurrence of aGVHD.
Supplemental Material
sj-docx-1-tah-10.1177_20406207231205406 – Supplemental material for Assessment of risk factors for acute graft-versus-host disease post-hematopoietic stem cell transplantation: a retrospective study based on a proportional odds model using a nonlinear mixed-effects model
Supplemental material, sj-docx-1-tah-10.1177_20406207231205406 for Assessment of risk factors for acute graft-versus-host disease post-hematopoietic stem cell transplantation: a retrospective study based on a proportional odds model using a nonlinear mixed-effects model by Ling Xue, Lin Song, Xun Yu, Xiao Yang, Fan Xia, Xiaoliang Ding, Chenrong Huang, Depei Wu and Liyan Miao in Therapeutic Advances in Hematology
Footnotes
References
Supplementary Material
Please find the following supplemental material available below.
For Open Access articles published under a Creative Commons License, all supplemental material carries the same license as the article it is associated with.
For non-Open Access articles published, all supplemental material carries a non-exclusive license, and permission requests for re-use of supplemental material or any part of supplemental material shall be sent directly to the copyright owner as specified in the copyright notice associated with the article.