
Abstract
Keywords
Introduction
Appendiceal neoplasms are mostly diagnosed incidentally in approximately 1% of appendectomy specimens due to acute appendicitis. 1 Histological differentiations include neuroendocrine and epithelial cell neoplasms, which divided into adenocarcinomas (AC), appendiceal mucinous tumors (AMT), goblet cell carcinoid (GCC), and signet ring cell carcinoma (SRCC). Appendiceal neuroendocrine neoplasms, formerly called carcinoids, are the most common histological type of appendix tumors. Through the World Health Organization classification, appendiceal neuroendocrine neoplasms (aNEN) are classified into well-differentiated neuroendocrine tumor (NET), poorly differentiated neuroendocrine carcinoma (NEC), and mixed neuroendocrine-non neuroendocrine neoplasms (MiNEN). 2 AMTs include mucinous adenocarcinomas (MACs) and appendiceal mucinous neoplasms (AMN). AMN is divided into high-grade mucinous appendiceal neoplasms (HAMNs) and low-grade mucinous appendiceal neoplasms (LAMNs). 2 AMNs can involve the peritoneum, but MAC exhibits minor infiltrative invasion or focal destruction and mostly shows vascular and lymphatic invasion.3,4 Goblet cell adenocarcinoma (GCA) is a rare tumor, formerly called goblet cell carcinoid, which exhibits a mixture of glandular and neuroendocrine histopathological patterns. GCA consists of cells that have secretory phenotypes, including endocrine cells, goblet cells, and Paneth cells. 5 Signet ring cell carcinomas are invasive neoplasms that initially present with repeated intra-abdominal metastases. 6
Immunohistochemistry (IHC) provides comprehensive information for pathologic characteristics and is a valuable tool for establishing the correct cancer diagnosis in clinical diagnostic pathology and determining prognosis. NETs are primarily identified using chromaffin A (CgA) and synaptophysin (Syn) staining.2,7 Special AT-rich sequence–binding protein 2 (SATB2) is mainly expressed in colorectal adenocarcinomas or lower gastrointestinal tract carcinomas.8,9 Gastrointestinal tract NETs, including the appendix, express general neuroendocrine markers, such as non-specific enolase (NSE). 10 Cytokeratins 7 (CK7) and 20 (CK20) are utilized to determine the origin of adenocarcinomas, especially in the gastrointestinal tract. 11 Caudal-type homeobox 2 (CDX2) is suitable for identifying the \midgut origin of the tumor. 12 β-catenin (β-Cat) expression occurs in colorectal endocrine carcinogenesis.13,14 Carcinoembryonic antigen (CEA) is a prognostic marker in patients with colorectal cancer. 15 Serotonin (Ser) is also expressed in appendiceal tumors. 16
Due to the lack of specific clinical symptoms for appendix neuroendocrine neoplasms, investigating a reliable and particular immunohistochemistry biomarker that classifies the cell type and primary origin can lead to earlier and correct diagnosis, timely treatment, and long-term prognosis improvement. This review reports and compares the expression rate (the proportion of positive cases) of the most common immunohistochemistry biomarker expressed on neuroendocrine and epithelial cell types of appendiceal tumors.
Methods
Study protocol and registration
This systematic review adhered to the recommendations in the Preferred Reporting Items for Systematic Reviews and Meta-analyses (PRISMA) statement and guidelines in the Cochrane Handbook for Systematic Reviews of Interventions (Supplemental Table 1).17,18
Search strategy
According to the purpose and design of the article, a systematic search of the relevant literature in PubMed, Web of Science, and Scopus was conducted to identify articles published from inception until August 2023. We also screened the references of eligible articles to include the possible missed studies. The combination of the following keywords was used in the search strategy, which has been entirely explained in the Supplementary material for each database (Supplemental Table 2): “appendix,” “appendiceal,” “tumor,” “neoplasm,” “malignancy,” “adenocarcinoma,” “carcinoid,” “neuroendocrine,” “IHC,” “immunohistochemical,” “immunohistochemistry,” and “marker.”
Eligibility criteria
The PICO(T) model was used to determine inclusion criteria and guide literature research for subgroup analysis: 1. Population: Primary (non-metastatic) appendiceal cancer patients, 2. Intervention: not applicable, 3. Comparison: not applicable, 4. Outcomes: analyzing, reporting, and comparing the expression of each immunohistochemical biomarker on neuroendocrine and epithelial cell types of appendiceal tumors. 5. Type of Study: Observational studies.
Only studies written in English, reporting the most commonly reported immunohistochemistry biomarkers, and studies reporting more than one patient were included.
Excluded criteria from this study were as follows: (1) Metastatic appendiceal neoplasms, (2) Genetic and molecular reporting articles, (3) Conference, meeting, case reports, letter, animal, opinion, and other unsuitable article types as well as book chapters (3) studies that do not include full-text articles (4) Studies reporting inadequate data and unrelated outcomes.
Study selection and data extraction
Two reviewers (HS and PA) searched the relevant literature. Each database’s search outcomes were downloaded in a standard tag format established by Research Information Systems (Ris). After removing duplicates, titles, and abstracts of the papers screened initially for discovering possible publications of interest and eligible studies by three authors (HS, MB, FA) separately, and then full texts were evaluated by three other authors (AB, PH, MS). The full texts of qualified papers were downloaded and checked for eligibility. Eligibility was evaluated in duplication, separately, and independently in order to prevent bias in study selection. Name of the author, publication’s year, total population, mean age, percentage of male participants, immunohistochemistry biomarkers, tumor type, cut of values, and outcome were all extracted by five reviewers independently (MB, AB, PH, SF, MS) and three reviewers (HS, FA, AS) resolved disagreements between authors.
Quality assessment
In this systematic review, we assessed the quality in duplicate and independently by two different reviewers (HS, FA) using a standardized version of the NIH quality assessment tool for observational cohort and cross-sectional studies, 19 and disagreements were settled through discussion, which participated a third reviewer (AS).
Statistical analysis
We performed a meta-analysis employing a random effects model with proportions to gauge the proportion of positive cases. Given the wide-ranging study populations and methodologies, we used a random effects model to summarize the prevalence, presenting proportions, and 95% confidence intervals (95% CI). We employed the Cochrane Q-test and I2 statistic to gauge the variation across studies, designating I2 values exceeding 75% as indicative of substantial heterogeneity. We assessed publication bias through funnel plot visualization and the Egger test. In our subgroup analysis, we categorized studies based on their tumor type. All statistical analyses were done in StataCorp. 2015. Stata Statistical Software: Release 14. College Station, TX: StataCorp LP.
Result
Characteristics of studies and eligible studies
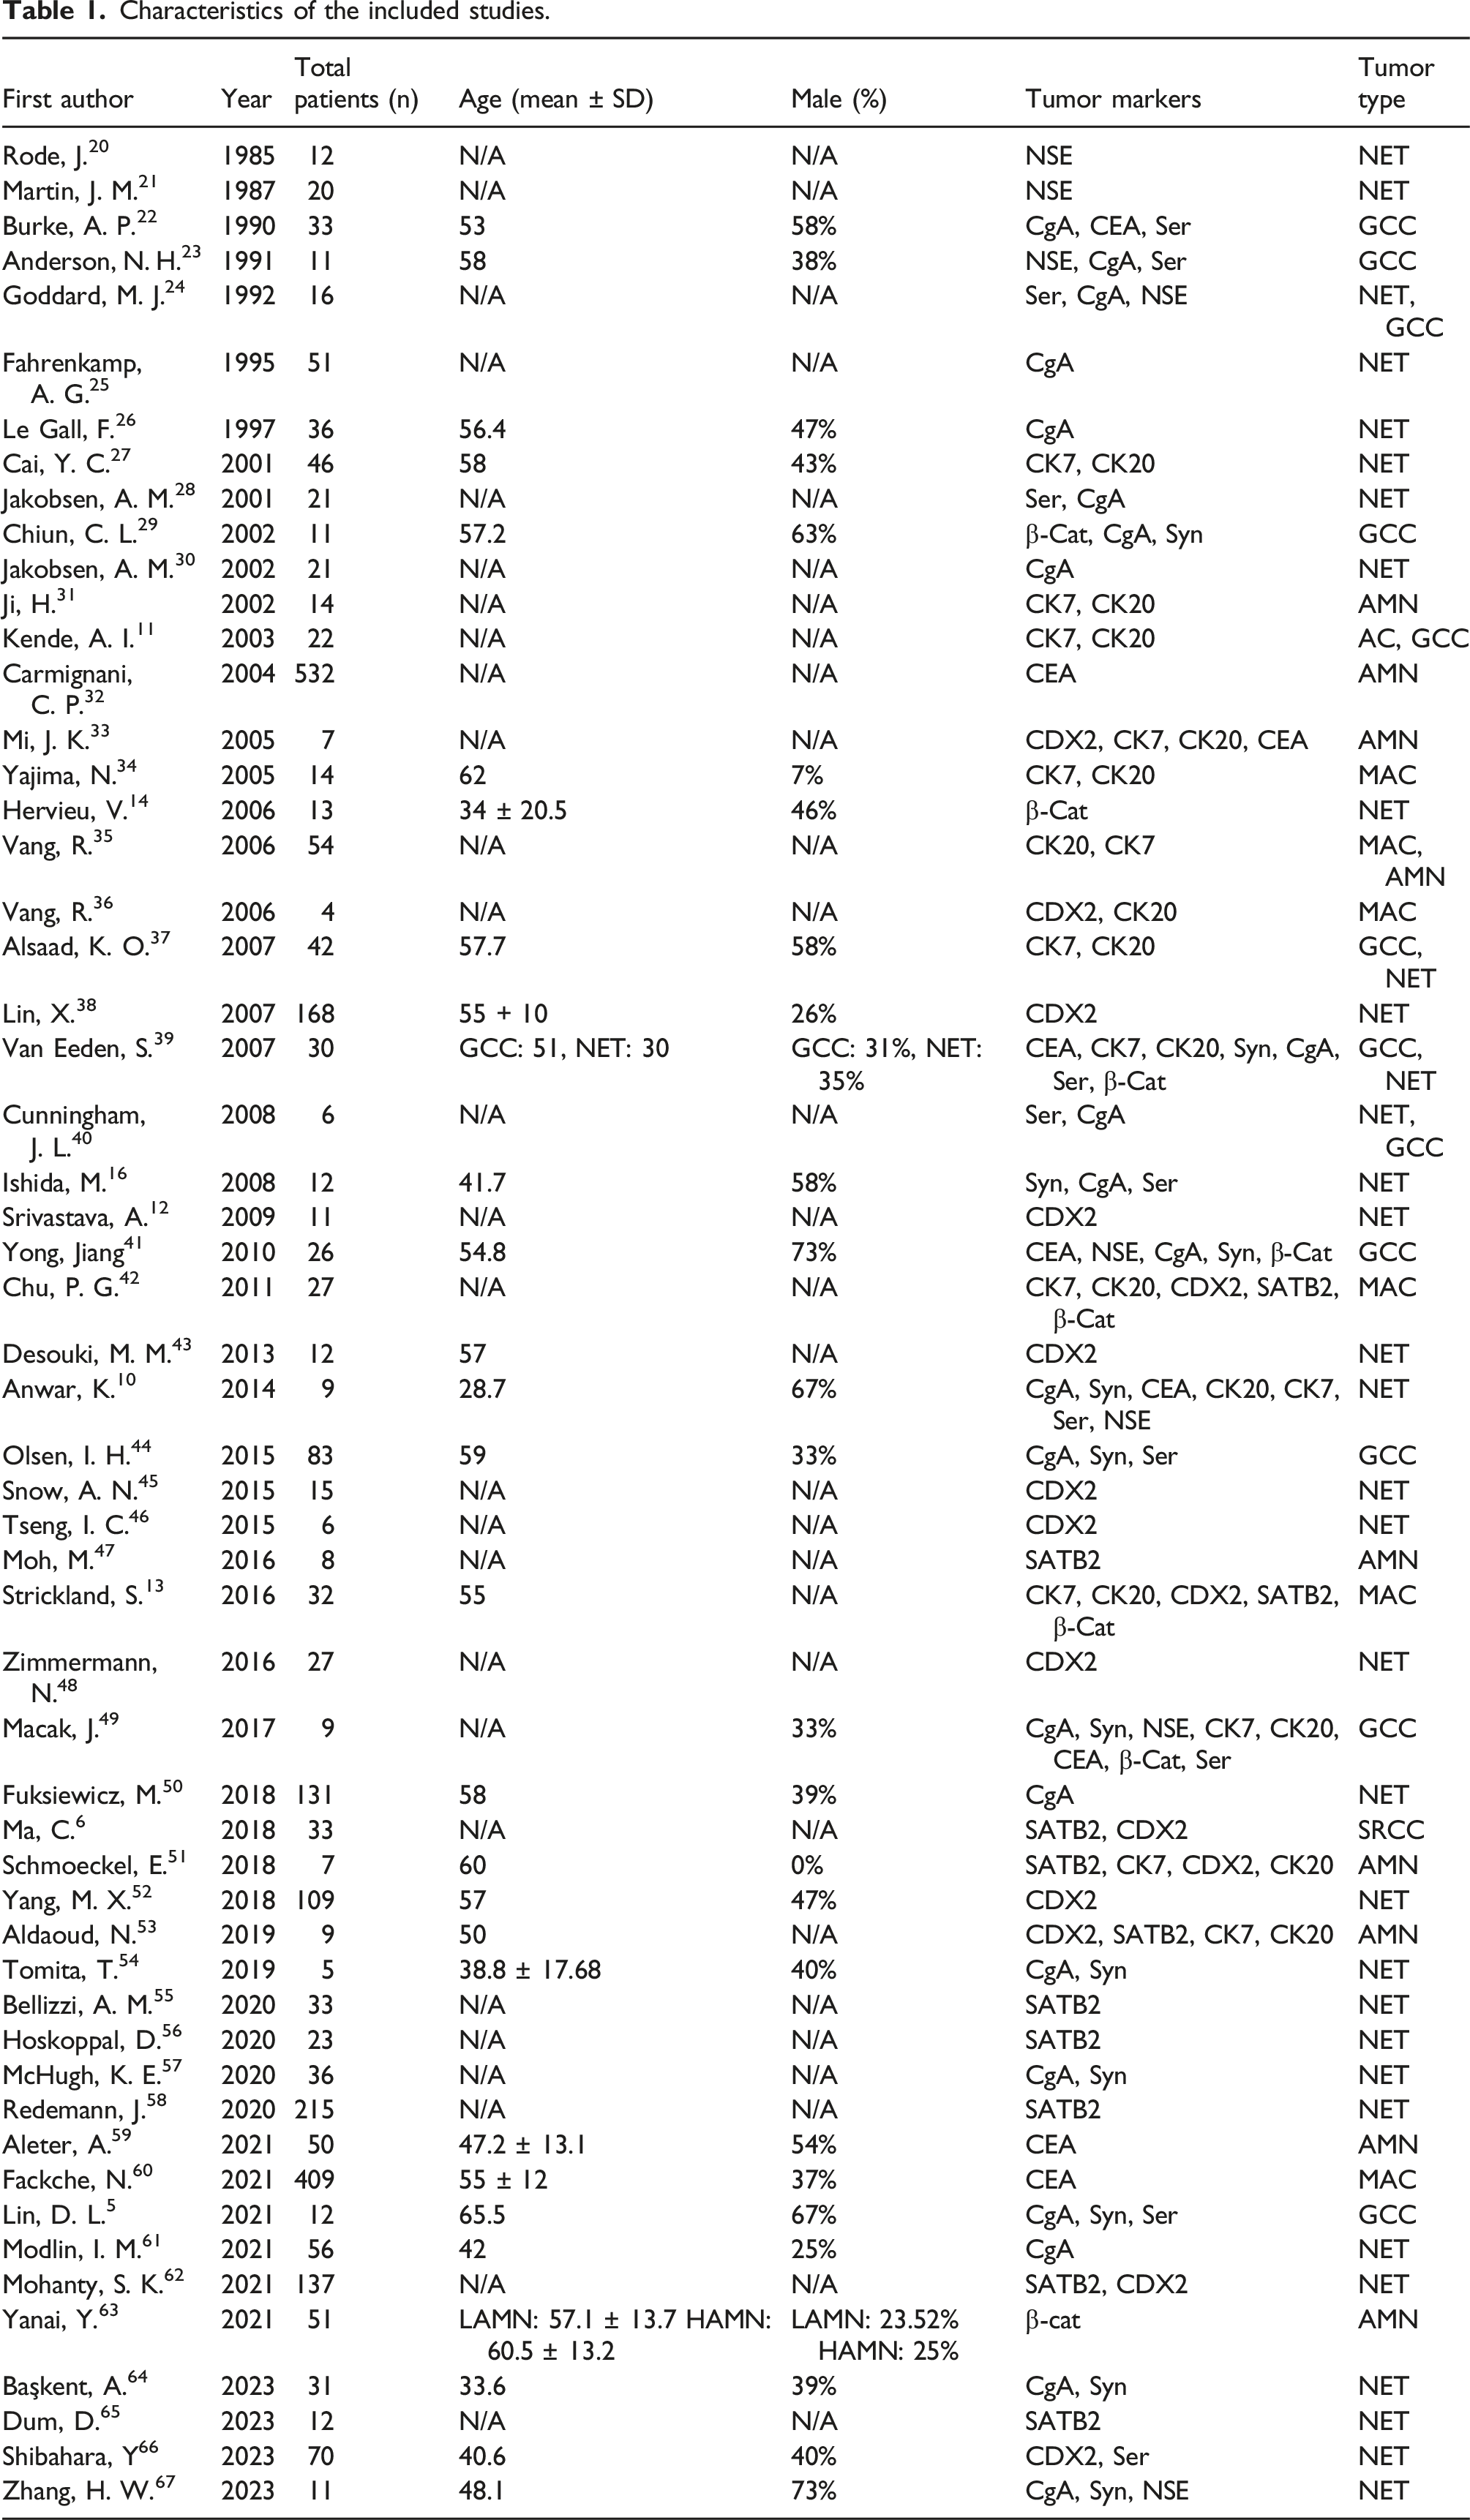
Database searching identified 1369 relevant studies (Figure 1). 819 studies remained after removing duplicated literature. Initially, after titles and abstracts screening, 381 articles were included. Finally, after eliminating metastatic, non-English, and unsuitable articles, 56 studies were included based on our inclusion criteria. The publication year of the selected studies varied between 1985 and 2023. All the included studies were observational. The total sample size varied between 4 and 532 patients with appendiceal neoplasms. The studies reported 33 NET, 12 GCC, 9 AMN, 6 MAC, 1 AC, and 2 signet cell carcinomas. The detailed baseline characteristics of the included studies are available in Table 1. PRISMA flow diagram. Characteristics of the included studies.
Meta-analysis
NSE
Data from 9 studies with 103 participants reporting the relevant outcome were included. The pooled proportion of positive cases was estimated to be 0.93 (95% CI: 0.83 – 0.99; I2 = 46.88%). Subgroup analysis based on tumor type showed significant between-subgroup differences (Test of Group differences: p = .00) (Figure 2(a)). The results of the meta-analysis showing the expression rate of (a) NSE in primary NET, and GCC; (b) CgA in primary NET, MAC, AMN, and GCC; (c) Syn in primary NET, MAC, AMN, AC, and GCC; (d) Ser in primary NET, MAC, AMN, AC, and GCC; (e) STAB2 in primary NET and GCC; (f) CDX2 in primary NET and GCC; (g) β-Cat in primary NET, MAC, AMN, AC, and GCC; (h) CEA in primary NET, MAC, AMN, AC, and GCC; (i) CK7 in primary NET, MAC, AMN, AC, and GCC; (j) CK20 in primary NET, MAC, AMN, and GCC appendiceal neoplasms.
CgA
Data from 25 studies with 485 participants reporting the relevant outcome were included. The pooled proportion of positive cases was estimated to be 0.91 (95% CI: 0.83 – 0.97; I2 = 79.25%). Subgroup analysis based on tumor type showed significant between-subgroup differences (Figure 2(b)).
Syn
Data from 13 studies with 255 participants reporting the relevant outcome were included. The pooled proportion of positive cases was estimated to be 0.87 (95% CI: 0.72 – 0.98; I2 = 84.32%). Subgroup analysis based on tumor type showed significant between-subgroup differences (Test of Group differences: p = .06) (Figure 2(c)).
Ser
Data from 14 studies with 270 participants reporting the relevant outcome were included. The pooled proportion of positive cases was estimated to be 0.71 (95% CI: 0.49 – 0.89; I2 = 89.44%). Subgroup analysis based on tumor type showed significant between-subgroup differences (Test of Group differences: p = .04) (Figure 2(d)).
SATB2
Data from 10 studies with 177 participants reporting the relevant outcome were included. The pooled proportion of positive cases was estimated to be 0.94 (95% CI: 0.87 – 0.98; I2 = 37.18%). Subgroup analysis based on tumor type showed significant between-subgroup differences (Test of Group differences: p = .38) (Figure 2(e)).
CDX2
Data from 16 studies with 261 participants reporting the relevant outcome were included. The pooled proportion of positive cases was estimated to be 0.99 (95% CI: 0.97 – 1.00; I2 = 6.24%). Subgroup analysis based on tumor type showed significant between-subgroup differences (Test of Group differences: p = .20) (Figure 2(f)).
β-Cat
Data from 9 studies with 187 participants reporting the relevant outcome were included. The pooled proportion of positive cases was estimated to be 0.32 (95% CI: 0.02 – 0.73; I2 = 96.54%). Subgroup analysis based on tumor type showed significant between-subgroup differences (Test of Group differences: p = .00) (Figure 2(g)).
CEA
Data from 10 studies with 1050 participants reporting the relevant outcome were included. The pooled proportion of positive cases was estimated to be 0.76 (95% CI: 0.51 – 0.94; I2 = 97.54%). Subgroup analysis based on tumor type showed significant between-subgroup differences (Test of Group differences: p = .00) (Figure 2(h)).
CK7
Data from 18 studies with 271 participants reporting the relevant outcome were included. The pooled proportion of positive cases was estimated to be 0.25 (95% CI: 0.12 – 0.40; I2 = 83.09%). Subgroup analysis based on tumor type showed significant between-subgroup differences (Test of Group differences: p = .00) (Figure 2(i)).
CK20
Data from 19 studies with 248 participants reporting the relevant outcome were included. The pooled proportion of positive cases was estimated to be 0.91 (95% CI: 0.74 – 1.00; I2 = 90.51%). Subgroup analysis based on tumor type showed significant between-subgroup differences (Test of Group differences: p = .00) (Figure 2(j)).
Quality assessment and publication bias
The scores obtained from the NIH Quality Assessment Tool ranged between 7 and 12 and were described by three terms: Poor,1–4 Fair,5–8 and Good (>9). Most studies were defined as good quality, whereas 11 were fair, and none had po CEA in primary NET, MAC, AMN, AC and or quality.
The funnel plot and egger’s regression test did not show a significant source of funnel plot asymmetry for NSE (p-value = .6157), CgA (p-value = .2785), Syn (p-value = 0.3601), Ser (p-value = .8570), SATB2 (p-value = .0716), CDX2 (p-value = .3762), β-Cat (p-value = .0522), CEA (p-value = .4731), CK7 (p-value = .4609), and CK20 (p-value = .5828) (Funnel plots available in supplementary material; Supplemental Figures 10–20).
Discussion
To the best of our knowledge, this systematic review and meta-analysis is the most comprehensive study for evaluating immunohistochemical biomarkers expression rate in primary neuroendocrine and epithelial cell appendiceal neoplasms. The results of the conducted meta-analysis showed an expression rate of 93%, 91%, 87%, 71%, 94%, 99%, 32%, 76%, 25%, and 91% for NSE, CgA, Syn, Ser, SATB2, CDX2, β-Cat, CEA, CK7, and CK20 in primary appendiceal neoplasms without pathological classification, respectively. These results indicated that CDX2 was the most expressed marker and had a significant association with primary appendiceal neoplasms. Respectively, CDX2, SATB2, NSE, and CgA had the highest expression rate (> 90%) and can be considered as specific markers for these tumors in general.
Comparing the expression rate of immunohistochemistry biomarkers in pathologically classified types of primary appendiceal neoplasms.

Cancers with the primary origin of the appendix are rare. Well-differentiated neuroendocrine tumors of the appendix (A-WDNET) are the most prevalent type but also rare and are found incidentally. GCCs show both neuroendocrine and mucinous features. AMNs usually involve the peritoneum. 4 MACs may exhibit a similar histological appearance but usually metastasize to distant organs. Signet ring cell carcinomas are aggressive and initially present with intra-abdominal metastases. 6
In our results, CDX2, SATB2, NSE, and CgA had the highest expression rate (> 90 %), respectively, and β-Cat and CK7 had the lowest. Appendiceal neoplasms diffusely and firmly express CDX2 13 and help determine tumors of intestinal origin, specially NETs. 38 Primary appendiceal neoplasms are distinguished from ovarian tumors by exhibiting CK20+, CEA+, and CK7-. 68 Appendiceal neoplasms were often negative for CK 7 (71%). 31 A CK7-/CK20+ immunohistochemistry pattern was the most common profile in lower intestinal tract tumors (79%). 35 CEA was positive in most mucinous neoplasms and helps determine prognosis, in which a normal level is associated with an improved prognosis. 32 β-Cat is positive in normal cells and in recent studies is helpful as a second-line panel to rule out primary colorectal tumors 13 and plays a significant role in colorectal carcinoma carcinogenesis. MACs usually show β-Cat cytoplasmic positivity, 42 but our results reveal high expression of β-Cat only in GCC and very low expression in other tumors. GCC is generally identified by positivity for CDX2 and CEA and frequent co-expression of CK20 and CK7. 39 AC also expresses CK20. 51 The large intestine, including appendix ACs, were CK7-/CK20+ in most cases, as well as GCC. 11 Also, frequent Ser expression was found in appendiceal tumors. 16
SATB2 expression is mainly restricted to the lower gastrointestinal tract (GIT), including colorectal or appendiceal cancer origin. 51 SATB2 expression has an 86% sensitivity and 93% specificity for neoplasms with lower GIT origin. 55 In another study, SATB2 was 97.5% specific for appendiceal origin compared to ovarian origin. 13 SATB2 is 92% sensitive and 75% specific for diagnosing ACs of colorectal and appendix. It can be used for distinguishing colorectal/appendiceal ACs from ones with pancreatic and gastric origin, and it has been indicated that SATB2 is a less sensitive but more specific marker than CDX2 in colorectal/appendiceal. 69 A recent study reported that SATB2 was positive in 71.4% of appendiceal well-differentiated NETs and HoxB13−/SATB2 + immuno profile extremely demonstrates the appendiceal origin of the NETS with as positive predictive value of about 71.4%. 70
In literature, appendiceal neuroendocrine neoplasms highly express CgA (100%), CDX2 (86–100%), Syn (79%), and reveal less expression of CK20 (0–32%), and are usually negative for SATB2 (4%), CK7 (0–11%), and β-Cat (0%).39,43,71–73 GGCs highly express CDX2 (100%), CEA (100%), and CK20 (81–100%). Unlike NENs, CK7 expression has frequently been revealed in GCCs with a frequency of 56%, which seems to be significantly higher than appendiceal AC (35%).37,39,71 GCC cases showed 12–91% CgA and 18–86% Syn expression. 74 In appendiceal AC, CK7 overall expression was higher but not significantly (35%) in comparison with LAMNs (31%). 75 β-Cat expression was also about 29–47% in appendiceal ACs34,42,76.AMNs frequently secrete markers such as CEA, which are routinely collected through the initial clinical workup. 60
Insulinoma-associated protein 1 (INSM1) is a novel nuclear transcription factor with high specificity and sensitivity in diagnosing gastrointestinal and pancreatic neuronal and neuroendocrine cell differentiation ranging from 90% to 100% and 87% to 100%, respectively. 77 Traditional neuroendocrine markers such as CgA, syn, and CD56 have been used individually and together for identifying NET. INSM1 is as sensitive as chromogranin for NETs, while it has lower sensitivity in comparison with synaptophysin and CD56. The utility of appendiceal tumor markers in the prognosis and diagnosis of metastatic WDNETs is limited since these tumors rarely metastasize and mostly behave indolently. 78 NSE is non-specific and more often misleading than useful. Furthermore, it is not recommended as a neuroendocrine marker for diagnosis of NETs, in contrast to syn, cgA, and INSM1. 79 The Pituitary Homeobox 2 (PITX2) translation factor is 98.1% sensitive for midgut-derived NETs. 80
Our research provides an extensive search of databases to gather a comprehensive collection of studies on this topic. Although each biomarker has been investigated in each pathological classification of tumors or even in gastroenteropancreatic or colorectal tumors, the conducted studies have yet to review and compare many biomarkers in different appendiceal tumors.
This study had limitations that need to be considered in the analysis of future studies to achieve more accurate results. Incorporated studies in this analysis adopt an observational design, so it is crucial to consider that innate biases of this type of investigation may impact the potency and accuracy of our results. Although most studies have used accepted methods to evaluate immunohistochemistry biomarkers, a discrepancy in the evaluation tools may have led to contradiction and variation in the extracted data. Due to inconsistency, lack of integration, and inadequacy of information among the studies in considering cut-off value for the positivity of the tumor cells for a specific marker, we considered all tumor cells that expressed the particular marker in the staining as positive, regardless of the percentage of expression. Furthermore, it is necessary to consider additional factors that can influence the expression, such as comorbid, metastatic, and relieved cancers, as well as congenital or acquired molecular and genetic defects. The application of immunohistochemistry is limited by the availability of cell-type and cancer-specific antibodies, highlighting the unmet need for discovering, testing, and validating new markers. In our study novel markers such as INSM1 and Pitx2 are not assessed and we hope further studies focus on these markers.
Conclusion
This study indicates the proportion of specific immunohistochemical-positive cases in patients with primary neuroendocrine and epithelial cell appendiceal neoplasms. These findings are crucial for enhancing management approaches, facilitating diagnosis, preventing misdiagnosis, and determining prognosis to reduce the disease’s burden. However, further research is required to investigate more specific markers, and more comprehensive studies should be conducted on the pathologically classified types of these tumors in order to achieve the above goals.
Supplemental Material
Supplemental Material - Expression rate and comparison of immunohistochemistry biomarkers in appendiceal neuroendocrine and other epithelial cell neoplasms: Systematic review and meta-analysis
Supplemental Material for Expression rate and comparison of immunohistochemistry biomarkers in appendiceal neuroendocrine and other epithelial cell neoplasms: Systematic review and meta-analysis by Hedieh Soltani, Mojtaba Ahmadinejad, Arman Shafiee, Fatemeh Afshar Rezaee, Mahya Beik Mohamadi, Atefeh Bahrambeigi, Amir Hossein Hajialigol, Saeedeh Fattan and Javad Zebarjadi Bagherpour in Rare Tumors
Footnotes
Statements and Declarations
Authors’ contributions
Funding
The authors received no financial support for the research, authorship, and/or publication of this article.
Conflicting interests
The authors declared no potential conflicts of interest with respect to the research, authorship, and/or publication of this article.
Data Availability Statement
All relevant data are within the manuscript and its Supporting Information files.
Supplemental Material
Supplemental material for this article is available online.
References
Supplementary Material
Please find the following supplemental material available below.
For Open Access articles published under a Creative Commons License, all supplemental material carries the same license as the article it is associated with.
For non-Open Access articles published, all supplemental material carries a non-exclusive license, and permission requests for re-use of supplemental material or any part of supplemental material shall be sent directly to the copyright owner as specified in the copyright notice associated with the article.