
Abstract
Background
Meningioma is the commonest primary brain tumour. Volumetric post-contrast magnetic resonance imaging (MRI) is recognised as gold standard for delineation of meningioma volume but is hindered by manual processing times. We aimed to investigate the utility of a model-based variational approach in segmenting meningioma.
Methods
A database of patients with a meningioma (2007–2015) was queried for patients with a contrast-enhanced volumetric MRI, who had consented to a research tissue biobank. Manual segmentation by a neuroradiologist was performed and results were compared to the mathematical model, using a battery of tests including the Sørensen–Dice coefficient (DICE) and JACCARD index. A publicly available meningioma dataset (708 segmented T1 contrast-enhanced slices) was also used to test the reliability of the model.
Results
49 meningioma cases were included. The most common meningioma location was convexity (n = 15, 30.6%). The mathematical model segmented all but one incidental meningioma, which failed due to the lack of contrast uptake. The median meningioma volume by manual segmentation was 19.0 cm3 (IQR 4.9–31.2). The median meningioma volume using the mathematical model was 16.9 cm3 (IQR 4.6–28.34). The mean DICE score was 0.90 (SD = 0.04). The mean JACCARD index was 0.82 (SD = 0.07). For the publicly available dataset, the mean DICE and JACCARD scores were 0.90 (SD = 0.06) and 0.82 (SD = 0.10), respectively.
Conclusions
Segmentation of meningioma volume using the proposed mathematical model was possible with accurate results. Application of this model on contrast-enhanced volumetric imaging may help reduce work burden on neuroradiologists with the increasing number in meningioma diagnoses.
Keywords
Introduction
Imaging in the management of intracranial meningioma
The extent of imaging follow-up a patient with meningioma receives depends on clinical factors such as neurological symptoms, the histological grade and the elapsed time since initial diagnosis. Follow-up imaging strategies can range from every 3 months for malignant meningioma to every few years for incidental asymptomatic tumours.1,2 The amount of MRI scanning for intracranial meningioma is increasing. 3 A comprehensive surveillance strategy of meningioma enables patients and clinicians to optimise the timing of any treatment intervention, particularly for incidental meningioma;4,5 accurate assessment is important when interpreting follow-up MRI for intracranial meningioma as growth can alter management. Additionally, prior studies have suggested that for post-operative patients, tumour volume at follow-up can be more influential at predicting recurrence than extent of resection. Despite this, there is scarce reporting of volumetric rather than two-dimensional measurements. 6
The slow adoption of volumetric MRI sequences is due to marginally increased acquisition times, increased workload for reporting radiologists and increased incidental findings. The advantages of volumetric studies include increased lesion conspicuity (with more accurate delineation of tumour volume) and co-registration techniques to allow direct comparison. 7
The increasing trend in intracranial meningioma follow-up therefore necessitates adjuncts for the reporting radiologist to improve efficiency and accuracy when determining meningioma growth.
Image segmentation
Image segmentation has been a widely studied topic in the last few decades. Model-based methods, particularly of the variational type, have proven to be effective and robust for a wide range of clinical applications.8–10 These variational methods use features (such as intensity and texture) directly in the model and output a segmentation result based on certain specified criteria (e.g. the model may encourage the segmentation result to include regions with a high intensity and penalise regions with a low intensity).
In recent years, deep learning methods have become the dominant method of image segmentation.11–13 Deep learning methods are data driven, requiring a large set of labelled data (data with manual segmentation performed by an expert) in order to train the networks. Typically, convolutional neural networks are given a large database of images as input, and by minimising a loss function, which encourages the output of the network to be similar to the associated ground truth segmentation, the neural network can be trained to perform the task associated with the dataset. A clear disadvantage of the deep learning approach for segmentation is that gathering a labelled dataset large enough to produce good results is time consuming and expensive to do. This motivates the desire to make use of robust variational models which can be unsupervised, and produce results without such large, labelled datasets.
We propose to tackle the problem of meningioma segmentation using a model-based variational approach. Unlike deep learning methods, a variational model is run independently on each image, and so the results can’t be influenced by a potential selection bias in the training set. This study will assess the reliability of such a model for meningioma segmentation.
Methods
Patient selection and study design
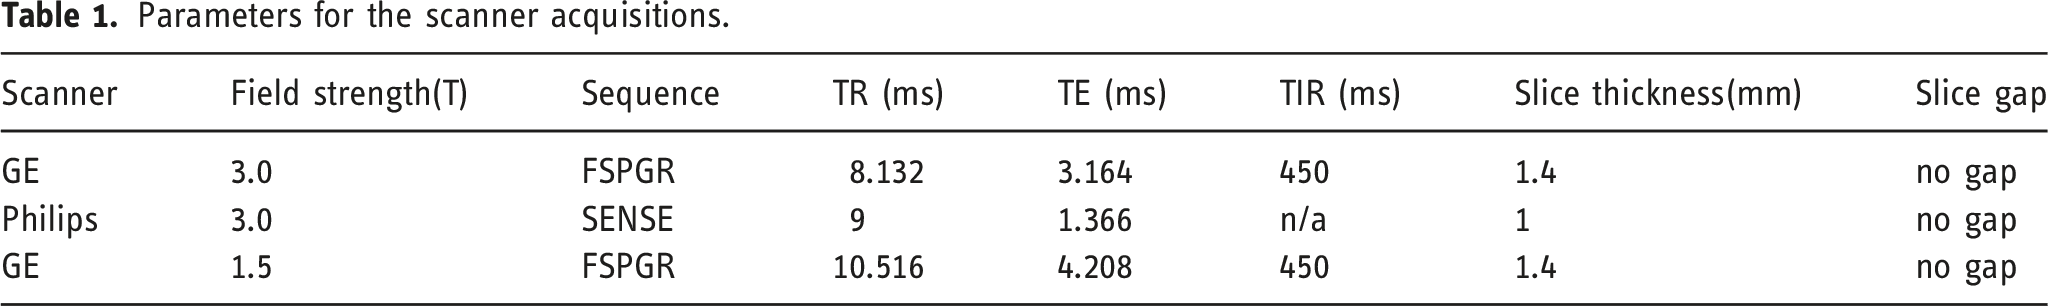
Parameters for the scanner acquisitions.
Manual segmentation
Manual segmentation for quantitative volumetric measurements of meningioma was undertaken on isotropic 3D T1-weighted post-gadolinium contrast-enhanced studies in the axial plane using ITK-SNAP (https://www.itksnap.org/). 16 Contours were drawn around the target lesion in each slice using the polygon tool and/or the paintbrush tool. The lesions were identified by extra-axial, dural-based mass lesions, most of which demonstrated homogenous enhancement with some internal flow voids due to vascularity. If the meningioma made contact with critical structures, but did not invade or surround the critical structure, segmentation did not include these in the measurement. If there was radiological invasion/involvement, then the enhancing component of the lesion was included in the contours of the segmentation. This applied to vascular structures, such as the superior sagittal, transverse, sigmoid and cavernous sinuses or confluence of dural venous sinuses. If cortical veins made contact with, but were not surrounded by the lesions, then these were not included in the volumetric measurement. Adjacent enhancing dural tails were not included in measurement. Measurement of intraosseous components or adjacent bony hyperostosis was not included. The meningioma in the publicly available dataset were segmented by the primary developer and appropriateness of this segmentation was confirmed by a neuroradiologist.
Mathematical model
The mathematical segmentation method, proposed by Roberts and Spencer,
17
was used to segment meningioma in a semi-automatic fashion. The method requires a user to manually click on the region of interest in a few slices throughout the volume (3–5 clicks). From the user-provided marker points, an edge weighted geodesic distance was calculated. This served as a distance constraint in order to penalise objects away from the region of interest. The marker points also allowed us to initialise the model close to the minimum (though this is not strictly necessary, as the model is globally convex). With the geodesic distance, we ran the variational model to produce a segmentation result. A summary is found in Figure 1, and in the following, we discuss the details mathematically. A schematic representation of the model-based variational approach to meningioma segmentation.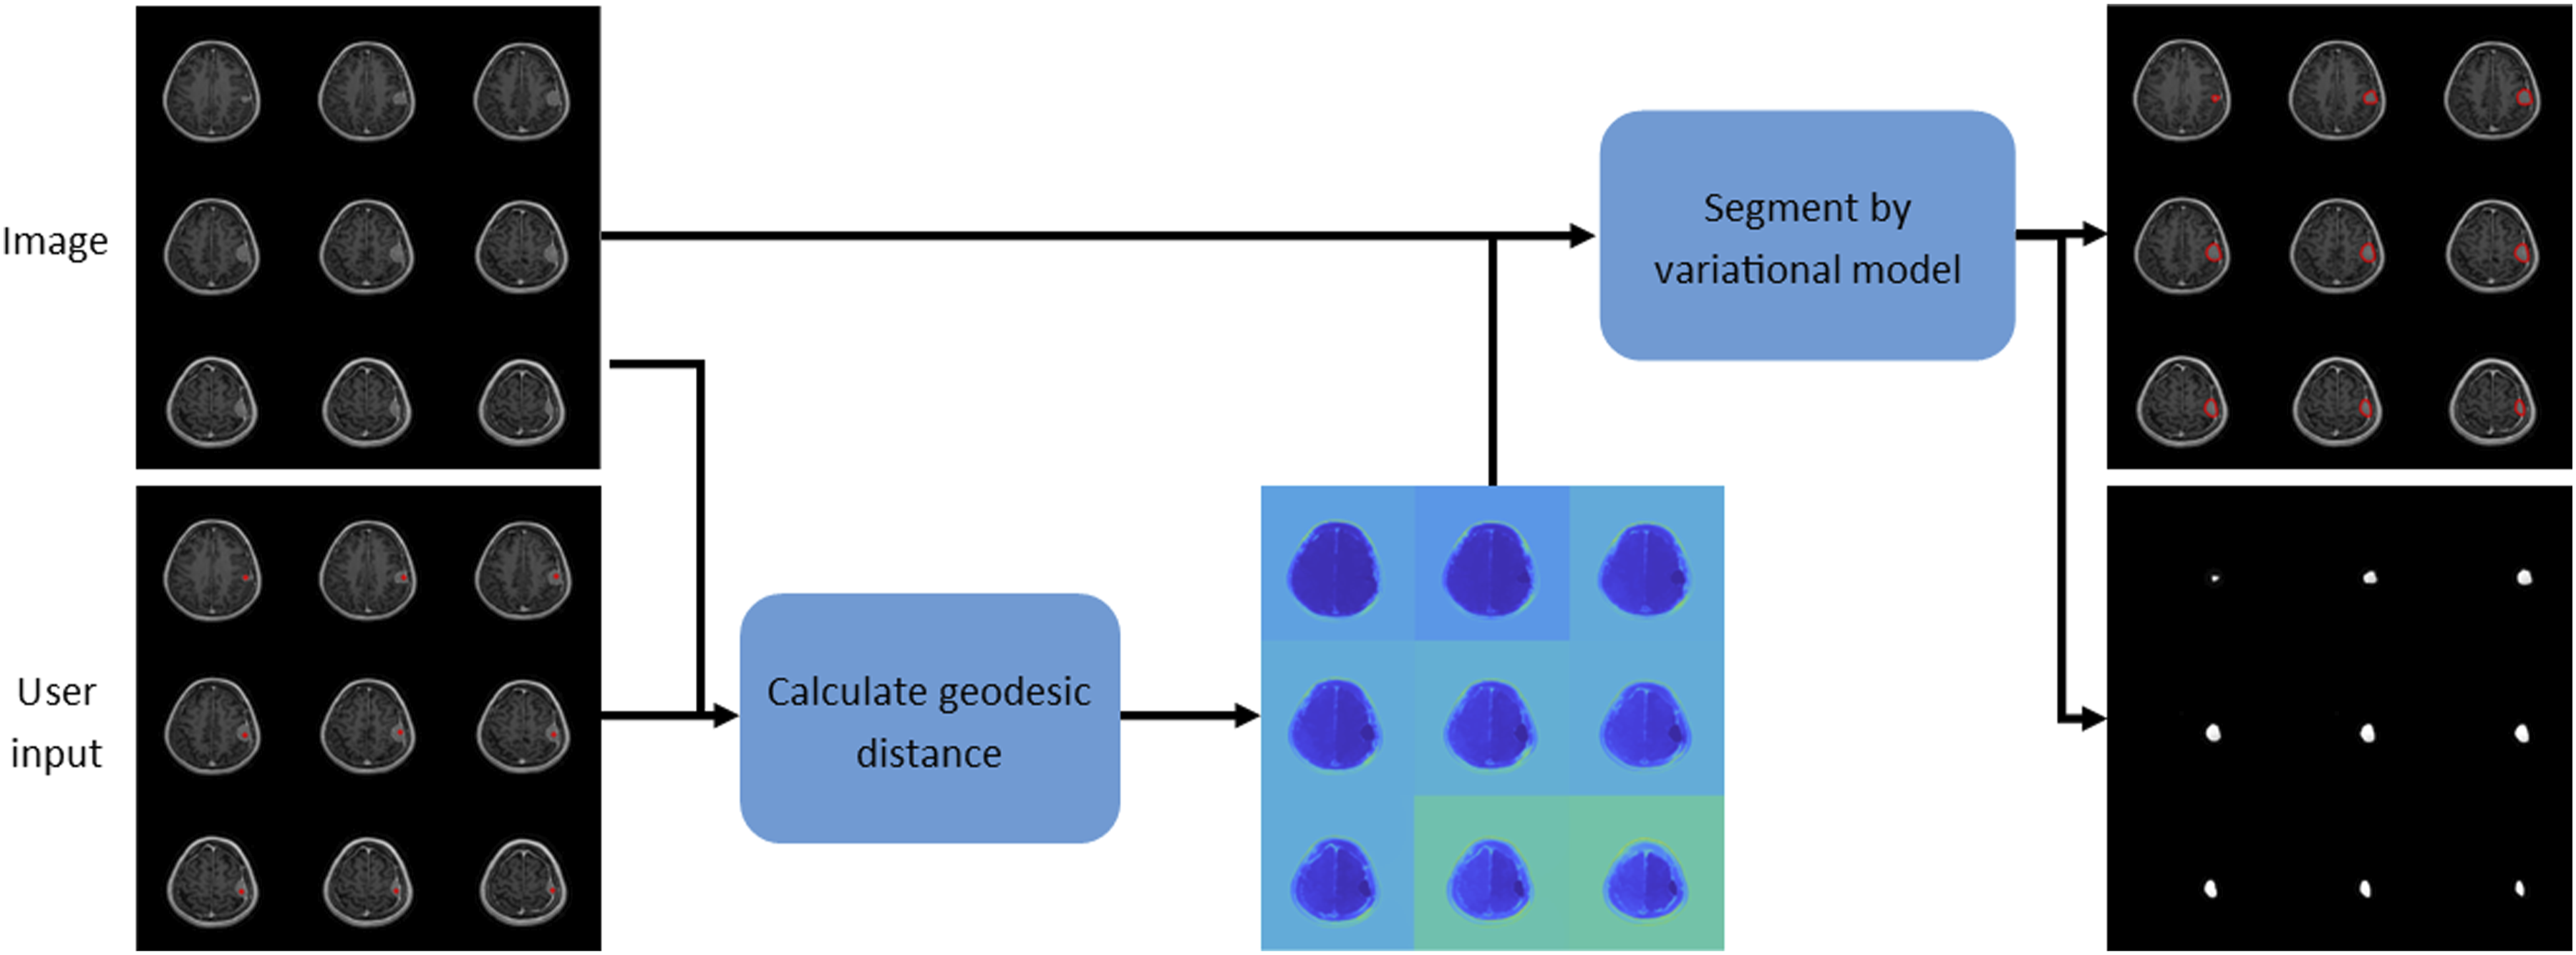
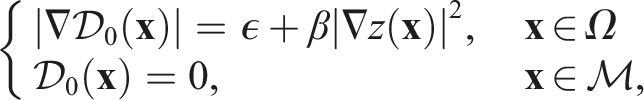
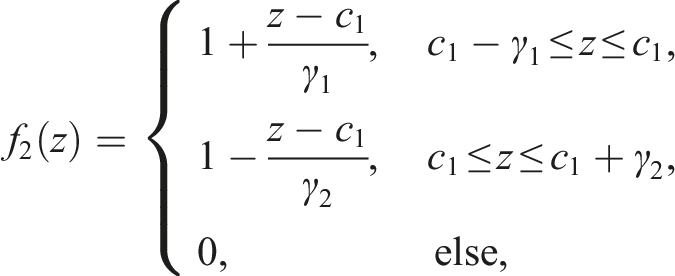
With the Eikonal equation solved, we achieved segmentation by minimising the following energy:
Statistical analysis
Data are presented as number (%), median (interquartile range [IQR]) or mean (standard deviation [SD]) as appropriate. The segmentation results were compared using standard metrics including the Sørensen–Dice coefficient (DICE), JACCARD index, volumetric similarity (VS) coefficient and Haussdorff distance (HD). 19 Both DICE and JACCARD scores range between 0 (where no overlap between compared segmentation results occurs) and 1 (where the two segmentation results are an exact match). VS represents how similar the volumes of the segmented outputs are, not influenced by the overlap. This also ranges from 0 to 1, the latter being an identical volumetric match. HD describes the largest distance from one volume to the nearest point in the other. The ideal result of HD is a score of 0, as the voxels of the two segmentation results would be in the same place. Bland–Altman plots were constructed to visualise the differences between the volumetric measurements.
Results
Study participants
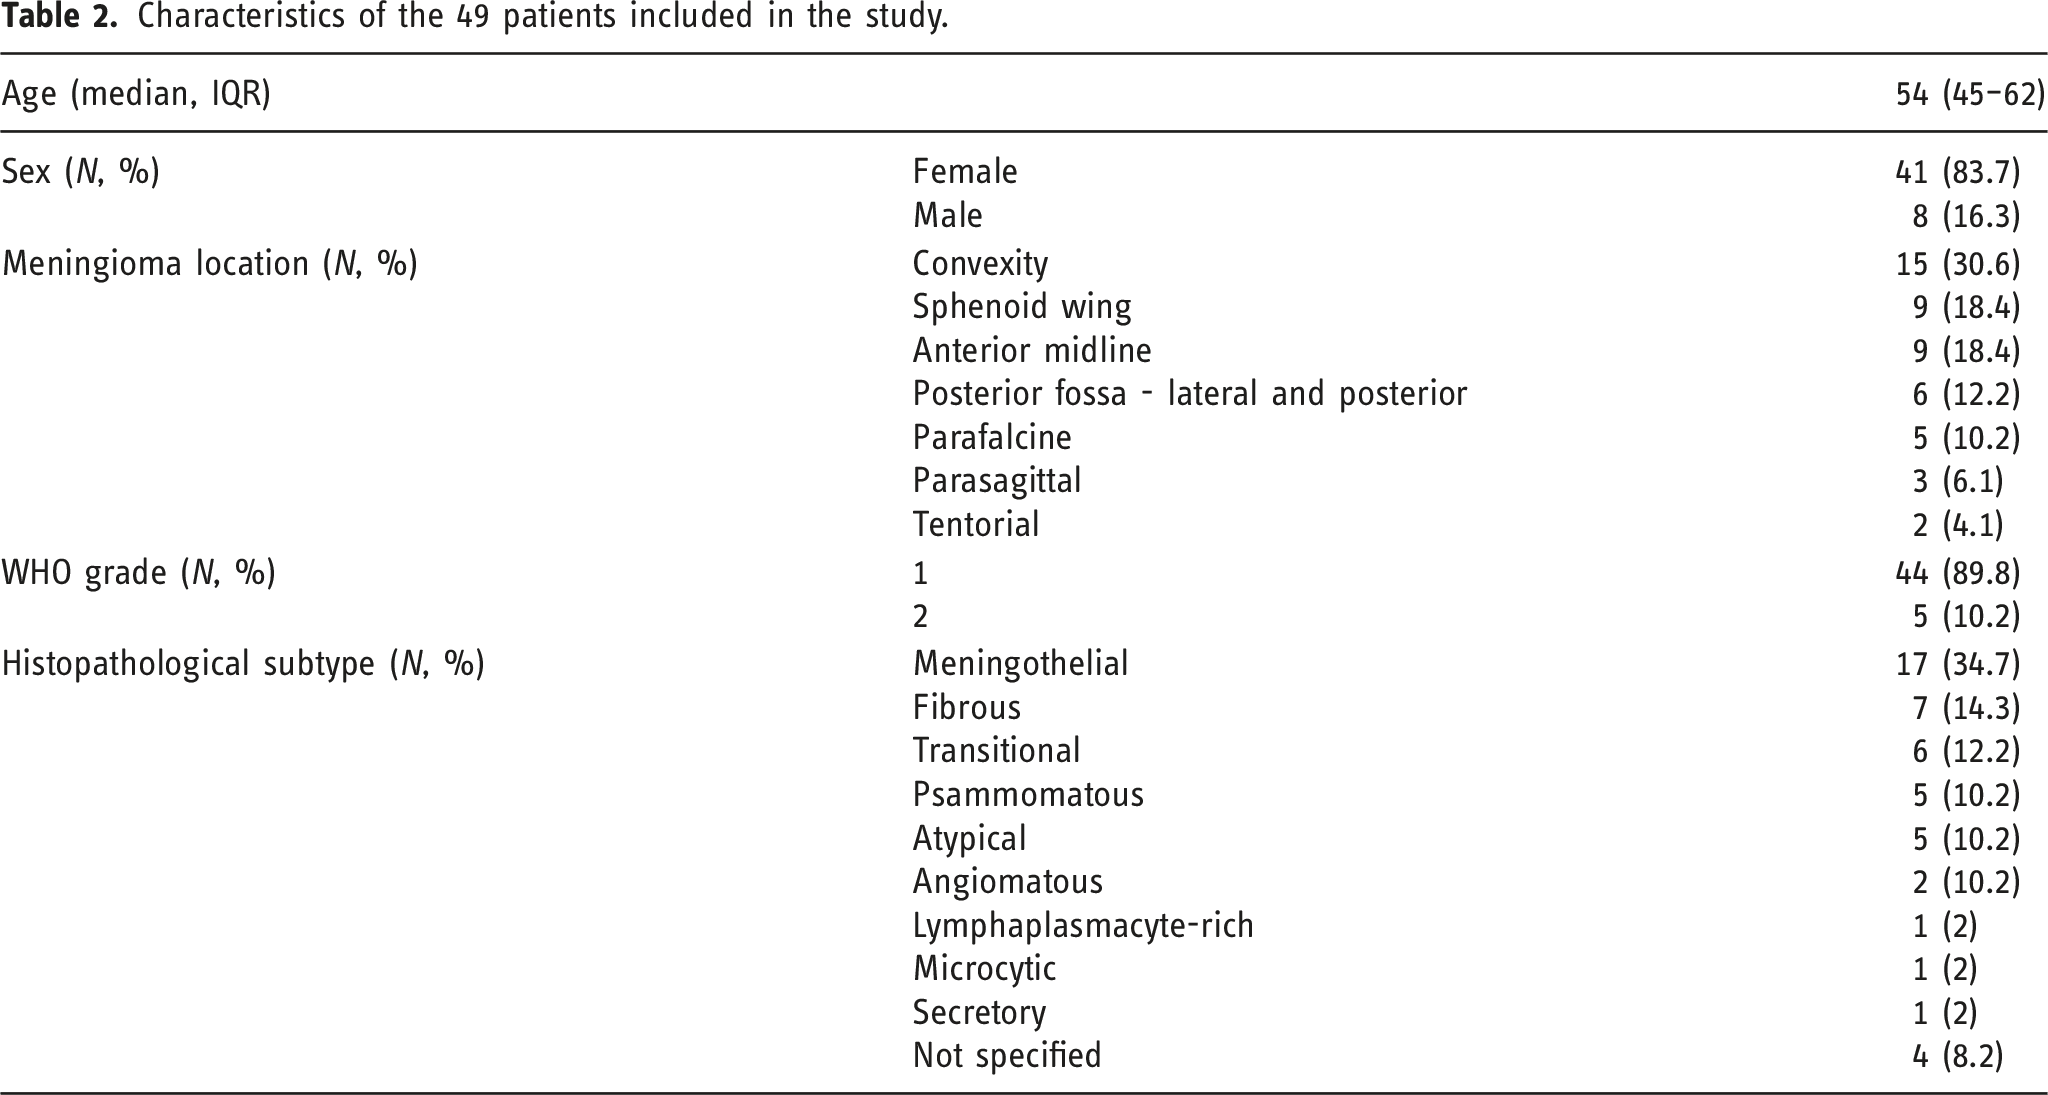
Characteristics of the 49 patients included in the study.
Volume calculations
All but one tumour could be segmented using the mathematical model. A patient with a convexity meningioma (case 5, Figure 2) could not have their meningioma segmented due to lack of uptake of contrast by the tumour. For the remaining cases, the median meningioma volume by manual segmentation was 19.0 cm3 (IQR 4.9–31.2). The median meningioma volume using the mathematical model was 16.9 cm3 (IQR 4.6–28.4). Examples of 5 meningioma from the first dataset with their segmentation results using the mathematical model. Each panel represents a meningioma. The meningioma in the last panel could not be segmented due to the lack of contrast uptake.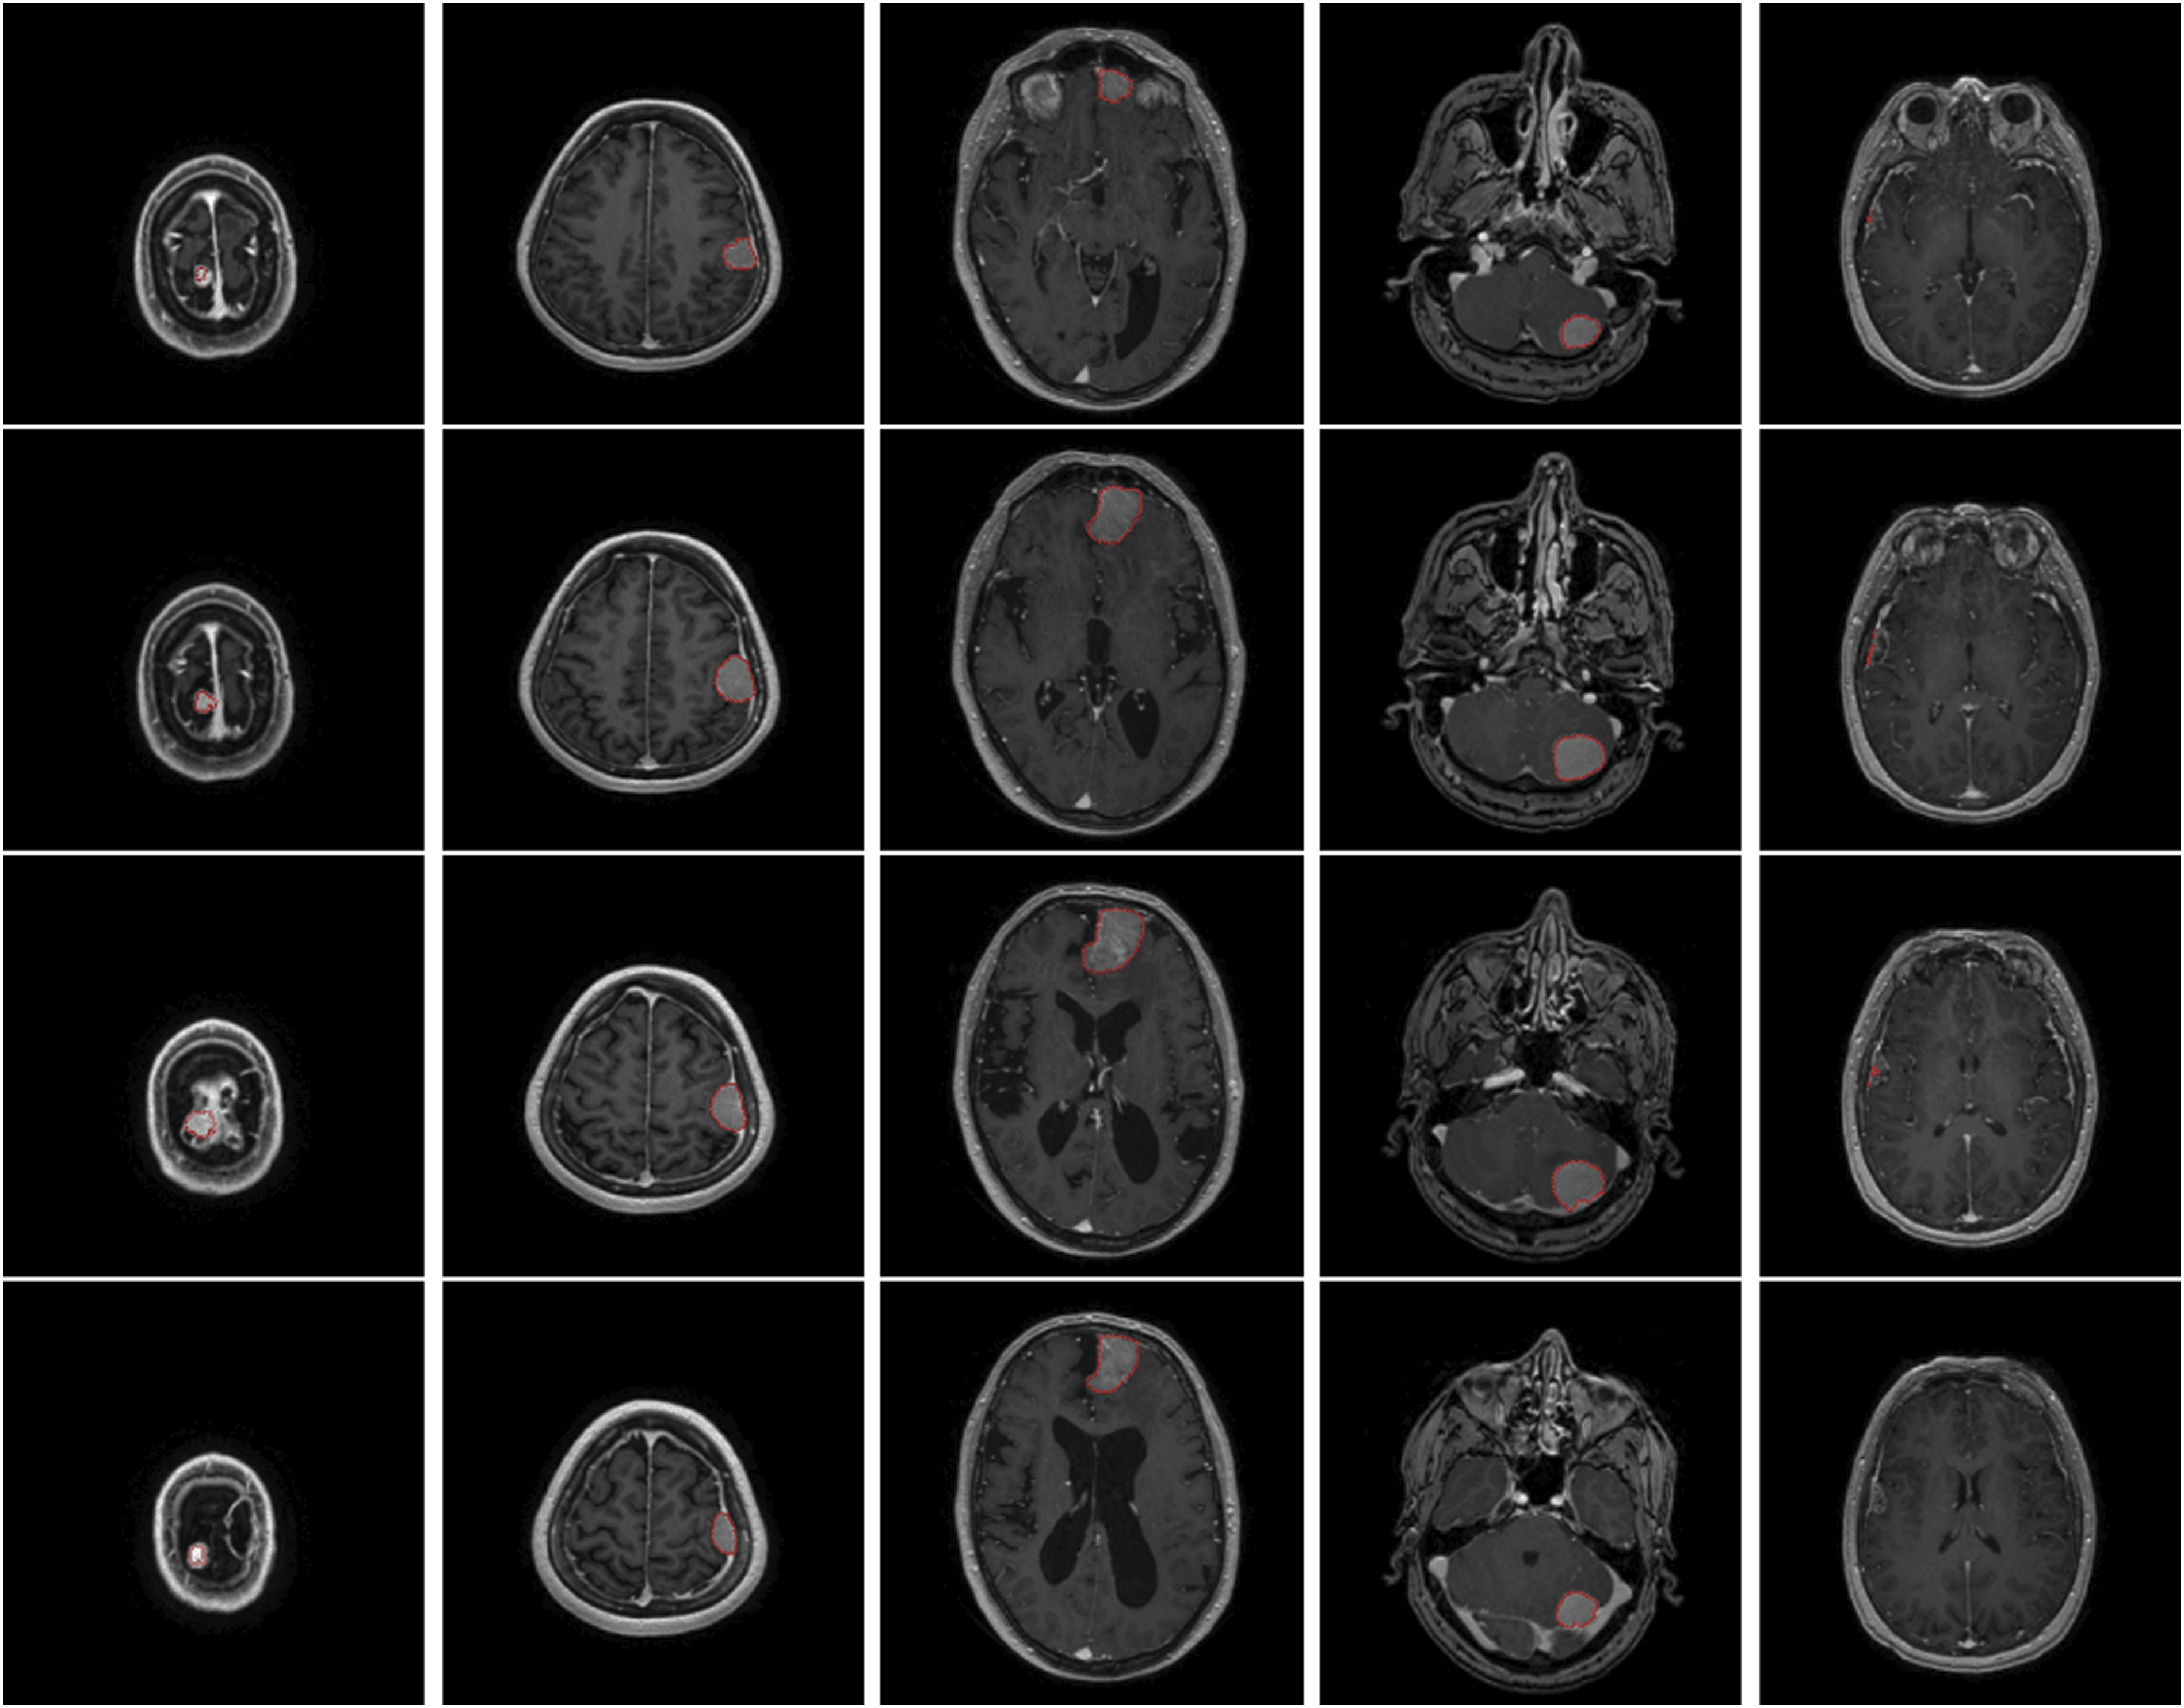
Segmentation comparisons
The mean DICE and JACCARD scores were 0.90 (SD = 0.04) and 0.82 (SD = 0.07), respectively. The mean VS was 0.94 (SD = 0.04). The mean HD was 11.4 (SD = 23.6). The Bland–Altman plot (Figure 3) demonstrates the spread of differences in meningioma volumes. For 46 cases, the difference was between the 95% confidence interval (CI) (−7.6 to 3). Three cases fell outside of the 95% CI. Only 2D slices were available for the public dataset; therefore, volumetric calculations were not possible. However, mean DICE, JACCARD and HD scores were 0.90 (SD = 0.06), 0.82 (SD = 0.10) and 6.08 (SD = 4.6), respectively. The time taken to manually segment a meningioma by a neuroradiologist ranged from 5 to 15 min. The segmentation by the mathematical model required 3–5 clicks in different slices throughout the meningioma volume. This was performed in less than a minute across all cases. A Bland–Altman plot representing the difference in meningioma volumes by the two segmentation methods. The dotted line represents the average difference in meningioma volume. The dashed lines represent the 95% confidence intervals.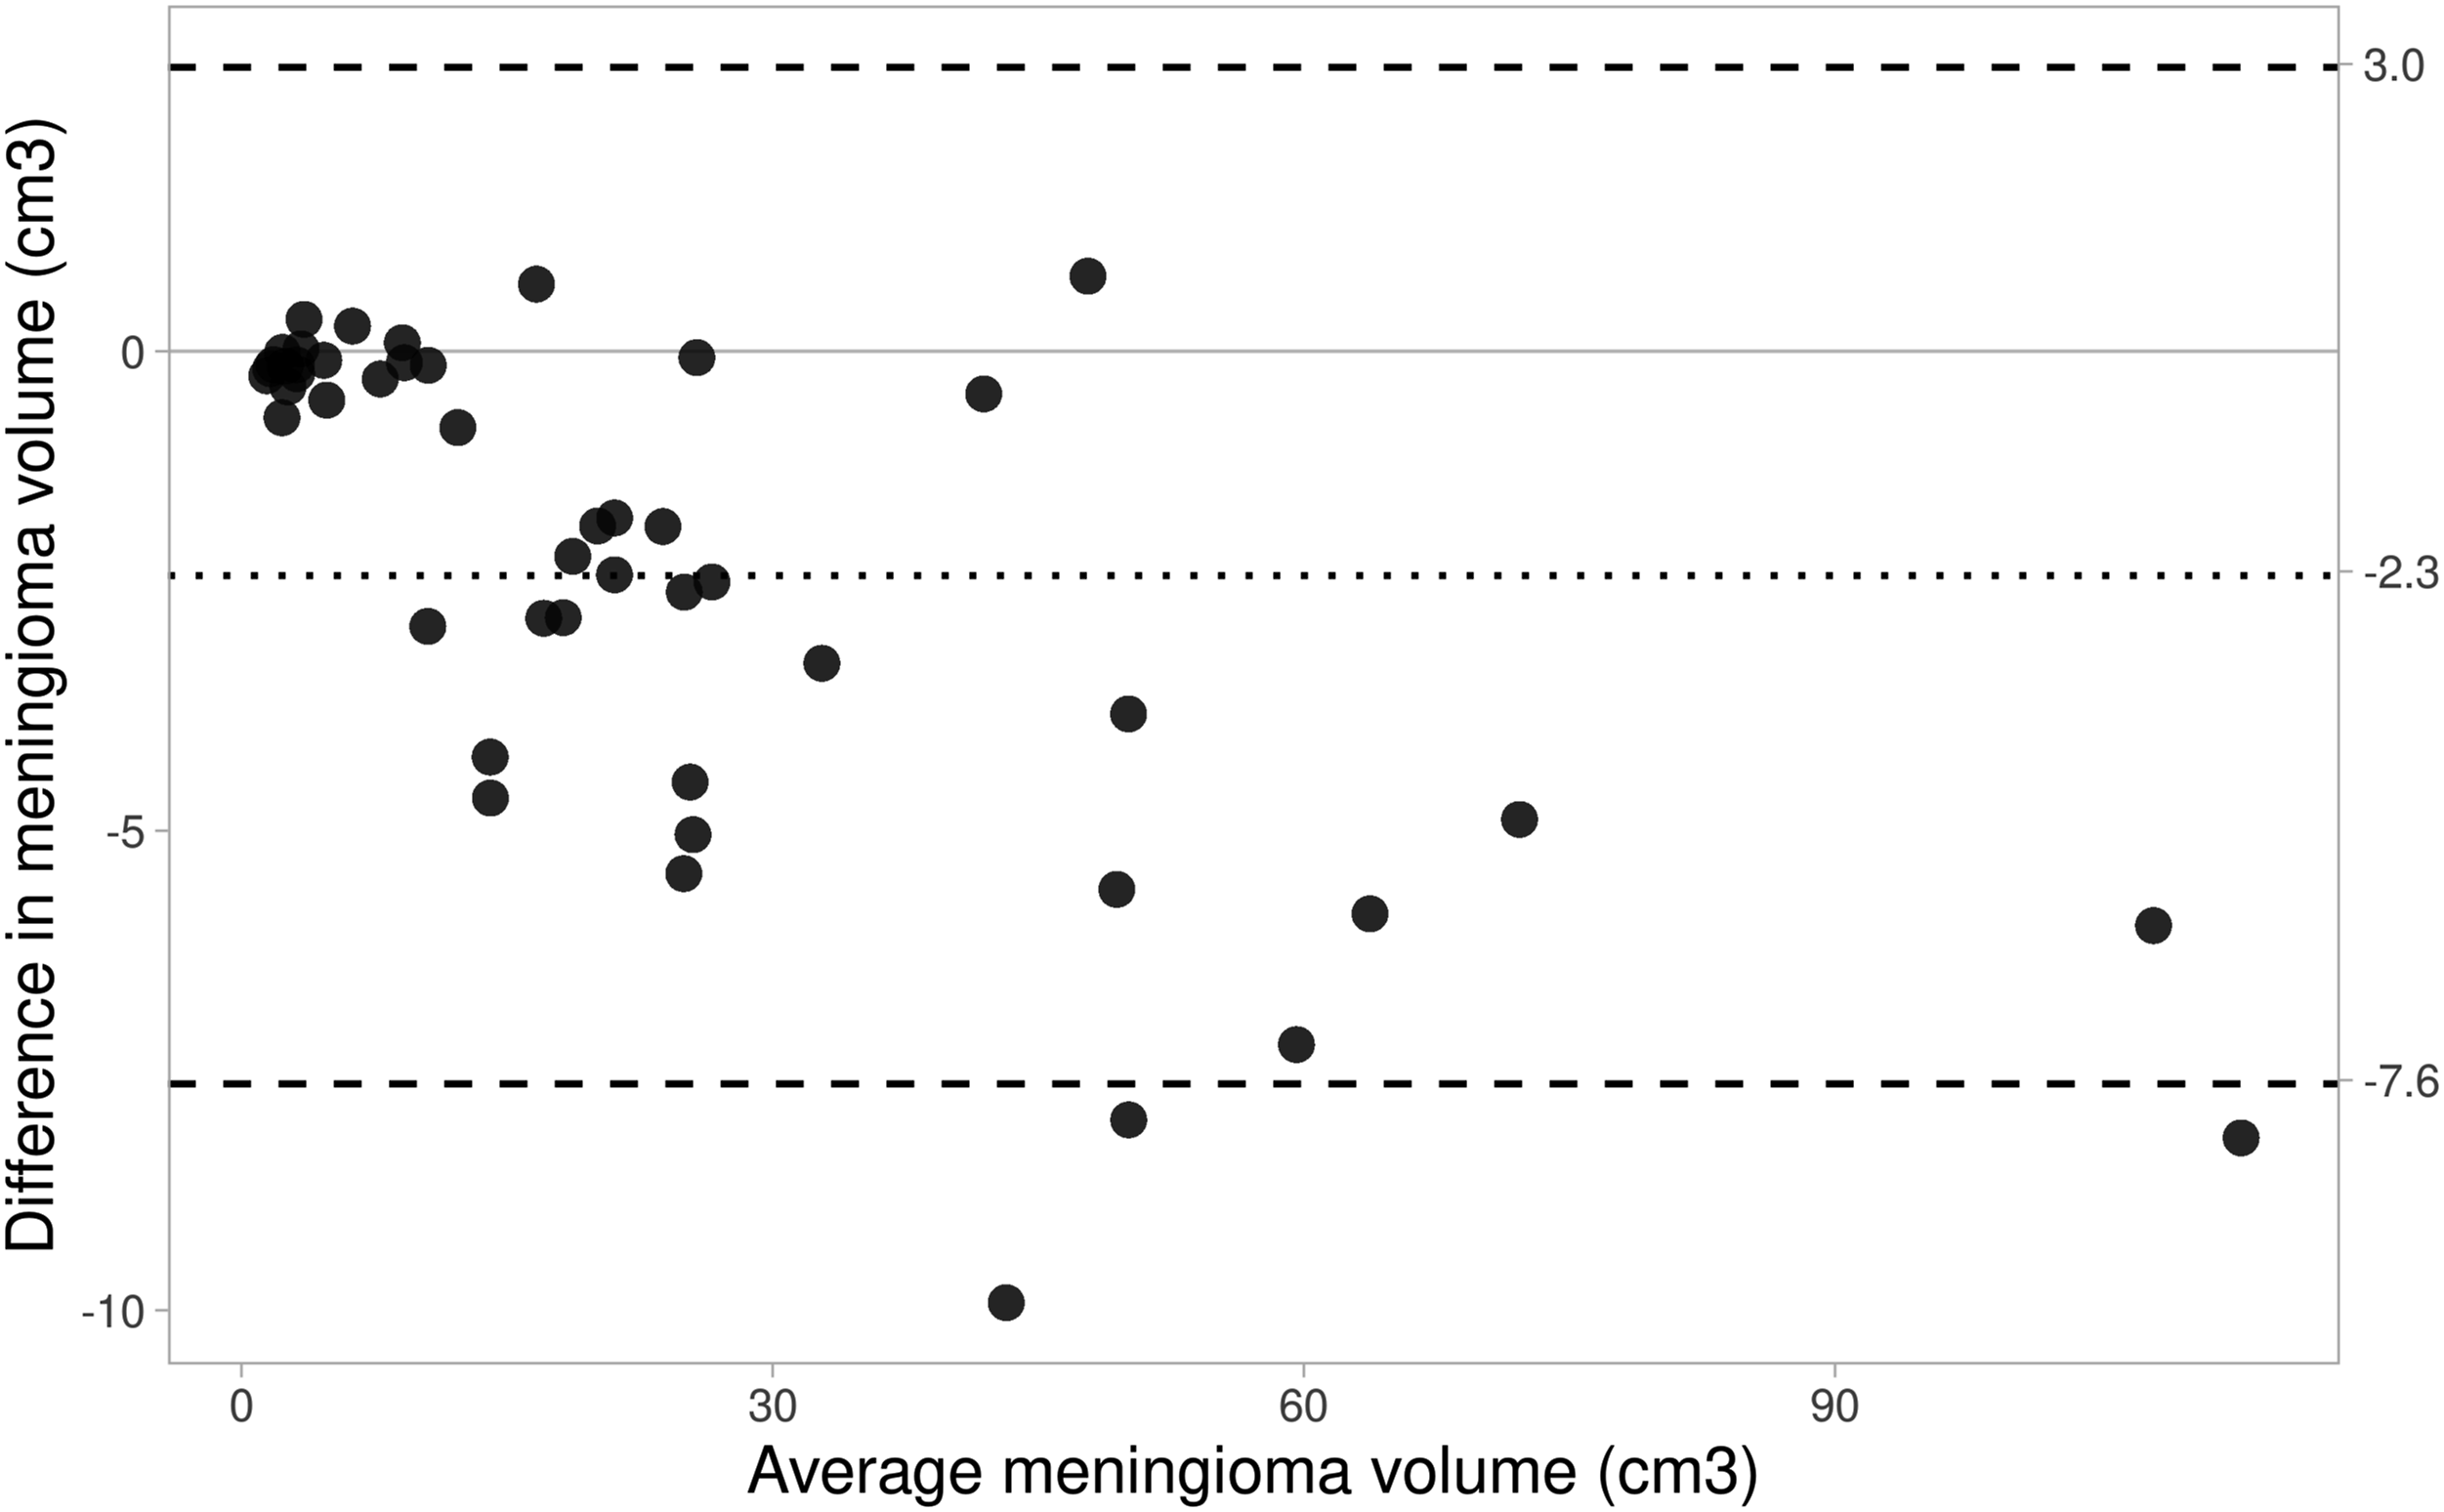
Discussion
In this study, we have demonstrated the use of a robust variational model for meningioma segmentation. The variational model presents several advantages over manual segmentation: namely, the computation time and the time taken for the user to interact with the algorithm. The variational model only needs two to four user clicks throughout a handful of slices in the image, whereas the manual model requires careful supervision by a user throughout the process. We have demonstrated that the variational model can produce an output which is as similar in segmentation and volume measurement to manual segmentation proving that clinically relevant information can be drawn from the variational model to be used in practice in a more efficient manner. To the authors’ knowledge, this mathematical segmentation model has not been used for meningioma segmentation on imaging previously.
Comparison to other segmentation models
Comparison of meningioma segmentation algorithms is challenging as there is no common public database with an established evaluation metric available. The widely used Multimodal Brain Tumor Segmentation Challenge dataset, 20 though stimulating many works in brain tumour segmentation, contains only gliomas and not meningiomas.
Early work segmenting brain tumours include the work by Kaus et al., 21 who segmented the region of interest on spoiled gradient recalled images by using atlas-based methods and registration, followed by simple operations such as morphological operations and region growing methods as post-processing. The algorithm developed was based mainly on glioma (6 meningioma and 14 glioma patients), making it less applicable to patients with meningioma. Another work by Hsieh et al. used both T1 and T2-weighted MR images to segment the meningioma region automatically, 22 using fuzzy c-means clustering, followed by region growing and morphological operation (dilation and erosion) to refine the border of the tumour. Their method produces satisfactory results on simple images but struggled where noticeable edema was present. This was likely due to the need for T2-weighted imaging which is more sensitive for detection of edema and therefore may have confounded accurate contouring of the tumour. Our method required T1 imaging only, and therefore, we did not observe this to be an issue.
Variational approaches have also been considered in the literature. The variational approach by Urien et al. is based on the convex relaxed version of the Chan–Vese model.23,24 The segmentation model assumes 4-phases, performed on contrast-enhanced T1-weighted MR images. In addition, the model itself contains a spatially adaptive parameter which depends on a corresponding positron emission tomography (PET) scan. The motivation behind including a PET scan was that the higher the intensity value of a pixel in the PET, the more likely that pixel is tumour, and thus, using this information in the segmentation model on the T1 image can supplement and aid the segmentation of the meningioma. Despite this, the authors quoted a relatively low accuracy score. Moreover, PET scanning is not routinely performed for meningioma patients, adding doubt to the applicability of this in clinical practice.
In recent years, deep learning techniques have been generally more popular. One such set of work is by Laukamp et al.,25,26 who used the DeepMedic network architecture using a multimodal dataset (T1, T1 with contrast, T2 and FLAIR) including 126 meningioma patients. Satisfactory results were produced; however, a large amount of preprocessing is necessary, such as atlas registration and skull stripping, which were not features of the model utilised in this study.
Bouget et al. proposed a deep learning method using standard network architectures and simple preprocessing tricks to speed performance up on a large dataset containing 698 contrast-enhanced T1-weighted MRI volumes. 27 In follow-up work, 28 they use the same dataset utilising attention gated mechanisms on top of standard U-Net architectures. They quote an average DICE score of 0.82 and claim a near perfect detection of meningioma greater than 3 cm3. For meningioma smaller than 3 cm3, their method is susceptible to failing to detect them. This is likely the result of a bias in the training set (lack of small meningiomas in the data), as well as limitations in the number of voxels to compute features from in the network. Conversely, we did not observe a performance bias towards smaller or larger tumours in our model.
Another recent work by Chen et al. uses a U-Net like architecture to segment tumour images, 29 but also uses a further network to assign a grade to each tumour. A DICE score of 0.87 is quoted for the 3D network on 18 low grade meningioma, proving to be an effective method. However, the authors note that their model failed to segment the tumour section where: the tumour was adjacent to the thickening of the dura mater, located in the anterior skull base, or had certain high-grade meningioma features such as necrosis. The number of each case fulfilling these criteria were not provided and so the number of patients with a successful segmentation could not be estimated. Like the limitations in the study by Bouget et al., these were likely due to a lack of training data for these particular cases, demonstrating a flaw of the deep learning approaches.
Clinical utility, study limitations and future work
Active monitoring of an incidental meningioma is the recommended management choice. 1 Sustained growth is the most common indication for intervention in these cases. 2 The National Cancer Institute recommends the use of volumetric imaging to monitor tumours like meningioma; 7 however, this is limited by the time taken to perform manual segmentation by neuroradiologists. The variational model employed in this study demonstrated accurate delineation of meningioma volume. There were several limitations. Firstly, the study sample size was relatively small; however, it included a variety of meningioma locations and volumes. Secondly, one patient (4.5%) had a microcystic meningioma, and these do not take up gadolinium contrast, which limited the use of the model. Cystic changes or necrosis within a meningioma impede contrast uptake, and occurs in approximately 10% of patients. 30 For these cases, it may be that segmentation improves with the use of distance constraints inputting ‘antimarkers’ – clicks which the user inputs to indicate the background, and selecting more tumour areas within the slides. Additionally, the fidelity term in such models dictates which pixel intensity to segment. The fidelity in the used model looked for a particular intensity (based on the user input) and segmented similarly coloured pixels. By developing a new fidelity term, for inhomogeneous regions of interest, the model could be adjusted to consider average pixel intensity in a small neighbourhood around each pixel individually, which is more sophisticated. Third, despite validating the model in a large publicly available dataset, the metrics that could be examined revolved around overlap (DICE and JACCARD) and not volumetric similarity; the reason being availability of 2D slices only. Validation, of both overlap and volumetric metrics, in a larger dataset is required.
Conclusion
Meningioma segmentation using a model-based variational approach is possible with accurate results. Results on meningioma show successful segmentation in most cases.
Footnotes
Declaration of conflicting interests
The author(s) declared no potential conflicts of interest with respect to the research, authorship, and/or publication of this article.
Funding
The author(s) received no financial support for the research, authorship, and/or publication of this article.