
Abstract
Prejudices intercorrelate positively and can be modeled as a generalized prejudice (GP) factor that is considered robust and central to postulating that some people are relatively more prejudiced than others (i.e., prejudice is not purely contextual). Although past research documents changes in specific prejudices over time, the field tacitly assumes GP stability/robustness, an untested notion. Using nationally representative American National Election Survey 2004–2020 data (N = 21,998) assessing attitudes toward Black people, illegal immigrants, gay people, and feminists, we discovered that prejudices have become increasingly correlated over time. Initially invariant, from 2012 onward GP became variant and required correlated residuals between prejudices (outside of GP). GP vastly increased its association with political conservatism (≈.41 in 2004–2008, ≈.70 by 2016–2020) but less so with age, sex, and education. Indeed, best fit in 2020 involved a “GP 2.0” factor indicated by specific prejudices and conservatism. Implications regarding the nature of prejudice are discussed.
Whereas a racist, sexist, or homophobic person dislikes a relatively specific target group (e.g., Black people, women, or LGBT people), a bigot is generally someone who expresses prejudices toward a host of groups. Hitler, for instance, was not solely anti-Semitic but also persecuted people who were non-White, queer, Gypsies/Roma, disabled, among others. In modern parlance, relative to others Hitler would be said to score higher in generalized prejudice (GP; see Allport, 1954), the tendency to express prejudicial attitudes toward multiple marginalized groups. 1 Bigoted characters like Hitler draw the fascination of lay people; consider also the acerbic and generally prejudicial character Archie Bunker from the popular TV program All in the Family. Perhaps not surprisingly, psychologists have long studied GP (Allport, 1954; Bergh & Akrami, 2016; Hodson et al., 2017), in no small part because the notion that prejudices correlate in ways that differentiate people from one another has proven to be a robust and reliable finding that challenges theories that instead emphasize the situational/contextual aspects of prejudice (Hodson & Dhont, 2015). The fact that some people, relative to others, score higher on multiple prejudices has been taken to indicate that some aspects of bigotry concern the person.
Conceptually, specific prejudices correlating positively with each other are generally taken to presuppose an underlying latent factor, GP, explaining their covariation. As illustrated in Figure 1A, GP is conceptualized to “cause” specific group attitude scores. (In much the same way, generalized intelligence (g) is modeled to explain covariation between specific ability measures such as verbal, math, and spatial abilities; see Hodson, 2021a.) In doing so, specific prejudices often, but not always, load on the GP factor to a relatively comparable degree (Hodson et al., 2017, Table 2). Reflecting on its factor structure, GP is described as “coherent across contexts and stable over time” (Bergh & Akrami, 2016, p. 439), representing a “robust” phenomenon (Hodson & Dhont, 2015, p. 2; Hodson et al., 2017, p. 243). Indeed, Allport (1954) characterized prejudice generalization as “one of the facts of which we are most certain” (p. 68). Such language connotes a sense of unchanging quality to the nature of GP. Consider also that much of the existing research literature has focused on the roots of GP, largely focusing on variables such as social dominance orientation and right-wing authoritarianism (Bäckström & Björklund, 2007; Ekehammar et al., 2004; McFarland, 2010), themselves constructs assumed and shown to have considerable stability over time, further lending to the impression that GP itself might be stable. Given that GP is also observed at the implicit level (Cunningham et al., 2004) and demonstrates a significantly heritable quality, at least when represented as ingroup favoritism against multiple outgroups (Lewis & Bates, 2010), one could reasonably infer that its factor structure is stable and temporally invariant.
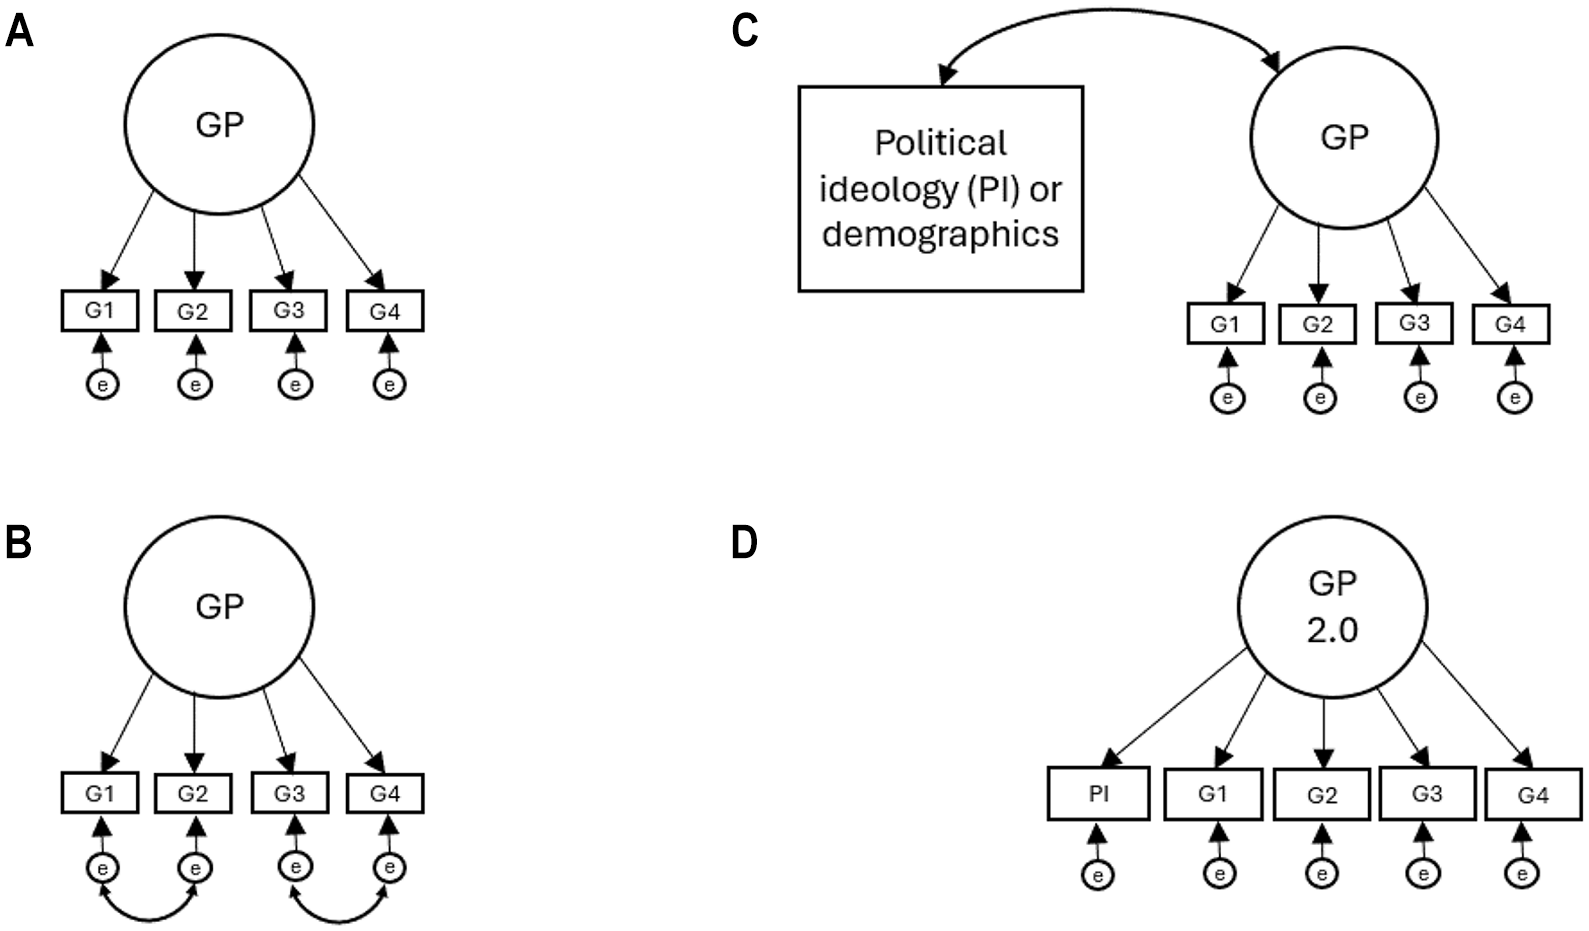
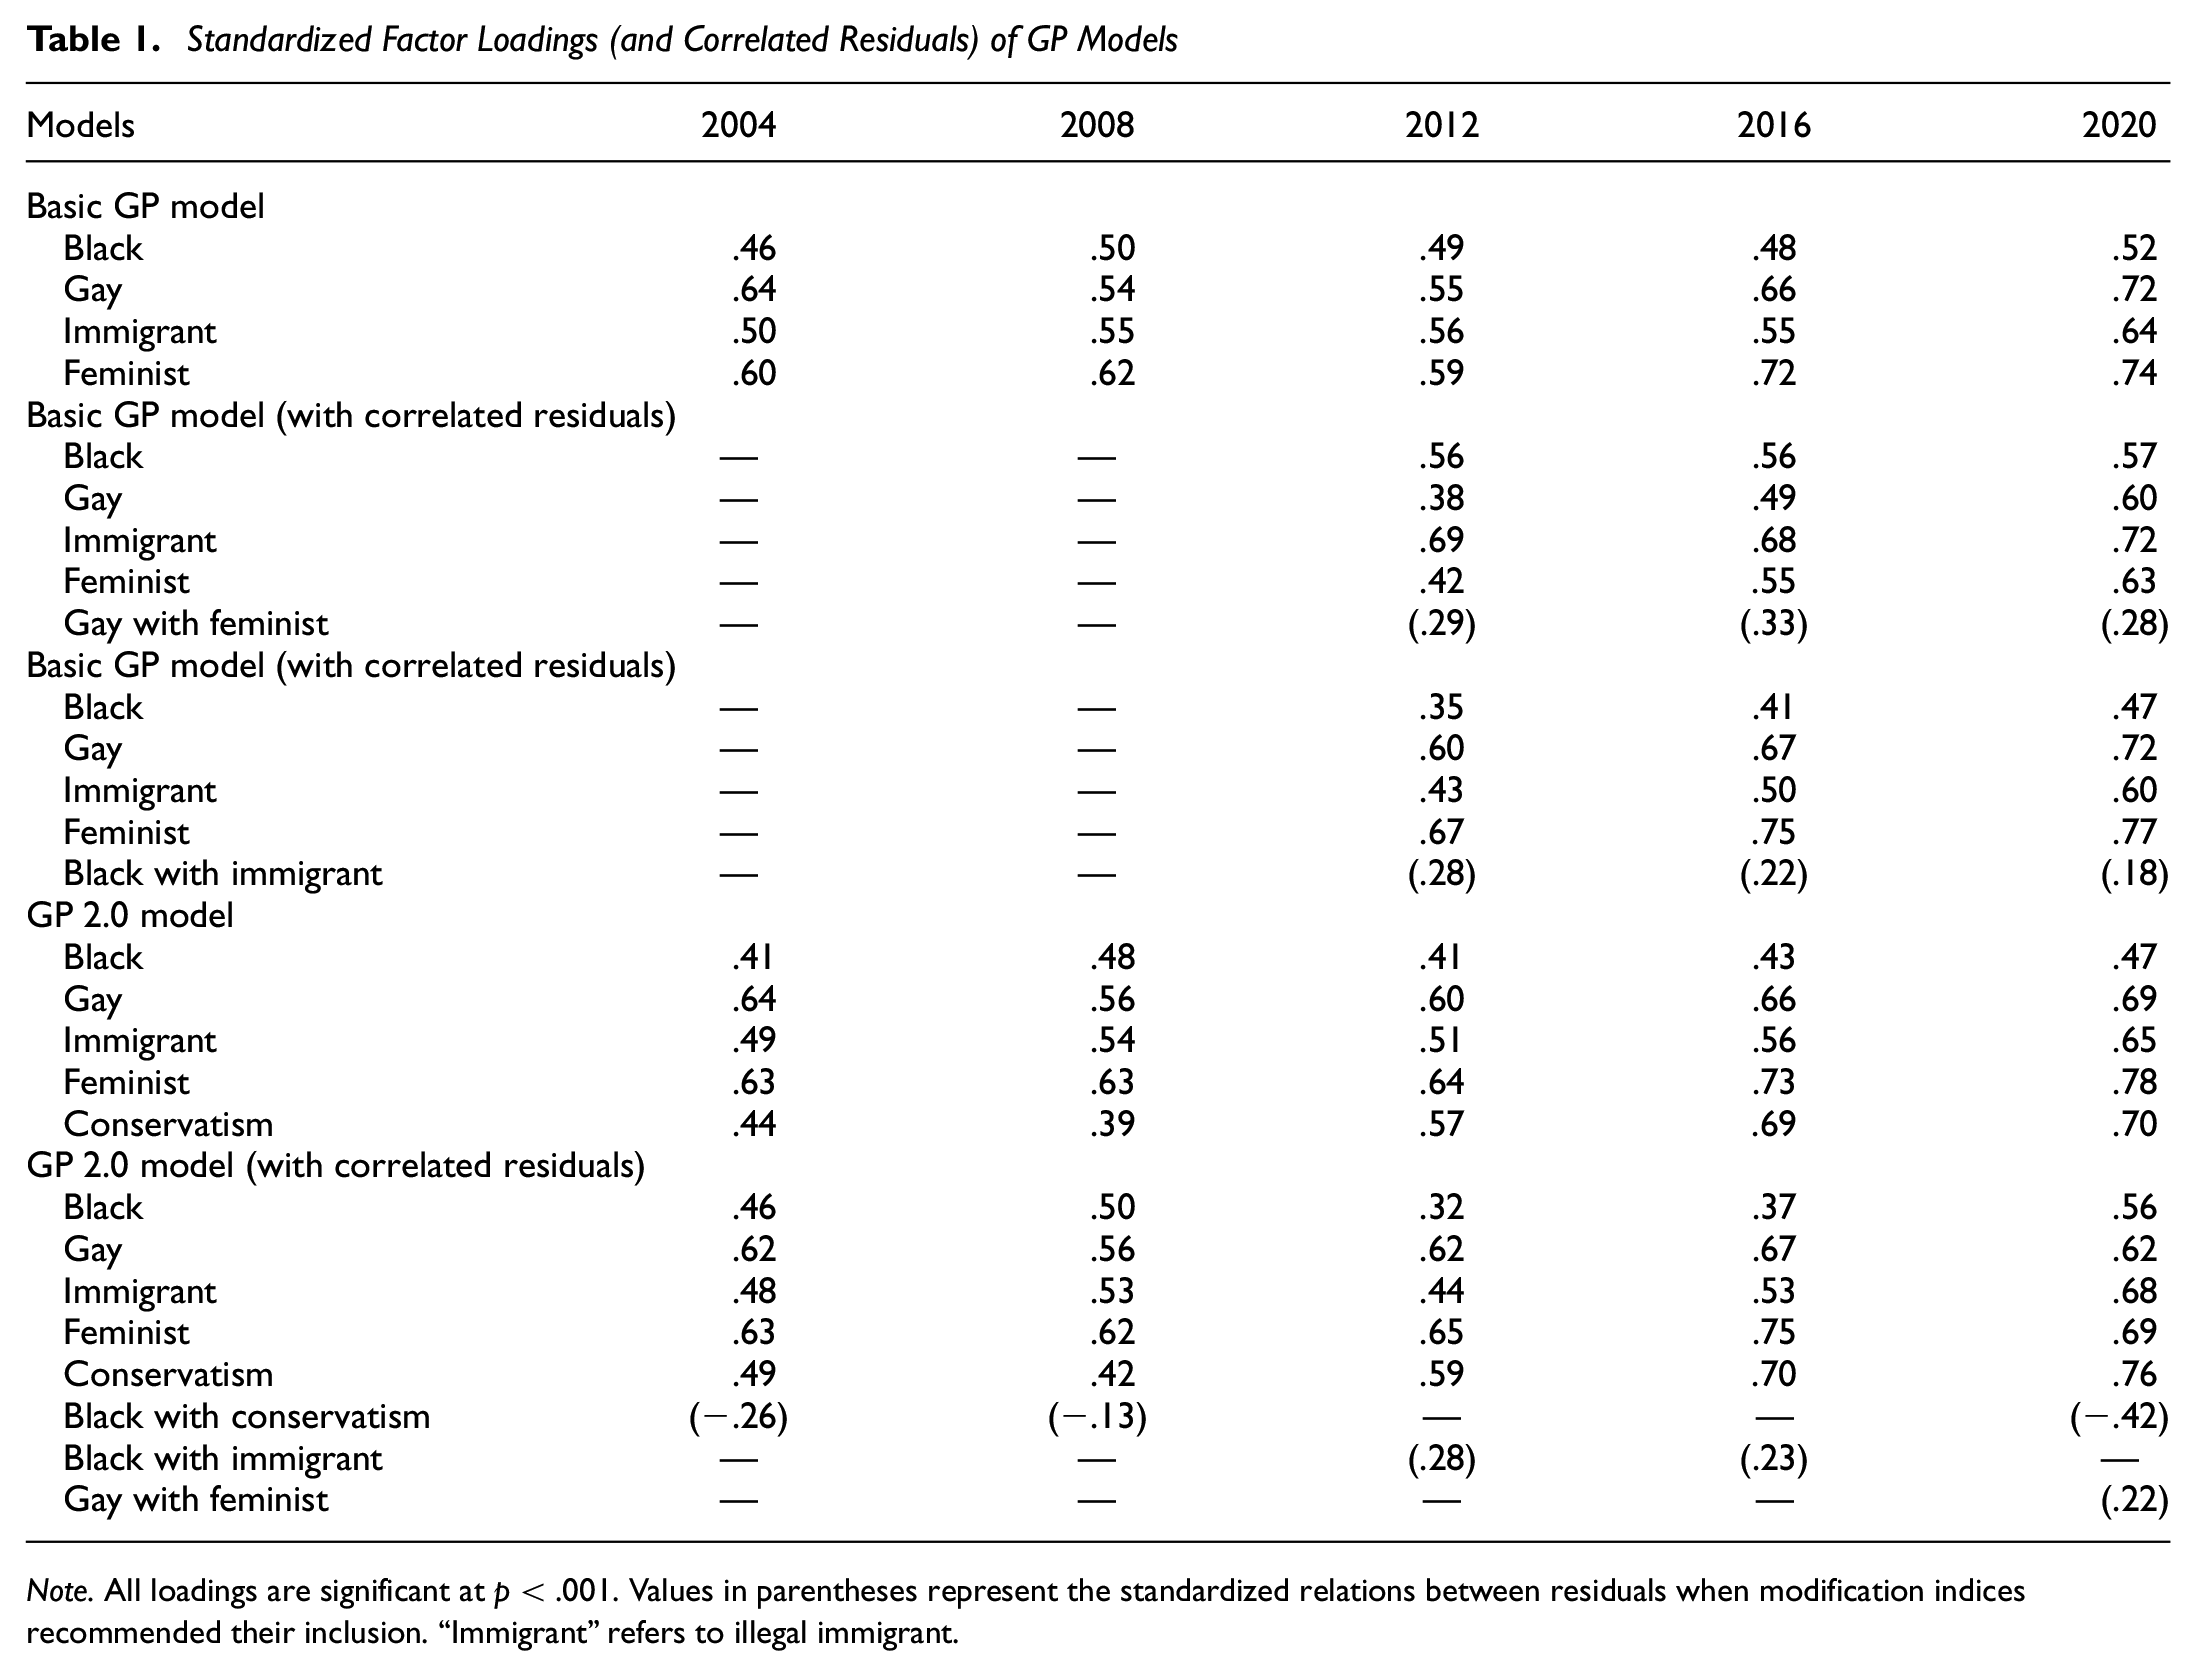
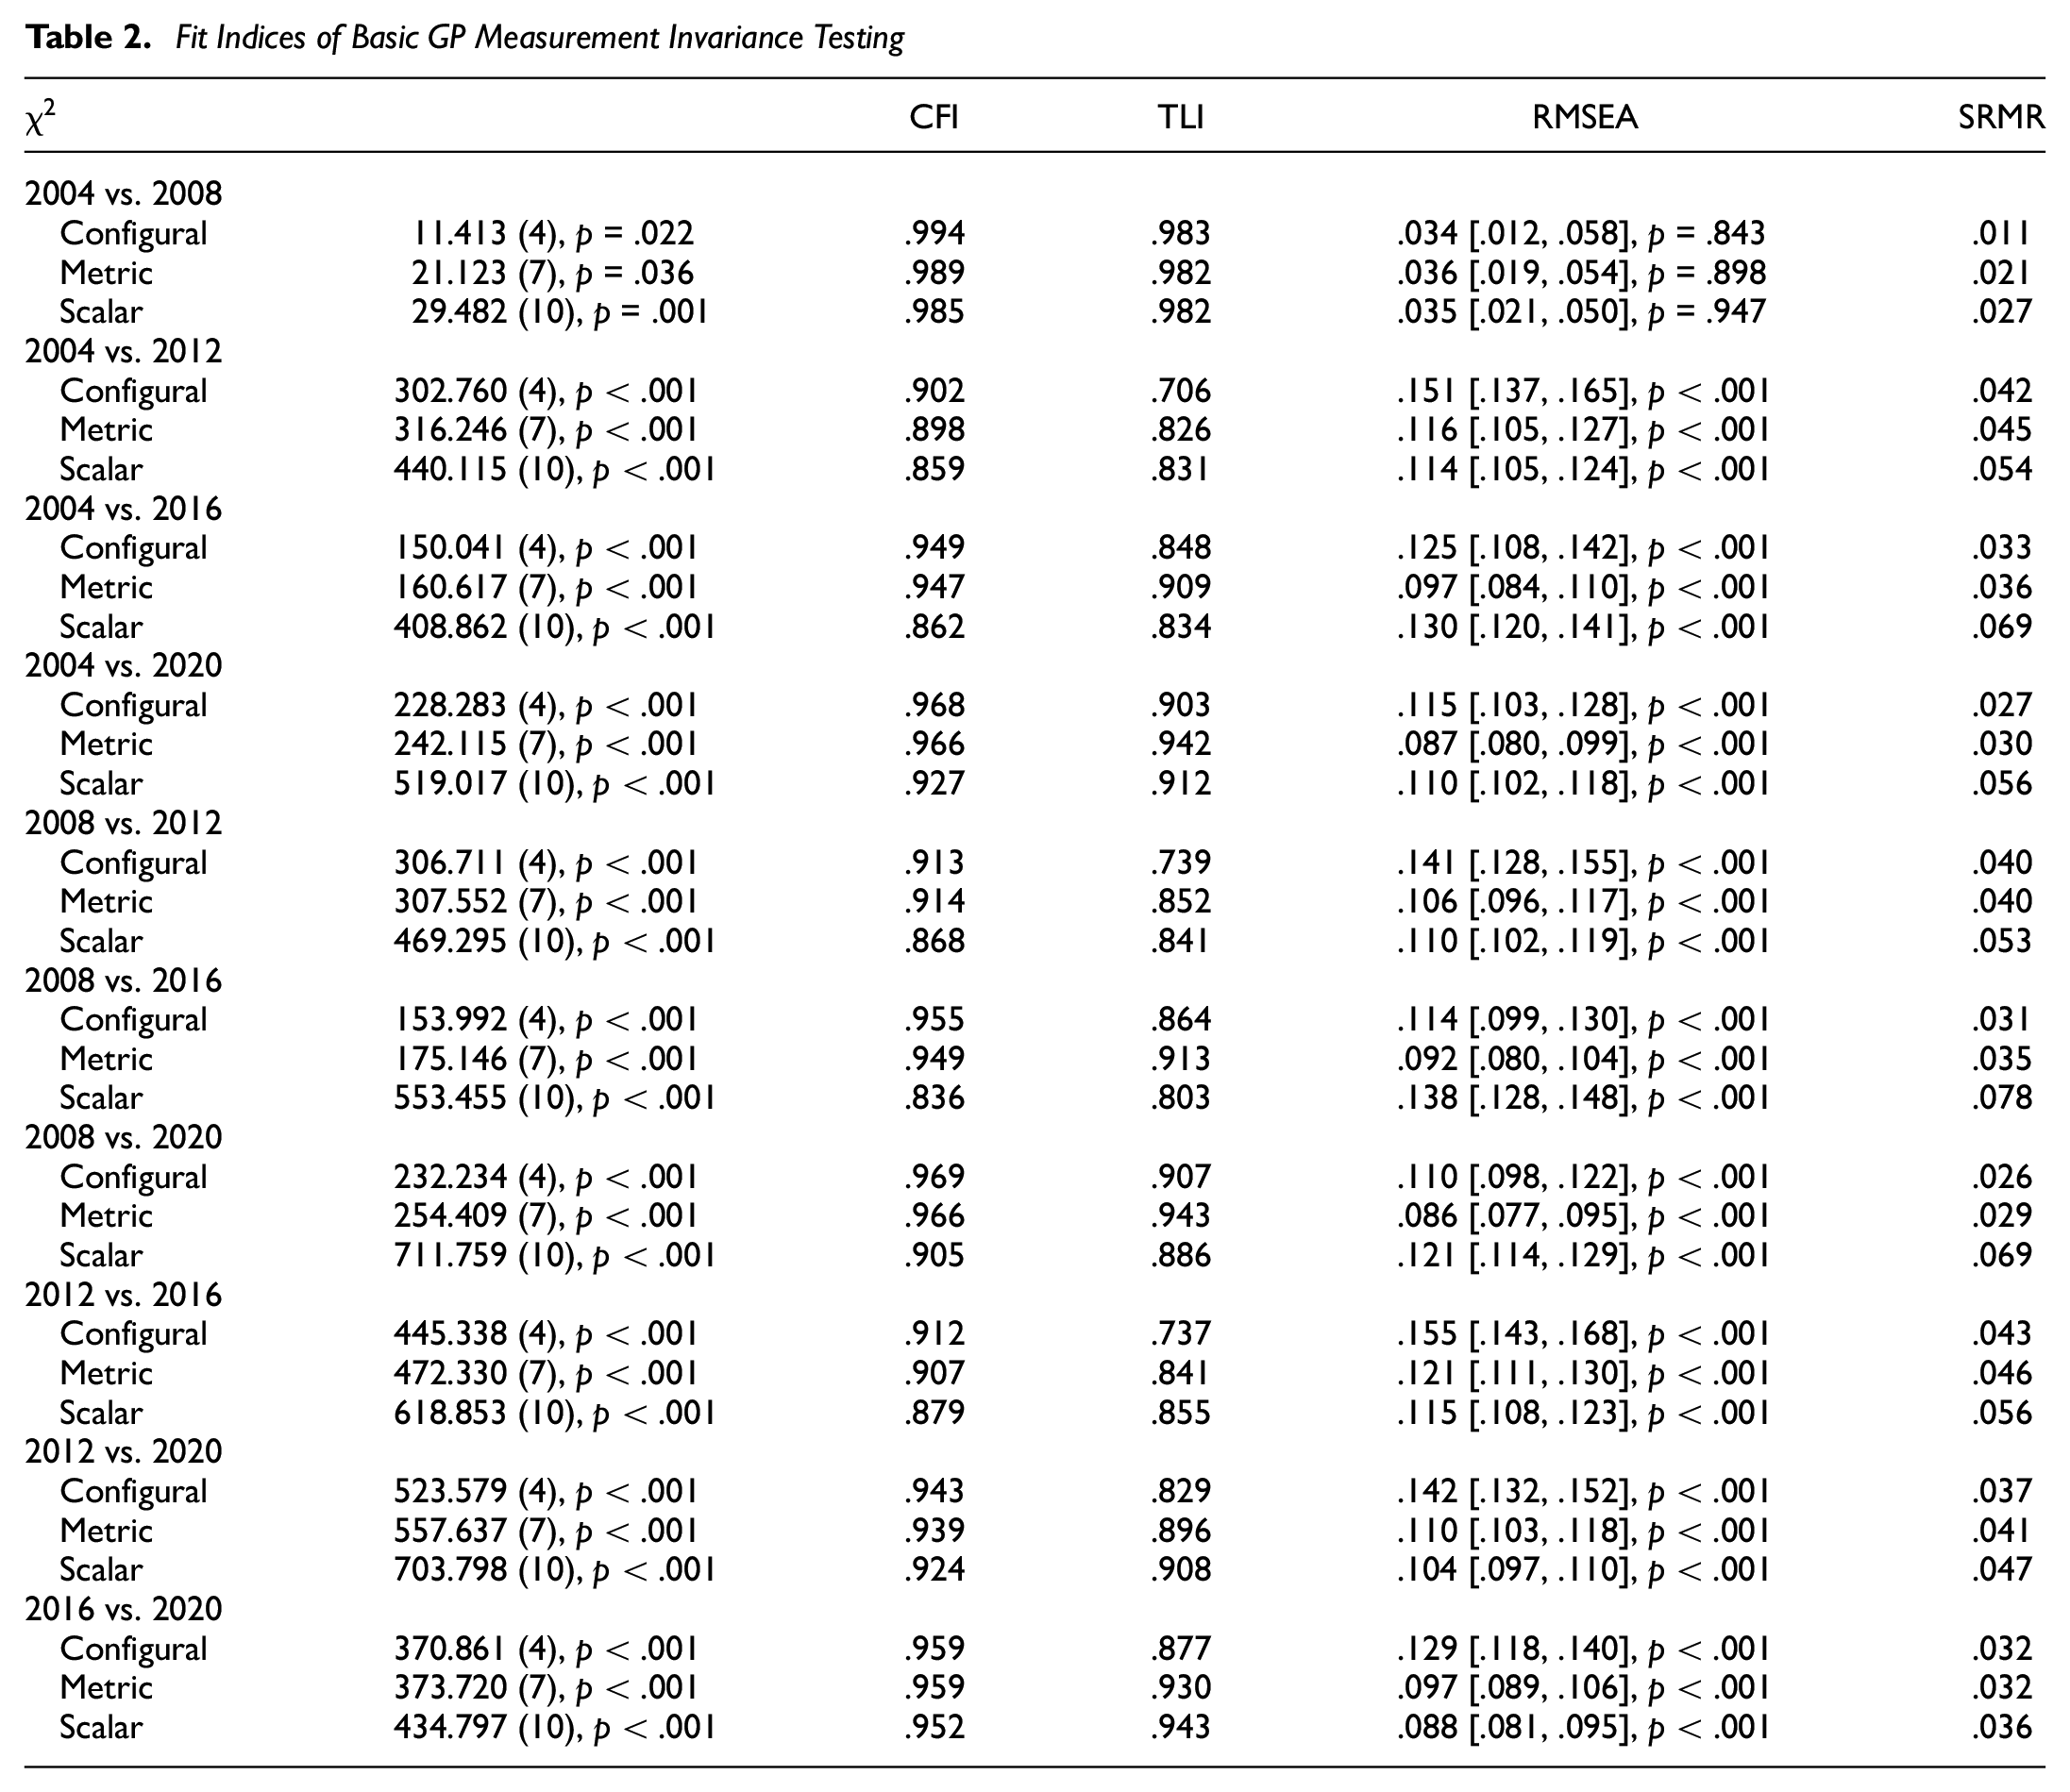
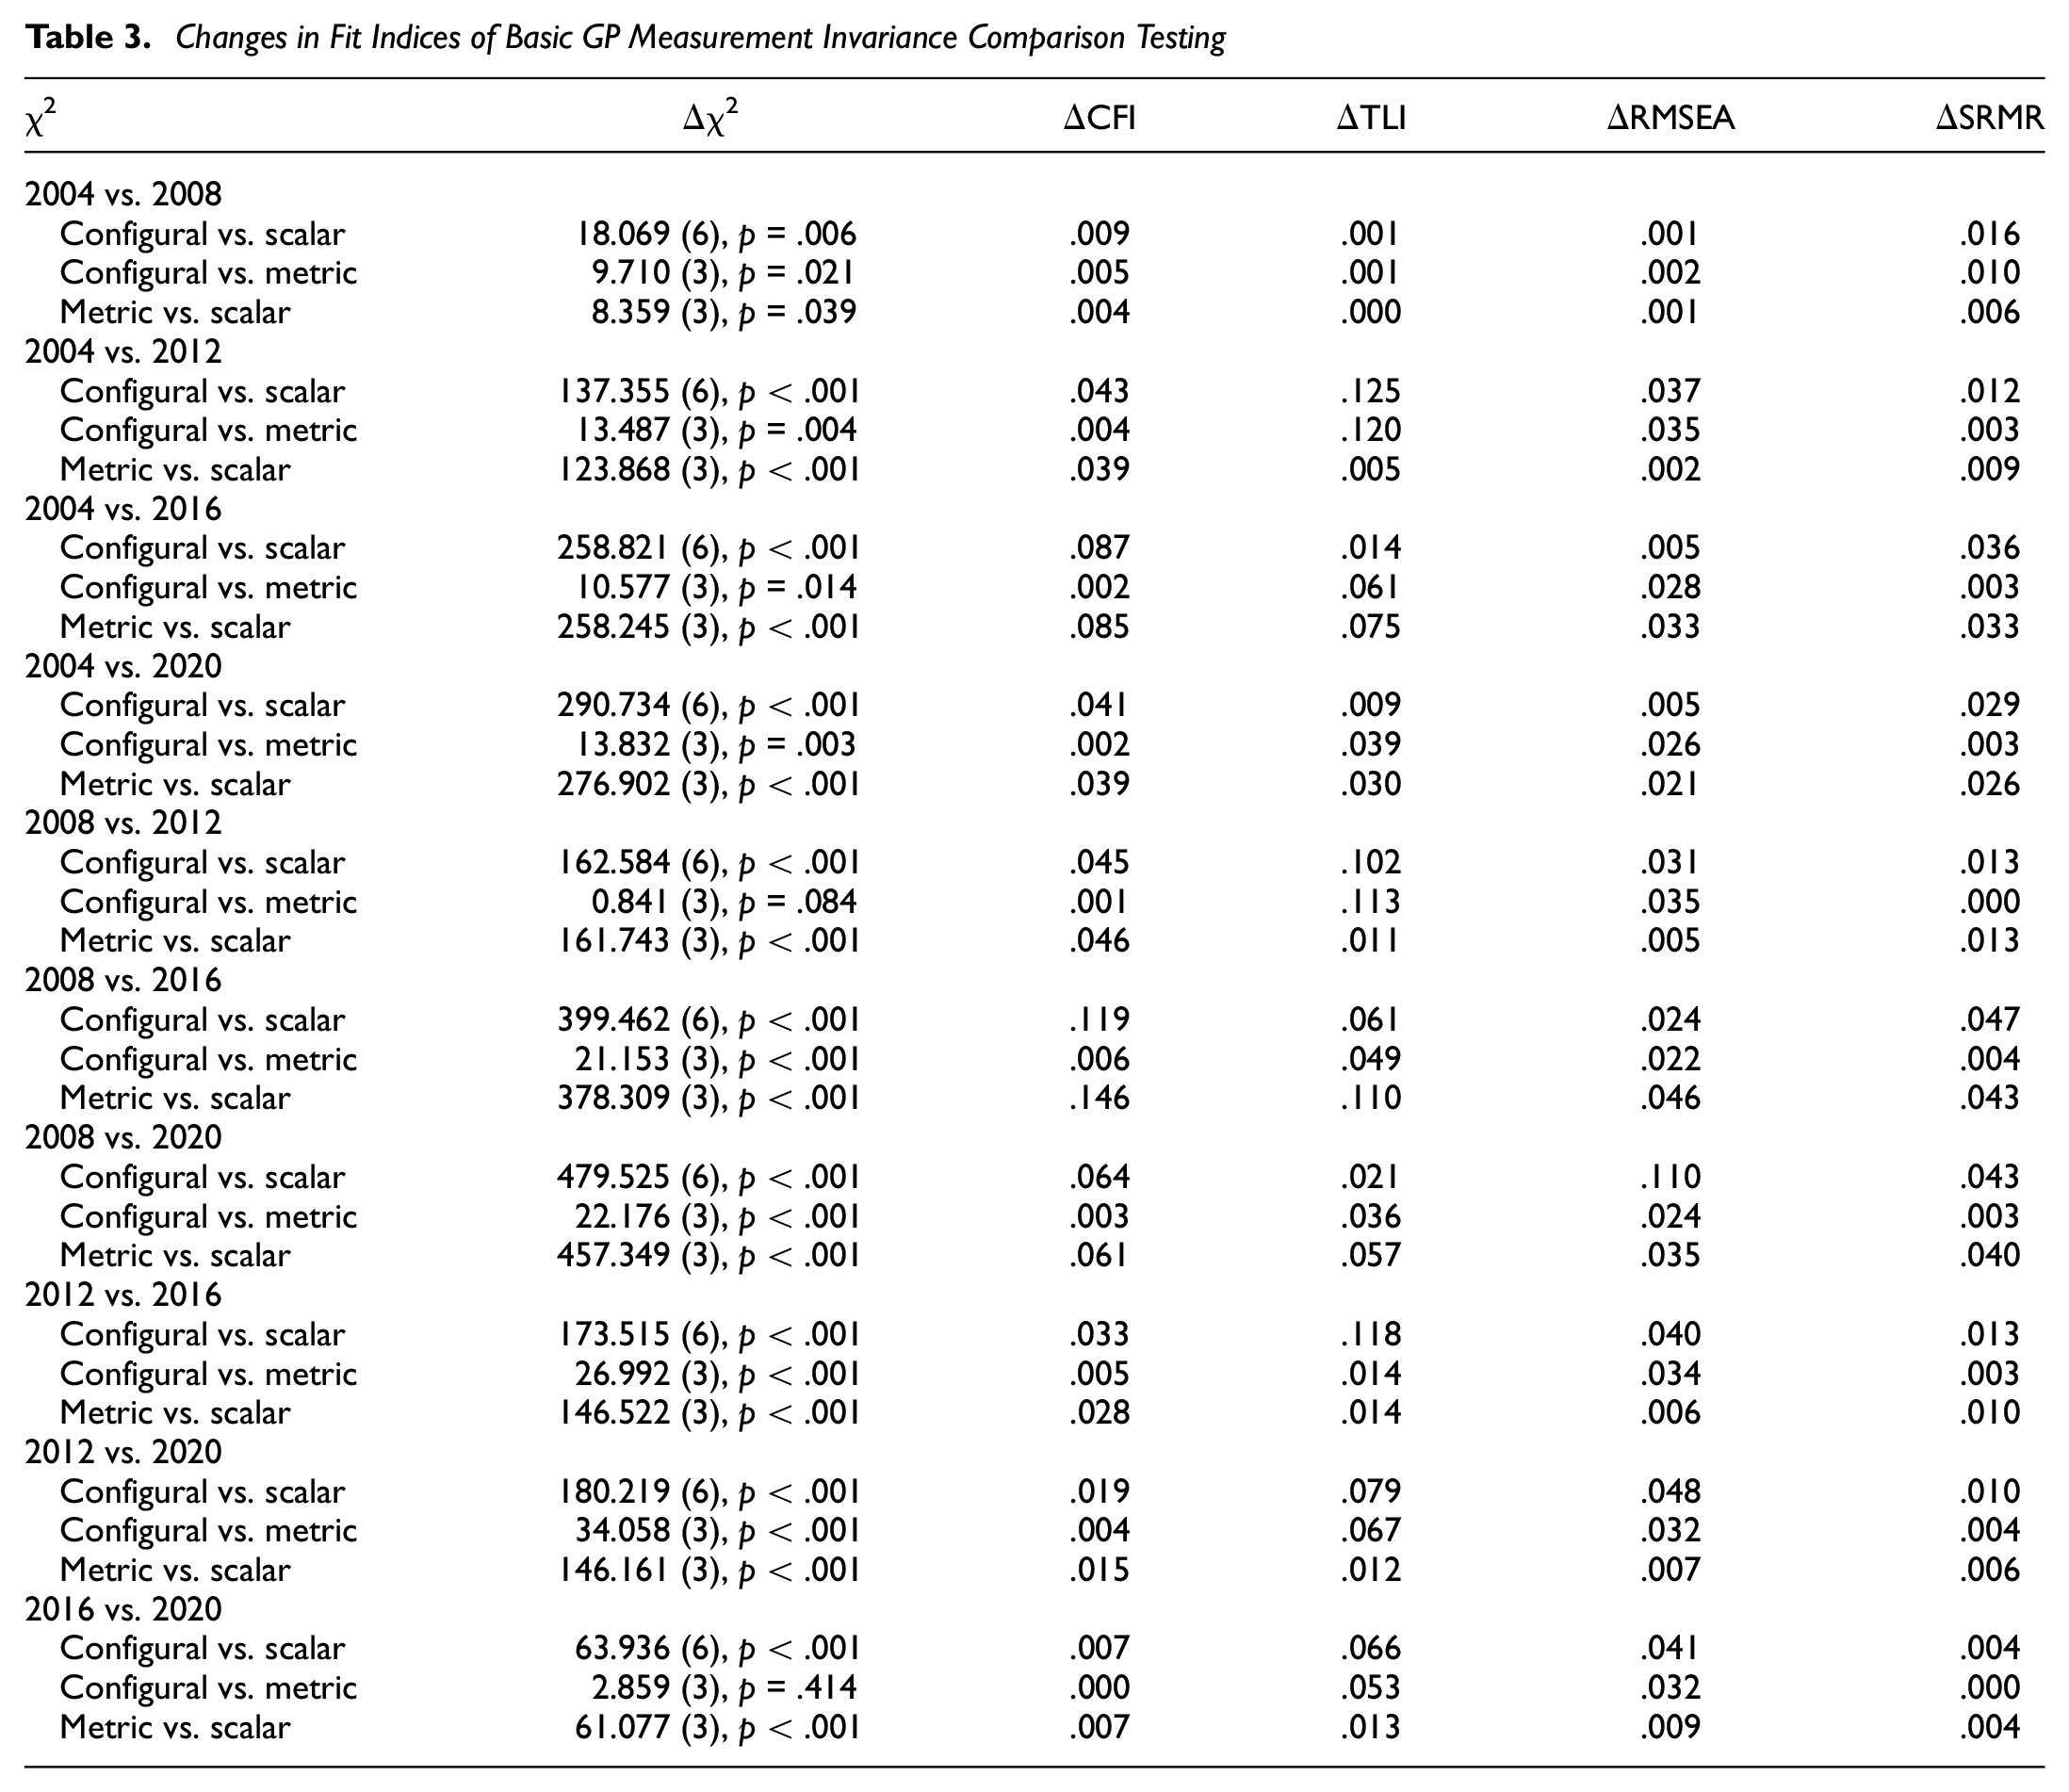
Conceptualizations of Factor Structure of Generalized Prejudice (GP) and Its Potential Covariation With Political Ideology: (A) Latent GP factor, with specific prejudices as indicators, (B) Latent GP factor, with correlated residuals between some specific prejudice indicators, (C) Latent GP factor set to covary with political ideology (or other demographics) and (D) Latent GP 2.0 factor, with specific prejudices and political ideology as indicators
We empirically investigate whether the structure of GP has changed over time in the United States. (Unlike the study of GP, changes in explicit- and implicit-specific prejudices have been vigorously explored, see Charlesworth & Banaji, 2022.) Of relevance, in 2008 there was variability in its factor structure between European countries (Meeusen & Kern, 2016). In other work, Zick and colleagues (2008) expected GP factor loadings to change over time within people—for GP to change in its meaning. They reasoned that as any specific prejudice (e.g., sexism) changes its positivity or negativity, its relation to the common GP factor (i.e., factor loading) would change, rendering GP variant over time. However, these researchers did not formally test measurement invariance, and they only considered a brief 2002–2004 window in Germany perhaps not long enough time for variance to emerge. Here we draw on nationally (U.S.) representative American National Election Survey (ANES) election-year data from 2004 to 2020, testing the same four target groups (Black people, feminists, gay people, illegal immigrants), using the same thermometer measures, formally testing measurement invariance across time periods.
Two points are worth clarifying. First, we investigate relative differences between people in their social attitudes, not absolute differences. On a scale from 0 (cold) to 100 (warm), a group rating of 70 for a marginalized group would be relatively more prejudicial than a rating of 90, despite both reflecting positive scores (i.e., above midpoint). Of interest here is the study of those scoring relatively higher (vs. lower) on a range of social groups. Second, we decided to investigate GP regarding marginalized, lower status target groups. Although this decision had a practical basis (i.e., these groups have been consistently measured in each ANES dataset wave whereas others have not), marginalized GP has long been the focus of most research and theorizing. Indeed, GP studies have been “almost exclusively based on evaluations of marginalized or stigmatized groups” (Bergh & Akrami, 2016, p. 450), making it an ideal choice for contextualizing our findings within the broader literature. Conceptually, prejudice against marginalized or stigmatized or lower status groups, as opposed to dislike of powerful groups (e.g., bankers, military), represents the core of prejudice that is most relevant from a social-justice or social-problem perspective (Hodson, 2021b, 2022). Consider the operationalization of prejudice by Dovidio and colleagues (2010, p. 7) as “an individual-level attitude (whether subjectively positive or negative) toward groups and their members that creates or maintains hierarchical status relations between groups” (see also Hodson, 2021b, Table 2). It is toward these groups that socio-cultural factors operate most against, depriving them of opportunities, fairness, and equity. In addition, Bergh and colleagues (2016) have argued not only that GP has a tighter structure for marginalized than advantaged targets, but that the former represents the “essence” of what we mean by prejudice. As a final point of context, although GP has been historically operationalized as a GP toward outgroups, outgroup status and minority (or disadvantaged) status might have been confounded given that early studies largely tested White heterosexual male participants rating marginalized groups. Indeed, marginalized GP concerns correlated prejudices toward low-status groups, not outgroups (see Bergh et al., 2016).
Using nationally representative ANES data covering the election years 2004, 2008, 2012, 2016, and 2020, we examined the potentially changing structure of GP in an exploratory manner. We tested not only whether a GP latent factor exhibits good model fit in each wave, but also whether its structure is statistically variant over time; if variant, the meaning of GP has changed. Given that the United States has become more politically polarized in recent decades (Boxell et al., 2024; Twenge et al., 2016), and that group attitudes play a central role in more modern politics (including debates about equity, diversity, and inclusion), we also examined whether GP has become more associated with and relevant to political ideology over time. For comparison, we also examined the nature of GP with regard to other demographic variables (e.g., age, education).
Method
Participants and Procedure
We used data from the ANES time series cumulative study (https://electionstudies.org/data-center/), including all previous ANES years (2004, 2008, 2012, 2016, 2020) for which feeling thermometers assessed these groups: gay men and lesbians, Black people, illegal immigrants, feminists. Supplemental Tables S1–S5 show participant demographics, and Supplemental Table S6 provides question wording/variable codes.
Materials
Attitudes Toward Marginalized Groups
Participants rated feelings toward each group accordingly: “How would you rate [Blacks/gay men and lesbians/illegal immigrants/feminists]?” on a scale from 0 (extremely unfavorable) to 100 (extremely favorable). In model tests, feeling thermometers were reversed to represent more prejudicial attitudes.
Political Ideology
Self-rated conservatism was assessed on a 7-point scale (1 = extremely liberal, 7 = extremely conservative).
Analytic Strategy
Analyses were conducted using MPlus (Version 8.8). The first step of our analytic strategy was to model the basic “GP” latent factor, comprised of Black, gay, illegal immigrant, and feminist attitudes (see conceptual Figure 1A), at each timepoint. If modification indices recommended allowing covarying residuals we reran the model, including correlated residuals (see Figure 1B), until obtaining sufficient model fit (Comparative Fix Index (CFI) > .95, Tucker-Lewis index (TLI) > .95, Root Mean Square Error of Approximation (RMSEA) < .05, Standardized Root Mean Square Residual (SRMR) < .05). We next tested measurement invariance of GP across time, analyzing: (1) overall GP model when pooling data files across timepoints; (2) GP model separately for each timepoint; (3) configural invariance; (4) metric invariance; and (5) scalar variance. In Step 6, we examined the extent to which other constructs (e.g., political ideology, age) associate with GP over time, including correlated residuals when recommended by modification indices (see Figure 1B and 1C).
Currently, there are no specific power analysis guidelines for measurement invariance testing. However, several features improve statistical power in measurement invariance testing, including presence of good psychometric properties, large sample sizes (Meade & Bauer, 2007), and not relying solely on change in χ2 for fit evaluation in larger samples (Putnick & Bornstein, 2016). Our large sample data have good psychometric properties (e.g., skewness and kurtosis values ±2), and we rely on other indicators aside from χ2, presumably mitigating statistical power concerns.
Analysis code and output can be found at https://osf.io/qwr2j/, with datasets available from ANES. The study design and analysis plan were not preregistered.
Results
For descriptive statistics, see Supplemental Table S7. In terms of means, Americans were most favorable toward Black people and feminists, with these attitudes remaining positive (above scale mid-point) over time with some waxing and waning. Attitudes toward gay people were negative in 2004 but became increasingly more positive. Attitudes toward illegal immigrants were negative across timepoints but showed fluctuations. (See Supplemental Table S8 for group means for each increment on the political ideology scale.)
For all subsequent analyses, group attitude scores were reversed to reflect greater prejudice. Intercorrelations between group attitudes’ each timepoint are shown in Supplemental Tables S9–S13. Consistent with past findings, prejudices intercorrelated positively. But group attitudes also became more correlated over time. By 2020, group attitudes correlated on average r = .43, a 43.33% increase from 2004 (where the mean correlation was .30). Put another way, whereas the amount of variance explained by one attitude from another averaged 18.49% (i.e., .43 × .43) in 2020, it was only 9% (.30 × .30) in 2004. An almost doubling in variance explained from other prejudices between 2004 and 2020 clearly demonstrates that prejudices are becoming more intercorrelated.
“Basic” GP Model
Results from the “basic” GP model (i.e., loading Black, gay, illegal immigrant, and feminist attitudes onto a latent GP factor as per Figure 1A) revealed good model fit for 2004, χ2(2) = 3.731, p = .155, CFI = .996, TLI = .988, RMSEA = .029 [.000, .073], p = .732, SRMR = .011, and 2008, χ2(2) = 7.682, p = .022, CFI = .994, TLI = .981, RMSEA = .037 [.012, .066], p = .736, SRMR = .012. However, model fit failed to hit many field benchmarks, for 2012, χ2(2) = 299.028, p < .001, CFI = .886, TLI = .657, RMSEA = .164 [.149, .180], p < .001, SRMR = .046, 2016, χ2(2) = 146.31, p < .001, CFI = .941, TLI = .822, RMSEA = .141 [.122, .161], p < .001, SRMR = .037, and 2020, χ2(2) = 224.551, p < .001, CFI = .966, TLI = .897, RMSEA = .122 [.109, .136], p < .001, SRMR = .029. For factor loadings, see Table 1.
Standardized Factor Loadings (and Correlated Residuals) of GP Models
Note. All loadings are significant at p < .001. Values in parentheses represent the standardized relations between residuals when modification indices recommended their inclusion. “Immigrant” refers to illegal immigrant.
Modification indices recommended that specific residuals should be allowed to covary in 2012, 2016, and 2020, but did not recommend including covariances for 2004 and 2008. Allowing correlated residuals improved model fit for 2012 (χ2(1) = 8.934, p = .003, CFI = .997, TLI = .982, RMSEA = .038 [.018, .062], p = .765, SRMR = .007), 2016 (χ2(1) = 9.664, p = .002, CFI = .996, TLI = .979, RMSEA = .049 [.024, .079], p = .463, SRMR = .008), and 2020 (χ2(1) = 63.495, p < .001, CFI = .990, TLI = .942, RMSEA = .092 [.073, .112], p < .001, SRMR = .013). The specific correlated residuals, and factor loadings, are found in the upper three panels in Table 2. Of note, for 2012, 2016, and 2020 models, correlating the residuals between gay and feminist improved model fit, as did correlating the residuals between Black and illegal immigrants; model fit was equivalent when either of these modifications was made. These findings indicate that gay and feminist correlate, and that Black and illegal immigrant correlate, in meaningful ways that exist outside of GP, unlike in 2004 and 2008.
Fit Indices of Basic GP Measurement Invariance Testing
In summary, the basic GP model demonstrated good fit during early timepoints (2004, 2008) but specific correlated residuals were required to improve model fit for later years (2012, 2016, 2020), consistent with GP’s nature evolving.
Measurement Invariance
Our next analytic step involved formally testing measurement invariance of basic GP across time.
Step 1: Testing Overall GP Pooling Data From All Years
Here, averaged scores of attitudes across all timepoints were set as indicators of an overall GP latent factor. This model showed acceptable model fit on some indices but not others (χ2(2) = 533.420, p < .001, CFI = .958, TLI = .875, RMSEA = .116 [.108, .124], p < .001, SRMR = .030).
Step 2: Testing GP at Each Timepoint
The second step was presented earlier as an initial test of our GP model across time; see the “Basic” GP Model section (and Table 1).
Steps 3 to 5: Testing Configural, Metric, and Scalar Invariance
Measurement invariance testing evaluates construct equivalence across groups or measurement occasions (Putnick & Bornstein, 2016). To test for invariance, two timepoints were simultaneously compared to each other, with each possible contrast compared. Configural invariance (Putnick & Bornstein, 2016) tests whether latent constructs have the same loading pattern across groups, in our case whether GP loadings differed across years. Metric invariance tests whether a specific indicator contributes to the latent factor comparably across groups; in our case whether a particular attitude (e.g., anti-Black prejudice) loads on the GP equivalently across years. Finally, scalar invariance tests whether the intercepts of the latent construct are similar across groups, that is, whether “mean differences in the latent construct capture all mean differences in the shared variance of the items” (p. 76) (Putnick & Bornstein, 2016).
Model fit of the configural, metric, and scalar models can be found in Table 2, with model comparison based on Chen’s (2007) criteria of model fit: invariance is met when changes in RMSEA are <0.015 (and p < .01), changes in SRMR are <0.02 for configural versus metric/scalar and <0.01 for metric versus scalar, changes in CFI are <0.01, and changes in TLI are <0.01. Table 2 displays the model fit results from the invariance testing, whereas Table 3 includes the absolute change in model fit results when comparing the configural, scalar, and metric model results against each other. Results of the invariance analyses revealed that the structure and meaning of GP were equivalent between 2004 and 2008 but differed between other years. That is, the structure of GP evolved over time.
Changes in Fit Indices of Basic GP Measurement Invariance Comparison Testing
Associations Between GP and Other Constructs Over Time
Because model invariance tests revealed that the GP factor took on different meaning over time, we next examined whether specific prejudices or GP changed in the magnitude of association with other prejudice-relevant constructs. For this purpose we considered education, age, sex, and conservatism, each related to prejudice (see Hodson & Dhont, 2015; Sidanius & Pratto, 1999). As revealed in Supplemental Tables S9–S13, correlations between education, age, or sex with specific group attitudes did not differ in a clear pattern across time. In contrast, correlations between conservatism and attitudes increased over time: in 2004 political ideology was correlated with each attitude on average r = .23, but by 2020 the correlation doubled to an average of r = .44. That is, the variance in group attitudes explained by conservatism jumped from 5.29% in 2004 to 19.36% in 2020, more than a three-fold increase.
We next considered how these constructs correlate with the basic GP model (i.e., latent factor). As observed in Table 4, conservatism correlated approximately .40 in 2004 and 2008, but approximately .70 by 2016 and 2020. Education, age, and sex each correlated with GP, but less strongly than did conservatism; when their variance was controlled conservatism remained a very strong correlate of GP. With the correlation between conservatism and GP reaching .70, the association is close to where researchers become concerned about construct redundancy (r = .80; Hodson, 2021a). This suggested the viability in testing a model wherein GP and conservatism are not merely associated but are part of a shared latent factor.
Associations Between Conservatism, Education, Age, Sex, and the Basic GP Latent Factor (2004–2020)
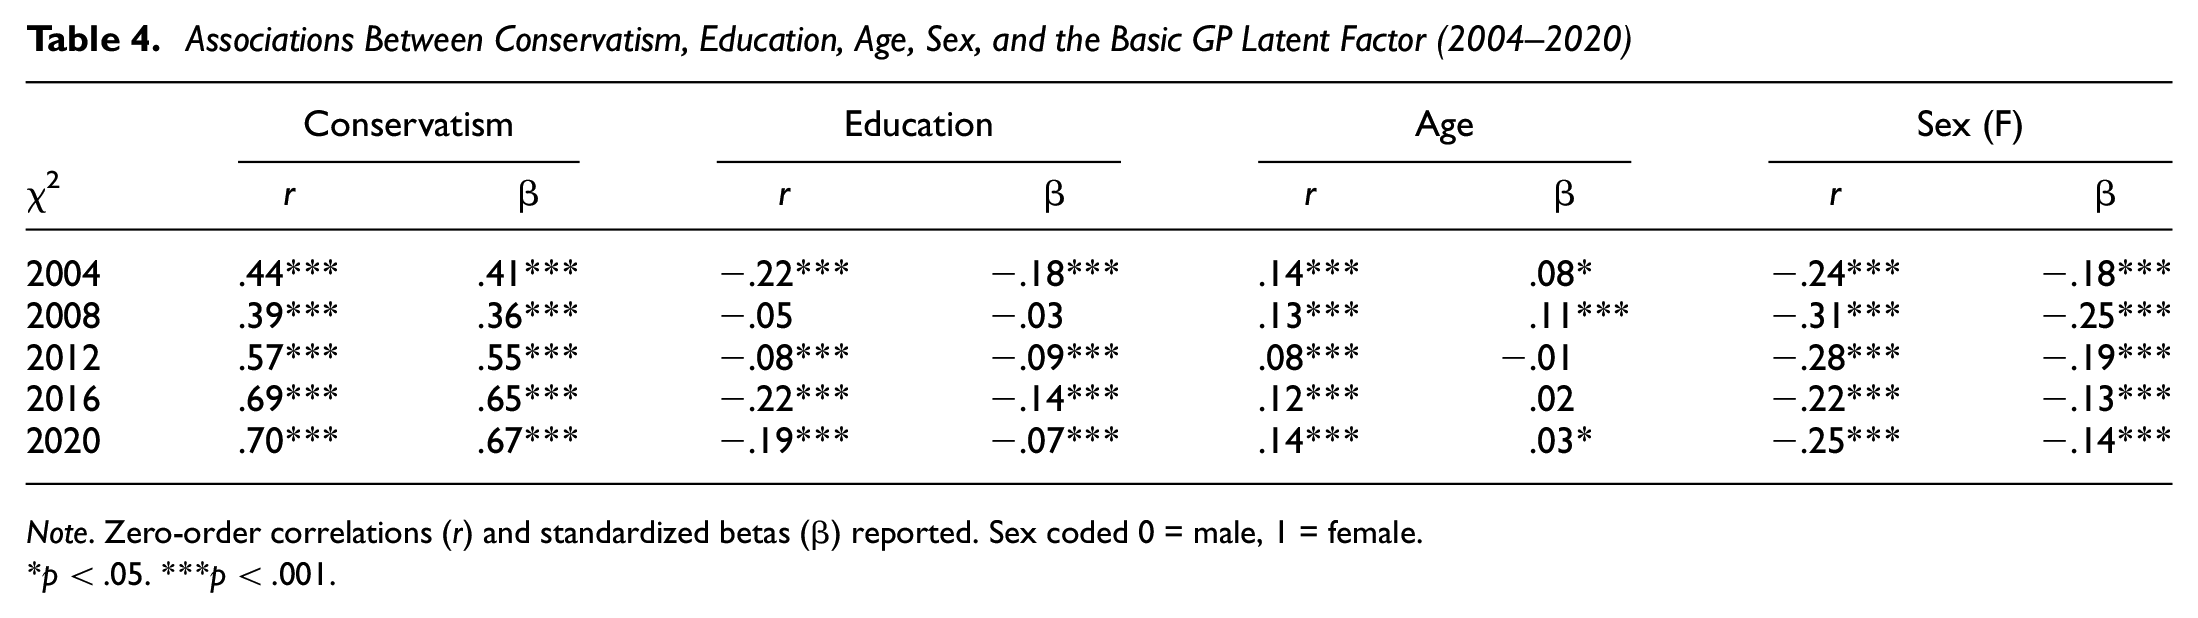
Note. Zero-order correlations (r) and standardized betas (β) reported. Sex coded 0 = male, 1 = female.
p < .05. ***p < .001.
We next modeled conservatism as an indicator, along with each group attitude, a latent factor we term GP 2.0 (see conceptual Figure 1D). This new model showed adequate fit for 2008 (χ2(5) = 35.061, p < .001, CFI = .972, TLI = .943, RMSEA = .052 [.036, .069], p = .393, SRMR = .027), but not good fit for 2004 (χ2(5) = 43.23, p < .001, CFI = .936, TLI = .873, RMSEA = .081 [.060, .104], p = .009, SRMR = .040), 2012 (χ2(5) = 421.293, p < .001, CFI = .891, TLI = .782, RMSEA = .119 [.110, .129], p < .001, SRMR = .048), 2016 (χ2(5) = 263.6, p < .001, CFI = .932, TLI = .864, RMSEA = .113 [.101, .125], p < .001, SRMR = .043), and 2020 (χ2(5) = 614.054, p < .001, CFI = .938, TLI = .876, RMSEA = .123 [.114, .131], p < .001, SRMR = .042). Following modification index recommendations to correlate residuals, however, improved model fit for 2004 (χ2(4) = 7.184, p = .127, CFI = .995, TLI = .987, RMSEA = .026 [.000, .057], p = .891, SRMR = .014), 2008 (χ2(4) = 18.617, p = .001, CFI = .986, TLI = .966, RMSEA = .040 [.023, .060], p = .774, SRMR = .019), 2012 (χ2(4) = 51.649, p < .001, CFI = .988, TLI = .969, RMSEA = .045 [.035, .056], p = .751, SRMR = .015), 2016 (χ2(4) = 102.264, p < .001, CFI = .974, TLI = .935, RMSEA = .078 [.065, .091], p < .001, SRMR = .024), and 2020 (χ2(3) = 128.357, p < .001, CFI = .987, TLI = .958, RMSEA = .072 [.061, .083], p < .001, SRMR = .019). Of note, model fit for GP 2.0 with correlated residuals was the best fitting model for 2020.
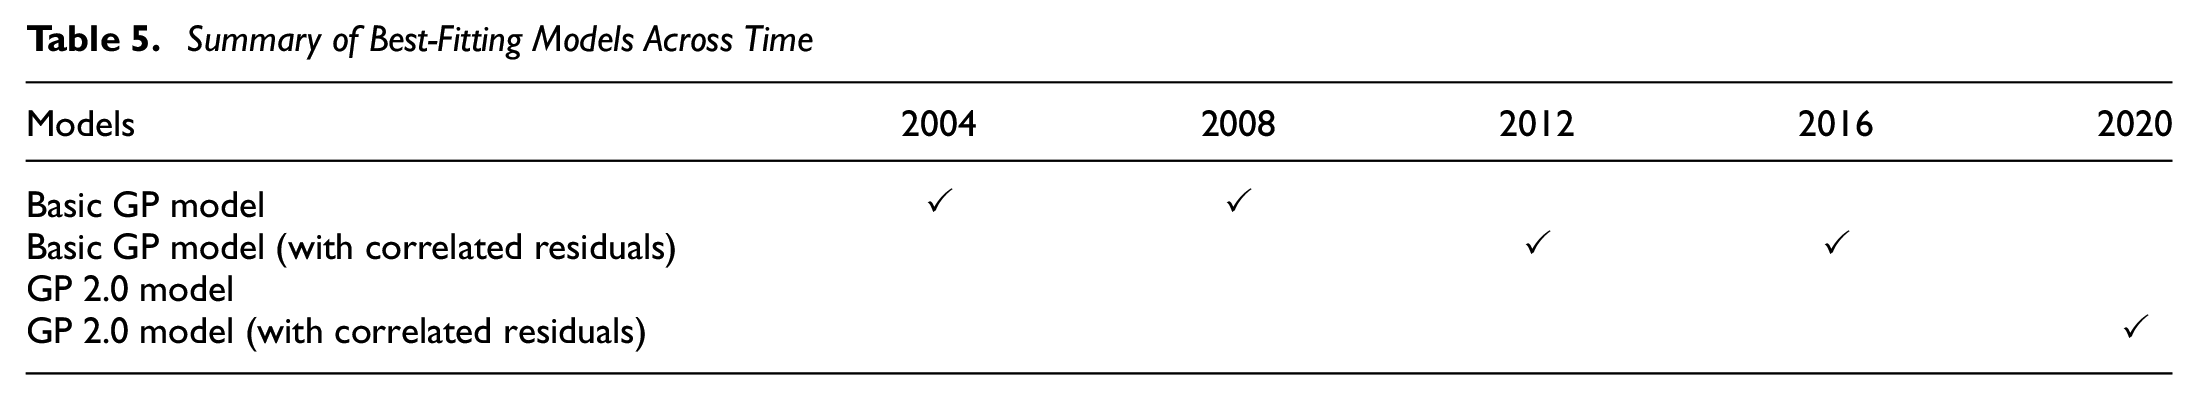
A summary of the best fitting GP models across time can be found in Table 5. The basic GP model was the best fit for 2004 and 2008, whereas the best fit for 2012 and 2016 included correlated residuals (between gay and feminist, or Black and illegal immigrant), and the best fit for 2020 was the GP 2.0 model (group attitudes and conservatism as indicators of a common factor) with correlated residuals.
Summary of Best-Fitting Models Across Time
General Discussion
Our project began with a basic question—if a person scores relatively high on one type of prejudice (e.g., anti-Black racism) are they more likely to score negatively on attitudes toward other groups (e.g., illegal immigrants, gay people, feminists) than was the case in the past? Have prejudices toward marginalized groups become more intercorrelated with each other over time, and has the shape and meaning of GP changed? We addressed this question using nationally representative data from 2004 to 2020, with attitudes assessed with the same measures at each timepoint. Consistent with past findings, a latent GP factor was statistically viable. However, despite being invariant between 2004 and 2008, GP later became variant, evolving and morphing at each subsequent timepoint. Of note, specific prejudices became more correlated with each other over time (Supplemental Tables S9–S13) and GP factor loadings increased (Table 1). From 2012 onward the “basic” GP factor was insufficient in terms of model fit; in these years, residuals between anti-Black racism and antiillegal immigrant attitudes, or between antigay and antifeminist attitudes, needed to covary (meaning that they shared variance existing outside of the GP factor). GP clearly changed in meaning over time, being correlated with political conservatism in the .40 range in 2004 and 2008 but in the .70 range by 2016 and 2020, despite GP not becoming more associated with other prejudice-relevant constructs (education, age, sex; Table 4). This high degree of association suggests that conservatism and GP are approaching statistical redundancy (Hodson, 2021a). Indeed, modeling GP 2.0 as indicated by the four prejudices plus conservatism (with some correlated residuals) achieved the best model fit for 2020. This is not to say that conservatism is prejudice, in the same manner that we are not concluding that racism is sexism. Rather, conservatism and specific prejudices share more meaningful covariance than was the case several decades prior.
Social psychology has long engaged in heated debates about whether prejudice is rooted more in the person or situation (Hodson, 2009; Hodson & Dhont, 2015). The existence of GP has long been taken as evidence in support of the person-as-cause account, reasoning that if an individual is biased (or tolerant) toward multiple groups, relative to other people, this tells us a great deal about that individual as a bigot (or tolerant person). Because our analyses showed that prejudices are becoming increasingly correlated, and that loadings on GP became stronger over time, this strengthens the argument that individual differences are more relevant to understanding prejudice now than in the past. Moreover, specific prejudices were becoming more correlated despite some prejudices (e.g., antigay) declining over time and others (e.g., antiillegal immigrant) remaining negative and relatively stagnant at the aggregate level (see Supplemental Table S7). This clearly speaks to the importance of person factors in understanding prejudice. But our findings suggest that social factors are also becoming more important to understanding GP than in the past. Indeed, increased polarization in the United States in recent decades (Boxell et al., 2024; Twenge et al., 2016) has likely played a role in tightening the correlations between these prejudices within individuals. That is, Americans are increasingly sorting themselves into different political tribes, with normative pressures to align their social group attitudes with perceptions of group positions. Consistent with this position, recent evidence suggests that “the 2016 [U.S.] election seems to have ushered in a normative climate that favored expression of several prejudices” (p. 186), with perceptions of social norms tracking prejudices openly expressed by candidate Donald Trump (Crandall et al., 2018). Interestingly, GP began to change its structure after 2008, after the election of America’s first Black president, and continued changing with the candidacy of (what could become) the first female president (Hillary Clinton), whose opponent (Donald Trump) refused to distance himself from overt racism and White nationalism. In an unprecedented way in modern times, racial and gender hierarchies became extremely salient, sharpening opposition to marginalized groups amid feelings that the sands of power were shifting and inducing threats (Craig & Richeson, 2014; Hodson et al., 2022). A person on the right of the political spectrum in recent years might feel pressure or permission to align their biases against marginalized groups; likewise, those on the left might similarly align their acceptances of multiple groups to meet identity motives in an increasingly polarized, tribal context. Alternatively, someone developing hostility toward the groups studied here might move more rightward politically. Ultimately, rather than pitting the person versus the situation in an explanatory sense, we believe that our findings demonstrate that both person and situation factors have become more important in understanding the structure of GP in contemporary years.
Perhaps most noteworthy about our findings is the growing relation between political conservatism and specific prejudices (Supplemental Tables S9–S13) or GP (Table 4). By 2020, the GP–conservatism relation is approaching the point at which questions can be asked about whether the constructs are truly distinct. Not only is conservatism is becoming “closer” to prejudices, but by 2020 it fits well within the GP wheelhouse, sharing sufficient variance to form a meaningful factor. Relatedly, Zick and colleagues (2008) observed that social dominance orientation, a correlate of conservatism that captures the acceptance of group hierarchies, correlated .85 with GP. In addition, when right-wing authoritarianism and social dominance orientation are modeled as a latent generalized authoritarianism factor it correlates nearly perfectly with GP (Hodson et al., 2017). Theoretical models positing that conservatism causes prejudices (and certainly GP) might become increasingly less tenable, making it difficult to infer causality if the constructs are not meaningfully distinct (see Fiedler et al., 2011; Hodson, 2021a).
Although some readers will balk at the notion that conservatism risks becoming synonymous with GP on its current trajectory, it is worth remembering that we employed high-caliber, freely accessible, nationally representative data that used the same feeling thermometers and self-placement of ideology across studies. There is no trick or hidden nuance at play; rather, political ideology is becoming increasingly important to understanding specific prejudices and GP over time. Our analyses reveal that those on the political right (vs. left) are not only relatively more negative toward the social groups studied (our prime interest), but even in absolute terms score below the scale midpoint on average, expressing largely negative attitudes (except toward Black people; see Supplemental Table S8). In the United States at least, politically conservative (vs. liberal) attitudes are relatively more biased and predominantly marked by negativity. To be clear, those on the political right are not bad people, any more than men, the less educated, or older people (see Table 4) are “bad.” Rather, scientists are tasked with understanding the predictors of phenomena; here conservatism has become increasingly predictive of GP, based on participants' own self-reports of their ideology and racial attitudes.
We are also not arguing that specific prejudices are unimportant, or that specific prejudices are equivalent to each other. Specific prejudices possess unique and specific qualities (Cottrell & Neuberg, 2005; Young-Bruehl, 1998). But they also possess shared and generalizable properties that reveal valuable information about prejudice more generally (Hodson et al., 2017); modeling their shared variance does not make specific prejudices redundant or equivalent any more than modeling the shared variance between math and verbal ability render them equivalent (Hodson, 2021a).
Ultimately, the present findings question whether it is reasonable to speak of the nature of prejudice (captured by Allport’s seminal book title). Rather, GP appears to be variant over time, even within a single nation. Although the field discusses GP as though it were a fact and tacitly suggests its stability, our evidence suggests that it has changed in the U.S. context, not only evolving its form (becoming both tighter and with unique relations that exist outside of the latent factor) but also its association with conservatism. Indeed, if the current trends continue the nature of GP will become increasingly political in nature.
Moving forward, the field is encouraged to consider nations and cultures outside of the United States. We recognize that the United States has polarized itself more than other Organisation for Economic Co-operation and Development (OECD) countries over the past 40 years (Boxell et al., 2024), making it an outlier. Comparing the United States to less polarized countries would thus prove valuable. It would also be fruitful to expand the scope of target groups considered. For instance, attitudes toward transgender people have become a cultural touchpoint, meaning that its inclusion would likely strengthen associations between GP and conservatism. In contrast, as American attitudes toward groups such as gay people become increasingly positive (Supplemental Table S7; see also Charlesworth & Banaji, 2022), some groups might fall outside of the GP sphere (Zick et al., 2008). It would also be valuable to track GP within the same individuals over time (see Zick et al., 2008), over sufficiently large time intervals to capture potential change. Notably, our findings speak to the changing nature of GP across time and samples but not across time within people, a limitation of our design. Our findings also suggest that it would also be valuable to examine whether implicit GP (Cunningham et al., 2004) has similarly changed over time. Finally, our measures were single item in nature, which can have implications for reliability (albeit largely reduced when modeling latent factors); future researchers employ multiple-item scales.
Closing Remarks
If one’s uncle voices racist remarks but also gives off vibes that he might be sexist and homophobic, one’s perception is likely accurate. This correlated prejudice tendency has not only increased in strength but has coincided with the development of a more distinctly political nature than in the recent past. The shifting nature of GP, both in terms of its structure and its association with ideology, is in keeping with the more tribal and polarized nature of modern social life in the United States. As with other aspects of social life, prejudice appears to have become increasingly political, now more greatly shaping the ways that we observe differences between people.
Supplemental Material
sj-docx-1-spp-10.1177_19485506241305698 – Supplemental material for The Evolving Nature of Generalized Prejudice Toward Marginalized Groups in the United States 2004–2020
Supplemental material, sj-docx-1-spp-10.1177_19485506241305698 for The Evolving Nature of Generalized Prejudice Toward Marginalized Groups in the United States 2004–2020 by Gordon Hodson and Hanna Puffer in Social Psychological and Personality Science
Footnotes
Declaration of Conflicting Interests
The author(s) declared no potential conflicts of interest with respect to the research, authorship, and/or publication of this article.
Funding
The author(s) received no financial support for the research, authorship, and/or publication of this article.
Supplemental Material
Supplemental material is available in the online version of the article.
Notes
Author Biographies
References
Supplementary Material
Please find the following supplemental material available below.
For Open Access articles published under a Creative Commons License, all supplemental material carries the same license as the article it is associated with.
For non-Open Access articles published, all supplemental material carries a non-exclusive license, and permission requests for re-use of supplemental material or any part of supplemental material shall be sent directly to the copyright owner as specified in the copyright notice associated with the article.