
Abstract
Waiting is ubiquitous yet painful. We find that the discomfort of waiting intensifies as the wait draws closer to its end. Using longitudinal studies that measured impatience for real-world events, we documented greater impatience closer to learning the results of the 2020 U.S. presidential election (Study 1), receiving the first COVID-19 vaccine (Study 2), and boarding a bus (Study 3). Follow-up experiments found that a desire for closure underlies this effect, and that impatience increases at the end of the wait controlling for how long people have already been waiting (Supplemental Studies 1–4). These findings suggest that the distress of waiting escalates when the wait is almost over.
Americans spend 37 billion hours each year waiting in line (Stone, 2012) and the average commuter spends 42 hours annually sitting in traffic (Frakt, 2019). People wait even when not actively standing in line or sitting behind the wheel. Academics wait to receive decisions from journals, bored employees wait for the weekend, and shoppers wait for packages in the mail.
In these situations, feeling patient is critical for well-being and success (Schnitker, 2012). Impatient people report less happiness (DeVoe & House, 2012). When making intertemporal choices, children who stay calm while waiting get better candy prizes (Barragan-Jason et al., 2018) and adults who expect to feel patient opt to earn more money later (Hardisty & Weber, 2020; Kumar & Gilovich, 2016; Rachlin & Raineri, 1992). People who wait patiently further enjoy products more (Nowlis et al., 2004), value them more (Koo & Fishbach, 2010), and are less likely to quit lines (R. Zhou & Soman, 2003).
What makes people feel impatient? Clearly, personality matters (Schnitker, 2012). But so does the situation; for example, the outcome of the wait. Waiting for consumer goods is harder than waiting for experiences (Kumar et al., 2014), and waiting for positive (vs. negative) events feels longer (Bilgin & LeBoeuf, 2010; Tonietto et al., 2022). Furthermore, the proximity to the end of the wait could matter. Here, we explore the trajectory of impatience, predicting it will increase closer to the end of the wait due to a heightened desire for closure.
The Trajectory of Impatience
Impatience is a feeling that informs choice. Accordingly, some research has studied impatience as the negative experience of waiting (DeVoe & House, 2012; Hardisty & Weber, 2020), while other research has studied impatience as a preference for smaller-sooner (vs. larger-later) options in intertemporal choice (Bartels & Urminsky, 2011; Yoon, 2020; Zauberman & Urminsky, 2015). Consistent with the former approach, we study impatience as a negative feeling. We explore situations where there is no immediate decision to be made, such as when waiting for the election results. In these situations, what matters is the feeling of patience. We define patience as the experience of waiting without suffering (Barragan-Jason et al., 2019; Roberts & Fishbach, 2020).
There are several potential trajectories for the pain of waiting. First, impatience may decrease over time. When the end of the wait is in sight, people may feel relieved, excited, and glad about their progress. In turn, they might be less annoyed about the remaining wait. For example, commuters may feel more patient when their bus is about to arrive.
Alternatively, people may experience greater impatience after waiting for longer. This could result from the mounting toll of waiting, such as physical exhaustion from standing in line or growing hunger while awaiting food. The subjective challenge of waiting may also intensify as people contend with boredom and are increasingly aware of missed opportunities (Osuna, 1985; Tom & Lucey, 1997). For example, longer airport delays elicit stronger feelings of anger (Taylor, 1994).
A third possibility is that impatience increases, but as a function of how much time remains rather than how much time has elapsed. According to hyperbolic discounting, people make more impatient choices when the reward is closer (Ainslie, 1975; Laibson, 1997; Thaler, 1981). For example, people are more likely to choose US$10 now over US$15 in a month than US$10 in a year over US$15 in 13 months, even though the only difference between these two tradeoffs is a constant 1-year delay. If people are more tempted by the smaller-sooner option when it is available sooner, this may be partially because they find it more painful to wait. Moreover, even if there is no intertemporal choice to make, people may feel worse closer to the end of the wait.
As people approach goal completion, the desire for closure intensifies, possibly increasing impatience. The desire for closure is a motivational state that propels action (Lalot et al., 2022; Webster & Kruglanski, 1994). It contributes to the goal-gradient effect: individuals’ heightened effort as they near achieving a goal (Brown & Lahey, 2015; Dai & Zhang, 2019; Hull, 1932; Koo & Fishbach, 2012; Wadhwa & Kim, 2015). For instance, shoppers enrolled in a loyalty program made more frequent purchases closer to receiving their reward (Kivetz et al., 2006).
Yet, unlike the goal-gradient effect, people often cannot increase their efforts because there is nothing to do. Moreover, without a smaller-sooner option, they have no intertemporal choice to make. They can only wait. In these situations, their eagerness may turn into a negative feeling of frustration and impatience. Incomplete goals attract attention (Moskowitz, 2002), causing intrusive thoughts (Masicampo & Baumeister, 2011). Thus, while a mountaineer will walk faster when about to reach the summit, a commuter might feel worse when the bus is closer to arriving (as they cannot speed up its arrival). Their impatience increases as they become more eager to complete their goal.
Therefore, our main prediction is that impatience increases closer to the end of a wait. We tested this prediction in three studies, which explored impatience over months (for COVID-19 vaccines), days (for the U.S. presidential election results), and minutes (for a bus). These studies used known and unknown outcomes (e.g., a bus arriving vs. election results), as well as focal waits that require action (e.g., standing at a bus stop) and background waits that can occur from anywhere (e.g., waiting to be eligible for a vaccine).
Initial evidence for our hypotheses comes from research on impatience for uncertain news, such as waiting for medical test results or the results of the bar exam (Howell & Sweeny, 2016; Sweeny & Andrews, 2014; Sweeny et al., 2016; Sweeny & Krizan, 2013). In these studies, people became more impatient over time, possibly due to increased pessimism and anxiety. However, we expect impatience to increase when waiting for an expected outcome, such as a bus arriving, albeit for a different reason.
We predict that the increase in impatience results from an increase in the desire for closure. If impatience is a function of the desire for goal closure, it would depend on how close people feel to the end of the wait, regardless of how much time has elapsed. For example, in spring 2021, people may have become increasingly impatient for the COVID-19 vaccine, but not for the pandemic to end, despite waiting the same amount of time for both. They were about to receive the vaccine, but the end of the Public Health Emergency for the pandemic was not until 2023.
To test this hypothesis further, we also report four supplemental, scenario-based studies. These studies allowed us to test (a) whether a desire for closure mediates the effect of distance to the end of the wait and (b) whether impatience increases closer to the end of the wait, independent of how long people have been waiting. We reasoned that if a desire for closure underlies the effect, the remaining wait would increase impatience, controlling for the time spent waiting. These supplemental studies also extend our findings to physical distance (e.g., people should be more impatient when waiting for a package that is a few vs. many miles away) and test for implications on service provider evaluations.
We summarize the results of all studies in Table 1 (N = 1,257). All sample sizes were determined prior to data collection. We targeted a minimum sample of 100 participants per cell to achieve a power of .80 with a medium effect size. Full materials and data for all reported experiments and pilot studies are archived on Open Science Framework (OSF) (https://tinyurl.com/ImpatienceOverTimeOSF). All variables, results, and participant attrition (H. Zhou & Fishbach, 2016) are reported in the Supplemental Online Materials (SOM).
Overview of Studies
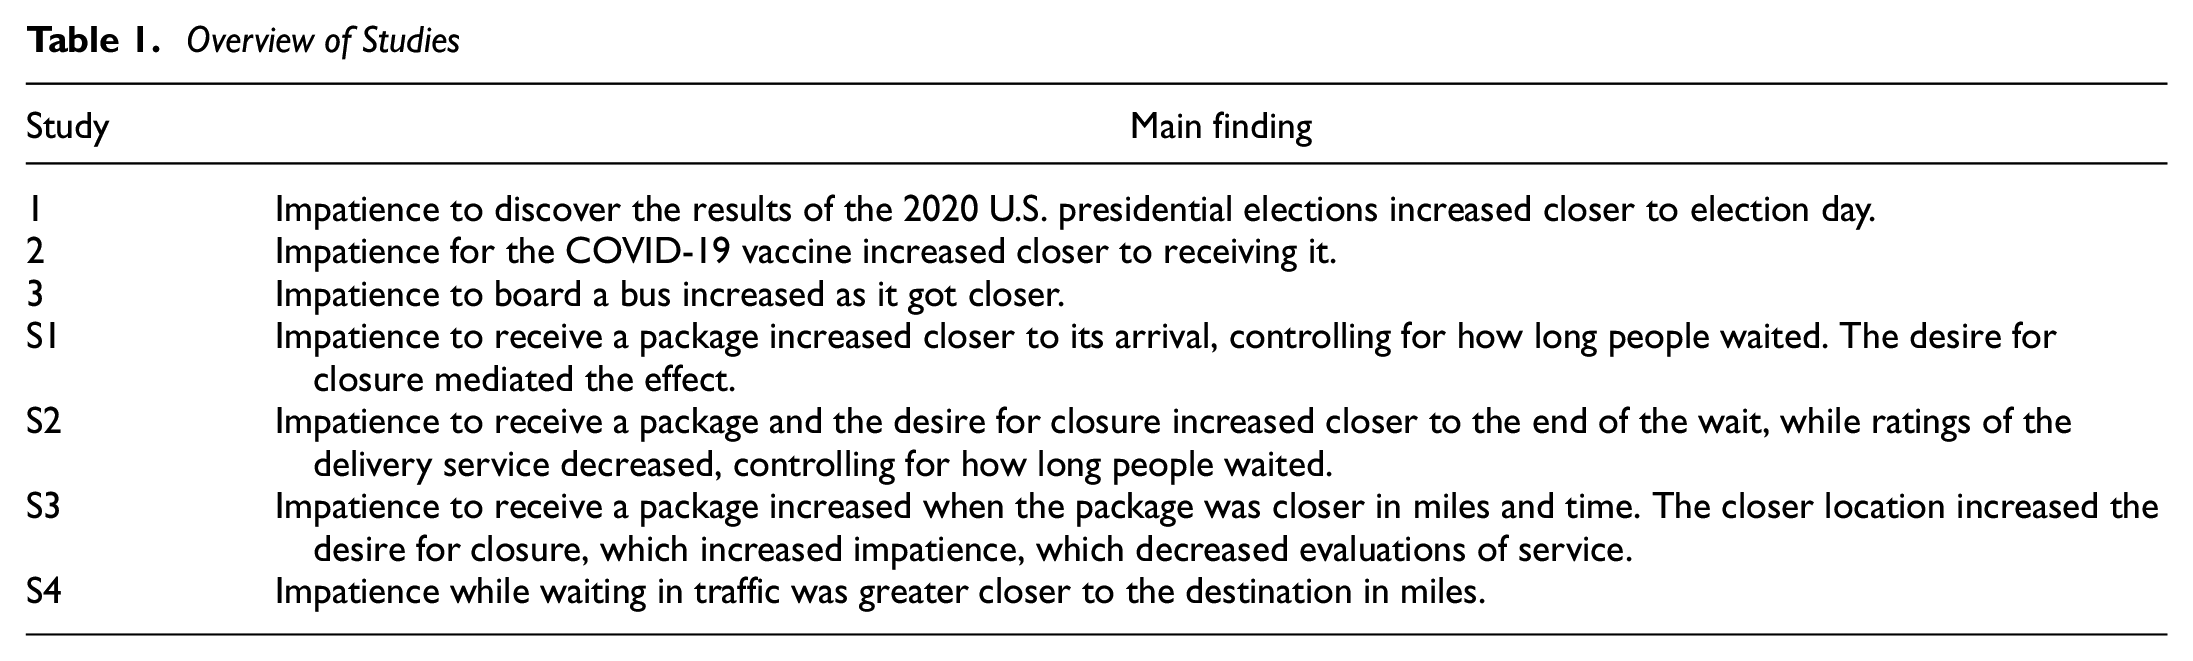
Study 1: Impatience for Election Results
Study 1 measured impatience to learn the 2020 U.S. presidential election results. We predicted greater impatience on election day compared with the 3 days before.
In 2020, the presidential elections were not officially determined on election day (November 3). This provided a unique opportunity to measure impatience the following day (November 4). Based on the partial results on November 4, it was expected that Democratic presidential nominee Joe Biden would win the race over Republican incumbent Donald Trump. Our theory predicted that Americans would be even more impatient the day after the (undetermined) election because their desire for psychological closure increased. Alternatively, if heightened uncertainty causes impatience, then impatience should decrease after election day. Furthermore, if impatience only reflects positive feelings of excitement or only negative feelings of worry, impatience should only increase for (excited) Biden supporters or only for (worried) Trump supporters.
Method
Participants
We opened the study to 400 U.S. participants on Prolific. Prolific returned 399 participants in Survey 1, 325 in Survey 2, 287 in Survey 3, 242 in Survey 4, and 215 in Survey 5. Participants were only allowed to continue to the following survey if they completed all previous ones. Our final sample accordingly included 215 participants who completed all five surveys in exchange for US$2.70 (108 women; Mage = 34.03, SDage = 12.36; 78% supported Biden, 18% supported Trump, and 4% supported other candidates).
Procedure
The U.S. presidential elections were on November 3. We began asking participants about their impatience to learn the election results 3 days before the elections. In 2020, the election was not resolved on election night. Hence, we also measured impatience the day after the election.
We used a 5-condition (October 31 vs. November 1 vs. November 2 vs. November 3 vs. November 4) within-participants design. Participants completed the first three surveys on the days leading up to the 2020 presidential elections, the fourth survey on election day, and the fifth survey on the day after.
In each survey, participants rated their impatience: “How impatient are you to find out who wins the 2020 presidential election?” (1 = not at all, 7 = very). We used a single item to capture participants’ subjective interpretation of their experience of impatience.
Participants also predicted the winner of the election: “Who do you think will win the 2020 presidential election?” (−3 = definitely Trump, 3 = definitely Biden), rated their uncertainty: “How uncertain do you feel about who will win the 2020 presidential election?” (1 = not at all, 7 = very), and reported their news consumption: “How frequently are you reading the news?” and “How frequently are you checking social media?” (1 = not at all, 7 = very frequently). In Surveys 4 and 5, we also asked: “When do you expect to find out who won the 2020 presidential election?” (1 = soon, 7 = in a long time).
Results and Discussion
Supporting our hypothesis, impatience increased closer to learning the election results (Table 2). Participants were more impatient on election day than the average of the preceding days (p < .001) and on the day after election day than the average of all the preceding days (p < .001).
Study 1 Descriptive Statistics (SDs in Parentheses)
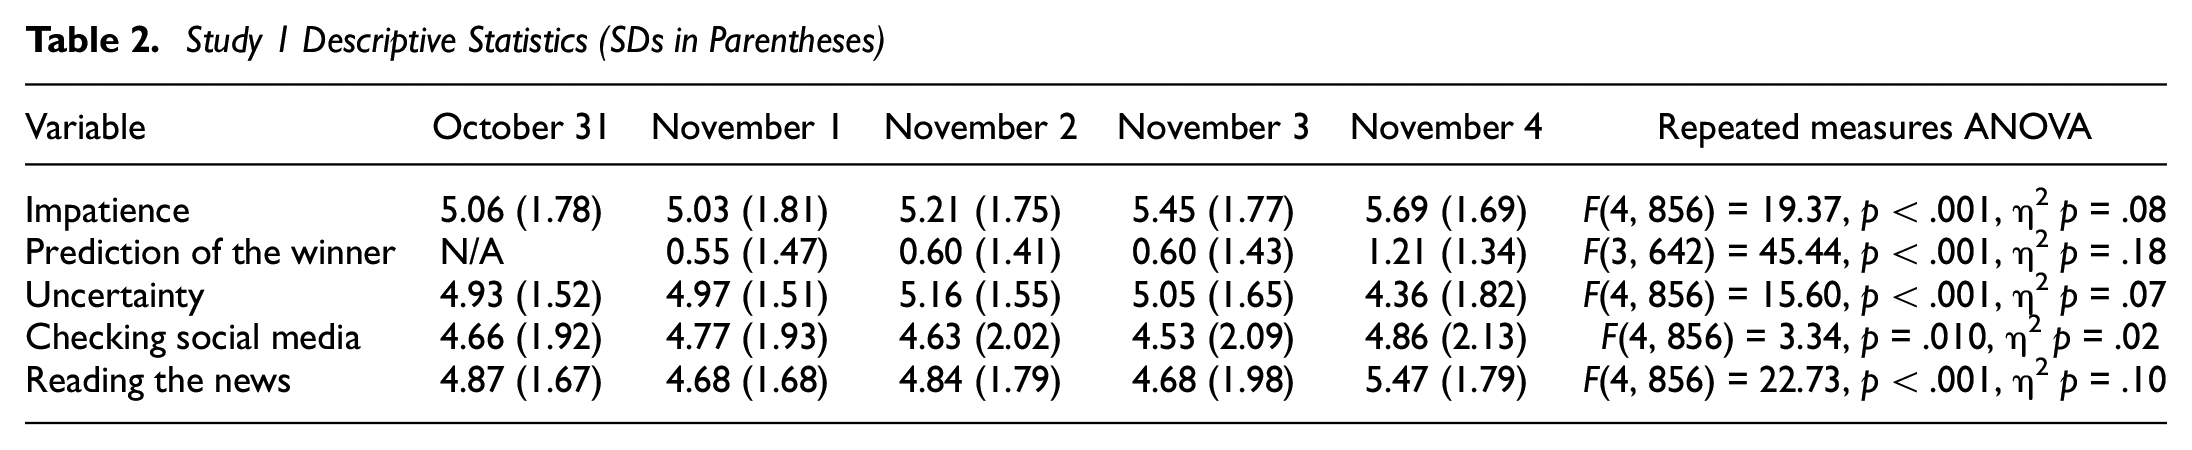
The candidate participants supported did not moderate the increase in impatience closer to learning the election results (p = .891; Figure 1). Biden supporters (n = 168) were more impatient on election day than before (p < .001) and more impatient the day after election day than the average of the previous days (p < .001). Trump supporters (n = 38) were also more impatient on election day than before (p = .033) and marginally more impatient the day after election day than the average of the previous days (p = .070).
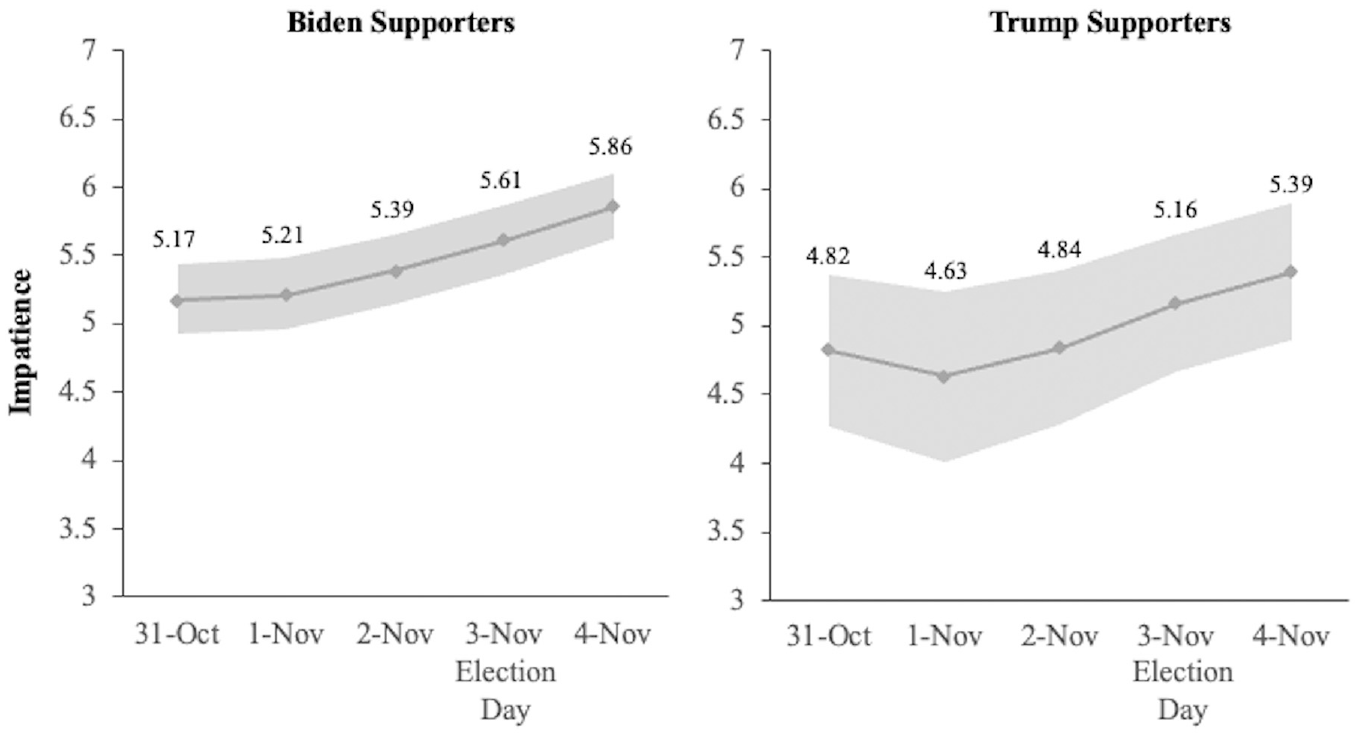
Impatience to Find Out the Results of the 2020 Presidential Elections Increased Closer to the End of the Wait for Both Biden Supporters and Trump Supporters (Study 1), Even After Election Day on November 3
In addition, both Biden supporters (M = 1.46, SD = 1.08) and Trump supporters (M = 0.26, SD = 1.91) thought Biden was more likely to win the day after election day than the average of the previous days (Biden: M = 0.99, SD = 1.07; Trump: M = −1.18, SD = 1.24; ps < .001). Despite increasing expectations that Biden would win, both groups felt more impatient to learn the election results.
Importantly, participants were more certain about the election results the day after election day than on election day (p < .001) and the average of the previous days (p < .001). The day after election day, participants also felt closer to finding out the results of the elections (M = 3.46, SD = 1.47) than on election day (M = 3.70, SD = 1.50), t(214) = 2.24, p = .026, d = .15, 95% confidence interval (CI) = [0.03, 0.46]. We conclude that impatience increases when closer to the end of the wait, despite the decrease in uncertainty.
Possibly, media attention caused the increase in impatience. Against this alternative, we found that impatience increased over time even when controlling for attention to news and social media, b = .12, SE = .03, p < .001, 95% CI = [0.05, 0.18].
Overall, Study 1 revealed heightened impatience among both Biden and Trump supporters closer to learning the election results. This increase continued the day after the election, despite both sides’ belief that Biden was more likely to win. Impatience was not driven by uncertainty or the anticipation of favorable news (i.e., the preferred candidate winning) but rather, by the desire to conclude the wait.
Study 2: Impatience for Vaccines
Study 2 tested whether impatience for the first COVID-19 vaccine would increase when closer to being able to receive it. We compared impatience for the vaccine to impatience for the pandemic to end. Although most people started waiting for both events around the same time (Spring 2020), by spring 2021, vaccines became available to all U.S. adults. Yet, the federal health emergency declaration officially ending the pandemic was only released in spring 2023 (2 years later). This allowed us to assess whether impatience increases as a function of the time already passed (similar for both events) or the distance to the end of the wait (with the vaccine being closer). We predicted that impatience for the vaccine would increase from fall 2020 to spring 2021, while impatience for the pandemic to end would remain the same.
Given that the number of new COVID-19 cases decreased in the spring of 2021, we did not expect concern about the pandemic to increase over time. Thus, unlike the desire for closure, pandemic concern could not explain the time course of impatience.
Method
Participants
We opened the study to 250 participants from a university’s online participant pool. The pool returned 253 participants in Survey 1, 208 in Survey 2, and 161 in Survey 3. Participants were only allowed to continue to the following survey if they completed all previous ones. Our final sample accordingly included 161 participants who completed all three surveys in exchange for US$5 (126 women; Mage = 23.15, SDage = 5.54).
Our sample included 75% liberals, 14% moderates, and 11% conservatives, as well as 64% undergraduate students, 34% graduate students, and 1% other students. During the study (November 2020 to March 2021), classes were entirely on Zoom, and the COVID-19 vaccination policy at the university had not yet been established.
Procedure
We used a 3-condition (November 2020 vs. December 2020 vs. March 2021) within-participants design. Participants completed the first survey in November 2020, after the successful Pfizer COVID-19 trial was announced, and follow-up surveys in December 2020 and March 2021. In March 2021, it was announced that every U.S. adult would have access to the vaccine by the end of May. Mostly only health care workers and people over 65 were eligible to receive the vaccine in the United States, yet the end of the wait was in sight.
In each survey, unvaccinated participants (84%) rated: “How impatient are you to get a coronavirus vaccine?” All participants (regardless of vaccination status) also rated: “How impatient are you for a coronavirus vaccine to be made available to the public?” and “How impatient are you for the coronavirus pandemic to end?” (for all measures: 1 = not at all, 7 = very). The first two items measured impatience for the vaccine, while the last measured impatience for the pandemic to end.
To confirm that participants thought the vaccine was getting closer, they rated: “How many months do you think it will be until you are able to get a coronavirus vaccine?” “How many months do you think it will be until a coronavirus vaccine will be made available to the public?” and “How many months do you think it will be until the coronavirus pandemic ends?” (0–36 months).
Finally, to assess pandemic concern, participants rated: “How concerned are you about the coronavirus pandemic?” “How worried are you about getting coronavirus?” and “How worried are you about spreading coronavirus to others?” (1 = not at all, 7 = very). We averaged these items into a concern index (αs between .747 and .766).
Results and Discussion
As expected, participants felt closer to receiving a vaccine (p < .001), the vaccine becoming publicly available (p < .001), and the end of the pandemic (p < .001) in March than the average of November and December. However, in March, participants still anticipated they were approximately 11 months away from the end of the pandemic (Table 3).
Study 2 Descriptive Statistics (SDs in Parentheses)
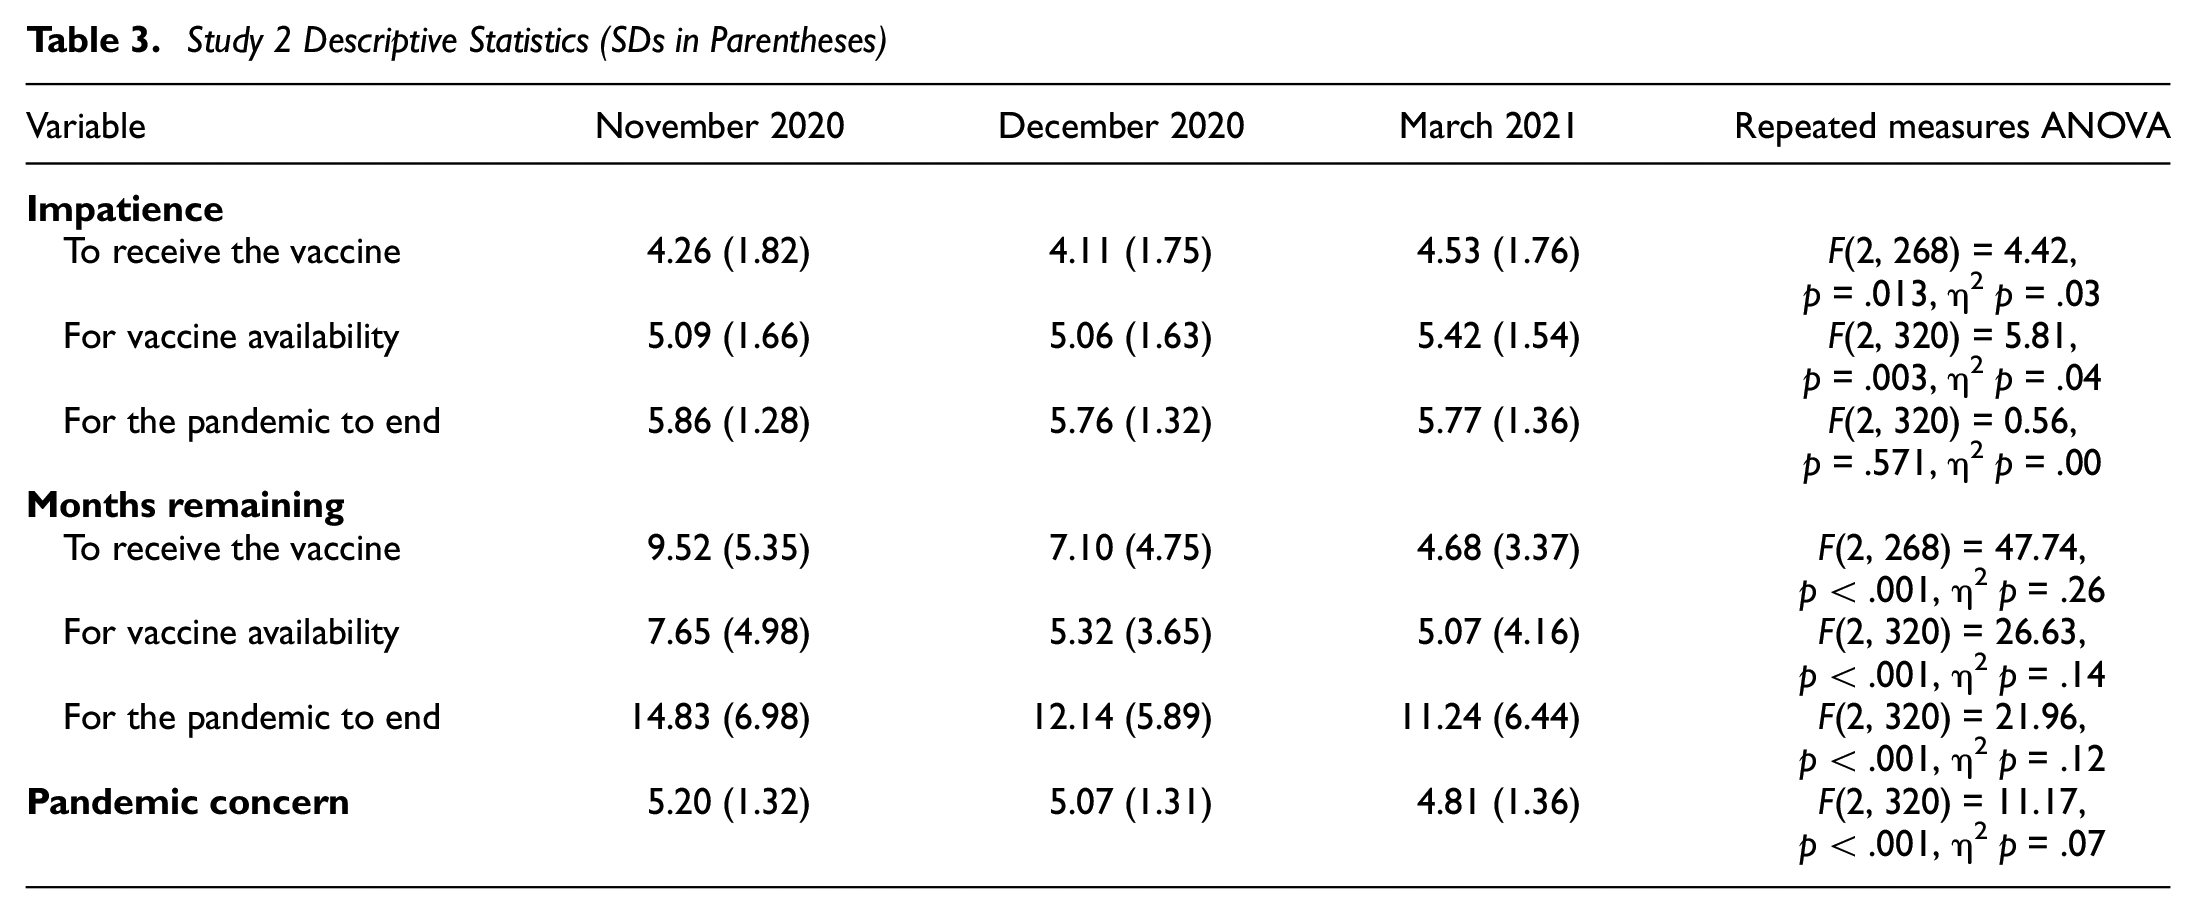
Supporting our hypothesis, impatience for the vaccine increased closer to the end of the wait. Participants felt more impatient to receive the COVID-19 vaccine (p = .010) and for the vaccine to become publicly available (p < .001) in March than the average of November and December. However, impatience for the pandemic to end did not increase (Figure 2). Because participants were more impatient for the vaccine but not for the pandemic to end, we conclude that the increasing trajectory of impatience was caused by proximity to the end of the wait rather than the distance from the beginning.
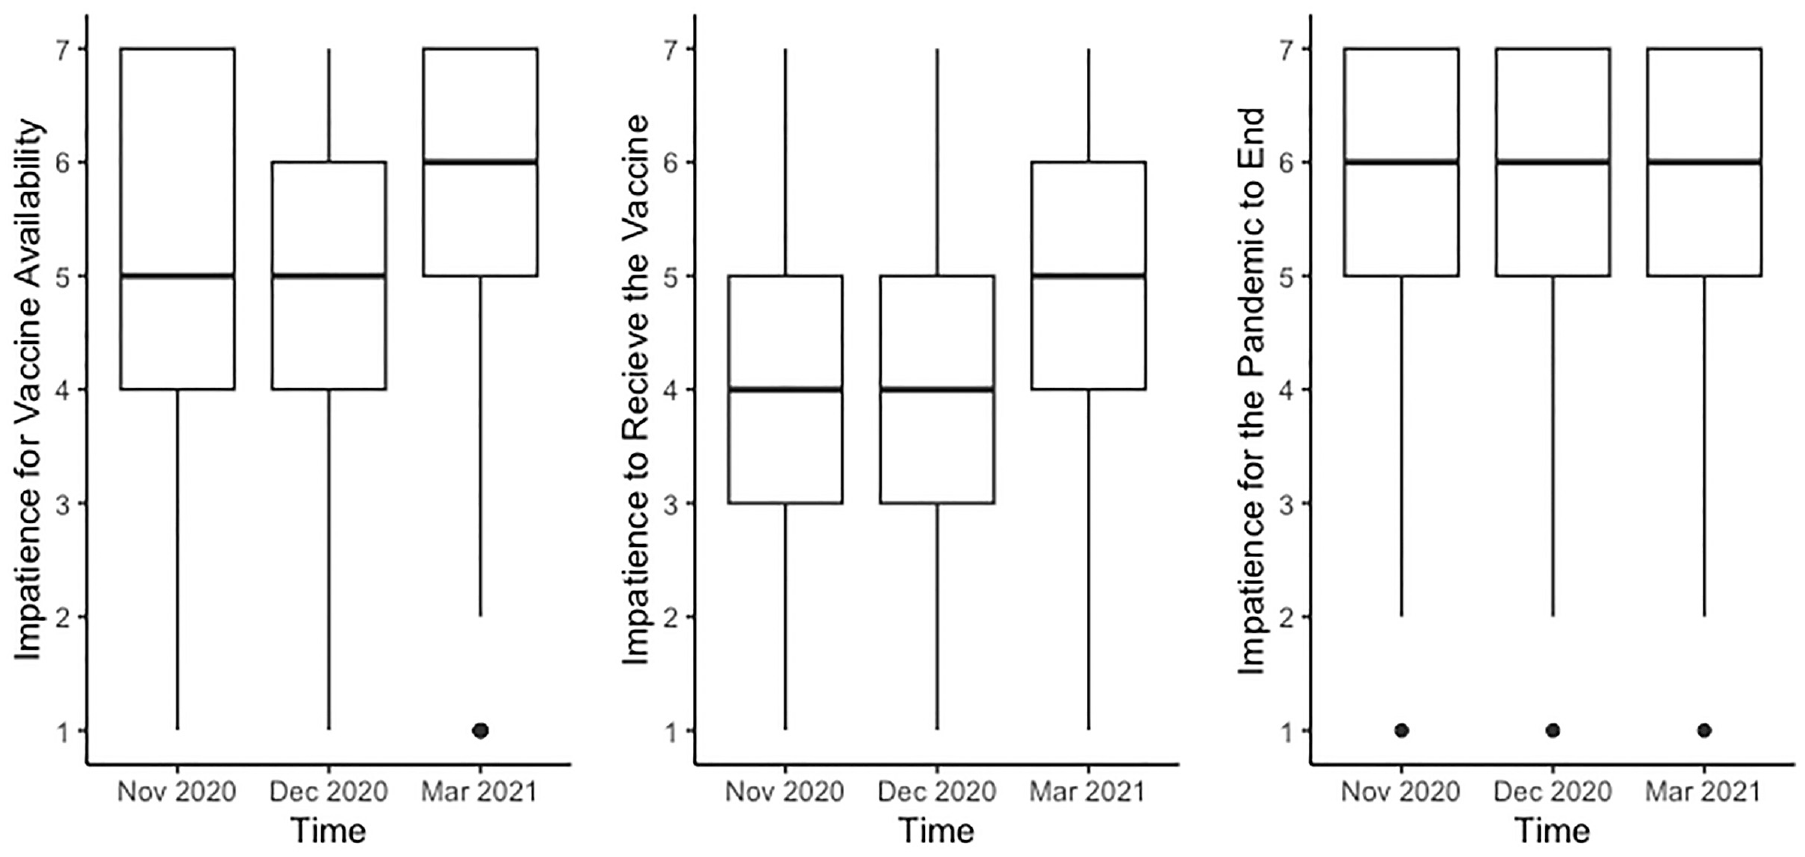
Feelings of Impatience to Receive the COVID-19 Vaccine, for the COVID-19 Vaccine to Become Available to the Public, and for the Pandemic to End Over Time (Study 2). Impatience for the Vaccine to Become Available and to Receive the Vaccine Increased Over Time, But Impatience for the Pandemic to End Did Not
We further found moderation by political orientation, where liberals became more impatient over time, but conservatives did not (see SOM5 for full details). Because liberals were presumably more interested in getting vaccinated, they were also growing more impatient closer to its arrival.
Finally, participants felt less concerned about the COVID-19 pandemic in March than the average of November and December (p < .001). Indeed, the number of daily reported new COVID-19 cases in the United States was lower in March (below 70,000) than in November-December (highs of 170,000+ new cases daily; Allen et al., 2021). We conclude that impatience for the vaccine increased despite people feeling less concerned about the virus. In addition, both the pandemic and the vaccine received media attention at the time of the study, yet participants only grew more impatient for the vaccine, which is consistent with our assumption that a desire for closure caused the increase in impatience.
Study 3: Impatience for the Bus
Study 3 (preregistered: https://aspredicted.org/ec4gc.pdf) measured commuters’ impatience while waiting to board a bus. Unlike the background wait for the election results and getting vaccinated, waiting at a bus stop is a focal experience. We predicted that commuters would feel more impatient as the bus approached its arrival time, controlling for the total duration of the wait.
Method
Participants
We recruited 218 participants from university and downtown bus stops in exchange for candy. As preregistered, we excluded participants not currently waiting for the bus, for a final sample of 207 participants (127 women; Mage = 25.13, SDage = 7.55; 54% graduate students, 25% undergraduate students, 8% other students, and 13% not students).
Procedure
To assess the distance to the bus arriving, participants estimated both the amount of time they had already spent waiting for the bus and the time remaining until the bus arrived (in minutes). We computed the total wait time (sum of time already spent waiting and time remaining) and the proportion of remaining wait time (time remaining divided by the total wait time). There was no correlation between these two measures (r = .032). (Note that we preregistered using the percent waited rather than the percent remaining, which is the exact inverse. See SOM7 for more details.)
To assess impatience, participants rated: “How impatient do you feel waiting for the bus?” and “How annoyed do you feel waiting for the bus?” (1 = not at all, 7 = very). We averaged these items (r = .722). In this study, we added a measure of annoyance to confirm that impatience is a negative experience. For each participant, research assistants noted the time, weather (sunny vs. cloudy vs. snow or rain), temperature, wind level, number of people at the bus stop, whether participants were waiting with friends, and whether the bus was on time.
Results and Discussion
Supporting our hypothesis, the remaining wait (M = 0.53, SD = 0.24) predicted impatience for the bus to arrive (M = 3.36, SD = 1.59), b = −0.90, SE = 0.45, p = .046, 95% CI = [−1.79, −0.02], controlling for the total length of the wait (M = 12.15 min, SD = 8.97), b = 0.04, SE = 0.01, p < .001, 95% CI = [0.02, 0.07]. Participants felt more impatient as the bus arrival time approached.
In addition, the remaining wait predicted impatience, b = −1.06, SE = 0.46, p = .022, 95% CI = [−1.96, −0.15], when controlling for the time of day, weather, temperature, wind, number of people at the bus stop, whether participants were waiting with friends, and whether the bus was on time (see SOM7 for full details). Proximity to the end of the wait increased impatience.
Follow-up Studies
We conducted four follow-up studies (Supplemental Studies 1–4). These studies used hypothetical scenarios to explore whether seeking closure underlies the effect of the distance to the end of the wait on impatience. We found that impatience is a function of the distance to the end of the wait, rather than the time spent waiting, and that a desire for closure mediated the effect. Feeling impatient further led to worse service evaluations.
Specifically, Study S1 found that even after waiting the same amount of time, participants who were closer to receiving a package expected to feel more impatient. That is, after waiting 6 days, participants felt more impatient when the package would arrive later that day compared with when it would arrive in another 6 days. The desire for goal closure mediated the increase in impatience.
Study S2 explored implications for service providers. When a package arrived after 6 days, participants expected to feel more impatient, had a stronger desire for closure, and rated the delivery service as worse if that was the expected delivery date (6-day expected delivery) than if it arrived earlier than expected (10-day expected delivery).
Moving from temporal to geographical distance to the end of the wait, participants in Study S3 expected to feel more impatient when a package they were waiting for was closer to its destination for several days (1 vs. 100 miles away) and rated the delivery service as worse. We further found evidence for serial mediation, where: (a) a package closer (vs. further) from the destination increased the desire for closure, (b) the desire for closure increased impatience, and (c) impatience decreased evaluations of the delivery service.
Finally, moving to traffic delays, participants in Study S4 expected to feel more impatient during a 45-min traffic delay that occurred 1 mile (vs. 12 miles) from their destination.
General Discussion
Waiting feels worse closer to its end. We documented this effect with participants awaiting the results of the presidential elections, the first COVID-19 vaccine, and the bus. We further find that people’s desire for closure underlies the increase in impatience at the end of the wait.
These findings complement research on patient decision-making. Intertemporal choice research finds that people make more impatient choices when closer to the smaller-sooner reward (Ainslie, 1975; Thaler, 1981). Although the lure of a closer reward might increase, another potential explanation is that waiting feels worse closer to the reward. Indeed, we find that people feel worse closer to the conclusion of a wait, even when they have no choice to make or action to take. In these situations, people’s experience matters for their well-being and evaluation of policies and services.
These findings also complement goal-gradient research by exploring the negative consequence of approaching the end of a goal. The eagerness to finish a goal that sometimes leads to excitement and effort investment (Brown & Lahey, 2015; Dai & Zhang, 2019; Hull, 1932; Kivetz et al., 2006; Koo & Fishbach, 2012; Wadhwa & Kim, 2015) can also lead people to feel worse when they cannot accelerate goal attainment. Although goal-gradient research explores the positive effects of proximity to a goal and the desire for closure it engenders, the present research highlights the downside of seeking closure closer to reaching a goal.
These results also extend previous research on the experience of waiting for uncertain news, such as the results of the bar exam (Howell & Sweeny, 2016; Sweeny & Andrews, 2014; Sweeny et al., 2016; Sweeny & Krizan, 2013). We find that impatience continues to increase even when there is little uncertainty (e.g., waiting for a vaccine) or the uncertainty has decreased (e.g., after election day). Indeed, participants felt more impatient after election day despite being more certain about who would win the election. This suggests that the increase in impatience over time is instead a result of the desire for closure.
We offer practical implications for policymakers communicating uncertain wait times. They should inform people about a delay earlier in the wait and generally overestimate, rather than underestimate, the wait time. This can improve people’s experience by reducing their impatience. Indeed, in our supplemental studies, impatience was a function of people’s expectations about the end of the wait rather than how long they had waited, and it influenced service evaluations. Other research found that a late delivery reduces future spending more than early delivery increases expenditure: Arriving an hour late decreased future spending by 12.5% but arriving an hour early increased future spending by only 6.5% (Gui & Drerup, 2022).
Limitations
Studies 1 to 3 measured reactions as world events unfolded. Although these studies offer insight into how impatience changes over time, they have limited experimental control. We could not experimentally manipulate how far participants were through the wait (Studies 1–3) or control for media coverage that may have intensified over time (Studies 1 and 2). The experiments in Studies S1 to S4 allowed us to explore the process underlying the effect (the desire for closure) and to separate how long participants had been waiting from how much they still had to wait. Yet, these experiments assessed participants’ reactions to hypothetical scenarios, which could have reflected their lay theories rather than actual experience.
In addition, in Studies 1 and 2, we rely on a single item to measure impatience. This was intended as a straightforward measure of impatience. We purposely did not add questions that would influence participants’ interpretation (e.g., associating impatience with anxiety or anger). In Study 3 and Studies S1 to S3, we created an impatience scale by adding items from previous literature (Pruyn & Smidts, 1998), such as feeling bothered or annoyed while waiting, to confirm that impatience is a negative experience. These scales were designed to capture the negative experience of waiting.
Across our studies, we measure how university students, city residents, and online participants from the United States respond to waiting for election results, vaccines, the bus, a package, and when in traffic. Whether our results generalize to other waiting experiences, for adults from different cultural backgrounds, and for waits below a few minutes or over several months, remains an open question. We have no reason to believe that the results depend on other characteristics of the participants, materials, or context (Simons et al., 2017).
Remaining Questions and Potential Moderators
We observed both linear and quadratic trends of impatience (see SOM9). An open question is whether (and when) impatience increases linearly versus exponentially. Possibly, impatience increases linearly for waits with known endpoints. Alternatively, when the end is uncertain, it is harder to evaluate progress early on. Thus, people will only become impatient toward the end, resulting in an exponential increase. The length of the wait may also influence the trend of impatience. Impatience may increase linearly for shorter waits but exponentially for longer waits. With shorter waits, people may feel like they are getting closer to the end with each minute, while they may not feel close to the end of a longer wait—and thus, not more impatient—until right before the end.
The wait duration may also influence how impatient people feel overall while waiting. We found that people become more impatient closer to the end of short (e.g., minutes for the bus) and long waits (e.g., months for the COVID-19 vaccine). However, longer waits are harder (Taylor, 1994; Tom & Lucey, 1997), and the subjective experience of being close to the end may be relative to the total length of the wait. When waiting a week, people may become more impatient a day before the end, while when waiting a year, impatience may begin to increase a month before the end.
In conclusion, as the end of a wait approaches, impatience increases due to a heightened desire for closure. We call for greater awareness of the diminishing patience of individuals about to reach their goals.
Supplemental Material
sj-docx-1-spp-10.1177_19485506231209002 – Supplemental material for Impatience Over Time
Supplemental material, sj-docx-1-spp-10.1177_19485506231209002 for Impatience Over Time by Annabelle R. Roberts and Ayelet Fishbach in Social Psychological and Personality Science
Footnotes
Handling Editor: Yoav, Bar-Anan
Declaration of Conflicting Interests
The author(s) declared no potential conflicts of interest with respect to the research, authorship, and/or publication of this article.
Funding
The authors would like to thank the University of Chicago, Booth School fo Business and University of Texas at Austin, McCombs School of Business for funding for the research.
Open Science Framework
Supplemental Material
The supplemental material is available in the online version of the article.
Author Biographies
References
Supplementary Material
Please find the following supplemental material available below.
For Open Access articles published under a Creative Commons License, all supplemental material carries the same license as the article it is associated with.
For non-Open Access articles published, all supplemental material carries a non-exclusive license, and permission requests for re-use of supplemental material or any part of supplemental material shall be sent directly to the copyright owner as specified in the copyright notice associated with the article.