
Abstract
Vaccination is a pressing public health issue. We hypothesize that impatience (discounting future benefits of current actions) leads to lower vaccination rates and worse attitudes toward vaccines. In preregistered individual-level Study 1 (N = 2,614), we document a positive and quantitatively small association (standardized coefficient = 0.06) between patience and attitudes toward vaccines. In Study 2 (N = 76), national-level patience accounts for 21% of the global variation in COVID-19 vaccinations; patience’s effect is small-to-moderate (standardized coefficient = 0.19). In duration models (Study 3; 4,180 ≤N≤ 9,973), more patient countries more quickly reach high COVID-19 vaccination thresholds. The results generalize beyond COVID-19: Patience among European subnational regions predicts better attitudes toward vaccination against the 2009 swine influenza (Study 4: Nregions = 138; Ncountries = 17). Finally (Study 5, N = 75), our results are not specific to pandemics: National patience explains the global variation in infant vaccinations.
Introduction
In the COVID-19 era, understanding what drives attitudes and behaviors toward vaccines is critical. Vaccine hesitancy is a global problem (Solís Arce et al. 2021). Such sentiments are not new: Europe and the United States had large antivaccination movements in the 19th century. Vaccination was linked to controversial debates (Snowden, 2019). Satirical cartoons showed societal anxieties (Supplemental SI, Figure A1). Waves of discussions around vaccination and antivaccination over the last two centuries are reported in Figure A2 in Supplemental SI.
An under-appreciated facet of vaccination decisions is that they involve intertemporal trade-offs. Potential costs of vaccination, that is, inconvenience or side effects, are incurred immediately. Benefits, however, only materialize in the long term, since immunity is not instantaneous (Antia et al., 2018). This makes vaccination an intertemporal problem. Given this intertemporality, we hypothesize that more patient individuals are (1) more likely to be vaccinated and (2) more likely to hold favorable attitudes toward vaccines.
Patience, or the ability to delay rewards, has long been of interest to social and behavioral scientists (Mischel & Ebbesen, 1970; Rae, 1834; Triandis et al., 1973). Patience leads to investment in future rewards and matters because investments are made today even though benefits may not be felt today. Patience leads to more human and physical capital accumulation, both of which entail costs now but benefits later (Sunde et al., 2022).
Of course, patience is not the only decision-making facet influencing one’s stance toward vaccinating; attitudes toward risk and cooperation are key competing explanations. We control for risk tolerance and social preferences, including positive and negative reciprocity, altruism, and trust. Our results apply specifically to patience (ability to delay rewards), rather than other time-based constructs including positive urgency, negative urgency, perseverance, premeditation, and sensation-seeking. Thus, we go beyond Halilova et al. (2022), who show that delay discounting is steeper among the unvaccinated, but do not control for other decision-making preferences.
In our preregistered individual-level study (Study 1), we show that more patient individuals hold more positive views about the safety and effectiveness of COVID-19 vaccines, and of vaccines generally. We also find a positive correlation between country-level patience and COVID-19 vaccination rates (Study 2), which holds after controlling for covariates explaining more than 80% of the variation in global vaccination rates. In Study 3, we estimate time-to-event models, establishing that more patient countries more quickly reach high vaccination levels. We then ask whether the patterns we observe are limited to COVID-19 (Study 4) or pandemics more generally (Study 5). In both cases, the answer is no: Patience predicts attitudes toward vaccines against the 2009 H1N1 swine influenza in European regions; the patience vaccination nexus is thus not specific to any pandemic. National-level patience (Study 5) also explains the global variation in “business-as-usual” infant vaccinations, indicating that the link between patience and vaccination holds beyond pandemic settings.
Two important caveats apply. First, at the individual level, while patience predicts attitudes toward COVID-19 vaccines in all models, the correlation between patience and attitudes toward vaccines in general is noisy (95% confidence interval [CI]: −0.01 to +0.09) when income and education are controlled for. Similarly, the country-level link between patience and infant vaccinations disappears when income is controlled for (95% CI: −0.21 to +0.23). However, controlling for income and/or education introduces a bad control problem (Angrist & Pischke, 2009): Conditioning on a downstream variable biases our coefficients toward zero (Figure A4 in the Supplemental Material). In our preferred estimates, where income/education are not included, patience predicts infant vaccinations and attitudes toward vaccines. Second, the individual-level effect sizes are quite small relative to the national-level effects. We speculate on why this is in the “Limitations” section.
Our results align with Fehr and Leibbrandt (2011), Curry et al. (2008), and Espín et al. (2012), who show that people are more cooperative. This is important if one views vaccination as a cooperative endeavor (Korn et al. 2021), but appeals to prosociality have no effect on COVID-19 health behaviors (Rabb et al., 2021), despite vaccination’s public good nature (Korn et al., 2021). Scholars cast doubt on whether prosociality matters for cooperation (Burton-Chellew & West, 2013). Our results suggest that patience is markedly more important than risk and social preferences (RSP): Appeals to patience should be investigated as a way to promote vaccination.
Study 1. Patience and Individual-Level Attitudes and Behaviors Toward Vaccines
Survey
We ran an original survey (N = 2,614) in November to December 2022. We collected a sample of U.K. respondents (N = 395) on Prolific (preregistration), yielding estimates of the hypothesized sign, but lacking statistical power (0.12 < power < 0.56). We preregistered an extension of our data collection here, yielding 2,212 valid surveys on MTurk and another 7 through a Facebook advert. Following our pre-analysis plan, we excluded respondents who failed an attention check or gave invariant answers in the Urgency, Premeditation, Perseverance, Sensation seeking - Positive urgency (UPPS-P) block. We also excluded participants who took the survey more than once on MTurk. Figure A3 in Supplemental SI reports the number of participants by country. We sampled respondents from a large cross-section of countries, although U.S.-based respondents represent a large share of the sample. About 52% of respondents were female; mean age was 35.2 years (standard deviation [SD] = 11.5).
Models and Dependent Variables
We estimate variants of
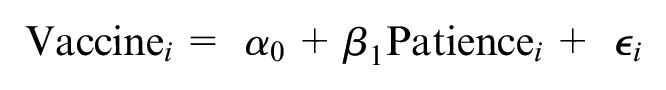
where
whether the respondent has received one or more vaccinations for COVID-19;
to what extent the respondent agrees that COVID-19 vaccines are safe and effective; or
to what extent the respondent agrees that vaccines (not specific to COVID-19) are safe and effective.
For the first dependent variable (DV), the model is estimated using logit; for the other two DVs, ordinary least squares are used. Throughout, we estimate heteroskedasticity-robust standard errors (SEs).
Patience
The survey question we used is as follows: “How willing are you to give up something that is beneficial for you today in order to benefit more from that in the future?”. Thus, conceptually, patience is the ability to delay rewards. This has long been an area of interest in psychology (see, e.g., Eisenberger & Adornetto 1986; Hayden, 2016; Jimura et al., 2009). Psychological studies typically measure the ability to delay rewards using experimental tasks in which participants decide between a sum of money today and a larger sum at a later date. In this study, we do not use a monetary framing, as doing so may induce respondents to focus on patience in the particular domain of financial decision-making. Rather, we opt for a neutral formulation, with the intention of eliciting general attitudes toward the ability to delay rewards.
RSP
In some models, we control for RSP, which might correlate with both patience and vaccination attitudes and behaviors. These are risk preferences, positive reciprocity, negative reciprocity, altruism, and trust (see Supplemental SI, Table A1 for definitions).
Impulsivity and Sensation-Seeking
In some models, we control for the five components of the short UPPS-P Impulsive Behavior scale (Cyders et al., 2014): (1) negative urgency (the tendency to act rashly under extreme negative emotions); (2) positive urgency (the tendency to act rashly under extreme positive emotions); (3) sensation-seeking (the tendency to seek out novel and thrilling experiences); (4) lack of premeditation (the tendency to act without thinking); and (5) lack of perseverance (the inability to remain focused on a task). We coded these items exactly following the UPPS-P instructions (available here).
Demographic Controls
We also consider the following demographic controls: a dummy for female, an essential worker dummy, a set of dummies for employment status (full-time, part-time, retired, student, and unemployed; reference category = other), a set of dummies for education (high school, university, and postgraduate; reference category = not completed high school), and income. Income and education, however, suffer from what causal inference scholars term the “bad control” problem (Angrist & Pischke, 2009; Cinelli et al., 2020; see Supplemental SI, Figure A4 for an illustration): Where a covariate Z is an outcome of the independent variable X whose effect on Y we are interested in identifying, controlling for Z leads to a downward bias in the coefficient of X. As Angrist and Pischke (2009) note, good controls are “variables that we can think of having been fixed at the time the regressor of interest was determined” (p. 64). Education and income are bad controls in this setting, as they are very likely to be themselves determined by patience, rather than to have been fixed at the time patience was determined. Sunde et al. (2022) and Hanushek et al. (2022) convincingly show that more patience leads to more education, and economists have known since at least Lazear (1975) that education has a positive causal effect on income.
Results: Vaccination Behavior
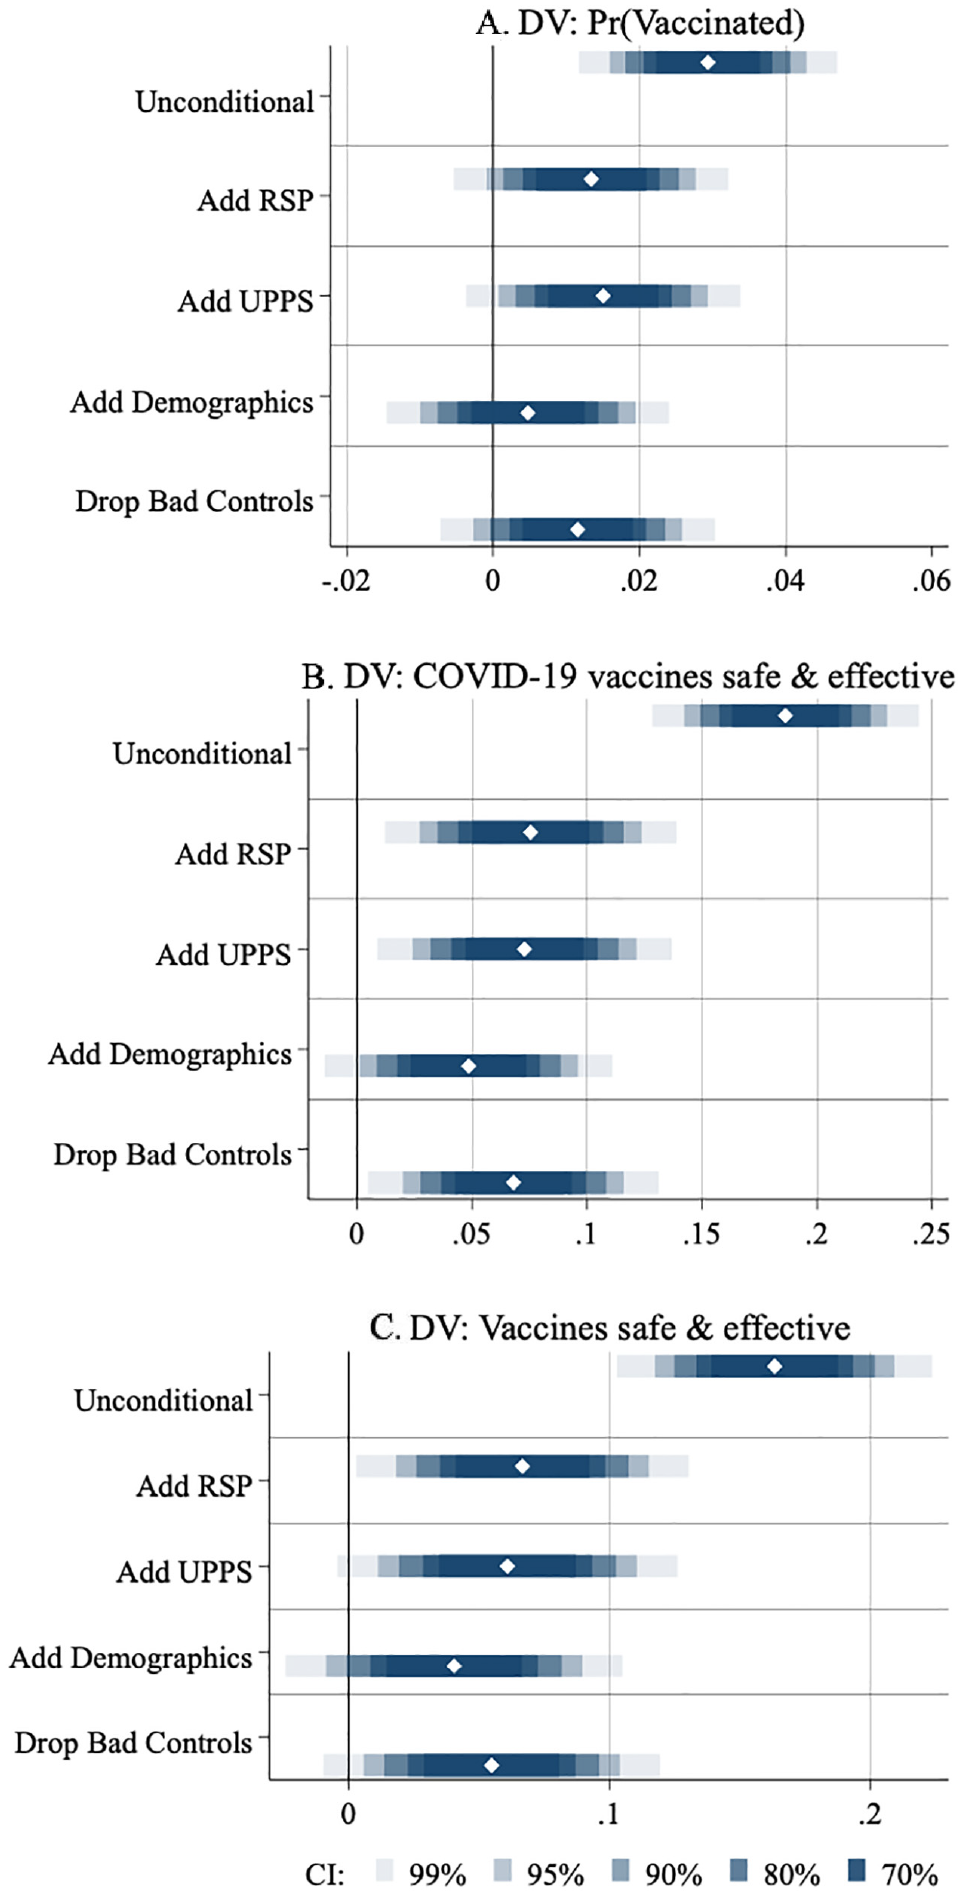
Figure 1 and Tables A2–A4 in Supplemental SI display the results. In the top panel of Figure 1, the DV is the probability that the respondent has received one or more COVID-19 vaccines. Patience is standardized by taking the z-score. In the baseline model, a 1 SD increase in patience correlates with a 2.9 p.p. larger probability of being vaccinated (p < .000). Put differently, the average levels of patience are −0.21 (95% CI: −0.325 to 0.095) among the unvaccinated but 0.04 (95% CI: −0.004 to 0.076) among the vaccinated. The second spike in Panel A adds RSP to the model; the third adds the UPPS-P variables. The results are statistically significant at the 10% and 5% levels, respectively. The fourth spike of Panel A adds demographic controls, causing the coefficient of patience to become insignificant. However, as discussed above, income and education suffer from the bad control problem and thus should be excluded from the model on theoretical grounds. When we do so (fifth spike), the coefficient of patience is now 1.2 p.p. with a p value equals to .112. In summary, once we account for covariates, there is only limited support for a relationship between patience and vaccination behavior.
Study 1: Main Results
Results: Vaccination Attitudes
Panels B and C present results for the following two attitudinal questions, respectively: Whether COVID-19 vaccines are safe and effective, and whether vaccines in general are safe and effective. Both variables are standardized. We find a strong correlation between patience and attitudes toward vaccines. In the most restrictive specifications which do not suffer from the bad control problem (the fifth and final spikes of each panel), a 1 SD increase in patience is associated with 0.07 SD (p < .01; Panel B) and 0.06 SD (p < .05) increases in attitudes toward the safety and effectiveness of vaccines. While the coefficients are statistically significant, it is worth highlighting that the effect sizes are rather small. Assuming normal distributions for patience and for attitudes toward vaccination, a standardized effect size of 0.07 indicates that, relative to a “baseline” individual located at the median level of patience and at the median level of vaccination attitudes (50th percentile of each distribution), a 1 SD more patient individual (located at the 84th percentile of the patience distribution) will be located at the 53rd percentile of the vaccine attitude distribution.
Departures From Preregistration
In addition to excluding respondents who failed an attention check or gave invariant answers to the UPPS-P scale, we exclude respondents who took the survey two or more times on MTurk, which we did not pre-empt. While we report every preregistered specification, the fifth spike of each panel (dropping bad controls) was not preregistered, but is justified on theoretical grounds.
Study 2: Patience and Country-Level Vaccinations Against COVID-19 in October to November 2021
Patience and RSP
Patience, risk, and social preferences come from the Global Preferences Survey (GPS; Falk et al., 2018). The GPS uses experimentally validated survey questions to measure time, risk, and social preferences; GPS measures reflect how people behave in incentivized experiments. For 76 countries, the GPS collected data on nationally representative samples of at least 900 individuals per country (except Haiti and Suriname, which have small populations, where N = 500 approximately), for a total of approximately 80,000 respondents. Countries at various levels of development from all continents were sampled (Supplemental SI, Table B1), thus avoiding the issue of performing research using data exclusively from Western, Educated, Industrialized, Rich, Democratic (WEIRD) cultures. The key concepts in the GPS survey were understood similarly, relative to each other, across cultural regions (Supplemental SI, Appendix G). Appendix F provides comprehensive details on the construction of the patience measure. In the GPS, patience was measured as a weighted average of (1) hypothetical choice tasks, where the respondent decides between a given payment today or a larger payment in a year’s time, and (2) a question asking, on a scale of 0 to 10, how willing the respondent is to give up something beneficial today to benefit more from that tomorrow. We use an identically worded question in Study 1.
The GPS items are closely related to delayed-reward tasks: They are essentially hypothetical delayed-reward tasks. An important distinction between the GPS measure of patience and the single-question measure of patience is that the latter is a “general-domain” subset of the former. Whereas the GPS measure is an average of (1) patience as it relates to monetary stakes (the staircase hypothetical choice item) and (2) patience as the general willingness to delay rewards (not specific to monetary stakes), our Study 1 measure of patience corresponds to item 2 only. Thus, while patience in our Study 1 can be interpreted as general patience, patience in the GPS partly refers to general patience and partly refers to monetary patience.
Results
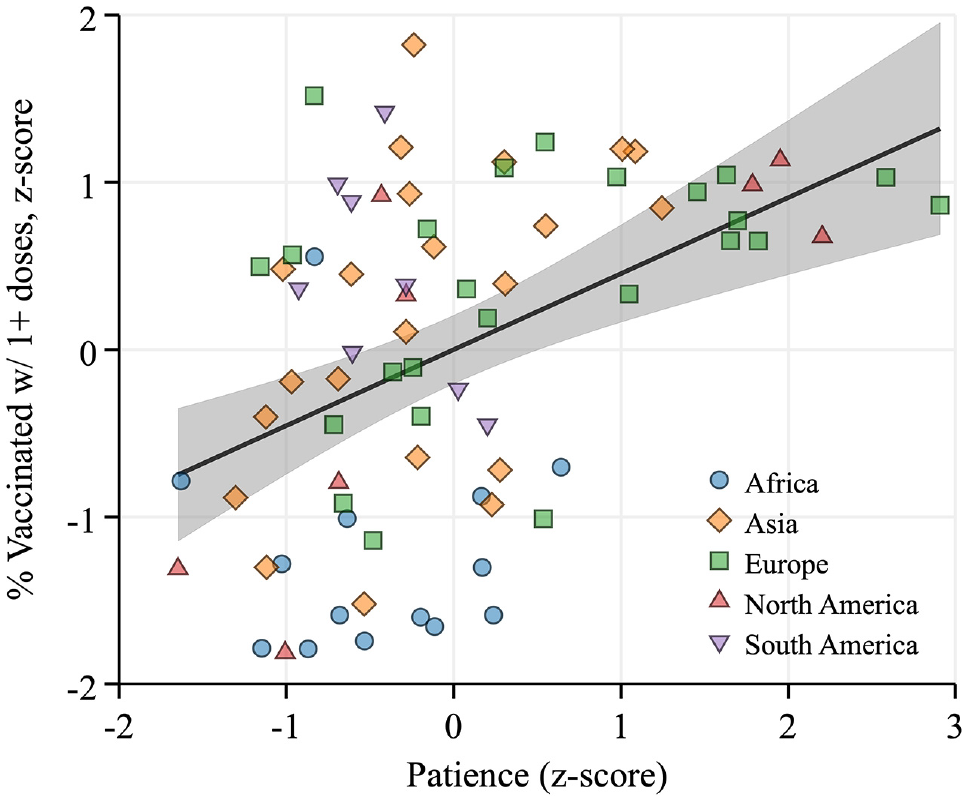
Figure 2 displays the global correlation between the percentages of the population vaccinated with at least one dose and patience, as of October to November 2021 (see Supplemental SI, Table B2 for details). A 1 SD increase in patience is associated with a 0.47 SD increase in vaccination rates (95% CI: 0.31–0.63). Positive correlations can also be seen within continents, suggesting a nearly universal relationship. The results are unchanged if we use the percentage fully vaccinated as a proxy for the vaccination rate or if we consider vaccination rates at earlier points in time (Supplemental SI, Figures B1–B2).
Global Variation in Vaccination Rates and Patience
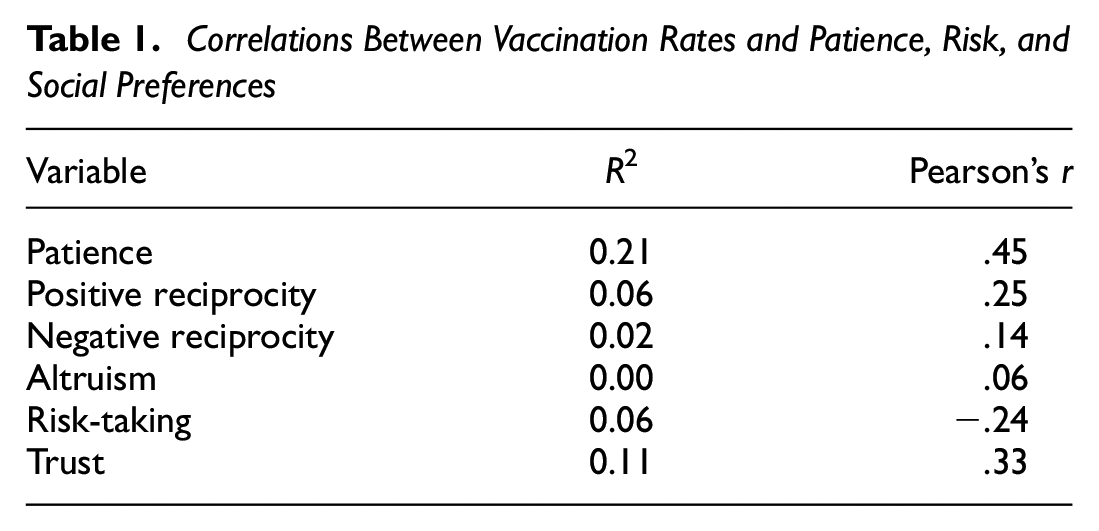
Figure 3 and Table 1 show that none of the RSP measures from the GPS (Supplemental SI, Table B7) are as strongly correlated with vaccination rates as patience. Pearson’s r for the other measures ranges from .06 to .33 in absolute value, relative to .45 for patience. The predictive power of patience is nearly twice as large as that of the next most important variable (with R2 values of 0.21 vs. 0.11 for patience and trust, respectively).
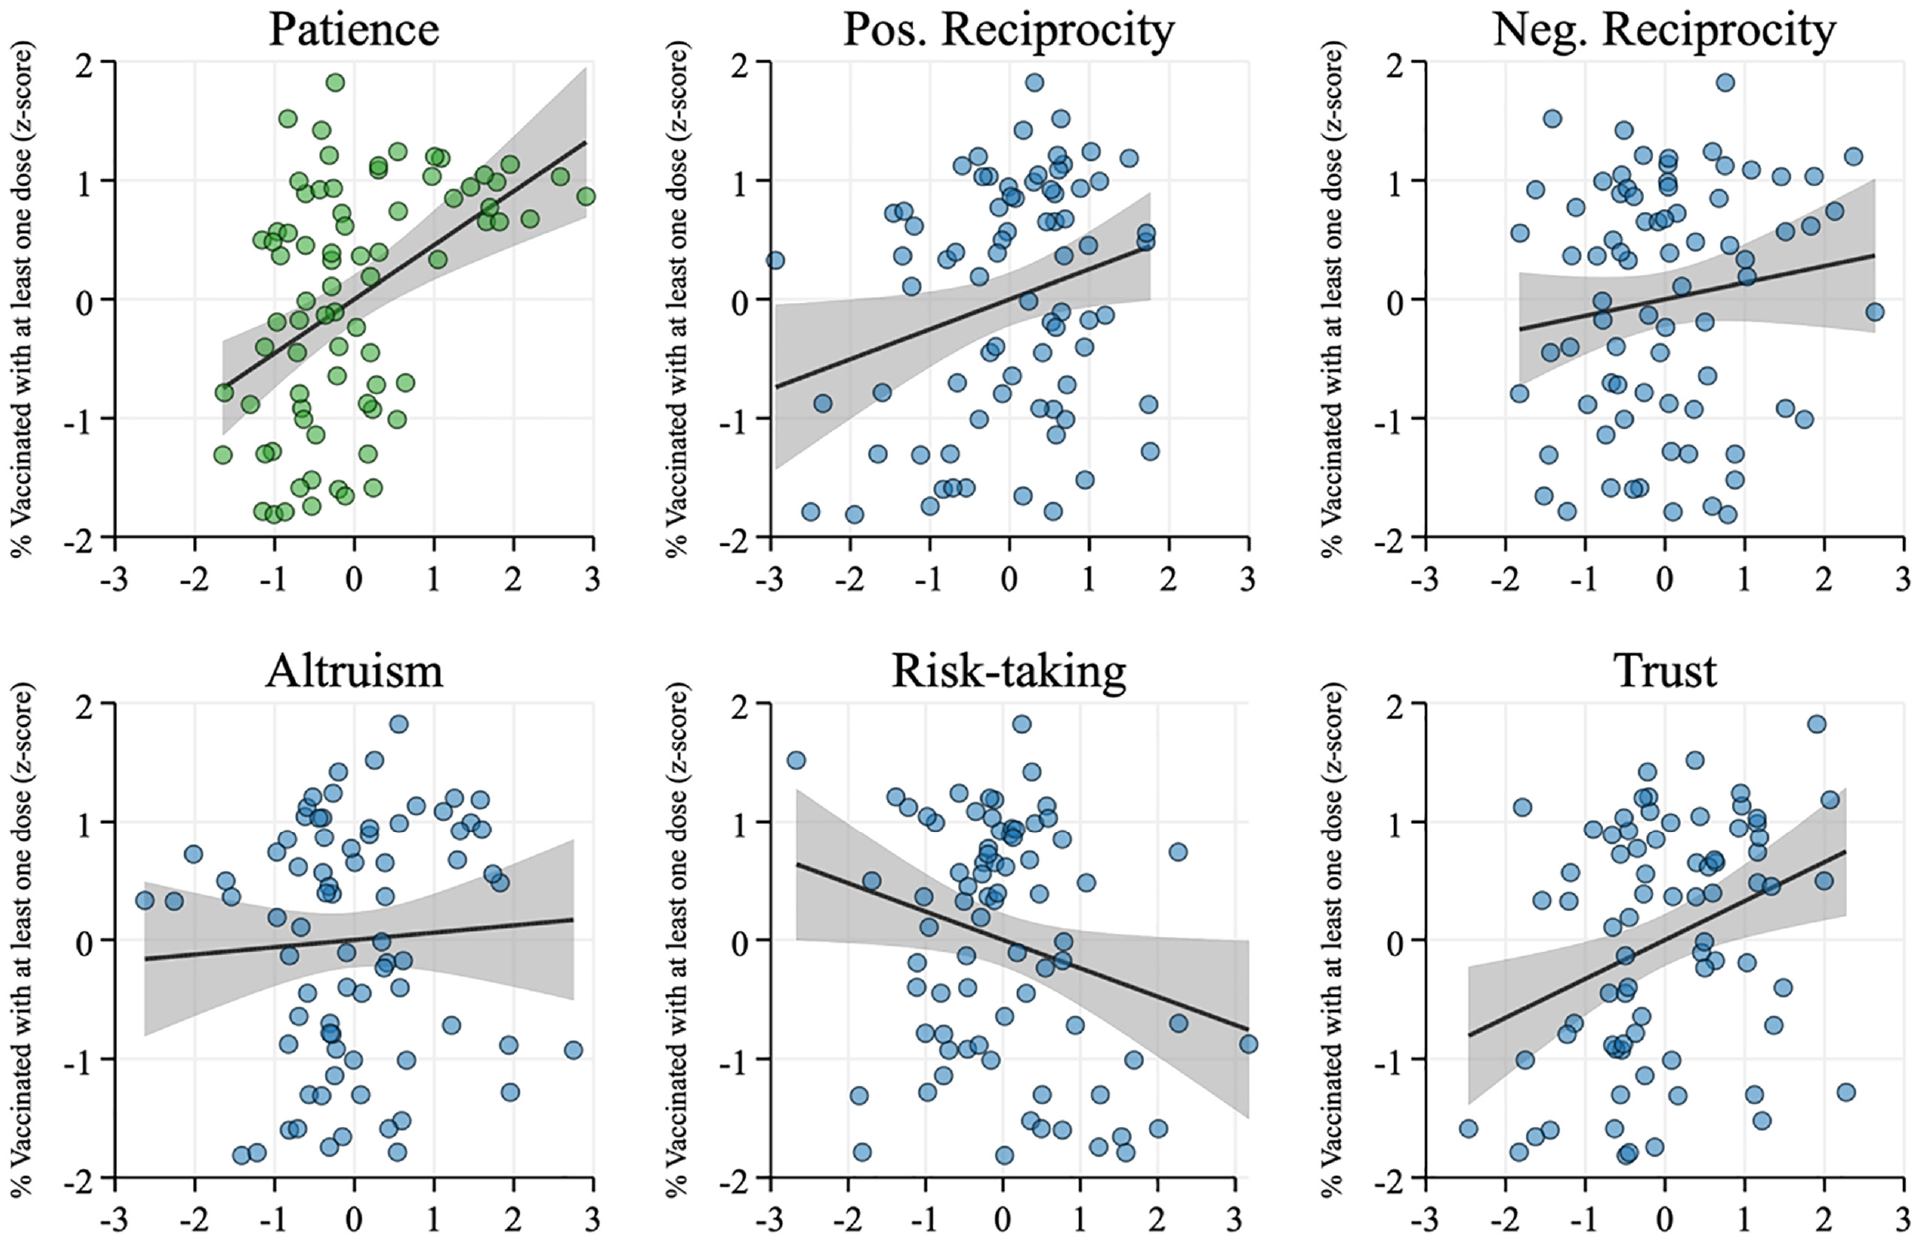
Scatterplots of Unconditional Relationships Between Vaccination Rates, and Patience, Risk, and Social Preferences. All Variables are Standardized
Correlations Between Vaccination Rates and Patience, Risk, and Social Preferences
RSP do not explain away the correlation between patience and vaccination. The coefficient of patience is virtually unchanged when we control for any or all measures of RSP (Supplemental SI, Figure B3). When we control for each GPS measure, the p values from Wald tests for equality of coefficients for patience are ([control variable included: Wald p value]: [positive reciprocity: .87], [negative reciprocity: .82], [altruism: .92], and [trust: .19], and [all GPS variables: .78]). The only significant difference arises when we control for risk tolerance (p = .03), which causes the coefficient of patience to increase. The partial R2 of patience (Supplemental SI, Table B4) is also virtually unchanged when we control for any or all measures of RSP.
Competing Explanations
Other factors could potentially explain away the relationship between patience and vaccination; we control for an extensive set of covariates in Table B5 in Supplemental SI. We select covariates ex ante based on the expectation that they are correlated with vaccination outcomes, thus potentially confounding the results. Controlling for covariates explains 82% of the variation in vaccination rates, while patience remains highly significant and its coefficient remains meaningfully large (ß = 0.19; p < .05; see Supplemental SI, Table B5 and added-variable plot in Supplemental SI, Figure B4). This is a very likely lower bound, since many of the controls we include suffer the “bad control” problem (Angrist & Pischke, 2009). In Table B5 in the Supplemental Material, we include continent dummies, thus comparing countries within the same geographic area; health-related variables (COVID-19 cases per capita measured at the same date as the vaccination data [Supplemental SI, Table B2], hospital beds per 1,000, median age, and a dummy for prior experience with Middle East Respiratory Syndrome (MERS) or Severe Acute Respiratory Syndrome (SARS), income per capita, education, population density, political institutions, optimism, and vaccination policy.
Selection Tests
We quantify how important omitted variables need to be to nullify the correlation between patience and vaccination, using Oster’s (2019)
Randomization Inference
Conventional test statistics rely on large sample approximations: We thus implement randomization inference, which allows us to estimate the actual distribution of test statistics in the data (Fisher, 1935). Whereas a t-test compares the observed test statistic to Student’s t-distribution, Fisherian randomization inference compares the observed test statistic to the distribution of test statistics that could have been obtained under all possible treatment allocations, thus yielding an exact p value. We generate random values for patience and collect the coefficients of patience from a regression of vaccination rates on patience and covariates, repeating this procedure 1,000 times to obtain a distribution of placebo patience coefficients, which we then compare to the coefficient of actual patience. The results are shown in Figure B5 in Supplemental SI. The coefficient of actual patience is larger than that of placebo patience in 998 cases out of 1,000 (p = .002).
Study 3: Patience and Country-Level COVID-19 Vaccination Uptake
Background
National-level patience explains vaccination rates as of late October to early November 2021. However, it is possible that more patient countries happen to have started vaccinating earlier, and as a result, have reached higher vaccination rates earlier. We, therefore, estimate time-to-event models in Study 3, where an “event” is defined as reaching a high vaccination rate (we consider 60%, 65%, and 70% thresholds below). Our hypothesis is that people in more patient countries are more likely to sign up for vaccination, such that the country is quicker to reach high levels of vaccination.
Figure 4 displays Kaplan–Meir curves for above- and below-median patience countries, denoted “High” and “Low.” Event time runs from the day a country implements universal vaccination until the “success” event, which is defined as reaching the threshold of a 70% vaccination rate. The curve for high-patience countries drops faster than that for low-patience countries, indicating that high-patience countries are faster to reach the success event.
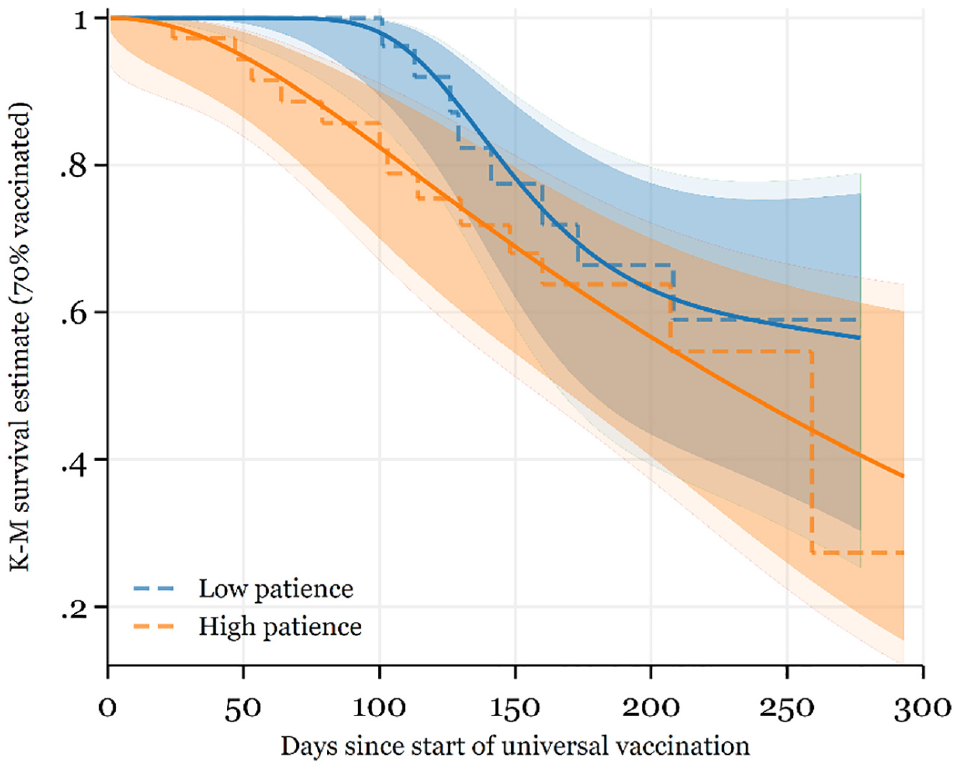
Kaplan–Meier Curves
In Figure 5, we present hazard ratios from random-effects proportional hazards models, with SEs clustered over countries. The success event is defined as reaching thresholds of 60%, 65%, or 70% vaccination. Hazard ratios are interpreted as the chance of the success event occurring in the treatment group relative to the control group. For example, in this setting, a hazard ratio equals to 2 means that a 1 SD increase in national-level patience is associated with a doubling in the probability of reaching the success event during the observation window. In practice, the hazard ratios we estimate in this study are large, ranging from 1.77 to 3.78 approximately, with a median hazard ratio equals to 2.41. All are highly significant except two, for which p = .103 and p = .174.
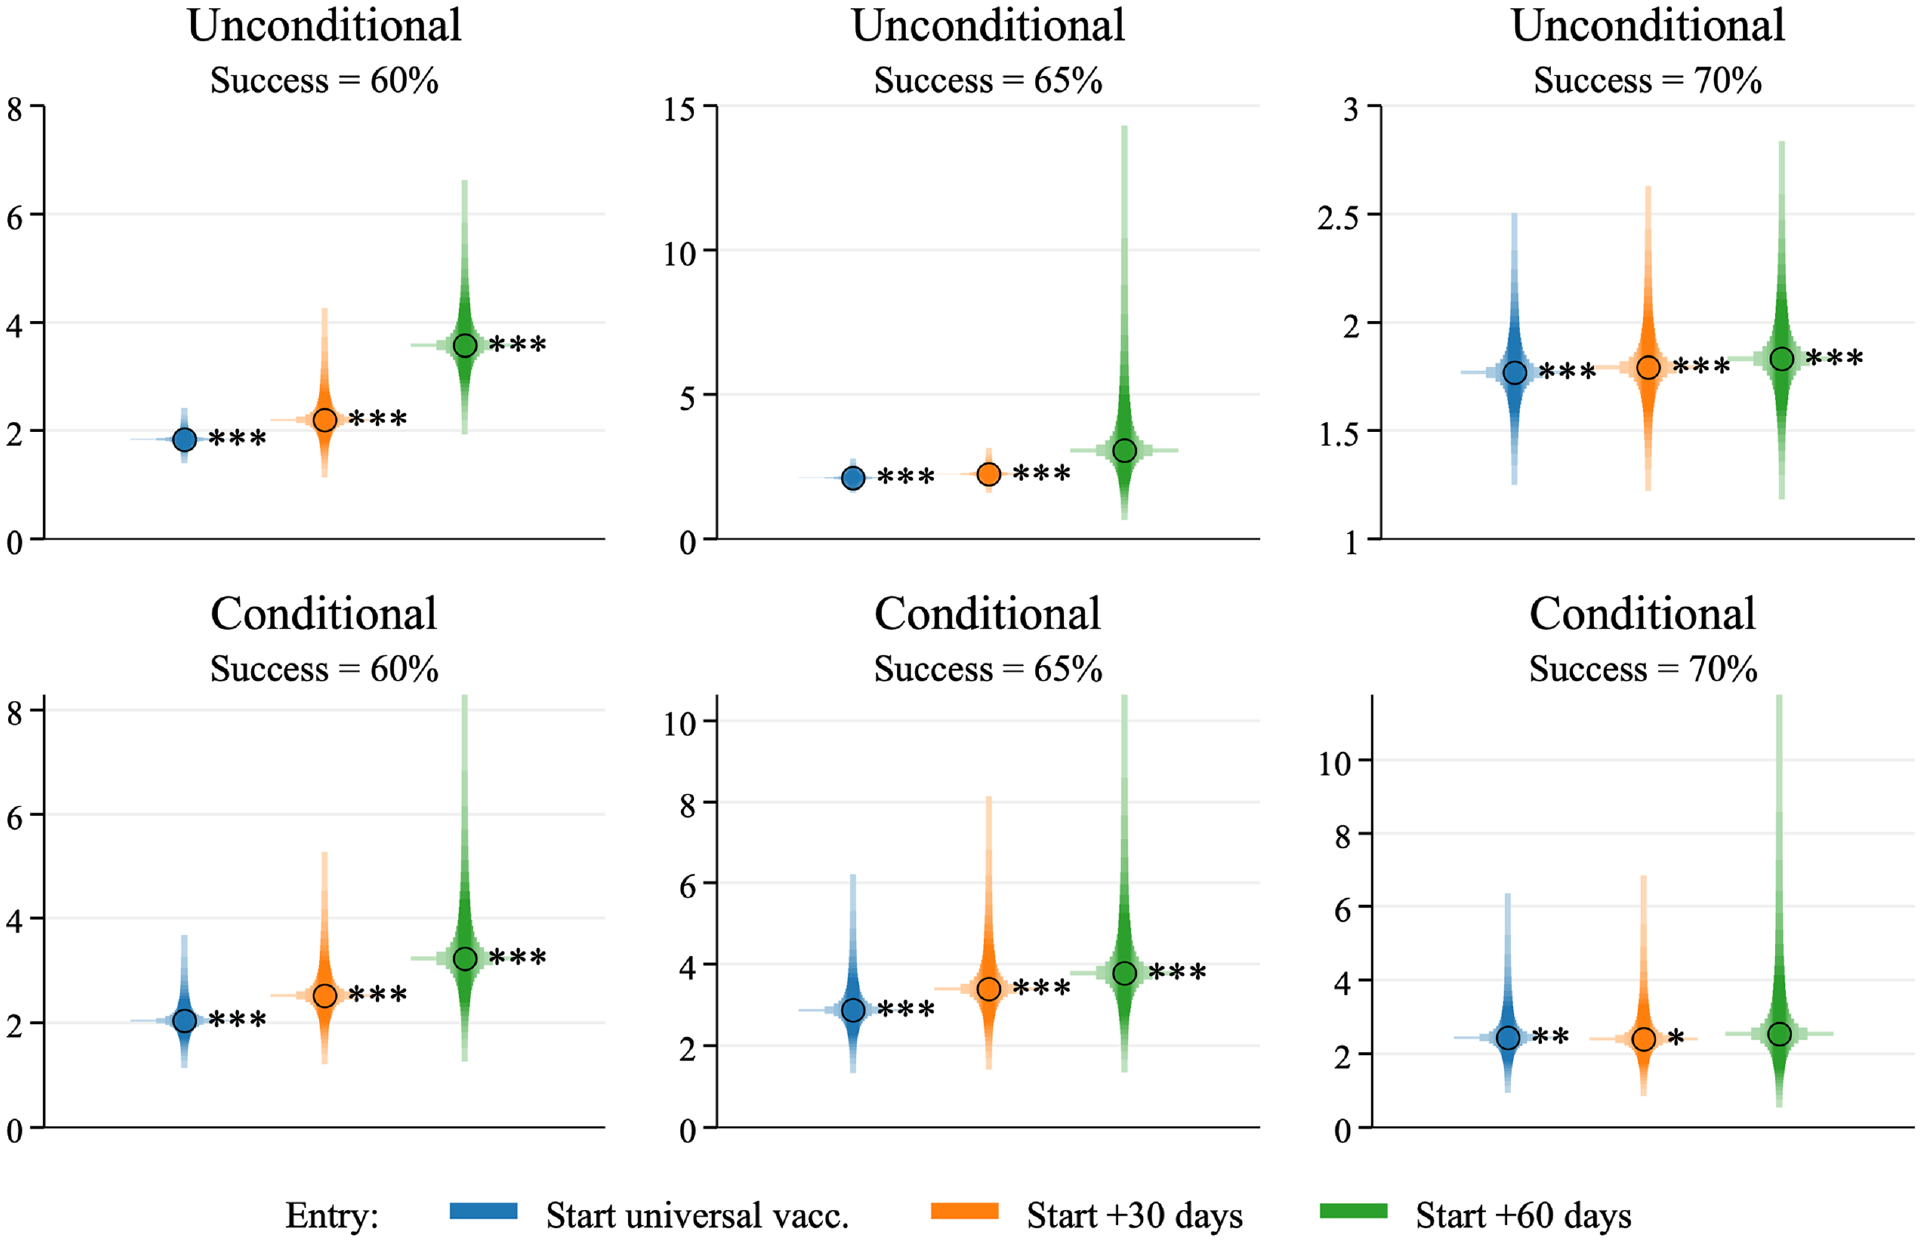
Hazard Ratios Into Vaccination Threshold of 60%, 65%, and 70%, With Time at Risk Beginning From the Day the Country Implements Universal Vaccination (Left), +30 Days (Middle), or +60 Days (Right)
The first row of Figure 5 presents unconditional hazard ratios; in the second row, we control for the large battery of controls from Study 2 (see Supplemental SI, Tables C1–C2 for the full results). The left CIs correspond to an event time beginning on the day the country implements universal vaccination. However, it is possible that more patient countries roll out universal vaccination early on; thus, it could be the case that patient countries only reach high targets early because they had a head start. To “level the playing field,” we also report results where event time begins on the first day of universal vaccination +30 days (middle CIs in Figure 5) or +60 days (right CIs). The results are unaffected. 1
As an alternative to time-to-event models, we also examine whether the daily change in vaccination rates is related to patience. Like time-to-event models, this will tell us whether vaccine uptake is faster in more patient countries, but without the need to define a threshold for a success event. A 1 SD increase in patience is correlated with a 0.033% larger average daily change in vaccination rates (95% CI: 0.021–0.046; p < .001). Thus, it is clear that vaccine uptake is faster in more patient countries.
Study 4: Patience and Subnational-Level Attitudes Toward Vaccines in the 2009 H1N1 Pandemic
Background
Our next question is whether the link between patience and vaccination is specific to the COVID-19 pandemic, turning our attention to the most recent previous pandemic: the 2009 outbreak of the swine influenza virus H1N1/09. While we are not aware of data on vaccination against swine flu, the European Commission (2011) ran a special iteration of its Eurobarometer survey in November 2009, asking 28,663 respondents across 30 countries: “Do you believe the pandemic (H1N1) flu vaccine will be effective and safe or not?”. We matched these data to the GPS at the subnational level for 17,329 Eurobarometer respondents across 138 subnational regions of 17 countries. We can, therefore, study whether regional-level patience predicted attitudes toward vaccination in an earlier pandemic. A key advantage of using regional data for Europe is that European regions are much more alike than countries around the world. Thus, the potential for unobserved confounders to drive any relationship we might observe is likely smaller than in a cross-country setting. A second advantage is that Europeans, by global standards, tend to be quite patient (Falk et al., 2018; see also Figure 1). Thus, we can ascertain whether variation in patience matters for attitudes toward vaccination even at high levels of patience.
Data Matching
Data for Austria, Germany, Italy, Poland, Spain, and the United Kingdom correspond to Nomenclature of territorial units for statistics (NUTS)-1 regions on the European Union’s Nomenclature of Territorial Units for Statistics classification. Data for Czechia, Finland, Greece, Hungary, Lithuania, the Netherlands, Portugal, Romania, Sweden, and Switzerland are at the NUTS-2 level, while data for Estonia are at the NUTS-3 level.
Results
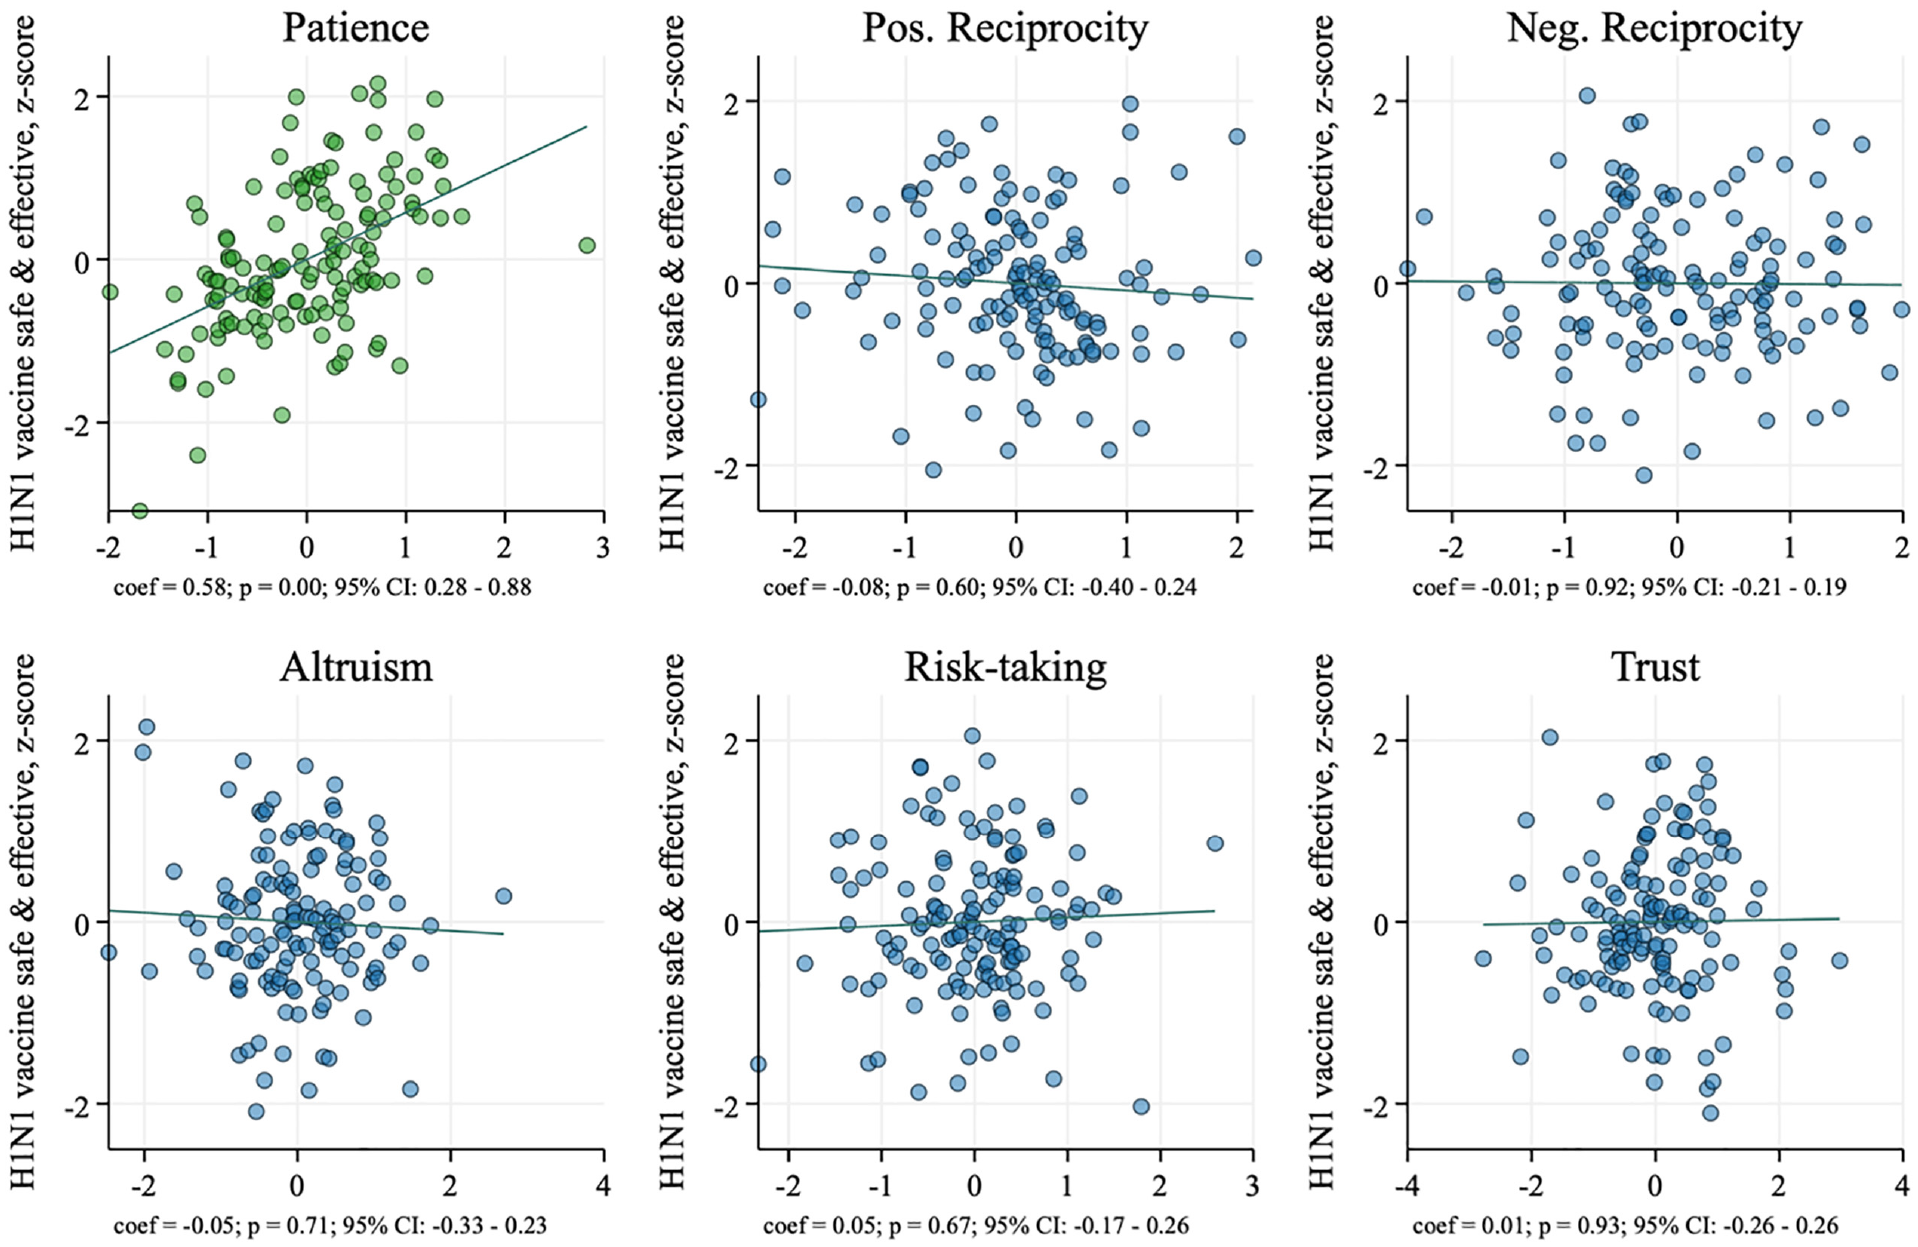
Figure 6 plots the correlations between attitudes toward the H1N1 vaccine and each of time, risk, and social preference measures, conditional on all other measures (full regression results in Supplemental SI, Table D3). A 1 SD increase in regional-level patience is associated with a 0.58 SD increase in the regional-level share of respondents who agree the H1N1 vaccine will be safe and effective. The coefficient of patience is approximately 7 times as large as that of the next largest variable (positive reciprocity). All other GPS measures have precisely estimated zero effects, with p values ranging from .60 to .93 and CIs approximately centered around zero. These patterns are unchanged when we control for differences in economic development across regions (Supplemental SI, Table D3). The association between patience and vaccination is not coincidental to the COVID-19 pandemic but also applies to the swine flu pandemic.
Added-Variable Plots: Infant Vaccinations and Patience, Risk, and Social Preferences
Study 5: National-Level Patience and Infant Vaccinations
Background
While pandemic preparedness is important, we need to understand whether patience has any bearing on “business-as-usual” infant vaccinations. This is an important question in the face of the rising global movement questioning the safety and effectiveness of all vaccines, which has led to the resurgence of previously eradicated diseases like measles (Fefferman & Naumova, 2015).
Infant Vaccination
We examine whether patience is associated with 12 common infant vaccinations (tuberculosis, polio, measles, rubella, rotavirus, yellow fever, diphtheria, tetanus, pertussis, hepatitis B, pneumococcal disease, and Haemophilus influenzae type B). Infant vaccination rates at the country level for 2019 are available from Our World in Data (https://ourworldindata.org/vaccination). We calculate a country’s infant vaccination rate as the average rate of vaccination across all vaccines.
Results
Figure 7 plots the correlations between the percentage of vaccinated 1-year-old infants, and time, risk, and social preference measures, conditional on all other measures, for the same sample of countries as that of Study 1 (except Bolivia, where vaccination data are unavailable). Full regression results are shown in Table E3 in Supplemental SI.
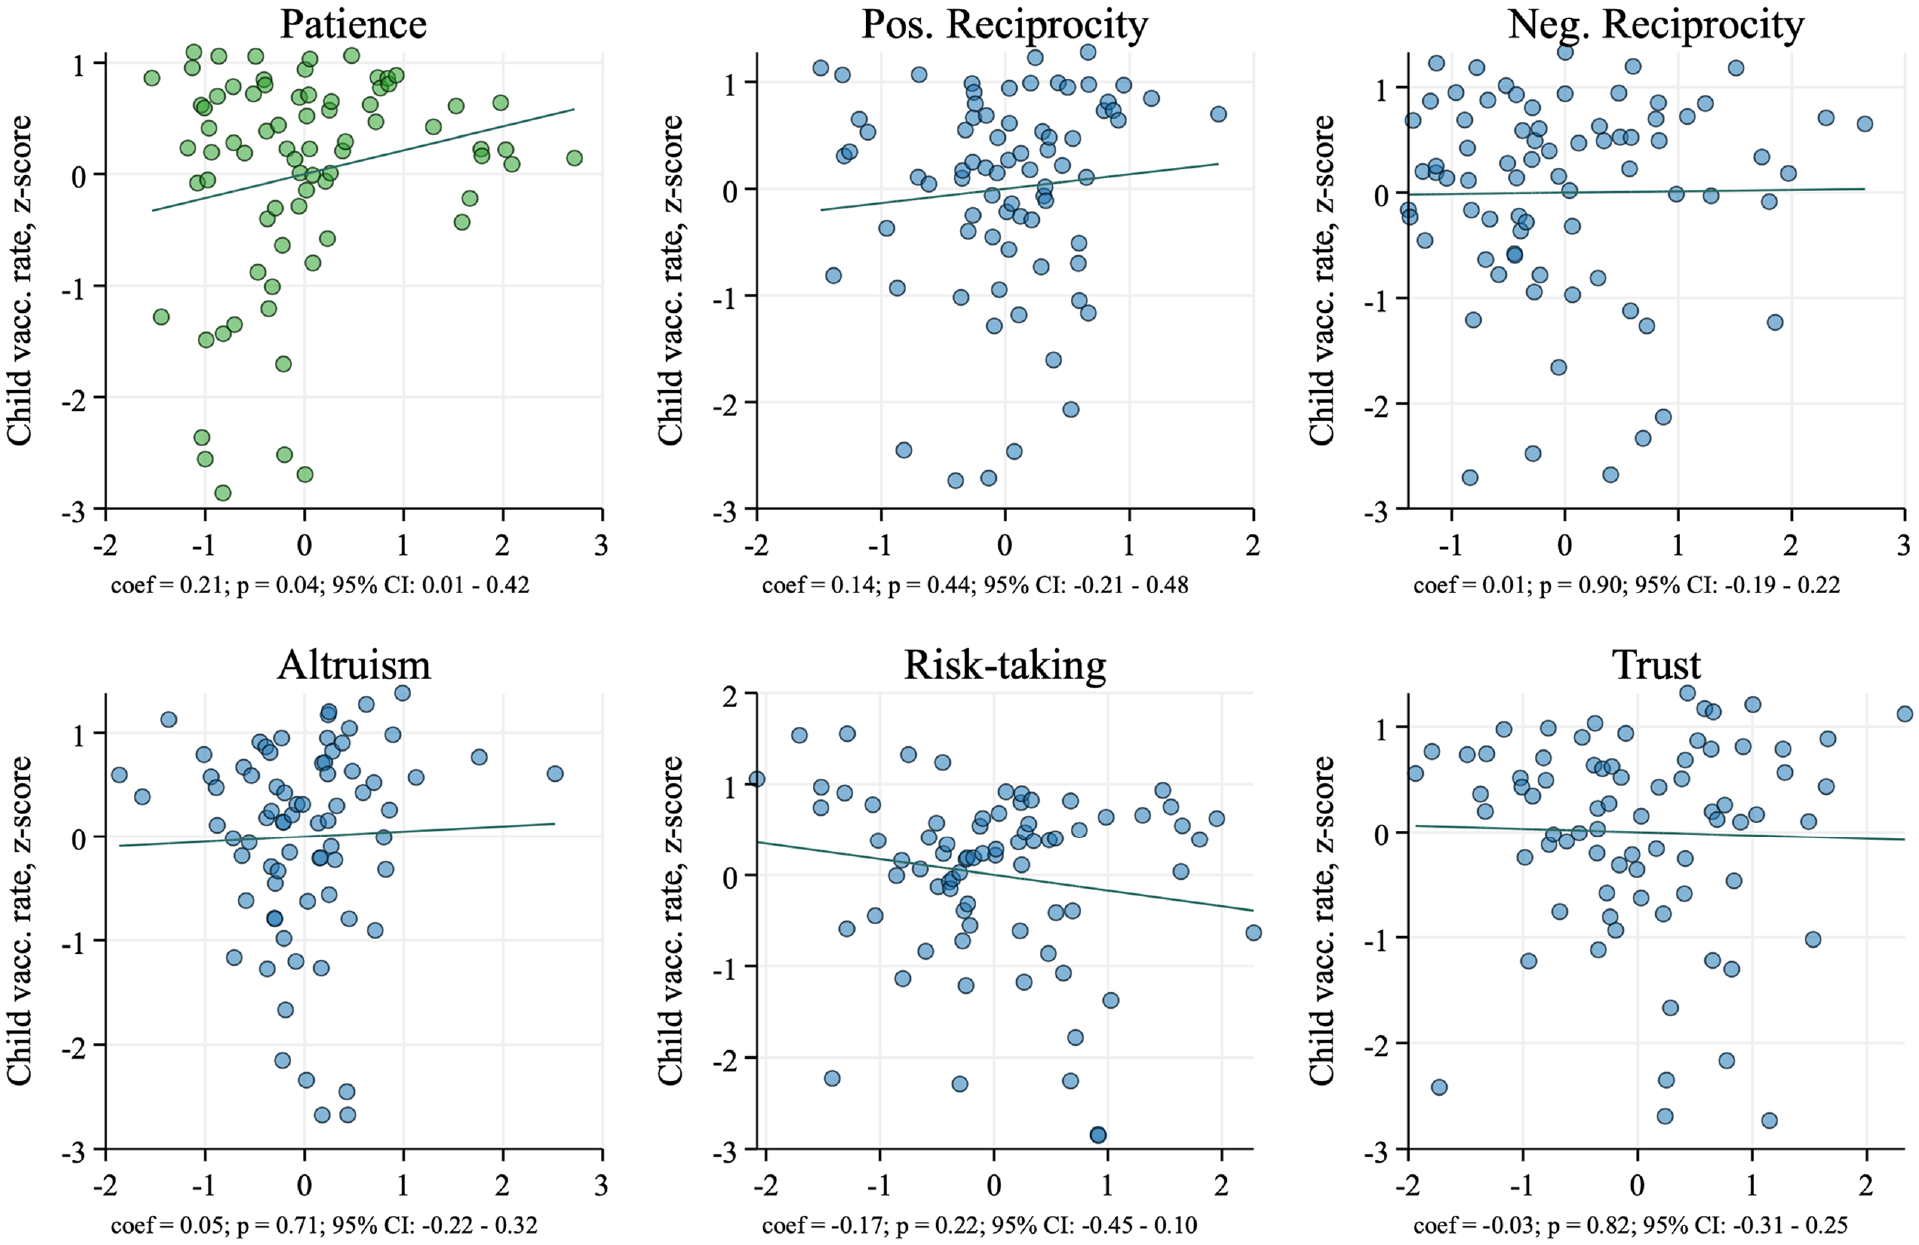
Added-Variable Plots: Infant Vaccinations and Patience, Risk, and Social Preferences
National-level patience is the only significant predictor of infant vaccinations. A 1 SD increase in patience is associated with a 0.21 SD increase in the share of vaccinated infants (p = .04). RSP are all insignificant, with p values ranging from .22 to .90. Thus, national-level patience predicts vaccination above and beyond all other behavioral decision-making parameters, and does so in nonpandemic, “business-as-usual” times. A limitation is that this finding is not robust to controlling for per capita gross domestic product (GDP). While it is not surprising that income levels are a powerful determinant of infant vaccinations, controlling for income will mechanically “block” the path from patience to vaccination (Supplemental SI, Figure A4), since income is itself an outcome of patience (Sunde et al., 2022). Since GDP per capita is a bad control in this setting, it is more appropriate to exclude it from the model rather than to include it, since its inclusion will result in downward-biased estimates for patience.
Limitations
Although the correlation between national-level patience and vaccination survives a large number of robustness checks, we cannot entirely rule out the possibility that a third unobserved variable causes both higher patience and higher vaccination. This is, however, unlikely, as we perform a number of robustness checks to tackle this question.
Our data do not represent all countries around the world. The 76 countries included do, however, account for approximately 87% of the world population. It is important to consider the whole range of contextual factors specific to each country when devising policies for an individual country.
In addition, as discussed in the second subsection of Study 2, national- and regional-level patience as measured in the GPS are somewhat conceptually different from individual-level patience as measured in Study 1. The former relates to the ability to delay rewards across both monetary and nonmonetary domains, while the latter is strictly nonmonetary. It is nonetheless reassuring that the associations we observe hold for both types of patience, at several levels of analysis (individual, regional, national) and across several contexts (COVID-19 pandemic, H1N1 pandemic, infant vaccinations) and constructs (attitudes and behaviors).
Another potential limitation of our results is that the coefficient estimates of patience are substantially smaller at the individual level than at the national level. This may be due to the fact that individual-level patience is general patience, as measured by the question “How willing are you to give up something that is beneficial for you today in order to benefit more from that in the future?”, while national-level patience is a weighted average of general patience and of hypothetical financial decisions between a given payment today and a larger payment in a year’s time. Thus, one might reasonably expect different constructs to produce different results. Under this interpretation, the large national-level results are driven by financial security concerns rather than purely patience. We believe this to be unlikely: Monetary stakes used in the GPS are adjusted for local living standards, and we control for income per capita in our cross-country regressions, which should absorb any remaining differences in financial security.
Conclusion
Patience is associated with higher vaccination rates and more positive attitudes toward vaccination. This hypothesis was tested across individuals, countries, and subnational regions. Cross-country results cannot be explained away by RSP or by cross-country differences in health, economic development, vaccine availability, or political institutions. Individual-level results cannot be explained away by other time-related preferences including impulsivity and sensation-seeking. In pandemic and nonpandemic times alike, vaccine messages appealing to patience are a worthwhile and urgently needed avenue of investigation.
Supplemental Material
sj-docx-1-spp-10.1177_19485506231189905 – Supplemental material for Patience Predicts Attitudes Toward Vaccination and Uptake of Vaccines
Supplemental material, sj-docx-1-spp-10.1177_19485506231189905 for Patience Predicts Attitudes Toward Vaccination and Uptake of Vaccines by Ho Fai Chan, Stephanie M. Rizio, Ahmed Skali and Benno Torgler in Social Psychological and Personality Science
Footnotes
Handling Editor: Peter, Rentfrow
Author’s Note
Helpful comments from the editor (Jason Rentfrow) and two reviewers substantially improved the article and are gratefully acknowledged.
Declaration of Conflicting Interests
The author(s) declared no potential conflicts of interest with respect to the research, authorship, and/or publication of this article.
Funding
The author(s) received no financial support for the research, authorship, and/or publication of this article.
Supplemental Material
The supplemental material is available in the online version of the article.
Notes
Author Biographies
References
Supplementary Material
Please find the following supplemental material available below.
For Open Access articles published under a Creative Commons License, all supplemental material carries the same license as the article it is associated with.
For non-Open Access articles published, all supplemental material carries a non-exclusive license, and permission requests for re-use of supplemental material or any part of supplemental material shall be sent directly to the copyright owner as specified in the copyright notice associated with the article.