
Abstract
Physical pain is a pressing issue for scientists and policymakers. Yet evidence on the psychosocial factors of pain is limited. Using data from 146 countries (N = 1.3 million individuals), this article documents the role of income comparisons on physical pain. Specifically, this study shows that income rank (i.e., the ordinal position of a person’s income within a comparison group) is linked to physical pain above and beyond absolute income. This effect is identical in rich and poor nations. The negative emotions that result from a disadvantaged relative standing in the income hierarchy may explain these findings. This article documents a new kind of evidence on the power of income comparisons and highlights the role that psychosocial factors may play in physical pain.
Physical pain has been increasing dramatically in the last decades becoming a priority for global public health (Bowling, 1995; Cohen et al., 2021; Johannes et al., 2010). Pain is relevant as it affects leisure and productivity at work (Breivik et al., 2006; Gerdle et al., 2004), increases health care costs (Gaskin & Richard, 2012), and represents a challenge for the health care system (Frießem et al., 2009). Pain also plays a key role in the U.S. opioid epidemic as well as in suicide and drug and alcohol misuse (Case et al., 2020). In light of these circumstances, understanding the context of pain is crucial to addressing its consequences.
Pain is a complex concept. The International Association of the Study of Pain (IASP) defines pain as “an unpleasant sensory and emotional experience associated with, or resembling that associated with, actual or potential tissue damage” (Raja et al., 2020, p. 1). A large body of work argues that pain is whatever unpleasant sensation people feel in the body (see Boddice, 2017). Thus, this article refers to pain as the feeling that people experience when their body hurts regardless of the presence of physical damage.
As humans live in stratified societies, a large literature has documented the influence of social and economic rank on mental well-being (Boyce et al., 2010; Curhan et al., 2014), behavior (Korndörfer et al., 2015; Piff et al., 2012) and general health (Adler et al., 2008). However, no study has explored whether income rank and physical pain are related around the world. This study addressed this question by analyzing nationally representative data on 146 countries and 1.3 million respondents.
The enquiry of this study was motivated by Relative Deprivation Theory (Schulze & Krätschmer-Hahn, 2014). Relative deprivation refers to the notion that one is worse off in comparison to a standard or reference group. This situation is likely to have important emotional and behavioral consequences. For instance, in a theoretical and meta-analytic review, Smith et al. (2012) documented that negative emotions like anger and resentment, and behaviors like collective action, are among the strongest correlates of relative deprivation.
Building on this theory, prior research has examined the link between relative deprivation and mental and physical health. For instance, Beshai, Mishra, Meadows, et al. (2017) found a negative relationship between subjective relative deprivation and depression symptoms. More specifically on physical health, Beshai, Mishra, Mishra and Carleton, et al. (2017) found that relative deprivation was associated with fibromyalgia and functional gastrointestinal disorders and that stress mediated the relationship. In these two studies, relative deprivation was measured with The Personal Relative Deprivation Scale—Revised (PRDS-R; Callan et al., 2011), which consists of five items that aim to capture relative deprivation, for example, “I feel deprived when I think about what I have compared to what other people like me have” and “When I compare what I have with what others like me have, I realize that I am quite well off.”
Relative deprivation represented by lower income or social status has also been studied. For instance, Clark and Oswald (1996) conducted a rigorous test of relative deprivation theory and showed that income comparisons were negatively linked to job satisfaction. In a sample of 157 healthy White women, Adler et al. (2000) examined the association between an individual’s perceived position on a social status ladder and health-related factors. Individuals with lower income, lower level of education, and the worst jobs were at the bottom of this ladder. The authors found that individuals with low perceived social status reported poorer self-rated health and greater stress than those with high perceived social status.
One aspect that may explain the link between relative deprivation and well-being is the experience of negative emotions. For instance, in a comprehensive review study, Smith and Kim (2007) suggested that the envy that results from perceiving a disadvantage may trigger negative emotions like anger and stress which, in turn, may affect mental and physical wellbeing. The authors defined envy as an unpleasant feeling “caused by an awareness of a desired attribute enjoyed by another person or group of persons” (p. 1). Similarly, feelings of unfairness and violations of justice and deservingness that result from relative deprivation have been found to be strongly related to anger and resentment (Averill, 1983; Feather, 2006).
This body of work suggests that the negative emotions that result from a disadvantaged position in the income hierarchy may help explain the link between income rank and pain. An extensive review study by Wiech and Tracey (2009) supports this idea by documenting that experimentally induced mood changes may increase pain and that negative emotions and pain share similar neural mechanisms.
The Present Study
Prior work has explored the link between income level and physical pain. For instance, using a sample of U.S. adults, Zajacova et al (2021) documented that people with higher income reported lower pain than those with lower income. In an attempt to confirm these findings using a worldwide sample, the present study explored the following hypothesis:
Prior research has also examined the link between income rank and mental and physical health. Boyce et al. (2010) used a representative sample of 86,679 British respondents from the British Household Panel Survey (BHPS) and found that individuals with lower income ranks reported lower life satisfaction than those with higher income ranks. Using a sample of 30,000 respondents from the same dataset, Wood et al. (2012) found that individuals with low income rank reported greater anxiety and depression than those with high income rank. In a recent study, Daly et al. (2015) used data from the BHPS and the English Longitudinal Study of Aging and found that individuals with low (vs. high) income rank showed poorer self-rated health outcomes, poorer physical functioning, greater pain, and obesity. These three studies defined income rank as the ordinal position of a person’s income within a reference group. Specifically, an individual’s income rank was determined by the number of people that had a lower income in the reference group divided by the number of people in the reference group. The present study also defined income rank this way to represent an individual’s standing in the income hierarchy. Building on this work, this study examined the following hypothesis:
Previous work has also found that the link between income rank and mental and physical health persisted after controlling for absolute income (Boyce et al., 2010; Daly et al., 2015). Based on this research, this study explored the following hypothesis:
This study also examined whether these three hypotheses were confirmed in rich and poor countries. Prior research has found that the link between income and happiness was stronger in low-income (vs. high-income) developing countries (Howell & Howell, 2008). This difference could occur because individuals in poor countries have more material needs than those in rich countries. In line with these ideas, this study examined the following hypothesis:
However, prior research has shown that inequalities and comparison to others tend to hurt everyone regardless of whether people live in a rich or poor country (see Wilkinson & Pickett, 2009). For instance, Social Comparison Theory (Festinger, 1954) suggests that the relative standing of a person in a comparison group is what matters: A person in a rich country surrounded by richer people could be less happy than a person in a poor country surrounded by poorer people. This suggests that living in a poor or a rich country would not influence the effect of one’s relative standing on well-being. Based on this work, the present study explored the following hypothesis:
Method
Data
The variables used in this study were obtained from the Gallup World Poll (GWP), a cross-sectional, nationally representative survey with more than 160 countries and 15 survey years (2005–2018). Because income and employment status variables were available from 2009 and macroeconomic indicators were missing in some countries, this article used data from 146 nations, 10 survey years (2009–2018), and 1.3 million respondents. More detail and descriptive statistics of all the variables involved in the analysis can be found in Tables S.1 to S.3 in the Supplemental Online Materials (SOM).
The GWP interviews around 1,000 individuals per year in each country. It uses telephone surveys in Northern America, Western Europe, developed Asia, and face-to-face interviewing in Central and Eastern Europe, much of Latin America, former Soviet states, nearly all of Asia, the Middle East, and Africa. Most samples are probability-based and nationally representative of the adult population in each country. The survey was conducted in the first language of each country.
Measures
Physical Pain
The dependent variable used in this study was the individual’s physical pain. Respondents answered the following question “Did you experience the following feelings during A LOT OF THE DAY yesterday? How about Physical Pain?” with Yes (1) or No (0). This type of variable has been used in prior research (Case et al., 2020; Kahneman & Deaton, 2010; Macchia, 2022; Macchia & Oswald, 2021).
Income
Respondents were asked the following question “What is your total monthly household income, before taxes? Please include income from wages and salaries, remittances from family members living elsewhere, farming, and all other sources.” This measure was divided by household size to obtain a measure of personal income. Income was expressed in local currency and then converted to International Dollars using the World Bank’s individual consumption PPP conversion factor, making income estimates comparable across all countries. Based on these data, the GWP created a measure of Per Capita Annual Income in International Dollars. Following prior research, this measure of absolute income was log-transformed to include in later analysis (Boyce et al., 2010; Macchia et al., 2020).
Income Rank
Using the measure of Per Capita Annual Income in International Dollars provided by the GWP, a measure of income rank was created (see Boyce et al., 2010). This variable consisted of the ratio between the number of people with lower personal income than that of the respondent
The measure of income rank was then normalized between 0 and 1 and represented a higher income rank within the country and year with a higher value. Because the goal of this study was to explore the physical pain of people whose income rank was lower in their reference group, the original measure of income rank was reversed to represent low income rank with a higher value. This reversed measure was included in the regression models presented in the next section.
Mean Income in the Reference Group
Prior research suggested that individuals also consider how their income compares with the norm of a reference group (e.g., Clark et al., 2008; Luttmer, 2005). To account for this possibility the models that included measures of absolute income and income rank together (Table 3; see below for more details on the models) also controlled for mean income in the reference group (see Boyce et al., 2010).
Sociodemographic Characteristics
To rule out alternative explanations, all models included respondent’s demographic characteristics that have been found to be linked to individual’s pain: age (linear and squared), gender, level of education, employment status, marital status, and number of children under 15 in the household. For instance, older (vs. younger), poorer (vs. richer), less educated (vs. more), unemployed (vs. employed), divorced (vs. single) individuals, and people with lower (vs. higher) number of children tend to experience greater pain (see Macchia & Oswald, 2021). These variables were taken from the GWP.
Macroeconomic Indicators
All models also included macroeconomic indicators that were found to be associated with pain: the Gross Domestic Product per capita (GDP, in constant 2010 US$), the Unemployment Rate (% of unemployed people in a total labor force), and the Inflation Rate (Consumer Price Index, annual %). In general, people who live in a country with greater GDP tend to report lower pain, and those who live in a country with a greater unemployment rate and greater inflation rate tend to report greater pain (see Macchia & Oswald, 2021). These measures were obtained from the World Bank database (www.data.worldbank.org).
Statistical Analyses
To examine respondents’ physical pain as a function of income rank, this article used multilevel mixed-effects linear regressions with country modeled as random intercept because individuals were nested within countries. These models are presented in the main text of this article as they give coefficients that are easier to interpret (Gomila, 2021). However, as the dependent variable was binomial, multilevel mixed-effects generalized linear regressions with country modeled as random intercept were also conducted. Both models yielded similar results. All models included sample weights to ensure that the sample was representative of the population (Solon et al., 2015).
Rich and Poor Countries
This article explored whether the main findings held in rich and poor countries. Using GDP per capita levels at the beginning of the period of analysis, the 146 countries were divided into a low-GDP and a high-GDP group. Therefore, based on GDP per capita in 2009, a group of 73 poor countries and a group of 73 rich countries were created. In addition, to test whether the results differed significantly across GDP levels, models with interaction terms between income (both absolute and rank) and a continuous measure of GDP were conducted. Models using a binary measure that represented the set of poor countries with 0 and the set of rich countries with 1 were also performed.
Robustness Checks
A wide variety of additional checks to confirm the robustness of the findings were conducted, namely, multilevel mixed-effects generalized linear regressions with country modeled as random intercept, and models including a measure of physical health as a covariate to ensure that the main results were not driven by those who were physically ill. The results presented in this paper held with these alternative statistical choices.
Results
Descriptive statistics of the variables used in the analyses for the full sample, rich, and poor countries subsamples can be found in Tables S.1, S.2, and S.3, respectively, of the SOM. The mean of the physical pain variable (0-1) was 0.3 in the full sample, 0.28 in the rich countries, and 0.33 in the poor countries.
Full Sample
Table 1 shows regression models that explored the link between absolute income and physical pain without the influence of income rank. Column 1 shows the full GWP sample with 146 countries and 1.3 million respondents, Column 2 shows the rich countries, and Column 3 shows the poor countries (see below for results in Columns 2 and 3). The regression model in Column 1 revealed that individuals with higher absolute income experienced lower physical pain than those with lower absolute income b = −.016; p < .001; 95% confidence interval (CI): [−.017, −.013]. These findings supported Hypothesis 1 of this study.
Pain and Log of Absolute Income, 146 Countries, 2009–2018. Multilevel Mixed Effects Linear Models
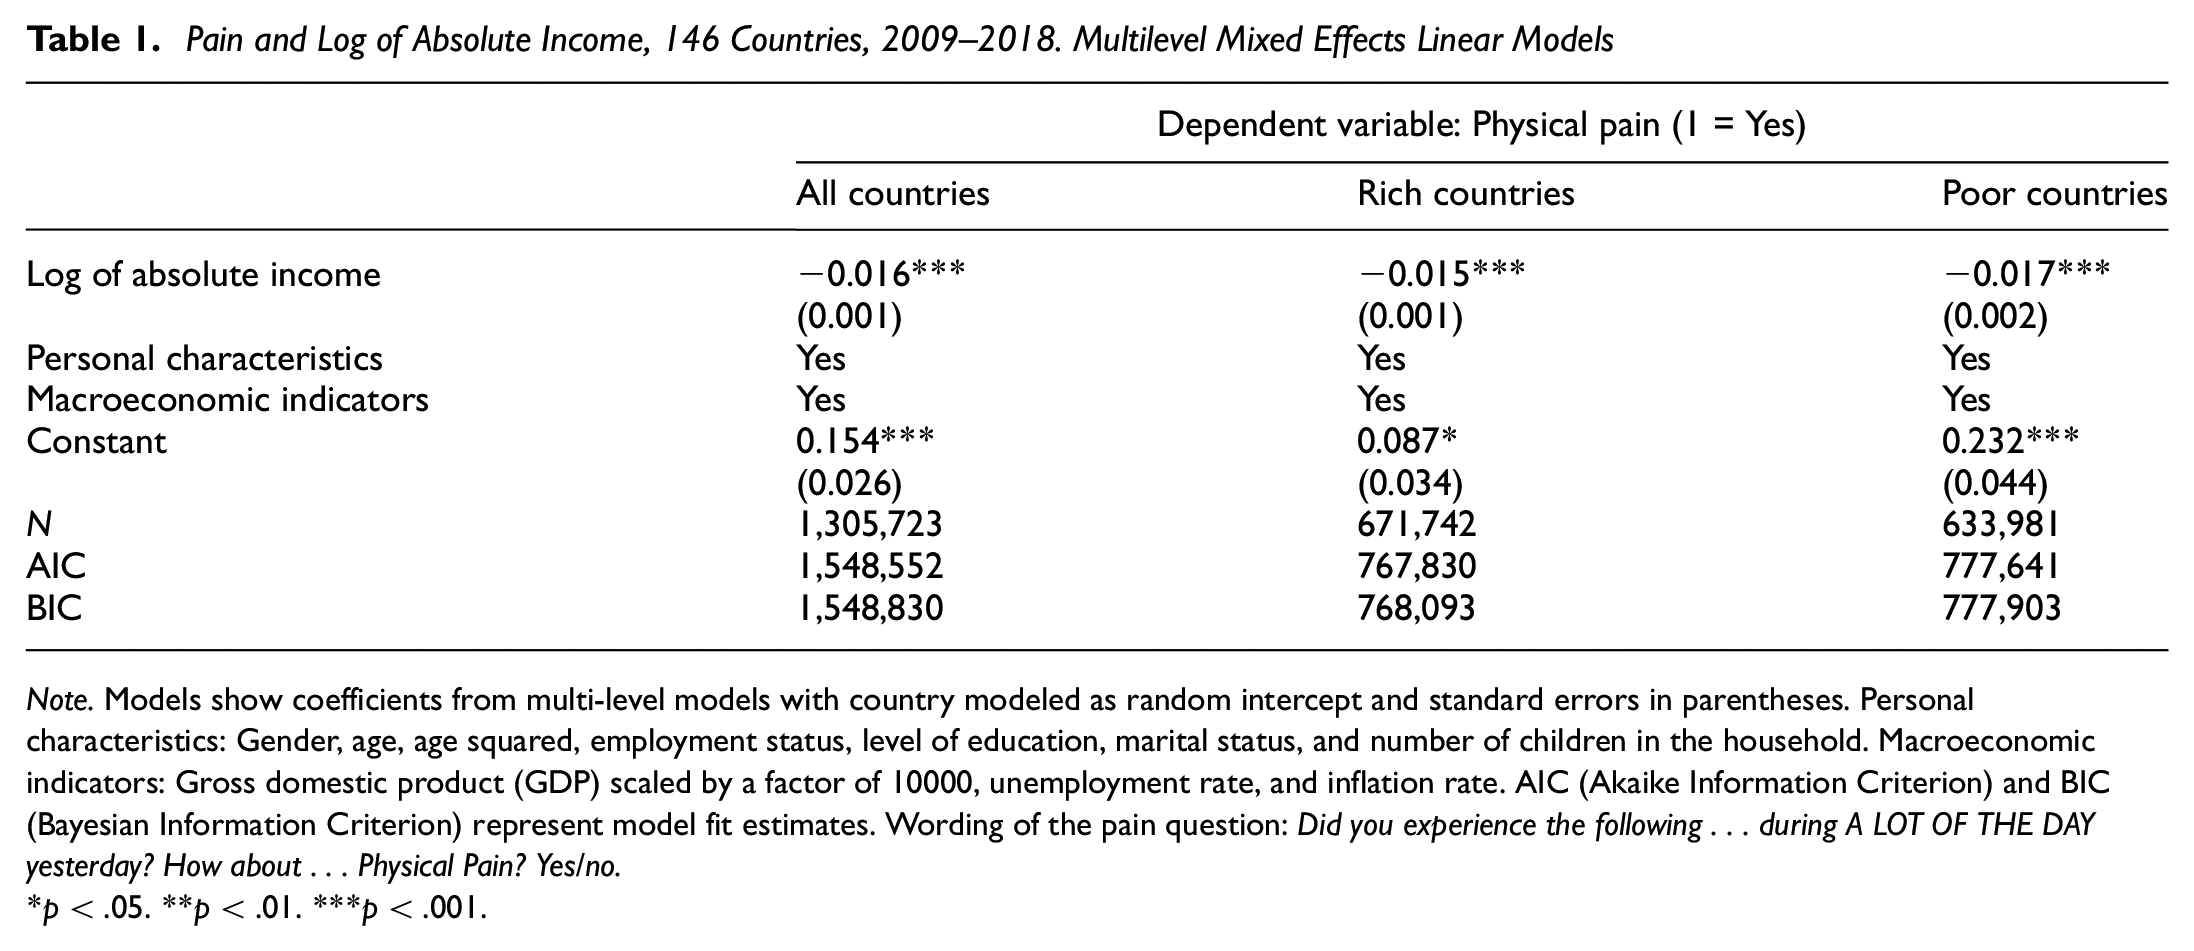
Note. Models show coefficients from multi-level models with country modeled as random intercept and standard errors in parentheses. Personal characteristics: Gender, age, age squared, employment status, level of education, marital status, and number of children in the household. Macroeconomic indicators: Gross domestic product (GDP) scaled by a factor of 10000, unemployment rate, and inflation rate. AIC (Akaike Information Criterion) and BIC (Bayesian Information Criterion) represent model fit estimates. Wording of the pain question: Did you experience the following . . . during A LOT OF THE DAY yesterday? How about . . . Physical Pain? Yes/no.
p < .05. **p < .01. ***p < .001.
Table 2 shows the regression models that explored whether an individual’s income rank in the reference group was linked to physical pain. This income rank variable denotes a lower rank with a higher value because the goal of this study was to examine the effect of having a low income rank on physical pain. Column 1 in Table 2 shows a regression equation for the full GWP sample. This model shows that individuals with lower income rank in their reference group experienced greater physical pain than those with higher income rank b = .102; p < .001; 95% CI [.094, .109]. These findings supported Hypothesis 2 of this study. These results also suggested that a one-unit decrease in income rank (i.e., moving from the top to the bottom of the ranking) increased physical pain (on a 0-1 measure) by 0.102 (10.2 percentage points).
Pain and Income Rank, 146 Countries, 2009–2018. Multilevel Mixed Effects Linear Models
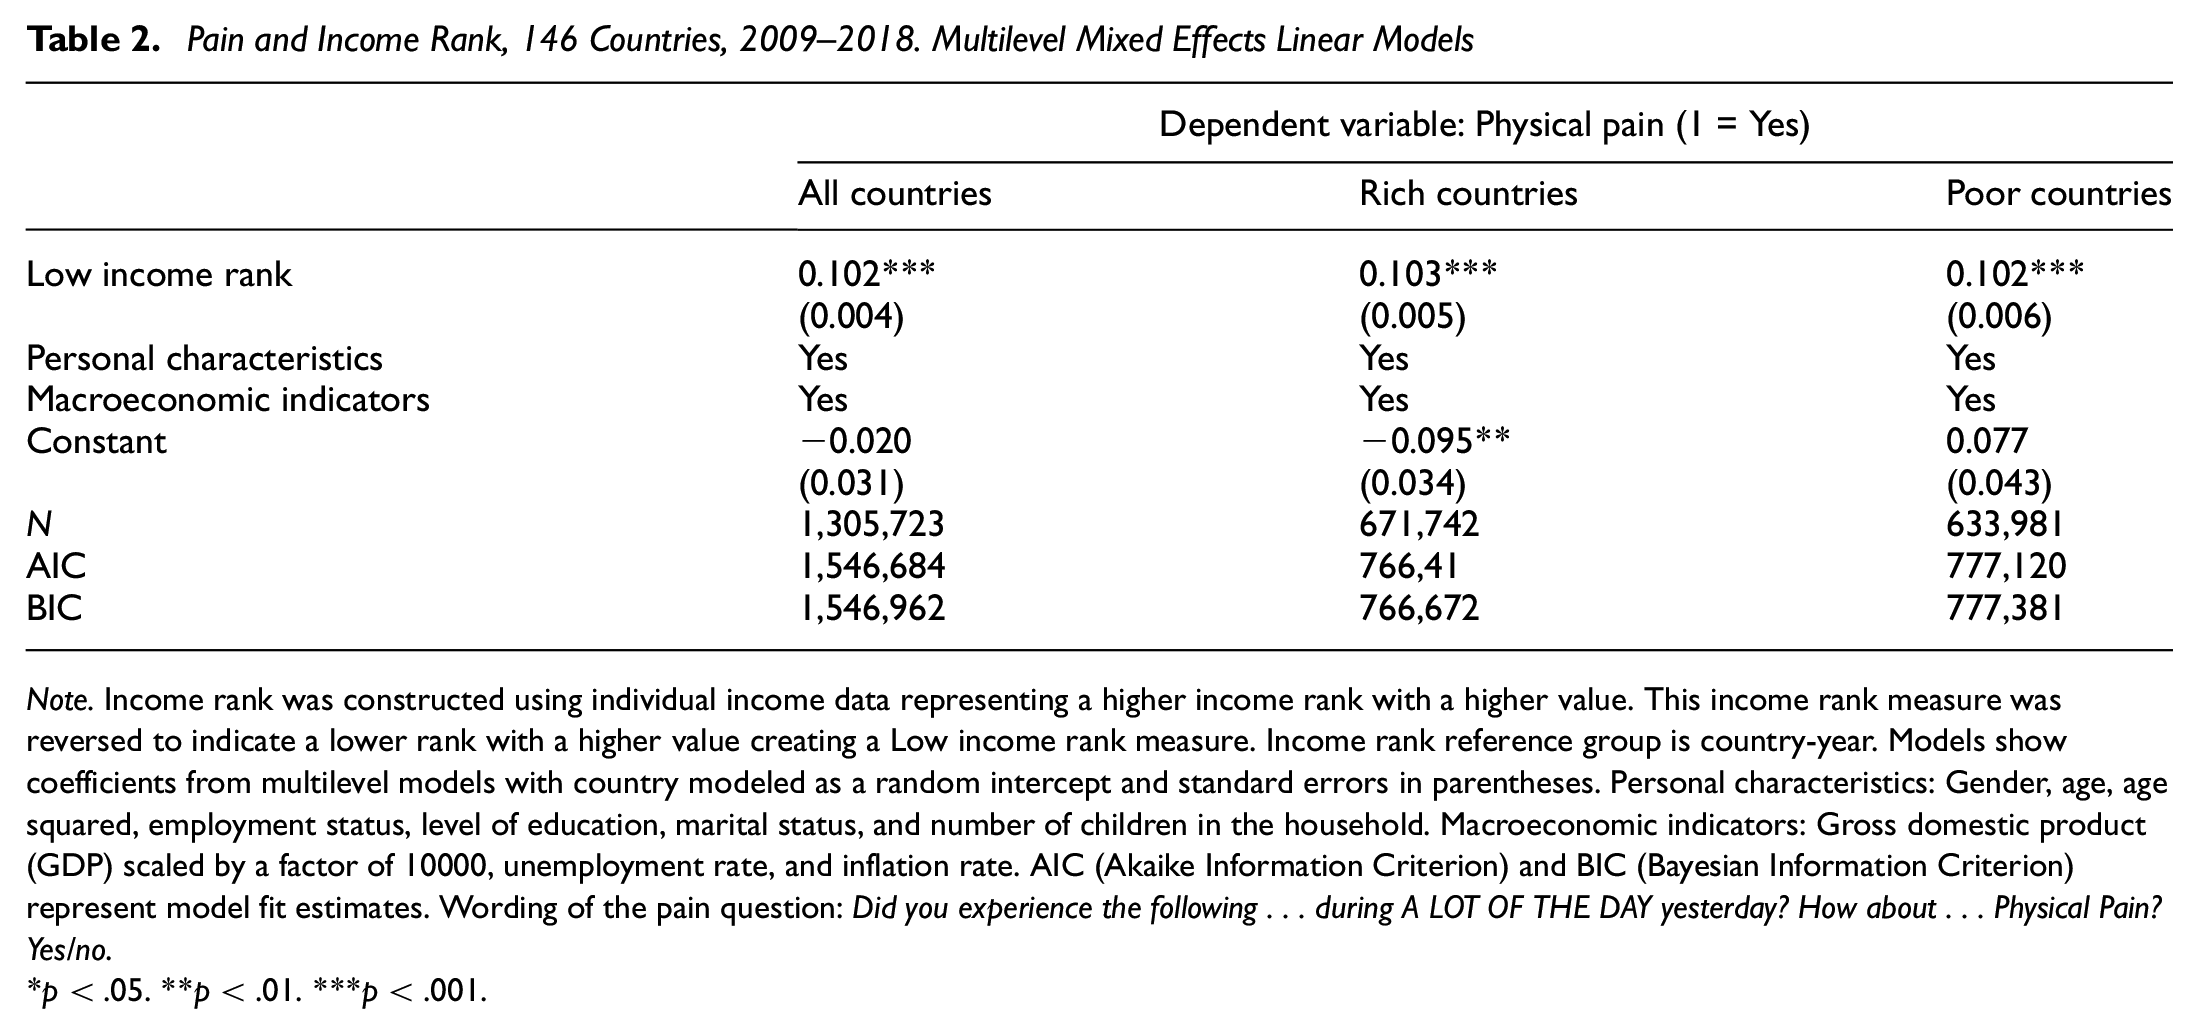
Note. Income rank was constructed using individual income data representing a higher income rank with a higher value. This income rank measure was reversed to indicate a lower rank with a higher value creating a Low income rank measure. Income rank reference group is country-year. Models show coefficients from multilevel models with country modeled as a random intercept and standard errors in parentheses. Personal characteristics: Gender, age, age squared, employment status, level of education, marital status, and number of children in the household. Macroeconomic indicators: Gross domestic product (GDP) scaled by a factor of 10000, unemployment rate, and inflation rate. AIC (Akaike Information Criterion) and BIC (Bayesian Information Criterion) represent model fit estimates. Wording of the pain question: Did you experience the following . . . during A LOT OF THE DAY yesterday? How about . . . Physical Pain? Yes/no
p < .05. **p < .01. ***p < .001.
Regression models in Table 3 examined whether physical pain was linked to income rank after accounting for absolute income. Thus, Table 3 shows regression equations that combine income rank and absolute income. The model in Column 1 showed that, in the full sample, individuals with lower income rank in their reference group experienced greater physical pain than individuals with higher income rank after controlling for absolute income b = .103; p < .001; 95% CI [.094, .111]. This suggests that the link between income rank and physical pain persists above and beyond the number of dollars earned. These findings supported Hypothesis 3 of this study.
Pain and Income Rank Controlling for Log of Absolute Income, 146 Countries, 2009–2018. Multilevel Mixed Effects Linear Models
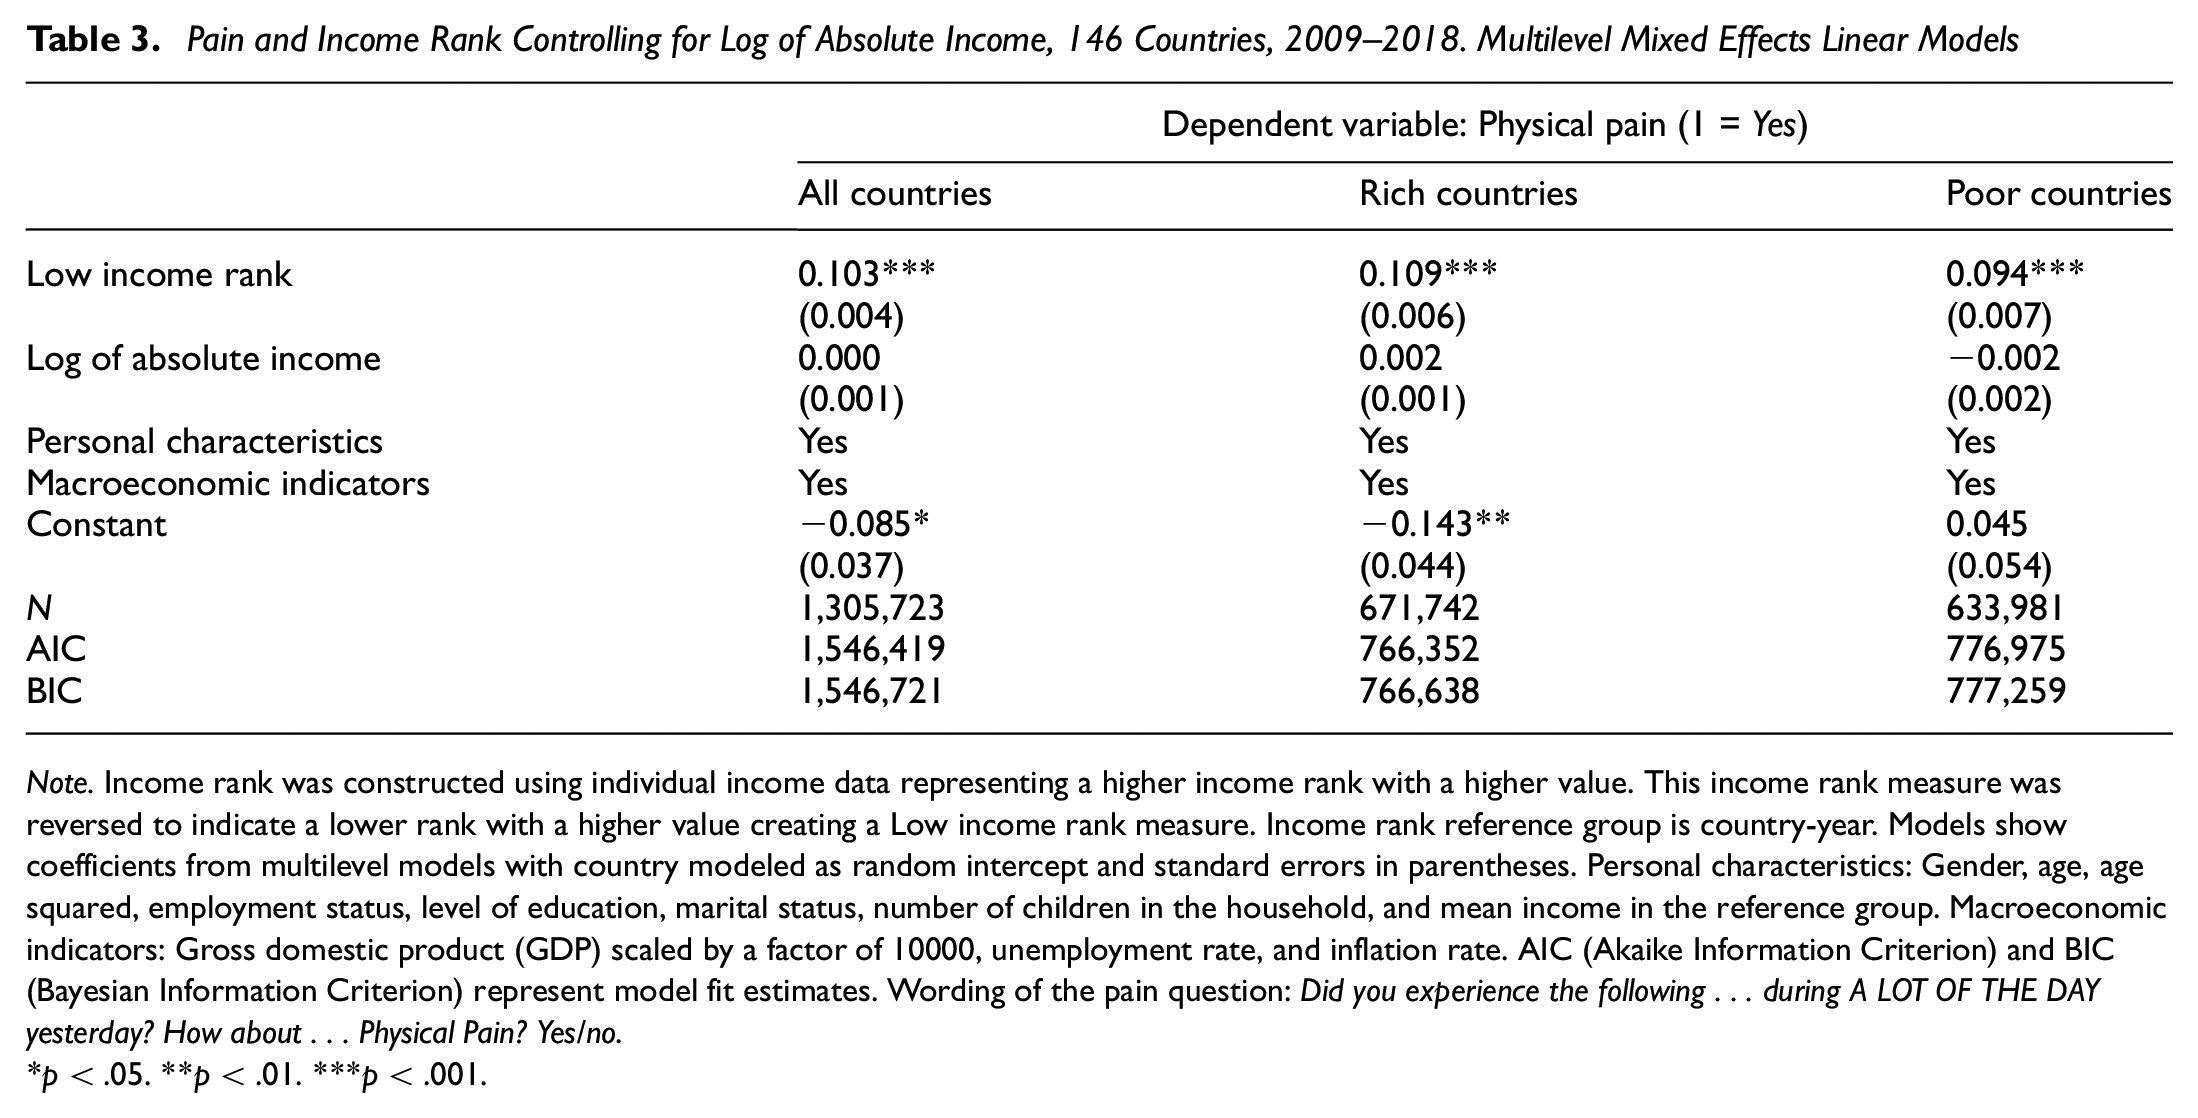
Note. Income rank was constructed using individual income data representing a higher income rank with a higher value. This income rank measure was reversed to indicate a lower rank with a higher value creating a Low income rank measure. Income rank reference group is country-year. Models show coefficients from multilevel models with country modeled as random intercept and standard errors in parentheses. Personal characteristics: Gender, age, age squared, employment status, level of education, marital status, number of children in the household, and mean income in the reference group. Macroeconomic indicators: Gross domestic product (GDP) scaled by a factor of 10000, unemployment rate, and inflation rate. AIC (Akaike Information Criterion) and BIC (Bayesian Information Criterion) represent model fit estimates. Wording of the pain question: Did you experience the following . . . during A LOT OF THE DAY yesterday? How about . . . Physical Pain? Yes/no
p < .05. **p < .01. ***p < .001.
Rich Versus Poor Countries
The present study also explored whether the findings held in rich and poor countries. Columns 2 and 3 in Table 1 show a negative link between absolute income and pain suggesting that people with higher absolute income reported lower pain than those with lower absolute income. Moreover, this table shows that this link is the same in rich and poor countries Rich countries: b = −.015; p < .001; 95% CI [−.017, −.012] (Column 2), Poor countries: b = −.017; p < .001; 95% CI [−.019, −.013] (Column 3). These findings did not support Hypothesis 4 of this study which proposed that the link between absolute income and pain would be stronger in poor than in rich countries.
Regression models in Columns 2 and 3 in Table 2 explored the link between income rank and pain in rich and poor countries, respectively. These models show that people with lower income rank in their reference group reported greater pain than people with higher income rank. This finding was the same across rich and poor countries. Rich countries: b = −.103; p < .001; 95% CI [.094, .112] (Column 2), Poor countries: b = −.102; p < .001; 95% CI [.089, .115] (Column 3). Similarly, regression models in Table 3 show that people with lower income rank in their reference group reported greater pain than people with higher income rank after accounting for absolute income Rich countries: b = −.109; p < .001; 95% CI [.098, .119] (Column 2), Poor countries: b = −.094; p < .001; 95% CI [.080, .108] (Column 3). Although the difference in the coefficient size in the rich and poor subsamples (0.02) may appear large, later analyses confirmed that the link between income rank and pain did not differ significantly across rich and poor nations. Thus, these findings supported Hypothesis 5 of this study.
The tables presented here show a reduced version of the regression equations. Full models can be found in Supplemental Tables S.4 to S.6.
To confirm these findings across rich and poor countries, Table 4 shows regression models that explored whether GDP per capita, represented by a continuous measure, moderated the link between pain and income (both absolute and rank). The models in Table 4 yielded a statistically insignificant interaction between GDP and absolute income b = −.001; p = .440; 95% CI [−.001, .001] (Column 1), GDP and income rank b = .002; p = .250; 95% CI [−.001, .006] (Column 2), and GDP and income rank after controlling for absolute income b = .002; p = .236; 95% CI [−.001, .006] (Column 3). These findings suggest that the link between pain and income (both absolute and rank) did not differ significantly across rich and poor countries. In line with the analyses shown earlier, these results did not support Hypothesis 4 and did support Hypothesis 5 of this study. Full models together with the corresponding simple slopes analyses that confirmed these results can be found in Table S.7 in the SOM. Models using a binary measure that represented the set of poor countries with 0 and the set of rich countries with 1 yielded the same results (see Table S.8 in the SOM).
Pain and Interaction Between Income Measures and GDP Per Capita, 146 Countries, 2009–2018 Multilevel Mixed Effects Linear Models
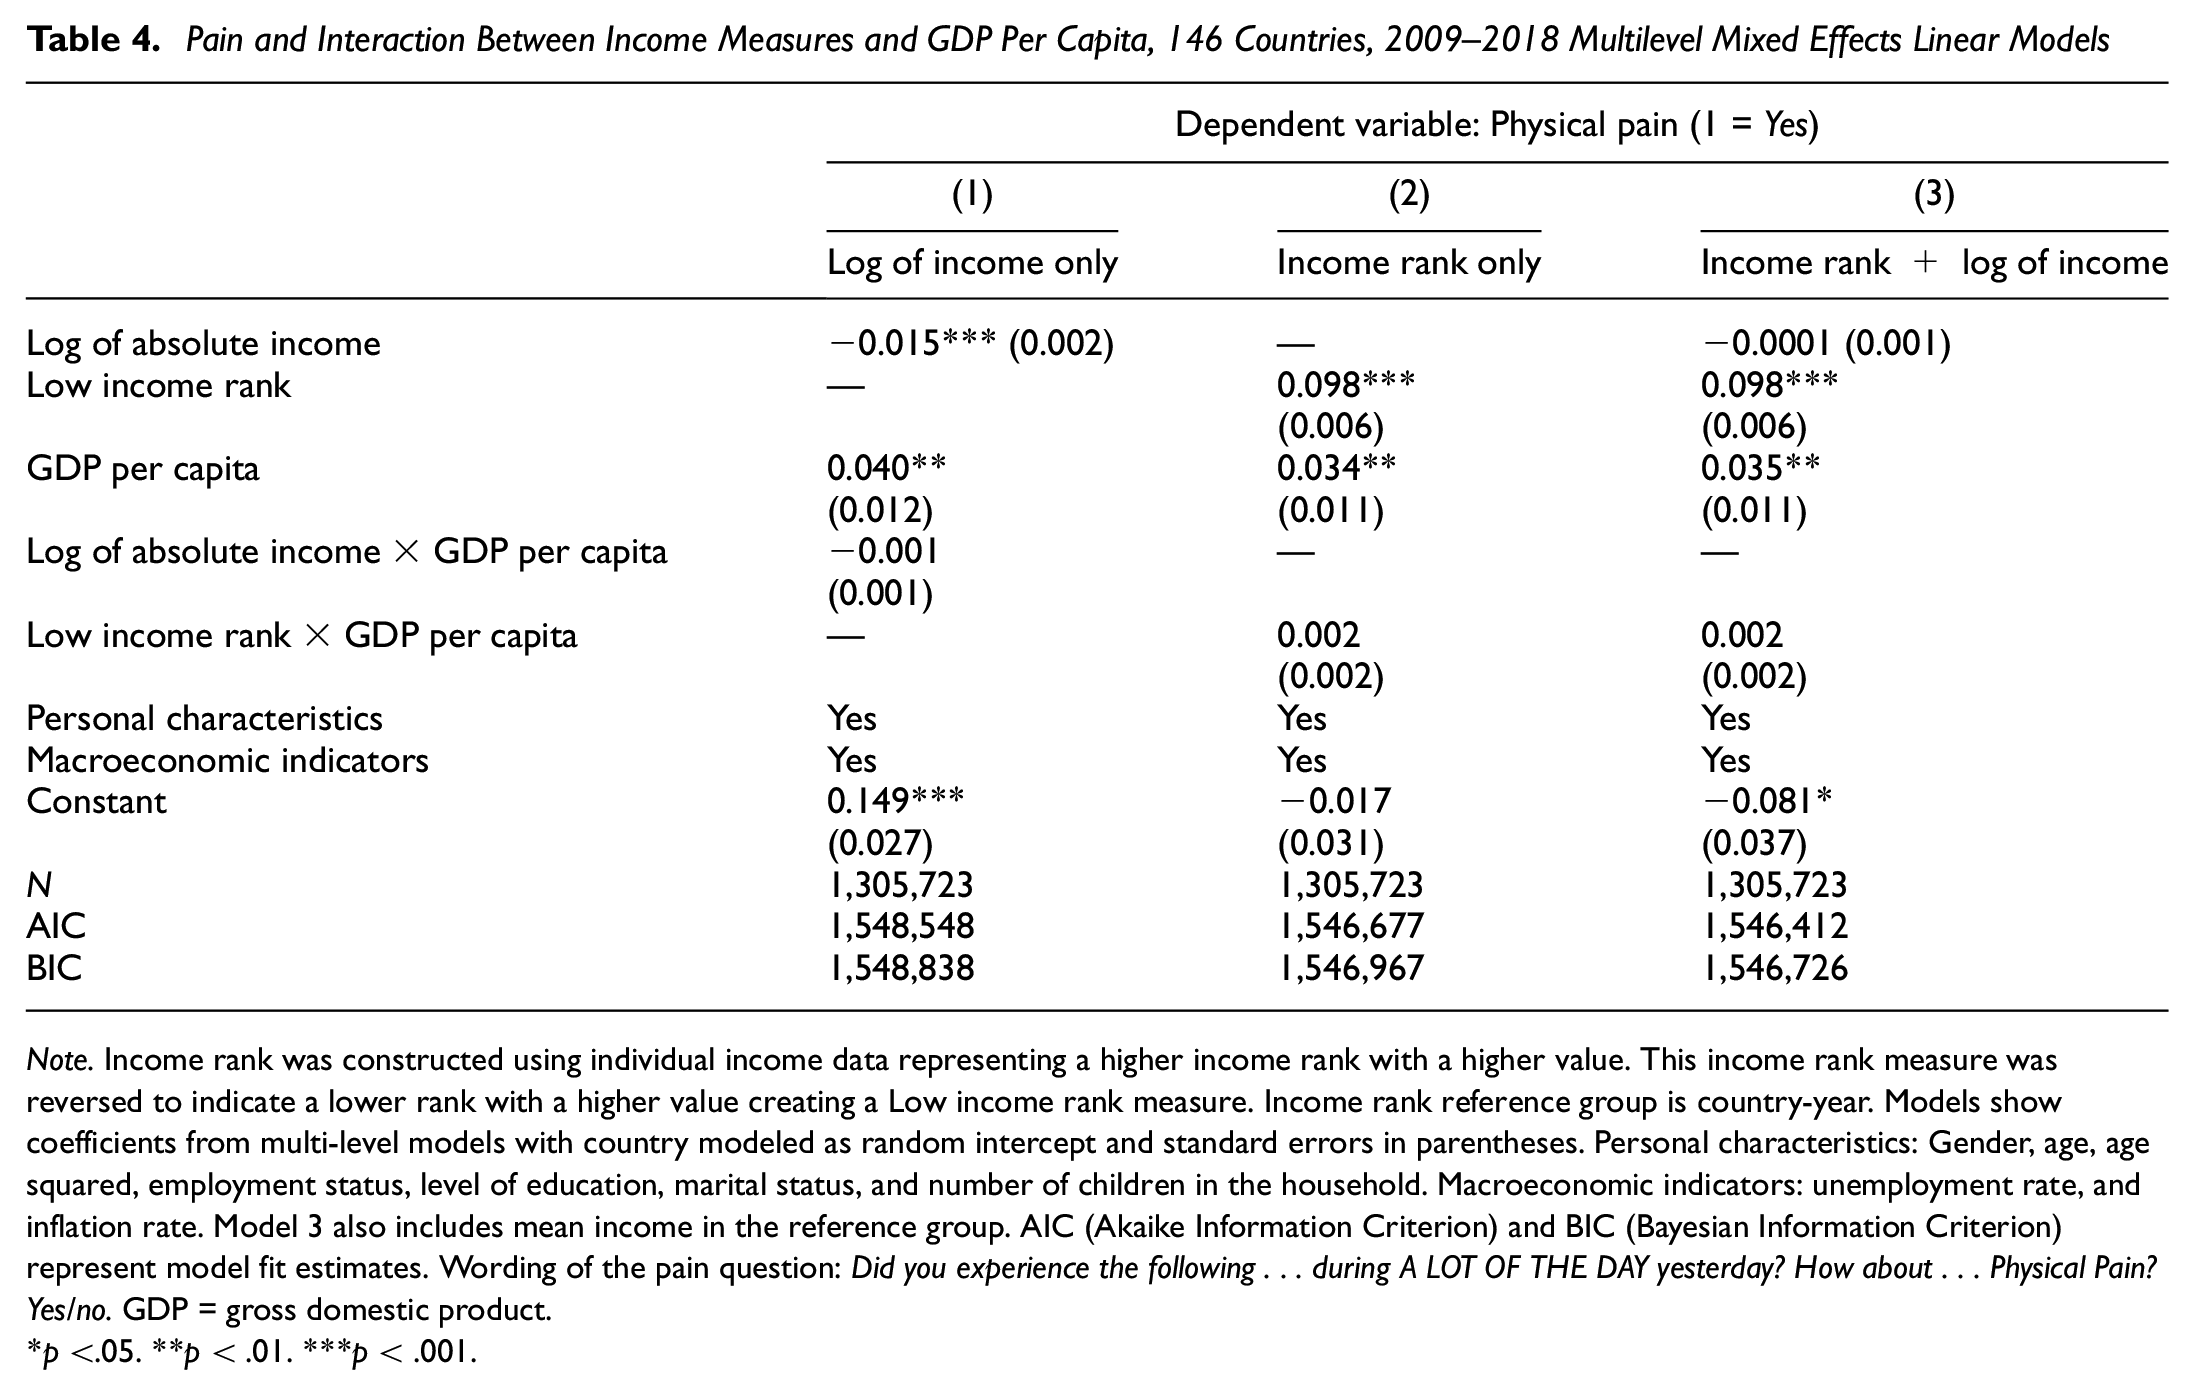
Note. Income rank was constructed using individual income data representing a higher income rank with a higher value. This income rank measure was reversed to indicate a lower rank with a higher value creating a Low income rank measure. Income rank reference group is country-year. Models show coefficients from multi-level models with country modeled as random intercept and standard errors in parentheses. Personal characteristics: Gender, age, age squared, employment status, level of education, marital status, and number of children in the household. Macroeconomic indicators: unemployment rate, and inflation rate. Model 3 also includes mean income in the reference group. AIC (Akaike Information Criterion) and BIC (Bayesian Information Criterion) represent model fit estimates. Wording of the pain question: Did you experience the following . . . during A LOT OF THE DAY yesterday? How about . . . Physical Pain? Yes/no. GDP = gross domestic product.
p <.05. **p < .01. ***p < .001.
These results could be driven by individuals with health problems, the elderly, and pensioners. The findings presented in this paper held after controlling for respondent’s age and employment status as well as other demographic characteristics, and macroeconomic indicators. The results of this study also held using multilevel mixed-effects generalized linear regressions with country modeled as random intercept (Tables S.9 to S.11 in the SOM) and after controlling for physical health (Table S.12 in the SOM).
Discussion and Conclusion
The role of income comparisons on mental well-being and general health has been extensively explored (Boyce et al., 2010; Clark & Oswald, 1996; Daly et al., 2015). Prior research suggested that low social and economic rank has a negative effect on people’s well-being and health (Adler & Snibbe, 2003; Daly et al., 2013). The present study contributes to this literature by providing new evidence on the role of income comparisons on an aspect of well-being that has not received much attention: physical pain.
This study used data from 146 countries and 1.3 million respondents and offered three main findings. First, confirming prior research, this study showed that individuals with higher absolute income reported lower pain than those with lower absolute income. Second, individuals with lower income rank in their reference group reported greater pain than those with higher income rank even after controlling for absolute income. Third, these findings were identical in rich and poor nations.
What can explain the link between income rank and physical pain? As individuals who have low income rank may also have low level of income, situations that are linked to material poverty may be attractive potential explanations (see Mani et al., 2013). However, as described earlier, the fact that income rank is linked to physical pain above and beyond absolute income rules out this kind of factors. The link between income rank and physical pain may not be driven by low levels of income per se.
Relative Deprivation Theory (Schulze & Krätschmer-Hahn, 2014) could help to explain the link between income rank and pain. Prior research has documented that feelings associated with relative deprivation like envy and injustice could lead to negative emotions like anger, stress, and resentment (Beshai, Mishra, Meadows, et al., 2017; Beshai, Mishra, Mishra, & Carleton, 2017). Similarly, income comparisons and social subordination have been found to contribute to negative emotions, represented by distress, anxiety, and depression (Clark & Oswald, 1996; Daly et al., 2013; Slavich & Irwin, 2014). In turn, these negative emotions are likely to be linked to people’s pain (Wiech & Tracey, 2009). This suggests that individuals with a lower income rank in the reference group may experience stress and anxiety which may also trigger physical pain (Adler & Snibbe, 2003).
Lack of hope for upward social mobility can also explain these findings (see Cherlin, 2018; Simandan, 2018). Individuals with lower income rank in the reference group may have lost confidence in the possibility of climbing up the income ranking. This situation may trigger negative emotions that can increase pain. In addition, individuals who have less income than others may suffer from discrimination which has been found to be linked to chronic physical pain (Brown et al., 2018; Karlsen & Nazroo, 2002; see also Lelieveld et al., 2013).
The similar results in rich and poor countries deserve special attention. This study revealed that the link between income rank and pain was identical in rich and poor nations. This finding is supported by Social Comparison Theory (Festinger, 1954) which suggests that people care about their relative standing in a reference group regardless of whether they live in a poor or a rich country. This study also found that the link between absolute income and pain was the same in rich and poor countries. Prior work has shown that the association between income and happiness was stronger in poor than in rich countries (Howell & Howell, 2008), potentially, because people who live in poor countries are likely to have more material needs than those who live in rich countries. Thus, the present study hypothesized that in poor countries the number of dollars earned would matter more than in rich countries. This study did not support this hypothesis. Future research should explore the mechanisms underlying these findings.
The characteristics of the question used as the dependent variable could be seen as a limitation. The one-zero measure of physical pain allowed us to infer neither the severity nor the type of pain that individuals experience. However, previous studies have used questions of negative and positive affect (e.g., sadness and happiness) with the same structure as the measure of pain used in this study (e.g., Kahneman & Deaton, 2010), and the same pain measure has been used in prior research (Case et al., 2020; Macchia & Oswald, 2021). Another concern could be that because the measure of physical pain was self-reported, respondents may have exaggerated their pain. However, it is not clear whether and why individuals with lower income rank would misreport their pain in a large survey (see Junghaenel et al., 2016 for a review about self-reported measures of feelings). It is worth noting that due to the cross-national aspect of the data causal interpretations should be made with caution.
The findings of this study have policymaking implications. Given that what matters for pain is an individual’s relative standing in the income hierarchy, economic growth does not seem to be helpful in reducing physical pain. However, prior research has found that the positive link between income rank and life satisfaction was stronger in countries with greater income inequality (Macchia et al., 2020). This suggests that income inequality may amplify the effect of relative standing on well-being. In line with these findings, better redistributive policies could help to even the income hierarchy and diminish the effect of income rank on physical pain.
Finally, prior research has found that the association between relative deprivation and several outcomes like life satisfaction, political trust, and respect from others was present at the aggregate level in 30 countries and stronger in countries with individualistic values (Smith et al., 2018). Thus, future research could explore whether the findings of this study differ across countries with individualistic versus collectivistic values. Overall, given the universal nature of the patterns shown here and the importance of understanding physical pain, this line of research deserves further attention.
Supplemental Material
sj-docx-1-spp-10.1177_19485506231167928 – Supplemental material for Having Less Than Others is Physically Painful: Income Rank and Pain Around the World
Supplemental material, sj-docx-1-spp-10.1177_19485506231167928 for Having Less Than Others is Physically Painful: Income Rank and Pain Around the World by Lucía Macchia in Social Psychological and Personality Science
Footnotes
Handling Editor: Danny Osborne
Declaration of Conflicting Interests
The author(s) declared no potential conflicts of interest with respect to the research, authorship, and/or publication of this article.
Funding
The author(s) received no financial support for the research, authorship, and/or publication of this article.
Data and Materials Availability
The Gallup World Poll data belong to Gallup, Inc. For more information, see: https://www.gallup.com/analytics/318875/global-research.aspx. Scripts for analyses are available through the Open Science Framework (OSF) ![]() .
.
Supplemental Material
Supplemental material for this article is available online.
Author Biography
References
Supplementary Material
Please find the following supplemental material available below.
For Open Access articles published under a Creative Commons License, all supplemental material carries the same license as the article it is associated with.
For non-Open Access articles published, all supplemental material carries a non-exclusive license, and permission requests for re-use of supplemental material or any part of supplemental material shall be sent directly to the copyright owner as specified in the copyright notice associated with the article.