
Abstract
According to a staple in the social sciences, pandemics particularly spread among people of lower social status. Challenging this staple, we hypothesize that it holds true in later phases of pandemics only. In the initial phases, by contrast, people of higher social status should be at the center of the spread. We tested our phase-sensitive hypothesis in two studies. In Study 1, we analyzed region-level COVID-19 infection data from 3,132 U.S. regions, 299 English regions, and 400 German regions. In Study 2, we analyzed historical data from 1,159,920 U.S. residents who witnessed the 1918/1919 Spanish Flu pandemic. For both pandemics, we found that the virus initially spread more rapidly among people of higher social status. In later phases, that effect reversed; people of lower social status were most exposed. Our results provide novel insights into the center of the spread during the critical initial phases of pandemics.
The COVID-19 pandemic is among the greatest global challenges of our times. Limited health resources render it imperative to understand how the pandemic spreads and to identify groups at highest risk of infection (Betsch et al., 2020; Remuzzi & Remuzzi, 2020). The social sciences, psychology included, consider social status most relevant in this regard. More precisely, a classic tenet states that people of lower social status are more exposed to pandemics than people of higher social status (O’Sullivan & Bourgoin, 2010; von Braun et al., 2020). People of lower social status are presumably exposed more because they have less opportunity to follow spread-prevention norms than people of higher social status do (Lee et al., 2021; Oishi et al., 2021; Weill et al., 2020). For instance, people of lower social status typically have jobs that make physical distancing quite difficult (Jay et al., 2020), they often lack financial resources to implement all safety precautions (O’Sullivan & Bourgoin, 2010), suffer from crowded living conditions (Yi et al., 2021), and tend to possess lower health literacy (O’Sullivan & Bourgoin, 2010). For all those reasons, the idea that people of lower social status are at the center of pandemic spread has reached the rank of a universal rule (Patel et al., 2020).
Here, we challenge that apparently universal rule. Specifically, we argue that the ability to follow spread-prevention norms can cause social status differences at later phases of pandemics only, when spread-prevention norms are in place. At earlier phases of (what later becomes) a pandemic, however, spread-prevention norms are not in place and, thus, status differences in following those norms cannot play a role. Instead, we argue that people of higher social status should drive pandemic spread at earlier phases. Why so? People of higher social status have more independent self-construals and show more varied, exploring behavior than people of lower social status (Kraus et al., 2012; Piff et al., 2010; Snibbe & Markus, 2005; Stephens et al., 2019). As a result, people of higher social status—among other things—show higher spatial mobility (Xu et al., 2018), higher relational mobility (Thomson et al., 2018), and have more heterogenous social networks (Carey & Markus, 2017). Stated otherwise, people of higher social status usually meet more diverse (novel and varying) persons than people of lower social status (Bailey et al., 2018; Carey & Markus, 2017). Extant epidemiological and biological research shows that, when a virus is not yet widespread, this diversity of social contacts determines the probability of infection (VanderWaal & Ezenwa, 2016; White et al., 2017). Recently, the diversity of social contacts has also been found key for COVID-19 spread at early phases of the pandemic. More precisely, early spread was particularly fast in regions with higher spatial mobility (Kraemer et al., 2020) and nations with higher relational mobility (Salvador et al., 2020). In all, due to their more diverse social contacts, people of higher social status should have a higher likelihood to catch a novel virus early on. By contrast, in a pandemic’s later phases (i.e., when the virus is widespread and spread prevention norms are in place), the classic tenet should apply (O’Sullivan & Bourgoin, 2010; von Braun et al., 2020). That is, people of lower social status should be particularly exposed due to their reduced opportunities to insulate themselves from the virus (i.e., less possibility to practice physical distancing and reduced health literacy; Jay et al., 2020; Lee et al., 2021; Oishi et al., 2021; Weill et al., 2020).
Since the beginning of the COVID-19 pandemic, much research has sought to understand the sociodemographic and socioeconomic determinants of COVID-19 spread (Drefahl et al., 2020; Van Dorn et al., 2020). The large majority of them replicated the classic tenet—namely, more spread among people of lower social status (Abedi et al., 2021; Chang et al., 2021; Chen & Krieger, 2020; Drefahl et al., 2020; Goyal et al., 2020; Gozzi et al., 2021; Hatef et al., 2020; Karaye & Horney, 2020; Karmakar et al., 2021; McGough et al., 2020; Mena et al., 2021; Rollston & Galea, 2020; Shahbazi & Khazaei, 2020; Van Dorn et al., 2020). Of relevance for us, however, some studies also failed to replicate this tenet. Those studies found equal spread across societal strata (Brown & Ravallion, 2020; Ehlert, 2021; Küçükali et al., 2021) or even more spread among people of higher social status (Mogi et al., 2020; Plümper & Neumayer, 2020; Rodríguez-Pose & Burlina, 2020). Our hypothesis of a time-variant relationship between social status and pandemic spread promises to solve the apparent, empirical contradiction.
Taken together, evidence for our hypothesis has the potential to (a) refine the general understanding of how pandemics spread and (b) reconcile recent findings from the COVID-19 literature that appear contradictory. To test our hypothesis, we report two studies across three nations (United States, England, and Germany), two pandemics (COVID-19, Spanish Flu), and complementary levels of analyses (region-level, person-level). 1 2
Study 1: Social Status and Region-Level Virus Spread in the COVID-19 Pandemic
Study 1 tests our hypothesis in the ongoing COVID-19 pandemic. Specifically, we examined pandemic spread across the United States, England, and Germany during the first 6 months of the COVID-19 pandemic (late February 2020 to the end of August 2020).
Pandemic Data
We gathered information on differences in pandemic spread and social status for 3,132 U.S. regions (counties), 299 English regions (local authority districts), and 400 German regions (Stadt- and Landkreise). We chose these three nations (and only those three) a priori because they meet certain criteria: They had temporally close pandemic onsets and, thus, each nation had similar information available when the pandemic hit them. These three nations were sufficiently large to show substantial regional variation in pandemic spread. In addition, all nations provide trustworthy data on COVID-19 infections (Public Health England, 2020; Robert-Koch Institut, 2020; The New York Times, 2020). Also, focusing on those three nations allowed for a conservative test of our hypothesis, as the nations differ in their pandemic trajectories (Figure 1) and in their scope of regional economic disparities (i.e., liberal market economy in the United States and England with greater social inequalities than in Germany’s coordinated market economy; Hall, 2015). In addition, we gathered information on regional demographic and socioeconomic differences from governmental sources. S1 and S2 provide sources, operationalizations, and descriptive statistics for all variables used in Study 1.
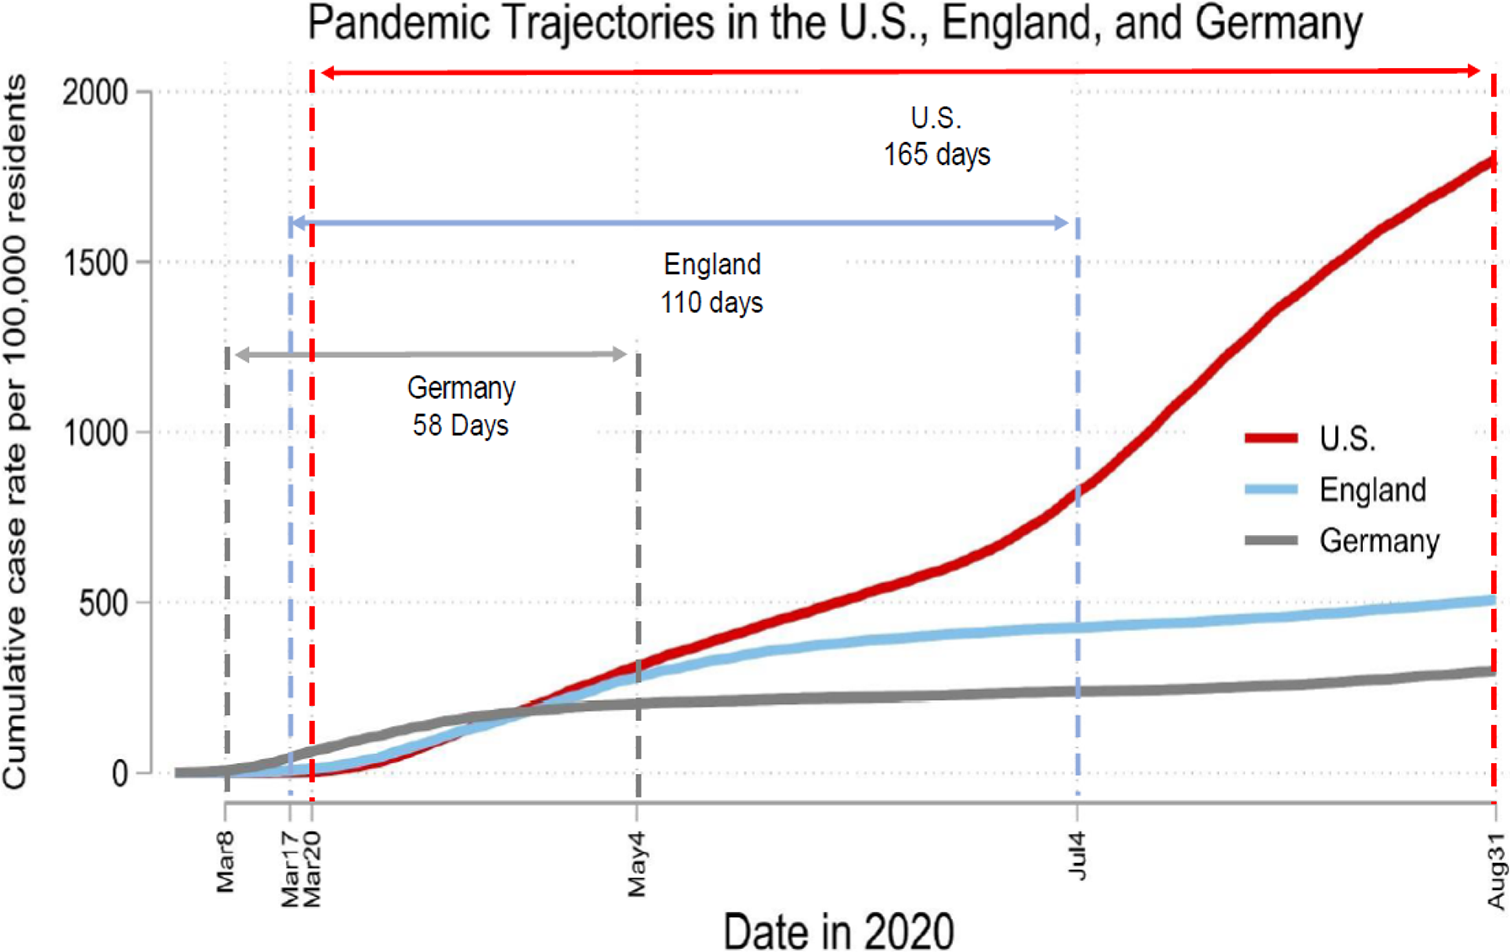
Pandemic trajectories in the United States, England, and Germany between March and August 2020. The figure reveals that the pandemic onset was slightly earlier in Germany than in the United States and England. Unlike Germany and England, the United States did not successfully contain the pandemic.
Figure 1 depicts general differences in pandemic trajectories between the United States, England, and Germany. For each nation, we defined the pandemic onset as the day when the daily rate of new infections exceeded one case per 100,000 people for the first time. We defined the pandemic wave in a nation as contained when the daily rate of new infections dropped below the threshold of one case per 100,000 people for at least three consecutive days. In Germany, pandemic spread started to rise at the beginning of March and, thus, slightly earlier than in the United States and England. Germany was also the first nation to successfully contain the pandemic wave (see cumulative case rates leveling from May 4 onward). In England, pandemic spread started in mid-March and was contained by the beginning of July. In the United States, pandemic spread also started in mid-March and was not successfully contained in the following 6 months. Based on these pandemic trajectories, we derived different windows of analysis for the three nations: for Germany and England that window spanned from the pandemic onset to its containment (58 days for Germany, 110 days for England). For the United States, there was no containment and, thus, we relied on data from the pandemic onset to the end of our data collection (165 days).
Method
We operationalized social status as regional median income. We determined this operationalization a priori because past research found median income most relevant for behavioral implications of social status (Bianchi & Vohs, 2016; Carey & Markus, 2017). Probably for the same reason, extant research on social status and pandemic spread has almost exclusively chosen the same operationalization (Chen & Krieger, 2020; Drefahl et al., 2020; Ehlert, 2021; McGough et al., 2020). We used growth curve modeling (Goldstein et al., 1994) to test whether COVID-19 initially spread faster in higher income regions (i.e., where more people of higher social status live) than in lower income regions. In the first step, we determined which function of time (i.e., first, second, third, or fourth-order polynomial) can most parsimoniously model the observed pandemic growth curve in each nation (Figure 1). For all three nations, we found that a quadratic time function (i.e., second-order polynomial of time) adequately captures the observed pandemic growth curve (see S3 for selection and evaluation of the polynomial function). Next, we investigated in each nation whether growth curves differed between lower income and higher income regions. To do so, we fitted multilevel models (days nested in regions: United States: 516,780 days in 3,132 regions, England: 32,890 days in 299 regions, and Germany: 23,200 days in 400 regions). Our criterion was the daily cumulative case rate, and our predictor was time (i.e., number of days since the pandemic’s onset). To test our hypothesis (i.e., whether the pandemic initially spread more rapidly in regions of higher social status), we fitted two cross-level interactions: Days × Median Income and Days2 × Median Income. In all models, we specified random intercepts and random slopes of Days. 3 Additionally, we accounted for serial autocorrelation among residuals by specifying an autoregressive structure of order 1 for within-region error terms. All sample sizes greatly exceeded the recommended minimum thresholds for multilevel modeling (Arend & Schäfer, 2019; Maas & Hox, 2005).
Results
Table 1 depicts the results of our growth curve models. The main effects of Days and Days 2 diverge across nations. These diverging main effects capture the nation’s different pandemic trajectories (Figure 1). Specifically, for the United States (where the pandemic was not contained), the combination of a positive effect of Days and a positive effect of Days 2 indicates a progressive growth curve. For England and Germany (where the pandemic was contained), the combination of a positive effect of Days and a negative effect of Days 2 indicates a degressive growth curve. The interactions between these time variables and median income indicate whether growth curves vary between higher income and lower income regions.
Results of Growth Curve Models for Cumulative Case Rates Across regions in the United States, England, and Germany.
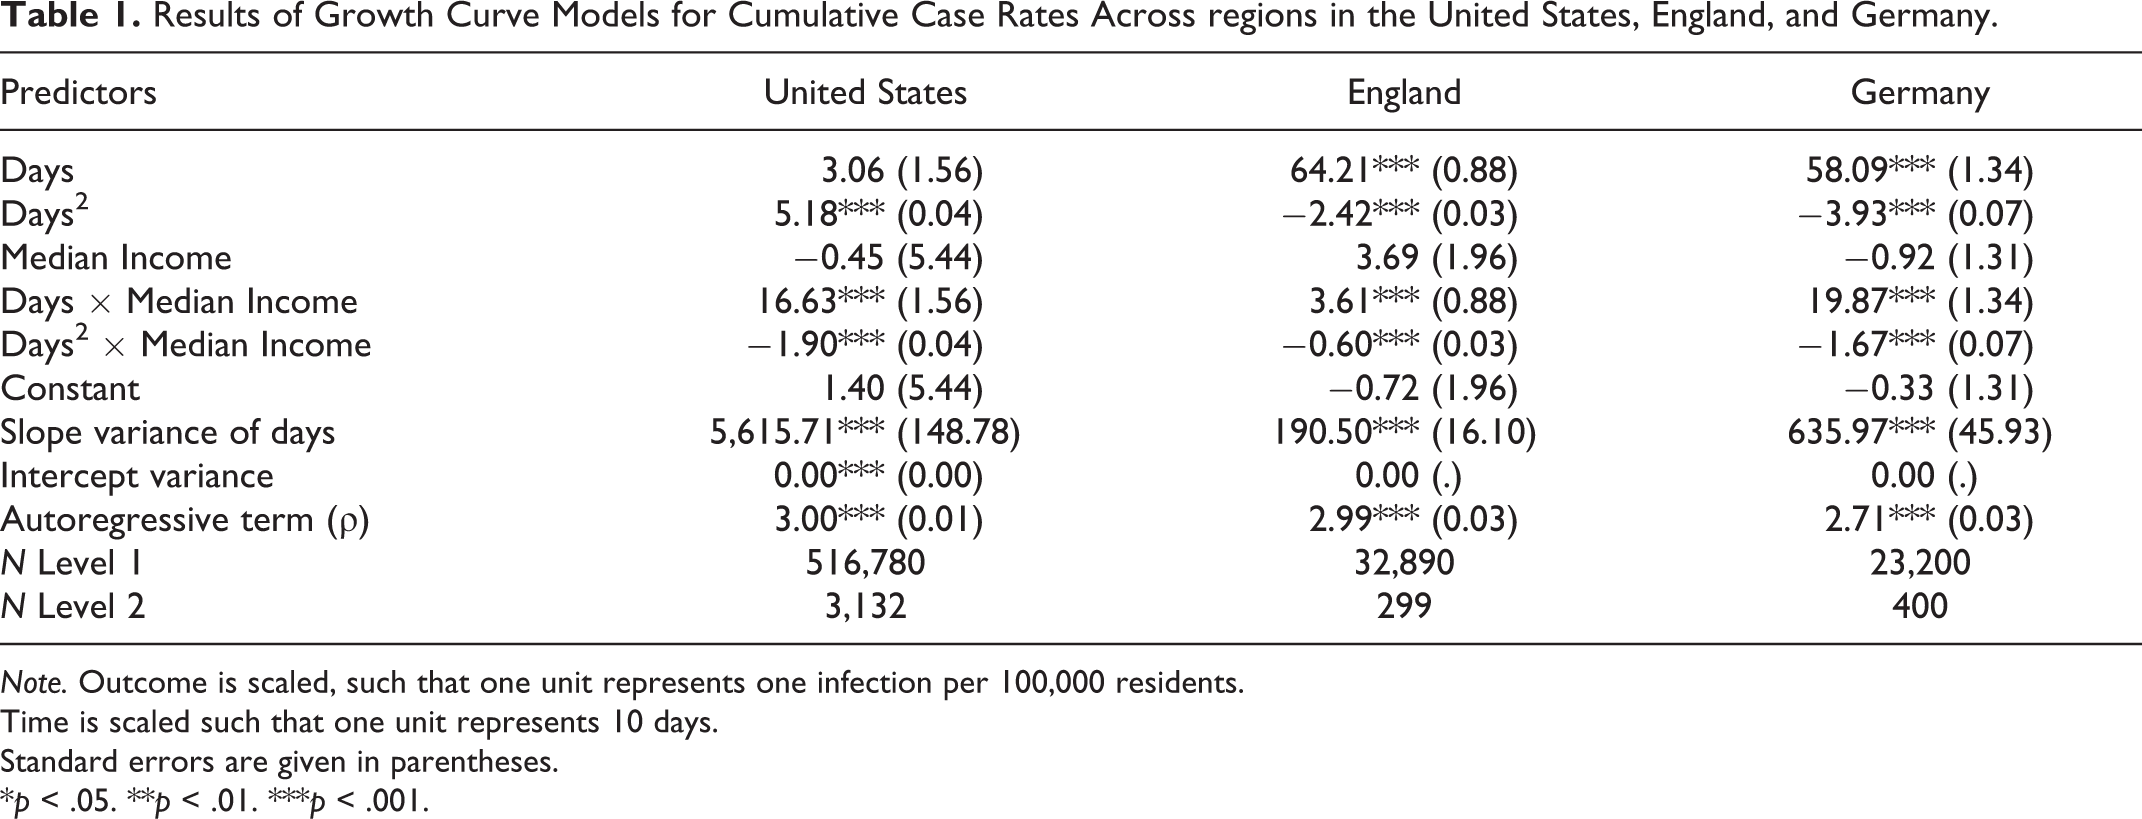
Note. Outcome is scaled, such that one unit represents one infection per 100,000 residents.
Time is scaled such that one unit represents 10 days.
Standard errors are given in parentheses.
*p < .05. **p < .01. ***p < .001.
We found significant interactions between the time variables and median income on pandemic spread. Specifically, for all three nations, we found a positive interaction between Days and median income. This interaction suggests that the pandemic initially spread more rapidly in higher income regions. Furthermore, for all three nations, we found a significant negative interaction between Days 2 and median income. That interaction suggests that, as the pandemic progresses, the positive relationship between median income and pandemic spread changes (i.e., decreases or reverses). To better understand the meaning and real-world relevance of these coefficients, Figure 2 plots the predicted growth curve emerging from the joint effects of the parameters in Table 1. Specifically, the figure visualizes the predicted growth curves for regions of relatively higher income (+1.5 SD median income, blue lines) and regions of relatively lower income (−1.5 SD median income, red lines).
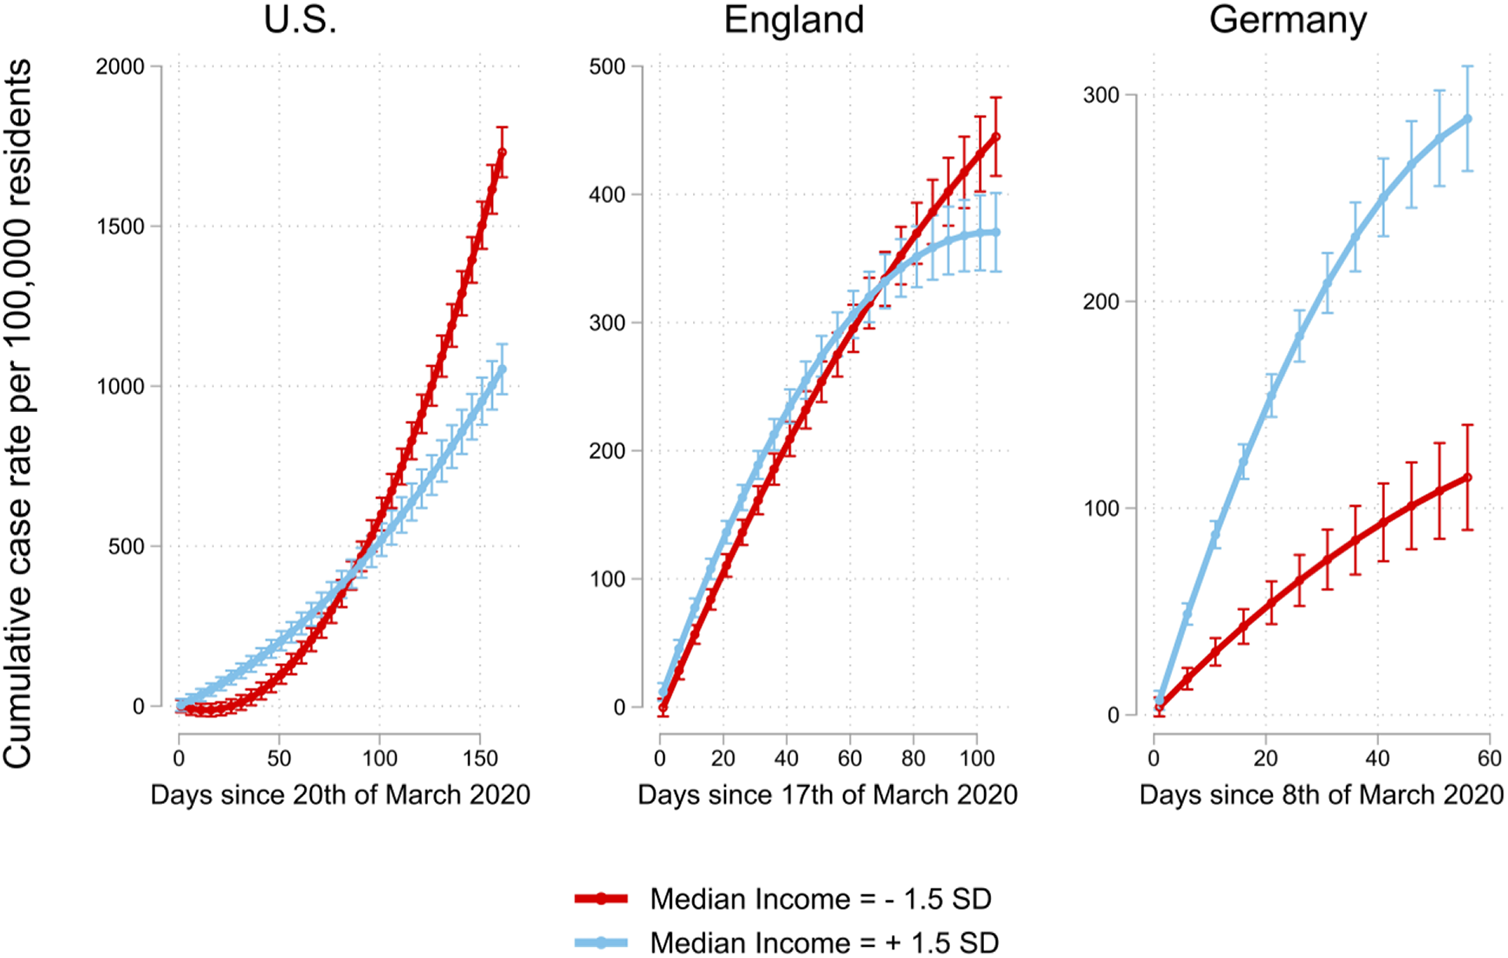
Predicted marginal means with 95% CIs of regional daily cumulative infection rates in the United States, England, and Germany as a function of time and median income. In all nations, higher income regions (blue lines) initially show a steeper increase in COVID-19 cases than lower income regions (red lines).
Corroborating our hypothesis, Figure 2 shows that the pandemic initially spread more rapidly in higher income regions in all three nations. To illustrate the real-world relevance of these effects, 30 days into the pandemic, higher income regions (+1.5 SD median income) in the United States and Germany were hit multiple times (United States: 9.9 times; Germany: 2.8 times) as hard as lower income regions (−1.5 SD median income), while in England, higher income regions were hit 1.2 times as hard as lower income regions (−1.5 SD median income). By contrast, and in line with the classic tenet (O’Sullivan & Bourgoin, 2010; von Braun et al., 2020), during later pandemic phases, the virus spread more strongly in lower income regions within the United States and England (red lines). In fact, in the United States and in England, after 2–3 months into the pandemic, lower income regions showed higher cumulative case rates than higher income regions. These detrimental effects for lower income regions were particularly dramatic in the United States where the pandemic could not be contained successfully. Here, after 5 months into the pandemic, lower income regions were hit 1.65 times as hard as higher income regions. Notably, in Germany, the situation was somewhat different. Overall, lower income regions were not hit harder than higher income regions. There are at least two plausible explanations for this. First, compared to the United States and England, Germany has a more egalitarian societal and medical system (Thelen, 2012), which should generally reduce the vulnerability of lower income people (Vadlamannati et al., 2021). Second, compared to the United States and England, Germany was rather successful at containing the pandemic (see Figure 1). As such, pandemic containment likely was early enough to prevent the pandemic from spilling over from higher income regions to lower income regions.
We ran several additional analyses to scrutinize the robustness of our results. First, we controlled for pertinent covariates of regional median income that have been associated with pandemic spread: regional demographics (age, gender; Walker et al., 2020) and political climate (share of conservative votes; Gollwitzer et al., 2020). Next, we sought to rule out that our findings simply represent urban–rural differences (Jay et al., 2020) and controlled for population density (inhabitants per km2; a commonly used catch-all variable to account for urbanity and infrastructural characteristics; Stuetzer et al., 2016). In addition, we controlled for the popularity of a region as a tourist destination (share of people employed in hoteling industry or hotel beds per capita; Salvador et al., 2020). Furthermore, previous research shows that the pandemic initially spread more rapidly in inequal and segregated U.S. regions (Yu et al., 2021). Therefore, we additionally controlled for income inequality (Gini coefficient of incomes) and racial segregation (residential segregation white/non-White) in our U.S. models. 4 We found that our main results hold when controlling for all these covariates simultaneously (S5–S7). Second, an alternative explanation for our results might be that higher income regions show early spread because they could build up testing capacities more quickly. Therefore, we repeated our analysis predicting regional daily COVID-19 death rates (i.e., a pandemic outcome that should be less susceptible to regional differences in testing capacities). With one exception (insignificant interaction between Days 2 and median income in Germany), we found that the result of this alternative outcome replicated our previous results, which were based on reported infections (S8–S11). Third, we replicated our main finding using a consistent time frame for all three nations ranging from March 15 to June 15, 2020. Using these consistent time frames led to identical conclusions (S12–S15). Fourth, we replicated our main finding using alternative polynomial functions (i.e., third- and fourth-order polynomials of time). Using these higher order polynomials led to identical conclusions as did the quadratic polynomial function (see predicted growth curves for third- and fourth-order polynomials in S16 and S17). Taken together, this first study provides converging evidence from three nations that COVID-19 initially spread more strongly in higher income regions than lower income regions.
Finally, we sought to probe for possible boundary conditions of our findings by exploring alternative measures of social status (Kraus & Stephens, 2012). Specifically, we replicated our main analyses using education (i.e., share of residents with tertiary education) and occupational prestige (i.e., share of residents in managerial and professional occupations) as alternative measures of social status (S18–S25). Given that these alternative measures of social status are positively correlated with income, they (unsurprisingly) replicated the basic effect of the income measure (i.e., initial spread in regions with higher educational attainment and job prestige and later spread in regions with lower educational attainment and job prestige). However, as these measures are less closely tied to behavioral outcomes (Bianchi & Vohs, 2016), their effects were less pronounced (i.e., smaller effect sizes) and less robust (i.e., more vulnerable to confounds) than the effects for the income measure. These results corroborate our a priori decision to rely on income rather than education or occupational prestige.
Study 2: Social Status and Person-Level Virus Spread in the 1918/1919 Spanish Flu Pandemic
Study 2 provides evidence that the conceptual conclusions from Study 1 prevail in a different pandemic setting and when using person-level data instead of region-level data (i.e., when ruling out the ecological fallacy as an alternative explanation; Piantadosi et al., 1988). More precisely, the present study used person-level data from U.S. residents who were alive during the 1918/1919 Spanish Flu pandemic. The Spanish Flu pandemic was arguably the last pandemic comparable to COVID-19, as it killed over 50 million people worldwide (Hatchett et al., 2007; to compare, the SARS pandemic in 2002–2004 killed less than 800 people globally).
Pandemic Data
It is a challenge to gather person-level data from a pandemic that was rampant over 100 years ago. To meet this challenge, we used the latest techniques in social data science. Specifically, we randomly drew a sample of 5 million memorials from the world’s largest gravesite collection findagrave.com . Memorial sites from this online-gravesite collection typically contain a picture of the deceased person’s gravestone along with basic information about the deceased person (i.e., name, year of birth, year of death, and burial site). Notably, a gravestone picture is not a prerequisite and people can create memorials for ancestors that no longer have (or never had) a gravestone. The vast majority of these memorials belong to U.S. residents and we excluded memorials of persons buried outside the United States. Cemeteries are an integrative space (Rogers, 2004) and, indeed, we found that this raw sample represented the actual U.S. population at the time reasonably well. For example, among the subsequently used birth cohorts (1880–1919), the distribution of first names in our sample reflected official estimates virtually perfectly (N = 4,085; β = .99, 95% CI [.99, .99], p < .001).
The Spanish Flu pandemic was unique in the sense that it was particularly dangerous for younger people under 40 years of age, whose “normal” death rate is extremely low. Therefore, we only included people who were born since 1880 and, thus, younger than 40 years of age during the pandemic. Given that we are focusing on a young-age group, the observed deaths during pandemic times have almost certainly resulted from a pandemic infection (rather than from non-pandemic causes). In addition, the Spanish Flu virus was unique in the sense that it could kill at a very high speed, with people waking up feeling sick and dying on their way to work (Taubenberger & Morens, 2006). Taken together, we assume that daily mortality data numerically and temporally represent the infected population reasonably well. Figure 3 shows that the period of the Spanish Flu’s most severe wave (i.e., September 1918–January 1919; Taubenberger & Morens, 2006) is clearly visible in our data.
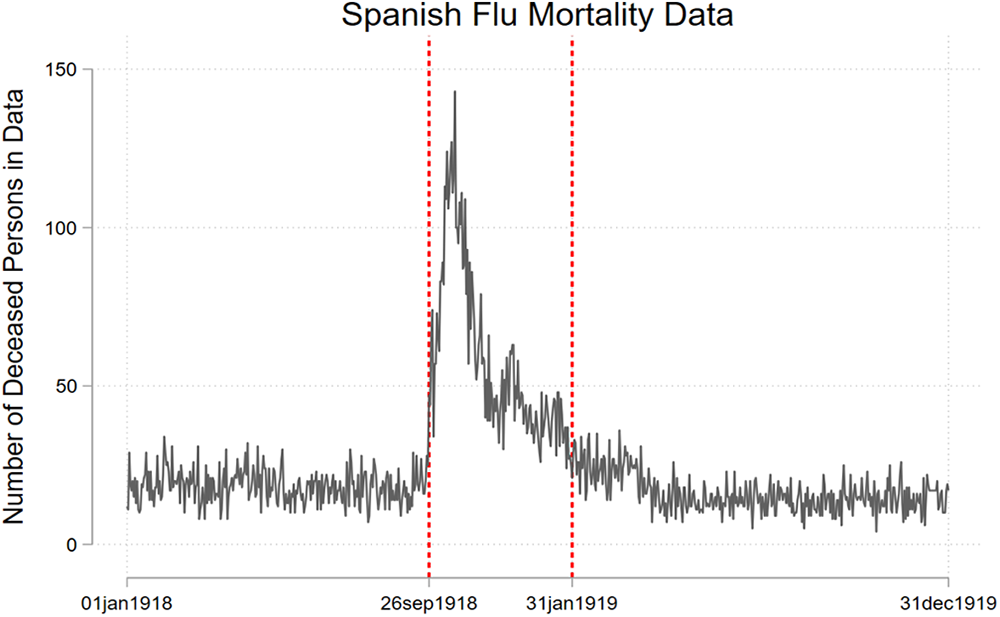
Number of deceased persons in the data for each day in 1918/1919. Beginning on September 26, 1918, the daily number of deaths rises sharply, peaking at a seven-fold increase from baseline on October 19, 1918. Mortality numbers remain at twice as high as baseline until the end of January 1919.
Method
Following extant research (Enos, 2016; Lieberson & Bell, 1992; Piff et al., 2018; Willis & Willis, 1982), we measured social status based on people’s names. First, we used the social security name database to derive the commonness of a person’s first name (U.S. Social Security Administration, 2020). It is well-documented that parents of higher social status chose more common first names for their offspring at that time (Clark et al., 2015; Lieberson & Bell, 1992; Oliver et al., 2016; Willis & Willis, 1982). For example, Clark et al. (2015) calculated the relative representation of common first names among Oxbridge students and found that between 1800 and 1829, common names were overrepresented among high-status students. 5 Second, we used Census information (U.S. Census Bureau, 2010) to derive the probability that a person is of Black race based on their last name. Again, it is well-documented that people of Black race were (and still are) among the most socially deprivileged groups in the United States (Piff et al., 2018). We averaged first-name commonness and the reverse-scored probability of being Black after z-standardizing the two. As such, persons with uncommon first names and a high probability of being Black (e.g., Myrtle Smokes or Avery Tasby) were classified as lower social status than people with common first names and a low probability of being Black (e.g., Amanda Cornett or Michael Walsh). Corroborating our measure’s validity, we found that statewide differences in name-based social status were positively associated with statewide income levels in 1920 (N = 49; β = .53, 95% CI [.28, .78], p < .001). Furthermore, for the included birth cohorts (1880–1918), name-based social status positively predicted an individual’s reached age (N = 1,556,782; β = .01, 95% CI [.01, .01], p < .001).
We prepared our data to indicate for each pandemic day and person whether an event (i.e., death) occurred or did not occur. After this preparation, our final model comprised 147,954,692 daily spells from 1,159,920 persons (52.05% male) with a total of 6,710 deaths. Thus, this study, too, was well-powered. We analyzed the association between social status and mortality using time-to-event analysis (Cox, 1972). Specifically, we used Cox (1972) regressions to predict the probability of dying by a person’s social status. Our hypothesis predicts that the association between social status and death probability changes over time (i.e., higher death probability at the beginning of the pandemic for people of higher social status). Therefore, we specified an interaction between social status and time. To this end, we split our data at each day and allowed for a time-varying effect of social status using restricted cubic splines (Discacciati et al., 2015).
Results
We found a time-varying association between social status and mortality (Wald’s test of proportional-hazards assumption: χ2(2) = 15.91, p < .001; Figure 4). In line with our hypothesis, higher social status predicted a higher risk of dying during the initial phases of the Spanish Flu pandemic (i.e., a hazard ratio greater than one). To illustrate, an increase of 1 standard deviation in social status was associated with a 6.8% higher risk of dying at the pandemic’s onset. By contrast, and in line with the classic tenet (O’Sullivan & Bourgoin, 2010; von Braun et al., 2020), higher social status predicted a lower risk of dying during the later phases of the pandemic (i.e., a hazard ratio smaller one). Specifically, at the end of the pandemic, an increase of 1 standard deviation in social status was associated with an 8.5% lower risk of dying.
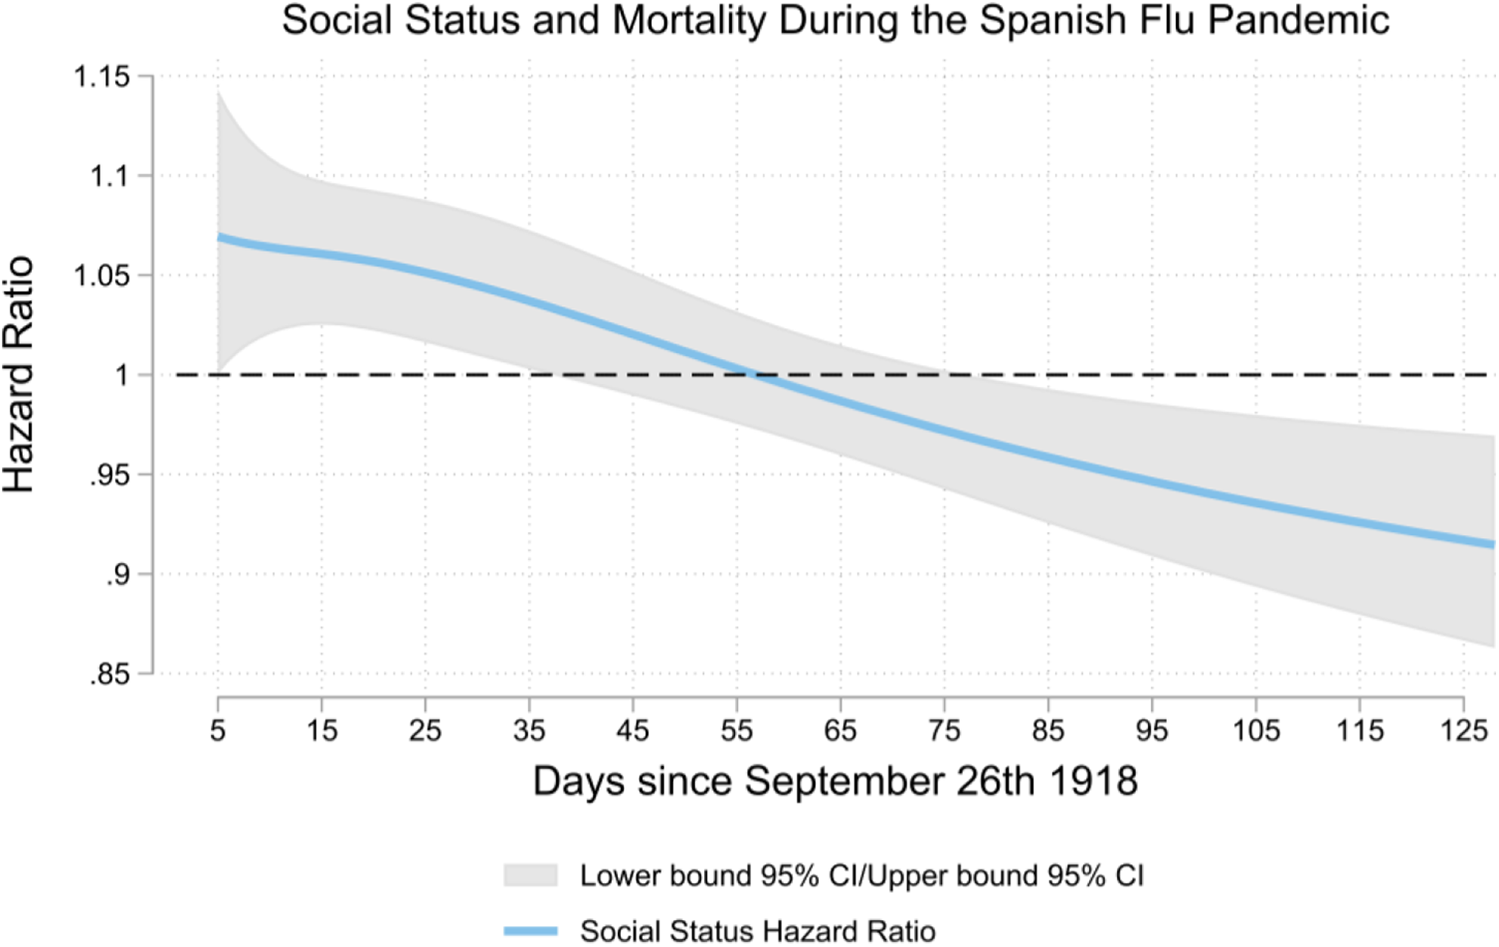
Association between social status and the risk of dying during different phases of the Spanish Flu pandemic. Higher social status was associated with a higher risk of dying during the initial phases of the pandemic (i.e., hazard ratio greater one). Around Day 55 of the pandemic, this effect reversed. In later stages of the pandemic, higher social status was associated with a lower risk of dying (i.e., lower hazard ratio).
To scrutinize the robustness of this result, we ran additional models accounting for gender and cohort effects. In addition, we ran a model including state-fixed effects to account for the pandemic’s geographic spread. Furthermore, the 1918/1919 Spanish Flu pandemic coincided with the end of World War I in November 1918. Therefore, we repeated our analysis including only those deceased people for which occasionally provided death place information on findagrave.com determined that they died in the United States (i.e., not in combat overseas). Next, we ran a model predicting mortality solely on the likelihood of being Black. All these additional models led to results conceptually identical to our main-text results (S26–S30). Finally, we wanted to ensure that our findings do not represent a seasonal effect. Therefore, we repeated our analysis for the same period 1 year earlier and 1 year later and found that the pattern from the Spanish Flu period in 1918/1919 did not repeat one year earlier or later (S31–S32).
Discussion
According to a staple in the social sciences, people of lower social status are particularly exposed to pandemics (O’Sullivan & Bourgoin, 2010; von Braun et al., 2020). Acknowledging that pandemics evolve in phases (World Health Organization, 2017; Zhang et al., 2020), we provided a more nuanced account. Specifically, we proposed that during the critical initial phases of pandemics, people of higher (not lower) social status are at the center of the spread. Our research builds on established social status theory in social psychology: People of higher social status exhibit more independent behavior, are more mobile, and possess more diverse social networks; people of lower social status exhibit more interdependent behavior, are less mobile, and possess more homogenous social networks (Carey & Markus, 2017; Kraus et al., 2012; Thomson et al., 2018). Further, our research helps reconcile findings from the ongoing COVID-19 pandemic that appeared contradictory (Drefahl et al., 2020; Mogi et al., 2020). Finally, our research makes much-needed progress toward a distinctively psychological theory of pandemics (Betsch, 2020; Van Bavel et al., 2020).
Across three nations, two pandemics, two levels of analysis, and different data sources, we found full support for our hypothesis. Study 1 used region-level infection data and showed that in the initial phases of the COVID-19 pandemic, the virus spread primarily in higher income regions. In the later phases of the pandemic, however, the virus spread primarily in lower income regions. Study 2 showed that the 1918/1919 Spanish Flu pandemic in the United States initially spread more strongly among people of higher social status. Later on, by contrast, the pandemic spread most strongly among people of lower social status. Study 2 relied on a unique historic data set of millions of memorials, which we web-harvested using the latest social data science techniques. As such, the study highlights the potential of adding a historical perspective to derive insights into pandemic processes (Hatchett et al., 2007) and showcases the potential of social data science to scrutinize such historical data at large scale (Adjerid & Kelley, 2018; Kosinski & Behrend, 2017). By combining large-scale contemporary data and historical data, our work is one of the few psychological studies that examines historic events (Arnett, 2008; Muthukrishna et al., 2021). A limitation of our work is its focus on three Western, developed nations (Henrich et al., 2010a, 2010b). Accordingly, it will be an important task for future research to probe whether our findings extend to non-Western, less developed nations.
The COVID-19 pandemic hit the world underprepared (Remuzzi & Remuzzi, 2020; Walker et al., 2020). Hence, far-reaching societal decisions had (and still have) to be made under great uncertainty. Our study aims at reducing these uncertainties and ultimately at improving allocation of resources. We provide a more nuanced understanding of the initially most exposed societal strata during pandemics, informing both, scientific theory and real-world decision making. In fact, our findings have actable implications for containment efforts: First, people of higher social status are at the center of the initial spread. As such, higher income regions should probably be a focus of outbreak monitoring whenever a new pandemic seems to rise. Second, the longer pandemics last, the more they will spread among people of lower social status. Importantly, our results suggest that previous research might even have underestimated the risk people of lower social status face at later pandemic phases. This is so because previous estimates did not differentiate between earlier and later phases and, thus, lumped together their opposed effects.
As we write this article, we are amid a second COVID-19 wave. It, therefore, remains an important task for future research to examine whether our results generalize to later waves. Recall that our theoretical reasoning rests on the preconditions that (a) the virus is not yet widespread and that (b) social behaviors are unrestricted. These preconditions are necessarily fulfilled during the initial phases of a pandemic’s first wave. Regarding later pandemic waves, however, it is less clear whether those preconditions are fulfilled. On the one hand, in many nations, the virus was almost entirely contained, and life has largely gone back to normal in-between COVID-19 waves (e.g., reopened restaurants, hotels, and shopping centers). From this perspective, first and later waves might show similar spreading patterns (i.e., initial spread among higher social status people in both waves). On the other hand, social behaviors were never entirely reset to their prepandemic state (e.g., mask-wearing, avoidance of large gatherings, and restricted flying). Furthermore, the virus survived at low levels in-between the waves in all societal strata. If anything, it probably survived better among people of lower social status. From this perspective, first and later waves might show different spreading patterns (i.e., initial spread among higher social status people in the first wave, but initial spread among lower social status people in later waves). Considering these competing perspectives, there might be no universal answer to the question of whether first and later waves initially spread similarly across societal strata. Rather, the spreading patterns of later waves more likely depend on a nation’s specific pandemic trajectory (e.g., consider the United States that never contained the virus vs. Germany that almost entirely contained the virus in-between waves).
Taken together, our findings hint at a most relevant (and tragic) dynamic: While people of higher social status may import novel viruses and cause their initial spread, people of lower social status carry the major burden once the pandemic unfolds. Importantly, this spread among people of lower social status during later pandemic phases is particularly consequential. Specifically, people of lower social status not only suffer from reduced access to health resources (which leads to a higher death toll) but will also need longer to economically recover from a pandemic crisis (which perpetuates existing social inequalities; Walker et al., 2020). Importantly, our findings highlight that these adverse effects for people of lower social status may be preventable. Specifically, if containment measures are implemented early and rigorously, it might be possible to stop pandemics before they reach the most vulnerable societal strata.
Supplemental Material
Supplemental Material, sj-docx-1-spp-10.1177_19485506211039990 - Pandemics Initially Spread Among People of Higher (Not Lower) Social Status: Evidence From COVID-19 and the Spanish Flu
Supplemental Material, sj-docx-1-spp-10.1177_19485506211039990 for Pandemics Initially Spread Among People of Higher (Not Lower) Social Status: Evidence From COVID-19 and the Spanish Flu by Jana B. Berkessel, Tobias Ebert, Jochen E. Gebauer, Thorsteinn Jonsson and Shigehiro Oishi in Social Psychological and Personality Science
Footnotes
Author Contribution
JBB and TE contributed equally and share first authorship. JBB and TE: study concept, statistical analyses, and manuscript draft/JBB, TE, and TJ: data collection/JBB, TE, JEG, and SO: manuscript revision.
Declaration of Conflicting Interests
The author(s) declared no potential conflicts of interest with respect to the research, authorship, and/or publication of this article.
Funding
The author(s) disclosed receipt of the following financial support for the research, authorship, and/or publication of this article: This work was supported by the German Research Foundation (GE 2515/6-1), the German National Academic Foundation, the German Academic Exchange Foundation, and the Fulbright Association.
Supplemental Material
The supplemental material is available in the online version of the article.
Notes
References
Supplementary Material
Please find the following supplemental material available below.
For Open Access articles published under a Creative Commons License, all supplemental material carries the same license as the article it is associated with.
For non-Open Access articles published, all supplemental material carries a non-exclusive license, and permission requests for re-use of supplemental material or any part of supplemental material shall be sent directly to the copyright owner as specified in the copyright notice associated with the article.