
Abstract
Humans are not purely selfish money maximizers. Most individuals take into account consequences for others in their decisions, reflecting social preferences. In a large-scale study (N = 2,889) involving population-representative samples from 10 nations, we investigated social preferences toward different national out-groups. Social preferences varied systematically depending on the other person’s nationality. Individuals showed higher social preferences toward others from nations rated similar to their own nation in terms of the stereotype content dimensions of agency, conservative/progressive beliefs, and communion (ABC) and, to a lesser extent, the Hofstede cultural dimensions. Similarity according to the ABC stereotypes more strongly predicted out-group-specific social preferences than similarity according to the Hofstede cultural dimensions. The effects of similarity on social preferences increased with identification with the national in-group. Results support self-categorization theory, but not social identity theory, indicating that perceptions of similarity influence interaction behavior between individuals from different nations.
Prosocial behavior contributes to the efficient working of societies and makes life more enjoyable (Hardin, 1968). Research in psychology and economics investigates prosocial behavior by inferring social preferences (van Lange, 1999) from allocation choices between the self and other persons (Murphy et al., 2011). Social preferences are the extent of being concerned about the resources allocated not only to oneself but also to others (Fehr & Fischbacher, 2002). They indicate the extent to which individuals consider the well-being of others—even at individual costs (Murphy & Ackermann, 2014). Investigating cross-national social preferences is relevant because they are the foundation for other prosocial behaviors (Balliet et al., 2009; Fiedler et al., 2018; Murphy & Ackermann, 2014; Murphy et al., 2011) and can thus contribute to intergroup cooperation (e.g., multinational teamwork or international aid). Social preferences were mainly investigated as general and rather stable cooperation tendencies (Aaldering et al., 2018; Murphy & Ackermann, 2014). However, they also vary depending on the social perception of the relevant other, which is largely determined by social group membership. Social preferences are higher toward in-group than out-group members (Aaldering et al., 2018; Balliet et al., 2014) and are also relevant in the cross-national context (Dorrough & Glöckner, 2016; Falk et al., 2018).
The current study goes beyond previous demonstrations of in-group bias in social preferences by investigating preferences toward individuals from various national out-groups. Social preferences are predicted by dispositional trait variables (e.g., Hilbig et al., 2014), but dispositions do not directly translate into prosocial behavior, and social preferences vary with situational factors (e.g., Ackermann et al., 2016; Haesevoets et al., 2015). Therefore, we systematically investigate variability in social preferences depending on the nationality of the interaction partner. Based on social perceptions research (Hofstede Insights, 2020; Jenkins et al., 2018), we expect systematic differences in out-group-specific social preferences to be predicted by the similarity between the in-group and the national out-groups. We assess social preferences with an adapted version of the Social Value Orientation (SVO) slider (Murphy et al., 2011) measuring different degrees of prosociality. 1
We draw on theoretical approaches arriving at opposing predictions about whether similar or dissimilar out-groups are more likely to receive higher social preferences. According to social identity theory (Tajfel & Turner, 1986), individuals are motivated to gain positive distinctiveness of their in-group against out-groups. The more similar the out-group is to the in-group, the more it is perceived to be a relevant comparison group from which to differentiate the in-group (Tajfel, 1982). Intergroup similarity threatens group distinctiveness. Consequently, individuals differentiate their in-group more strongly from similar out-groups (i.e., reactive distinctiveness; Spears et al., 2002). Numerous findings support this assumption (Dorrough & Glöckner, 2016; Fiedler et al., 2018; Jetten et al., 2001, 2004; Tajfel, 1982; Tajfel & Turner, 1986)
In contrast, self-categorization theory (Turner et al., 1987) predicts people to show higher social preferences toward individuals perceived to be similar to the self/the in-group. According to self-categorization theory, social preferences increase with similarity as cognitive processes lead to higher differentiation of the in-group to dissimilar out-groups, which are thus perceived to be clearly distinct (i.e., reflective distinctiveness; Spears et al., 2002). This prediction is also supported by evolutionary approaches, as perceived similarity signals kinship (Dovidio et al., 2006) and promotes favorable treatment (Park & Schaller, 2005).
Based on studies of similarity and cooperation in economic games (Fiedler et al., 2018; I. Fischer, 2012), we argue that similarity is a cue for social preferences toward national out-groups. We assume that similarity on two key dimensions of social perception is relevant for out-group-specific social preferences. First, stereotype content models (Fiske et al., 2002; Koch et al., 2016) propose that stereotypes (i.e., socially shared traits ascribed to groups) vary on the dimensions of agency, conservative/progressive beliefs, and communion (ABC). Communion is based on whether out-groups’ intentions are perceived as friendly. Agency is based on whether out-groups are perceived as being able to put their intentions into practice. Beliefs describe whether out-groups are perceived to hold conservative or progressive values (Fiske et al., 2002; Koch et al., 2016). Culturally shared stereotypes about (national) groups predict intergroup attitudes and behavior (Cuddy et al., 2008; Jenkins et al., 2018).
Second, the Hofstede model proposes six dimensions of cultural values: power distance, individualism/collectivism, masculinity/femininity, uncertainty avoidance, long-term orientation, and indulgence (Hofstede et al., 2010; Hofstede Insights, 2020). Perceptions of national out-groups on these dimensions describe which values are perceived to guide people’s daily lives. Similarities/differences between nations on the Hofstede dimensions predict decision making and other behaviors (Fiedler et al., 2018; Ng & Lim, 2019). Thus, both measures reflect social perceptions of national groups. Whereas the ABC stereotypes capture the extent to which national groups are associated with different traits (being friendly, competent, and conservative/progressive), the Hofstede dimensions reflect the extent to which participants perceive that different cultural values (e.g., individualism/collectivism, masculinity/femininity) shape daily life in the respective nations.
We expect similarity between the in-group and national out-groups on the ABC stereotypes and Hofstede cultural dimensions to predict social preferences toward individuals from different national out-groups. We investigate this prediction with participants from 10 nations. Participants rated their own and all other nations on the ABC stereotypes and the Hofstede cultural dimensions; we then computed differences in ratings for the nations and transformed them into similarity.
Previous research on the Hofstede dimensions aggregated individual responses to the national level (Hofstede Insights, 2020). However, individuals within nations likely differ in in-group and out-group perceptions on the cultural and stereotype dimensions and, thus, in their perceptions of similarity between nations. In a novel approach, we therefore measure perceived similarity with individual ratings of nations on the Hofstede dimensions. This measure makes investigations of the individual-level relationship between social perceptions and social preferences possible. To investigate the correspondence of the new and established measures, we report additional analyses with national-level values for the cultural dimensions (Hofstede Insights, 2020). We further use a recently developed multidimensional measure of cultural distance based on the World Values Survey beliefs as an additional measure of nation-level cultural similarity (Muthukrishna et al., 2020).
To reconcile the opposing predictions of social identity theory and self-categorization theory, we investigate the moderating role of group identification. Previous research showed that in-group identification predicts whether differentiation from out-groups (e.g., lower social preferences) occurs more strongly for similar or dissimilar out-groups. A meta-analysis (Jetten et al., 2004) showed that individuals strongly identified with the in-group differentiated the in-group from similar out-groups due to motivational processes according to social identity theory (i.e., reactive distinctiveness). In turn, individuals weakly identified with the in-group differentiated the in-group from dissimilar out-groups due to cognitive-perceptual processes according to self-categorization theory (i.e., reflective distinctiveness; Spears et al., 2002).
We test a set of preregistered, competing hypotheses. Based on social identity theory, one can expect that social preferences toward members of national out-groups decrease with similarity (Hypothesis 1a). Based on the self-categorization theory, one can alternatively expect that social preferences toward members of national out-groups increase with similarity (Hypothesis 1b). For high identifiers, we expect higher social preferences for dissimilar national out-groups (i.e., reactive distinctiveness). For low identifiers, we expect higher social preferences for similar national out-groups (i.e., reflective distinctiveness; Hypothesis 2).
Method
Participants and Procedure
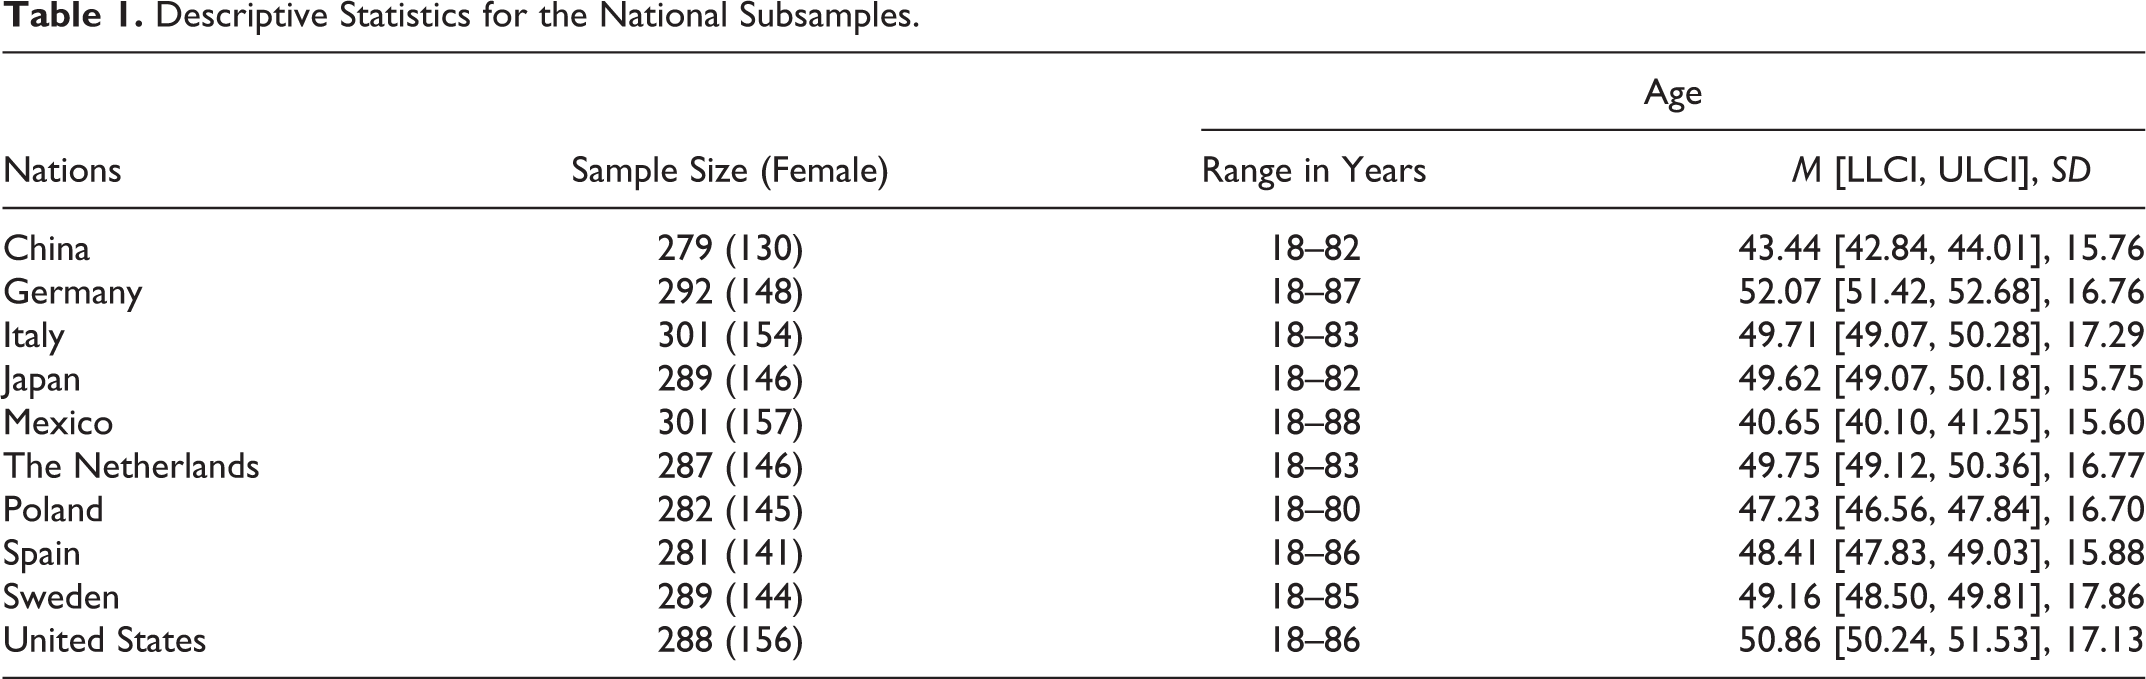
The study was approved by the research ethics committee of the University of Goettingen and was conducted according to American Psychological Association guidelines. The sampling procedure, materials, and hypotheses were preregistered (https://osf.io/ck9x4/). Data were collected by the online panel provider Toluna (https://de.toluna.com/). A total of 3,026 participants completed the questionnaire in September 2018. We excluded 127 participants according to the following preregistered criteria: participants who (a) did not complete the questionnaire, (b) did not enter a plausible participant code (i.e., the code consisted of a personal combination of four letters and three numbers, and participants were excluded if they entered less than three characters), or (c) selected a nation that did not correspond to the respective entry when registering with Toluna. For participants who participated twice, we deleted data from the second participation. In addition to these preregistered exclusion criteria, we controlled for gender and age in our analyses; therefore, one participant who indicated “other” as gender and eight participants who indicated an age > 100 were excluded. The final sample consisted of 2,889 participants (51% female, age between 18 and 88 years; M = 48.08, 95% CI = [47.88, 48.29], SD = 16.90) from 10 nations (i.e., China, Germany, Italy, Japan, Mexico, the Netherlands, Poland, Spain, Sweden, United States). Participants were recruited to be representative for national populations in terms of age and gender. National sample sizes and descriptive statistics are displayed in Table 1.
Descriptive Statistics for the National Subsamples.
Nations were selected based on the following criteria: (a) The panel from Toluna was sufficiently large (>50,000) to recruit the planned number of participants, (b) nations with a plurality of official languages were excluded, (c) nations were selected to differ with regard to the Hofstede cultural dimensions (Hofstede et al., 2010). For each dimension, we selected at least one nation with a high value (>66), one with a medium value (32 < x < 67), and one with a low value (<33). Details on sample planning can be found in the preregistration report.
As this project was conducted as a first measurement point of a superordinate project, the a priori sample size of N = 2,000 (N = 200 per nation) for the complete project was determined. Thus, we conducted a sensitivity analysis, which showed that with this sample size, small effects of f = .024 (r = .02) could be detected. For the sensitivity analysis, we used a repeated measures analysis of variance (1 − β = .95, 10 groups, 10 measurements, correlation among repeated measurements: r = .50) as the closest pragmatic approximation for the cluster-corrected regression analysis. Due to a potential dropout between Part 1 and Part 2 of the superordinate project, at least N = 285 participants per nation were invited to participate in Part 1.
Participants provided consent prior to study participation. They received a fixed payment based on regulations by the panel provider and had the opportunity to obtain a bonus payment on one randomly selected allocation task based on their decisions and/or decisions of another participant (ranging between US$0 and US$6). To ensure similar calculation efforts for all participants, payment was first calculated in the study’s currency “Talers” and converted into the respective national currencies so that participants from all nations had the same monetary incentives (for participants from the United States, the conversion rate was 100 Talers = 100 U.S. cents). For further details on the procedure, see Supplementary Materials S1.
Materials were translated from the original German version by professional translators. The English version was translated by the project team and corrected by the translators. In the second step, colleagues with high proficiency in one of the respective languages, a background in psychology, and fluent German or English skills checked the translations. If necessary, the professional translators implemented recommended changes. Finally, for each language, a native speaker tested the online survey and made additional changes if necessary. We report all measures, conditions, data exclusions, how we determined the sample size, and all studies conducted in this line of work. Materials in all languages can be found at https://osf.io/7ybns/.
Materials
Demographic variables included gender, age, nationality, country of birth, and income. Participants completed the standard slider measure of SVO (six primary items; Murphy et al., 2011) as a measure of general social preferences. In this measure, participants divided amounts of Talers (i.e., the experimental currency) between the self and an interaction partner (“the other person”). Participants indicated identification with their national in-group with two measures: a pictorial measure of the overlap between the self and the national in-group (Schubert & Otten, 2002) as well as we-ness (i.e., to which extent they would use the term “we” to characterize themselves and other persons from their nation on a scale of 1 = not at all to 7 = extremely; Cialdini et al., 1997). To measure social preferences toward interaction partners from the 10 different nations, we used an adapted version of the SVO slider with additional information about the nation the respective other person is from (e.g., “the other person from Germany”; Figure 1A). Participants received no information on the respective others apart from their nationality and completed the adapted SVO slider measure 10 times (once for each nation). For similarity based on the cultural dimensions suggested by Hofstede (Hofstede et al., 2010), values for the nations were retrieved from hofstede-insights.com/product/compare-countries/. Values for cultural beliefs (Muthukrishna et al., 2020) were retrieved from culturaldistance.org. Moreover, to measure participants’ subjective ratings of the nations on the cultural dimensions by Hofstede, they rated all national groups on the different Hofstede dimensions using a slider bar ranging from 0 (very low) to 100 (very high). Participants were provided with brief explanations of the dimensions (adapted from https://www.hofstede-insights.com/models/national-culture/). As an alternative measure of similarity, they rated all nations on the ABC dimensions of agency, conservative-progressive beliefs, and communion (Koch et al., 2016). Participants were presented in counterbalanced order with (a) the adapted versions of the SVO slider measure, (b) Hofstede ratings on cultural similarity, and (c) ABC ratings on all participating nations (nation order randomized). The materials also included an attention check (“to show us that you have carefully read the instructions, please mark all options below”).
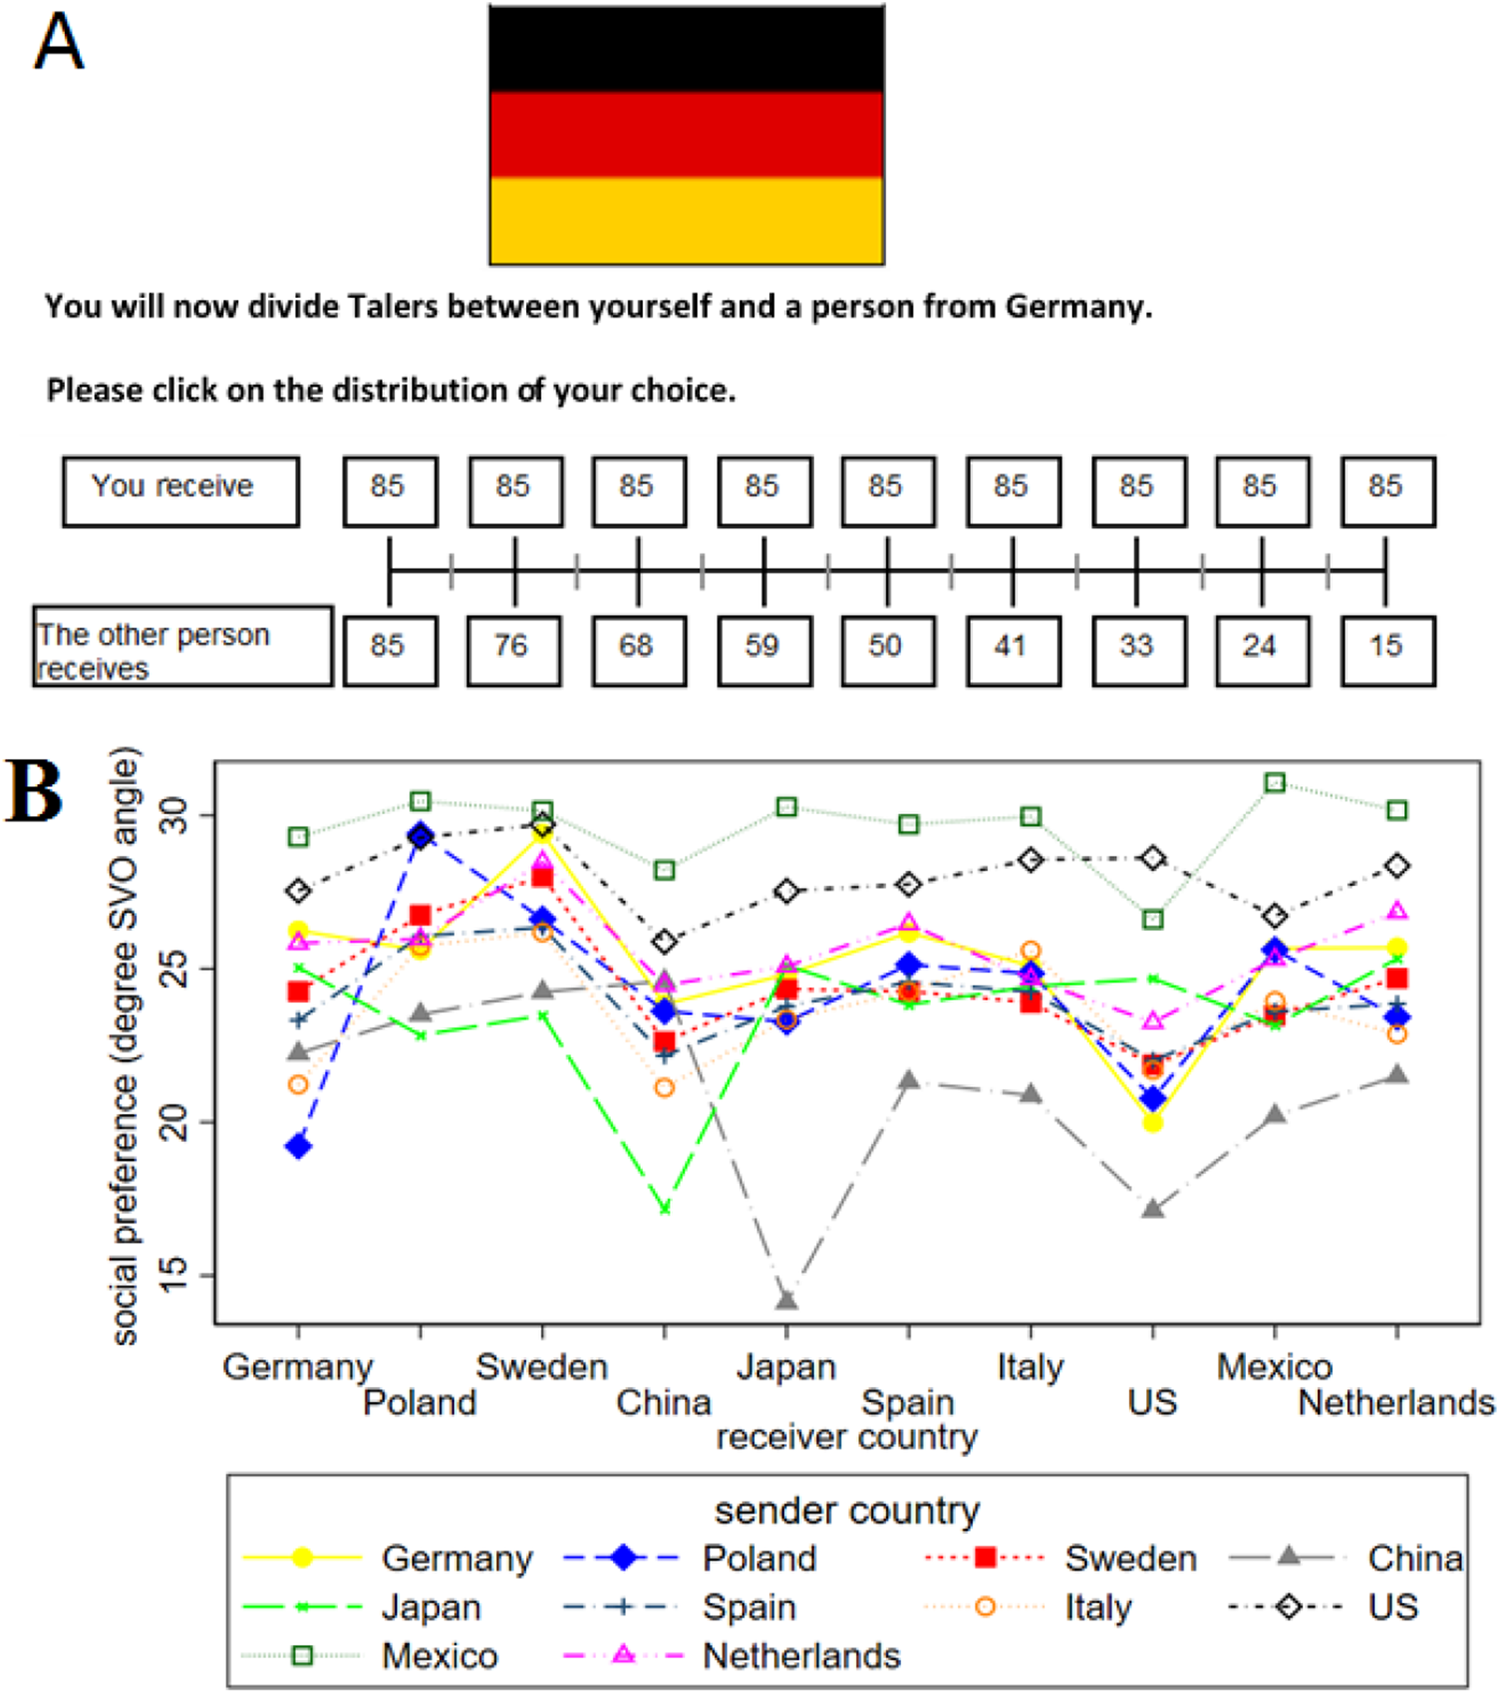
Panel A: Example item of nation-specific SVO slider for Germany. Panel B: Social preferences for nation dyads.
Results
For the dependent variable of out-group-specific social preferences, we calculated SVO angles from the nation-specific SVO slider measures for all 10 nations. Because our main goal was to show differences in social preferences toward various national out-groups, we excluded ratings for the national in-group. Mean responses from the payoff allocations to the self and the other person for the six items were computed, then 50 was subtracted from these mean allocations to shift the base of the angle to the center of the circle. Then, the inverse tangent between the ratio of allocations to the other and the self was computed, and the formula is given as follows (Murphy et al., 2011):
Results showed that out-group-specific social preferences varied substantially between nation dyads (Figure 1B). For example, German participants, on average, showed prosocial orientations (i.e., maximization of joint payoff) toward Swedes (mean angle: 29°) and individualistic orientations (i.e., maximization of payoff to self) toward U.S. Americans (mean angle: 20°). These effects were not only due to overall levels of social preferences of participants from particular nations but also rather varied for different national out-groups. For example, 9% of German participants had competitive orientations (they were willing to reduce their own payoff in order to reduce the other person’s payoff even more) toward U.S. Americans, whereas only 2% showed competitive orientations toward Swedes. Descriptive statistics for SVO angles and similarity for all nations can be found in the Supplementary Materials Table S2.
To test our hypotheses and investigate the factors driving these systematic differences in out-group-specific social preferences, we calculated similarity scores for the two multidimensional measures (i.e., Hofstede dimensions; ABC stereotypes) by computing Euclidean distances between two nations (e.g., for ABC stereotypes:
To test Hypothesis 1a/b, we conducted ordinary least squares (OLS) regressions with out-group-specific SVO angle as the outcome and similarity (Hofstede dimensions and ABC stereotypes) as predictors. Social preferences toward the national in-group were excluded from the analyses. As the difference in wealth between two nations and national background have been shown to predict social preferences due to inequality aversion, we included differences between nations in gross domestic products (per capita in international dollars) and sender nation dummies as covariates (Dorrough & Glöckner, 2016). We additionally controlled for age (Martinsson et al., 2011) and gender (van Lange, 1999), as both have been shown to predict social preferences. Furthermore, we controlled for general SVO and for whether participants passed an attention check (87% passed). Because the geographical location of nations might covary with cultural similarity, we additionally controlled for spatial distance between the centroids of each pair of nations in the analyses. This covariate was not preregistered and included based on suggestions from a reviewer; results are similar without controlling for spatial distance. To account for the repeated measurement and resulting correlations in error terms, we clustered standard errors at the individual level. To show that results were not driven by overall social preferences toward certain national groups, we included receiver nation dummies instead of the sender nation dummies in additional analyses. Results were consistent with the findings reported below and can be found on the OSF.
Regression Results
Model 1 included participants’ ratings of similarity according to the Hofstede dimensions, whereas Model 2 included similarity according to the ABC stereotypes. Results are displayed in Table 2. In Model 1, out-group-specific social preferences were not significantly predicted by similarity on the Hofstede dimensions (Figure 2, left). However, Model 2 showed the expected results for similarity according to the ABC stereotypes (Figure 2, right). In line with Hypothesis 1b (reflective distinctiveness), higher similarity predicted higher out-group-specific social preferences—above and beyond general SVO and demographic covariates. Results for the ABC stereotypes were robust when excluding all covariates. We also investigated the contributions of the separate stereotype dimensions of agency, conservative-progressive beliefs, and communion by including similarity ratings on the dimensions as separate predictors in two additional regression models. Because agency includes socioeconomic success, we excluded gross domestic product difference as a control variable in these models. Results of ABC similarity were mainly driven by similarity on the communion dimension (see Supplementary Materials Table S4). These results also hold when controlling for absolute ratings of interaction partners on communion.
Similarity Predicts Out-Group-Specific Social Preferences.
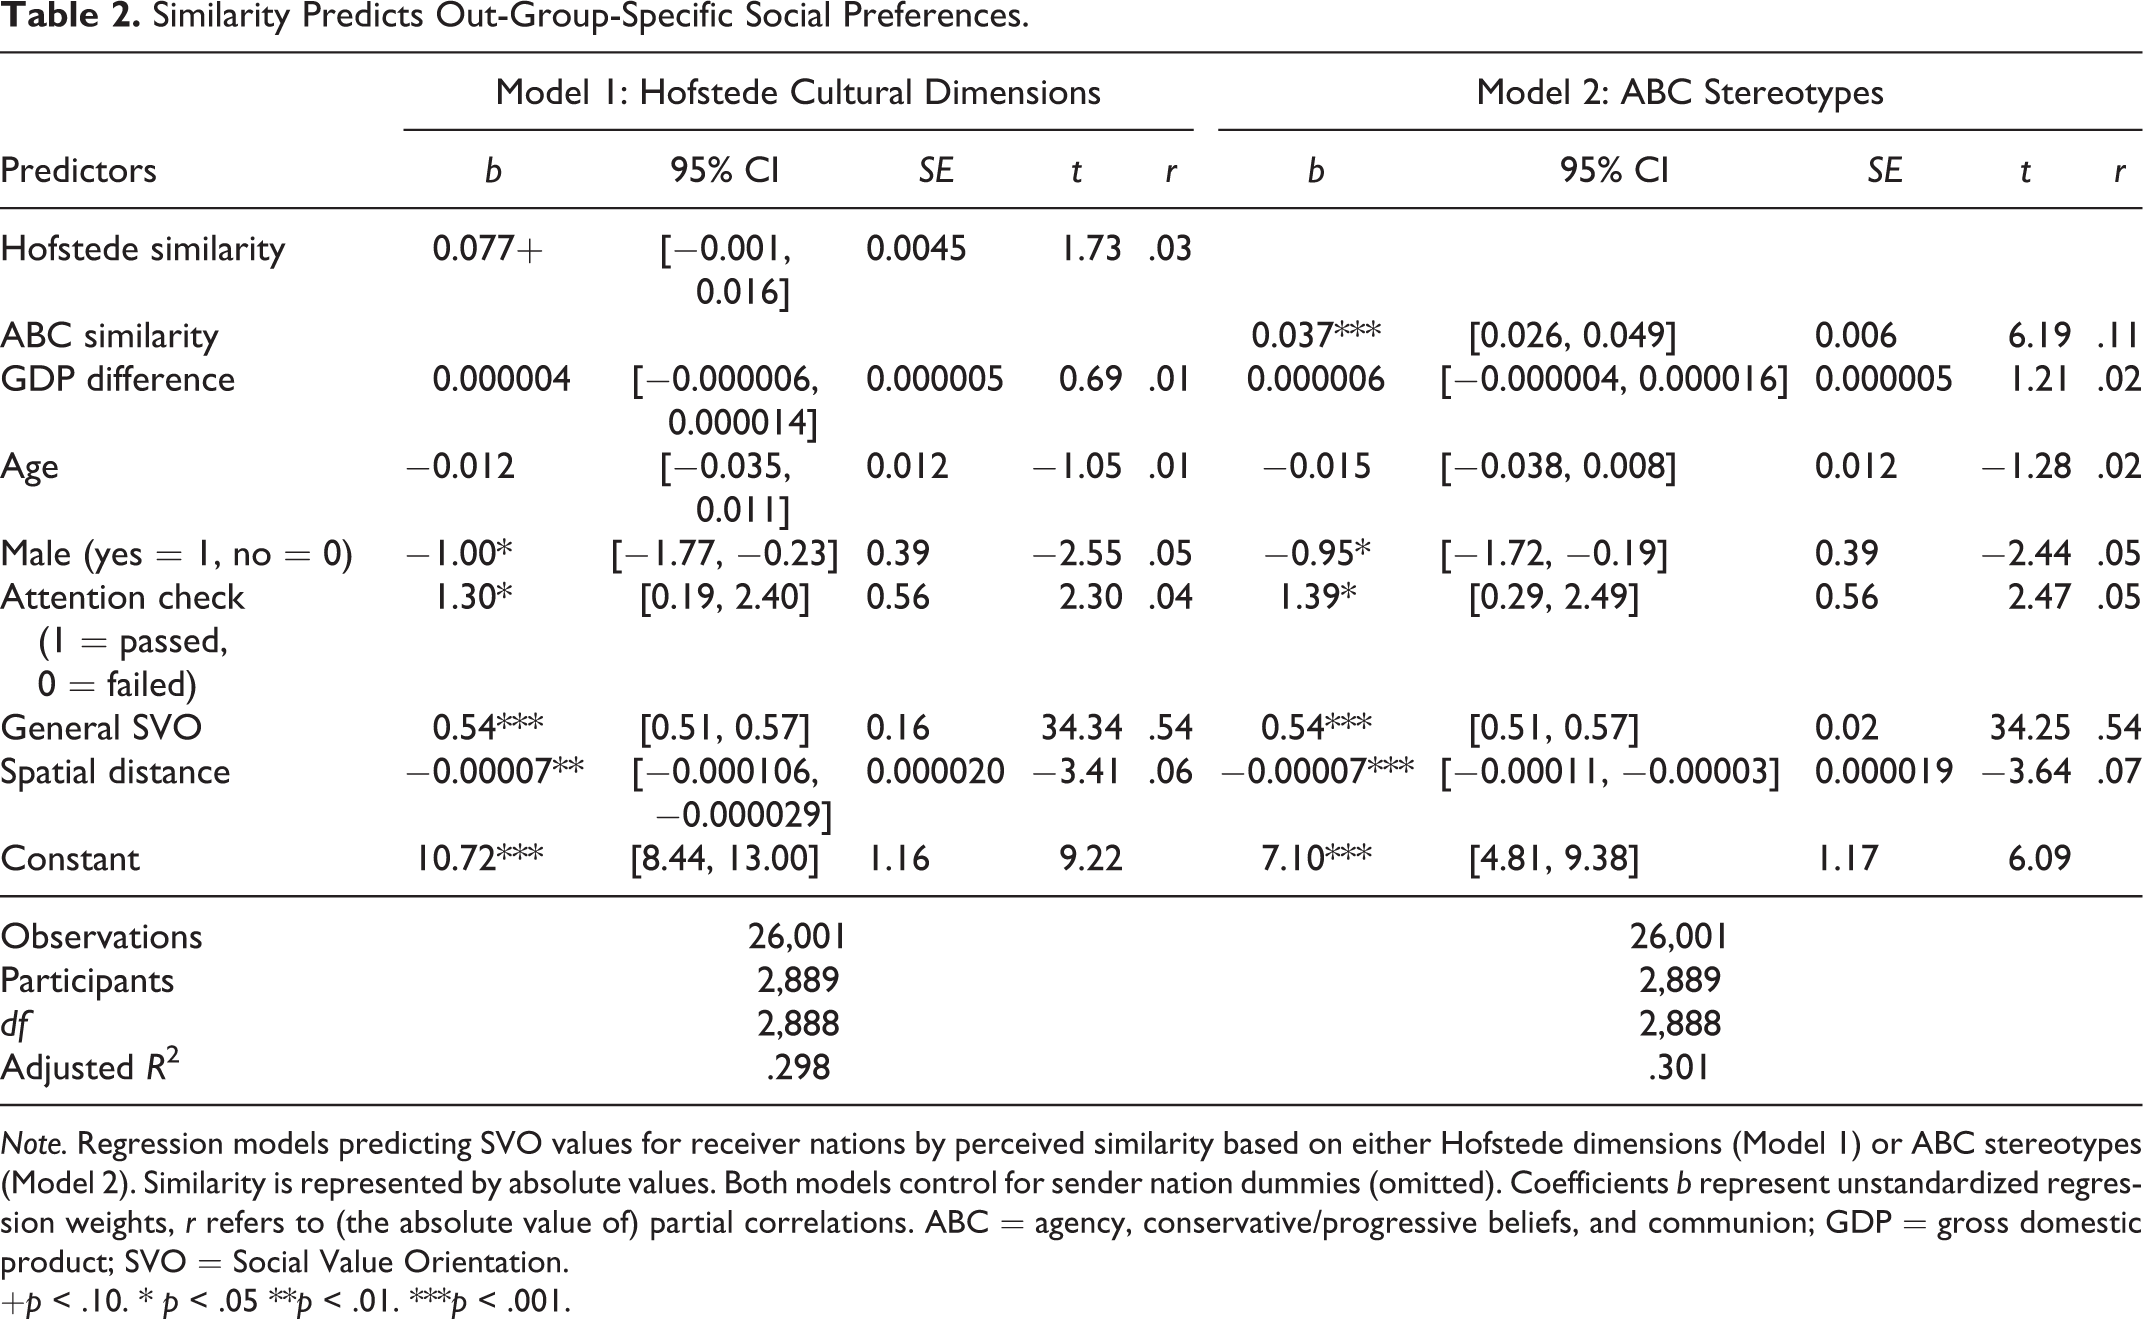
Note. Regression models predicting SVO values for receiver nations by perceived similarity based on either Hofstede dimensions (Model 1) or ABC stereotypes (Model 2). Similarity is represented by absolute values. Both models control for sender nation dummies (omitted). Coefficients b represent unstandardized regression weights, r refers to (the absolute value of) partial correlations. ABC = agency, conservative/progressive beliefs, and communion; GDP = gross domestic product; SVO = Social Value Orientation.
+p < .10. * p < .05 **p < .01. ***p < .001.
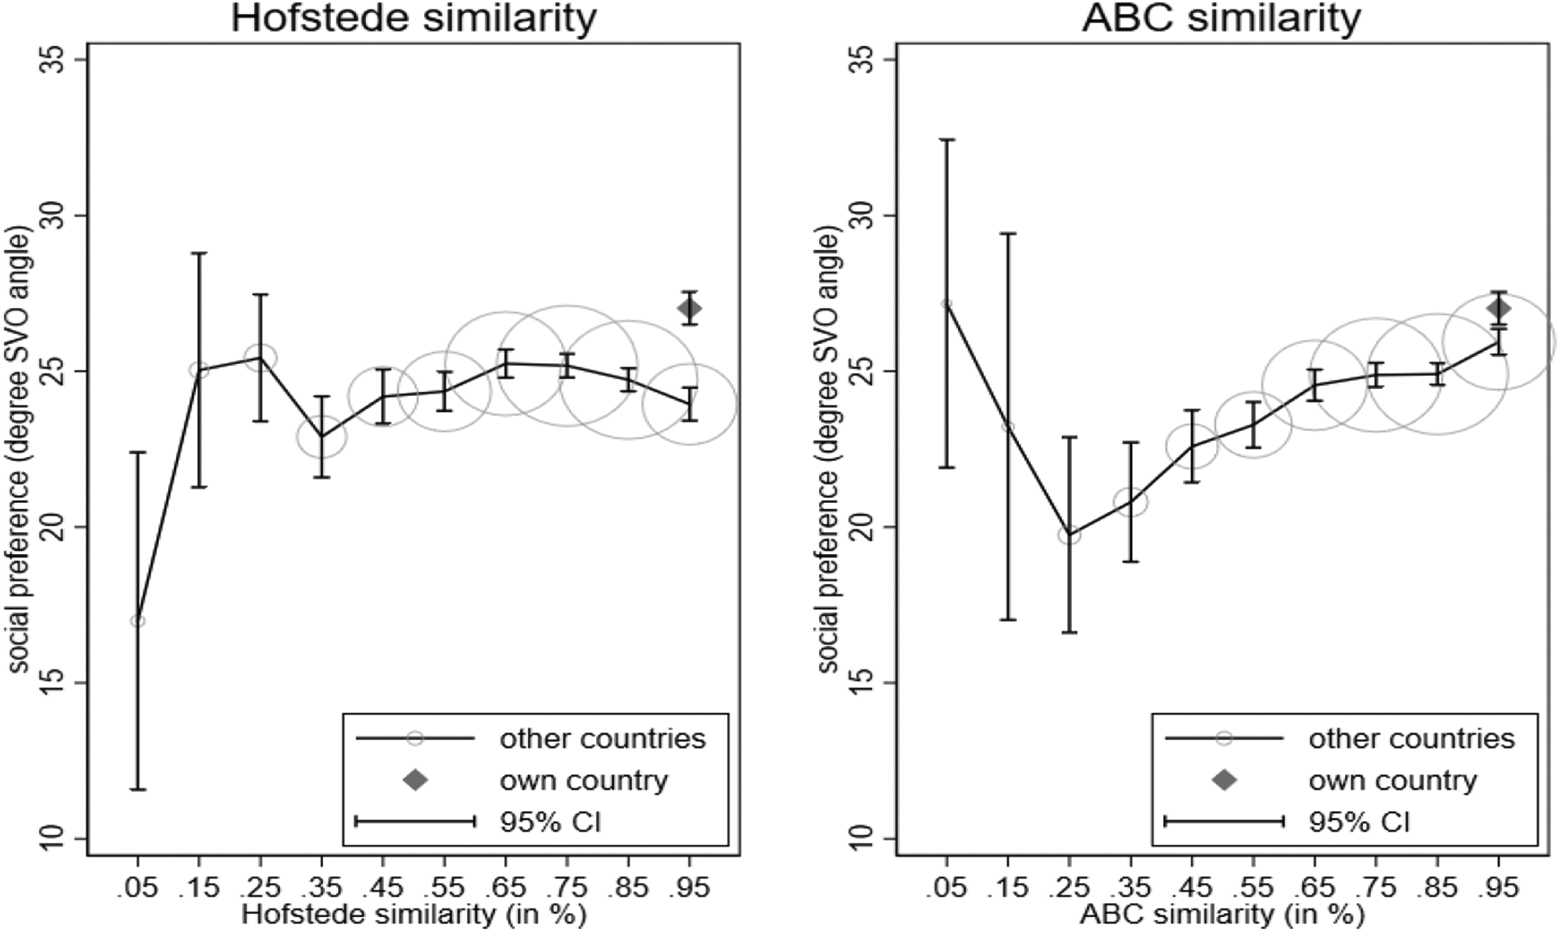
Social preferences predicted by similarity. Left: Hofstede; right: ABC stereotypes. Note. Percentage bins on the x-axis with mean value label. Circle diameters indicate sample size per bin (in each of the lowest three bins, less than 1% of the sample is represented).
Moderation by Group Identification
To test Hypothesis 2, we investigated identification with the national in-group as a moderator of the relationship between similarity and out-group-specific social preferences (Figure 3). Again, we conducted OLS regressions with clustered standard errors. Models 1 and 2 were rerun with similarity (Model 3: Hofstede dimensions; Model 4: ABC stereotypes), in-group identification (Schubert & Otten, 2002), and their interaction (both variables grand mean-centered) as predictors and the same control variables. Results are displayed in Table 3.
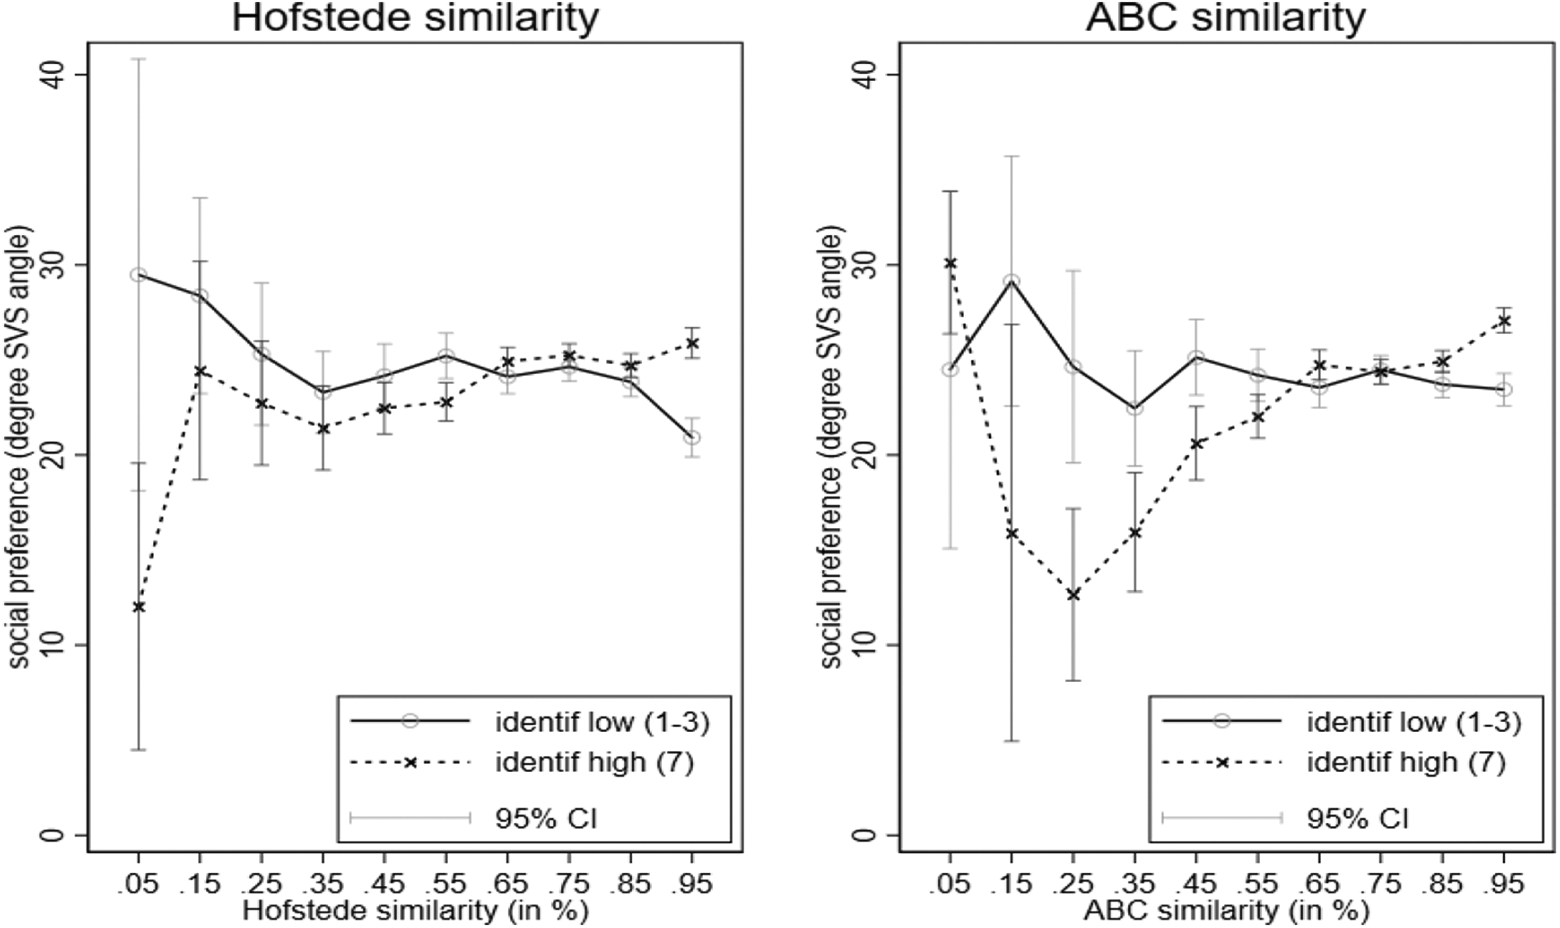
Social preferences predicted by similarity and in-group identification. Left: Hofstede, right: ABC stereotypes, for high and low identifiers.
Similarity Predicts Out-Group-Specific Social Preferences Moderated by In-Group Identification.
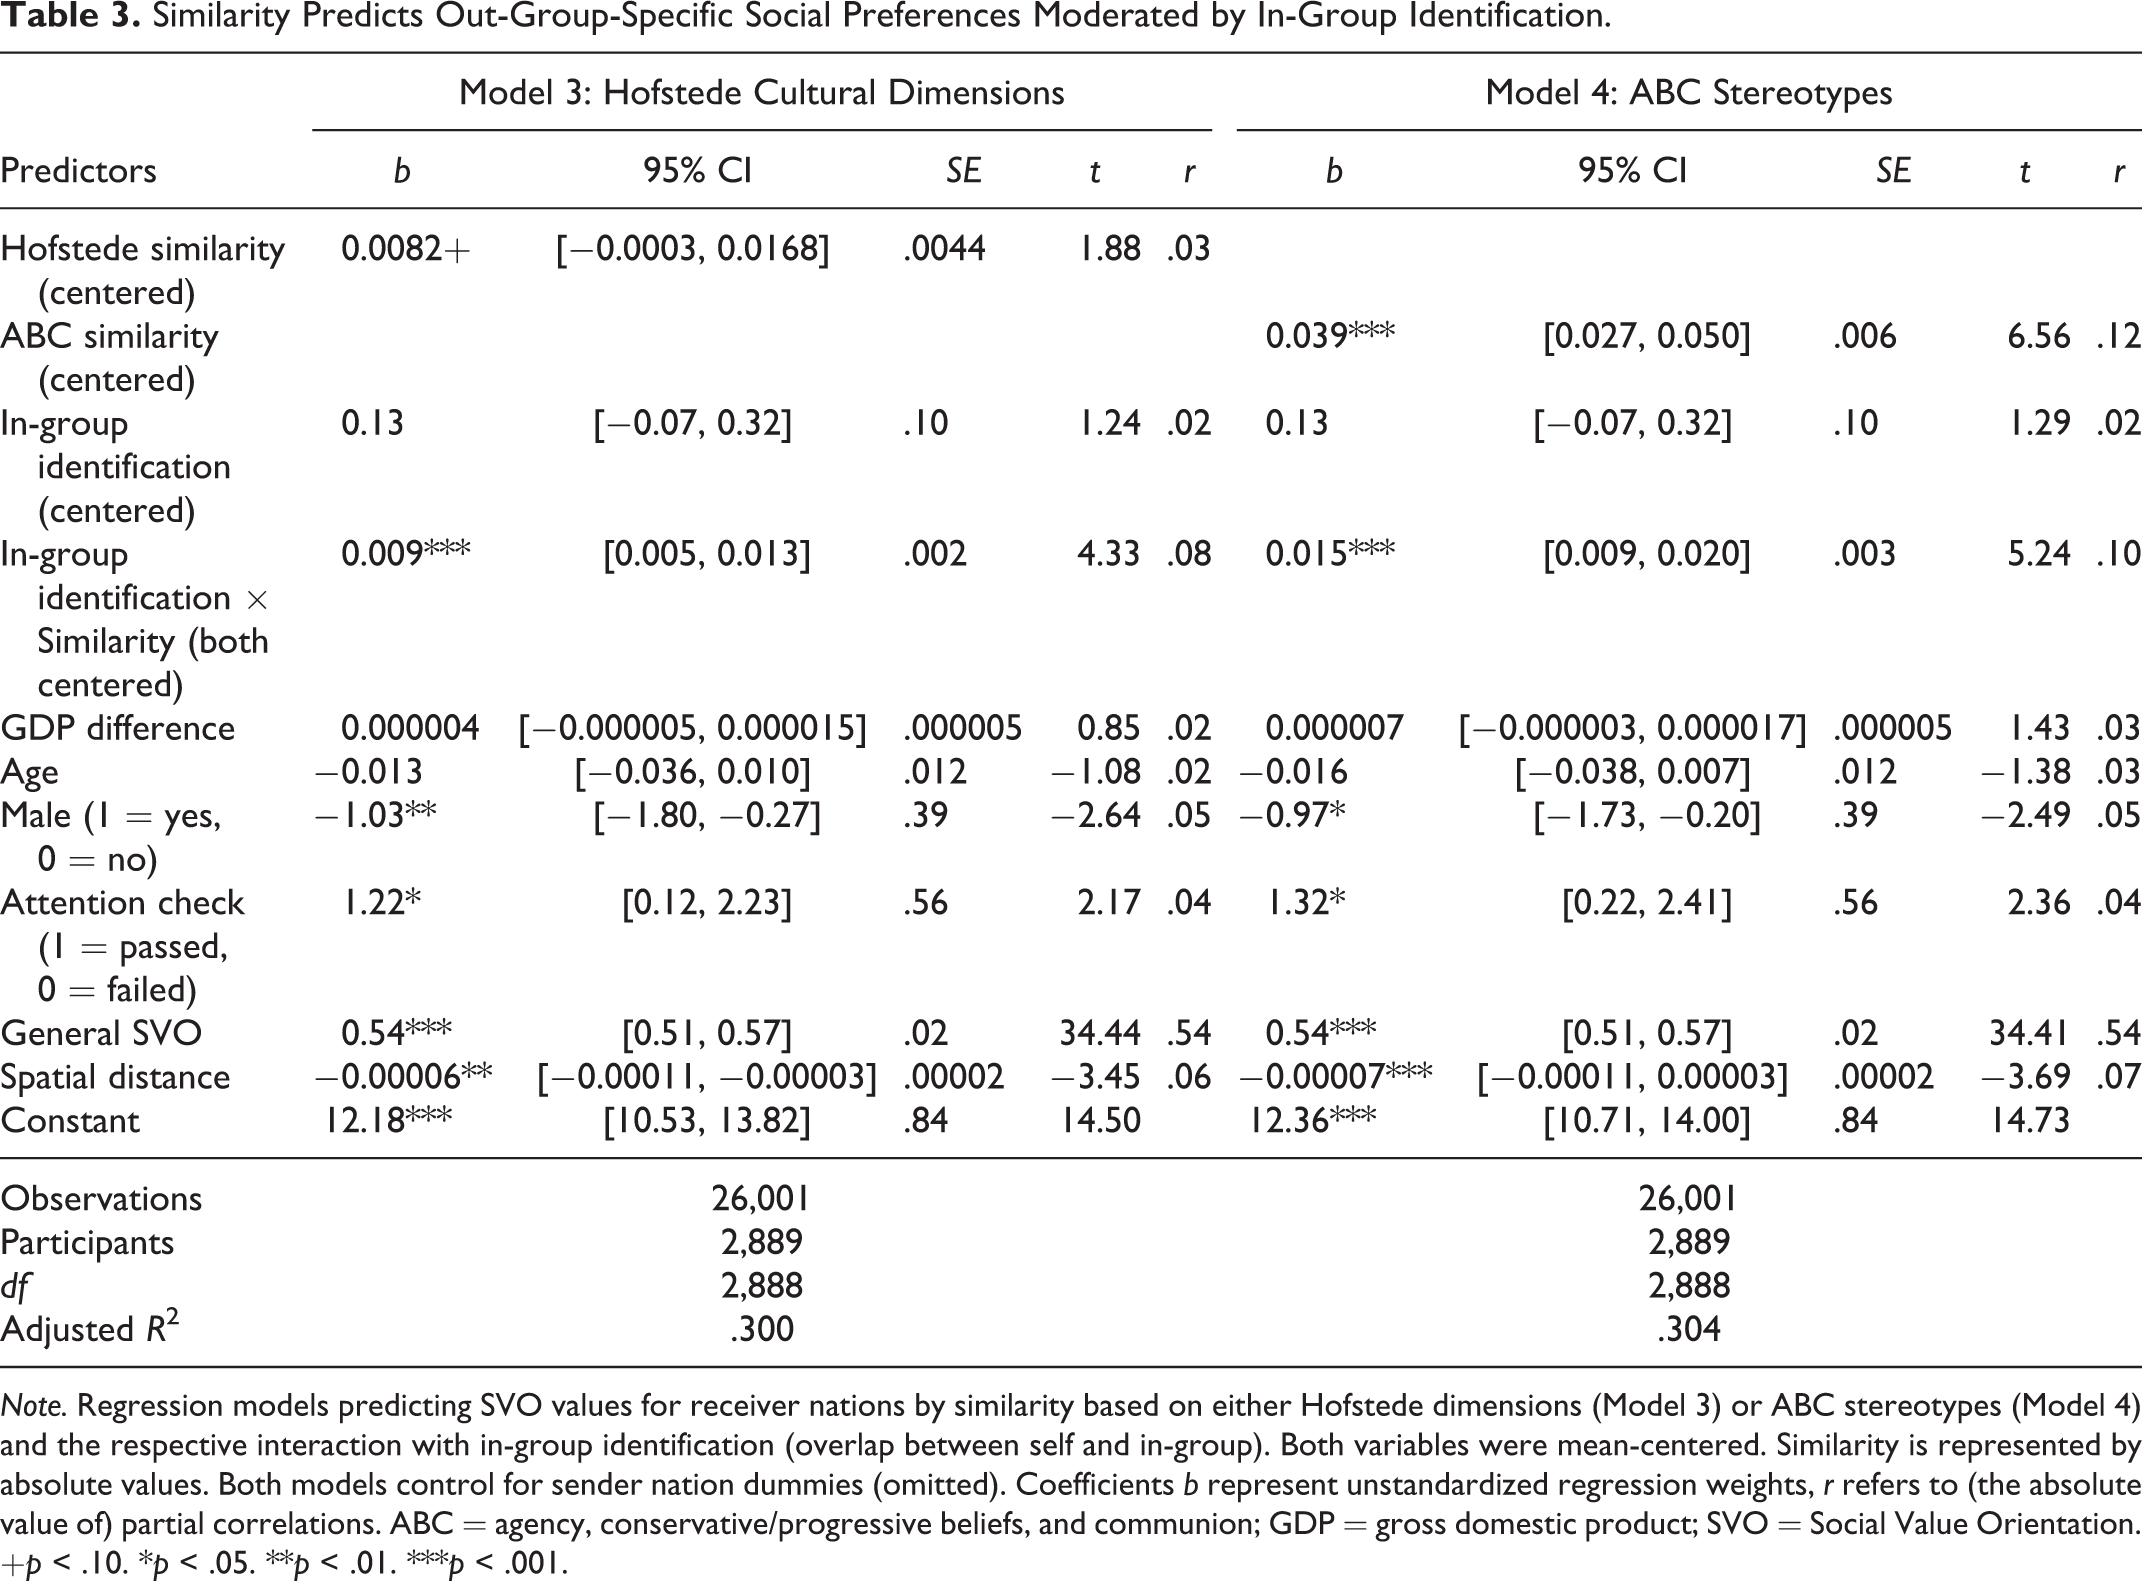
Note. Regression models predicting SVO values for receiver nations by similarity based on either Hofstede dimensions (Model 3) or ABC stereotypes (Model 4) and the respective interaction with in-group identification (overlap between self and in-group). Both variables were mean-centered. Similarity is represented by absolute values. Both models control for sender nation dummies (omitted). Coefficients b represent unstandardized regression weights, r refers to (the absolute value of) partial correlations. ABC = agency, conservative/progressive beliefs, and communion; GDP = gross domestic product; SVO = Social Value Orientation.
+p < .10. *p < .05. **p < .01. ***p < .001.
The interaction of similarity and in-group identification was significant in both cases. Simple slopes analyses showed reflective distinctiveness for high identifiers: The higher the similarity, the higher the out-group-specific social preferences, Hofstede similarity: b = 0.070; 95% CI = [0.039, 0.100], t(2,888) = 4.48, p < .001; ABC similarity: b = 0.121, 95% CI = [0.093, 0.149], t(2,888) = 8.56, p < .001. For low identifiers, the relationship was nonsignificant, Hofstede similarity: b = −0.019; 95% CI = [−0.050, 0.011], t(2,888) = −1.25, p = .212; ABC similarity: b = 0.025, 95% CI = [−.002, .054], t(2,888) = 1.76, p = .078. Simple slopes for the interaction of in-group identification with the communion subdimension of ABC stereotypes showed corresponding results, high identifiers: b = 0.146; 95% CI = [0.119, 0.173], t(2,888) = 10.70, p <. 001; low identifiers: b = 0.047; 95% CI = [0.020, 0.074], t(2,888) = 3.42, p = .001. Additional models with an alternative measure of in-group identification (Cialdini et al., 1997) also showed similar patterns (see Supplementary Materials Table S4).
National-Level Similarity Scores
In an exploratory analysis, we investigated correspondence between the national-level scores from the Hofstede website and the individual Hofstede scores rated by the participants in our sample. In a regression model with clustered standard errors and including sender nation dummies, the national-level Hofstede scores significantly predicted the individual Hofstede scores, b = 0.60, 95% CI = [0.59, 0.62], t(2,888) = 96.48, p < .001. We conducted exploratory regression models with nation-level scores from the Hofstede website (Hofstede Insights, 2020) as well as from Muthukrishna et al. (2020) as measures of cultural similarity and out-group-specific social preferences as the outcome including all covariates. Results showed that similarity according to the nation-level Hofstede scores did not significantly predict out-group-specific social preferences, and in-group identification did not moderate these results (Table 4). In contrast, the Muthukrishna et al. similarity scores significantly predicted out-group-specific social preferences, but the moderation by in-group identification was nonsignificant (Table 5).
Nation-Level Hofstede Scores Predict Out-Group-Specific Social Preferences (Model 5) Moderated by Group Identification (Model 6).
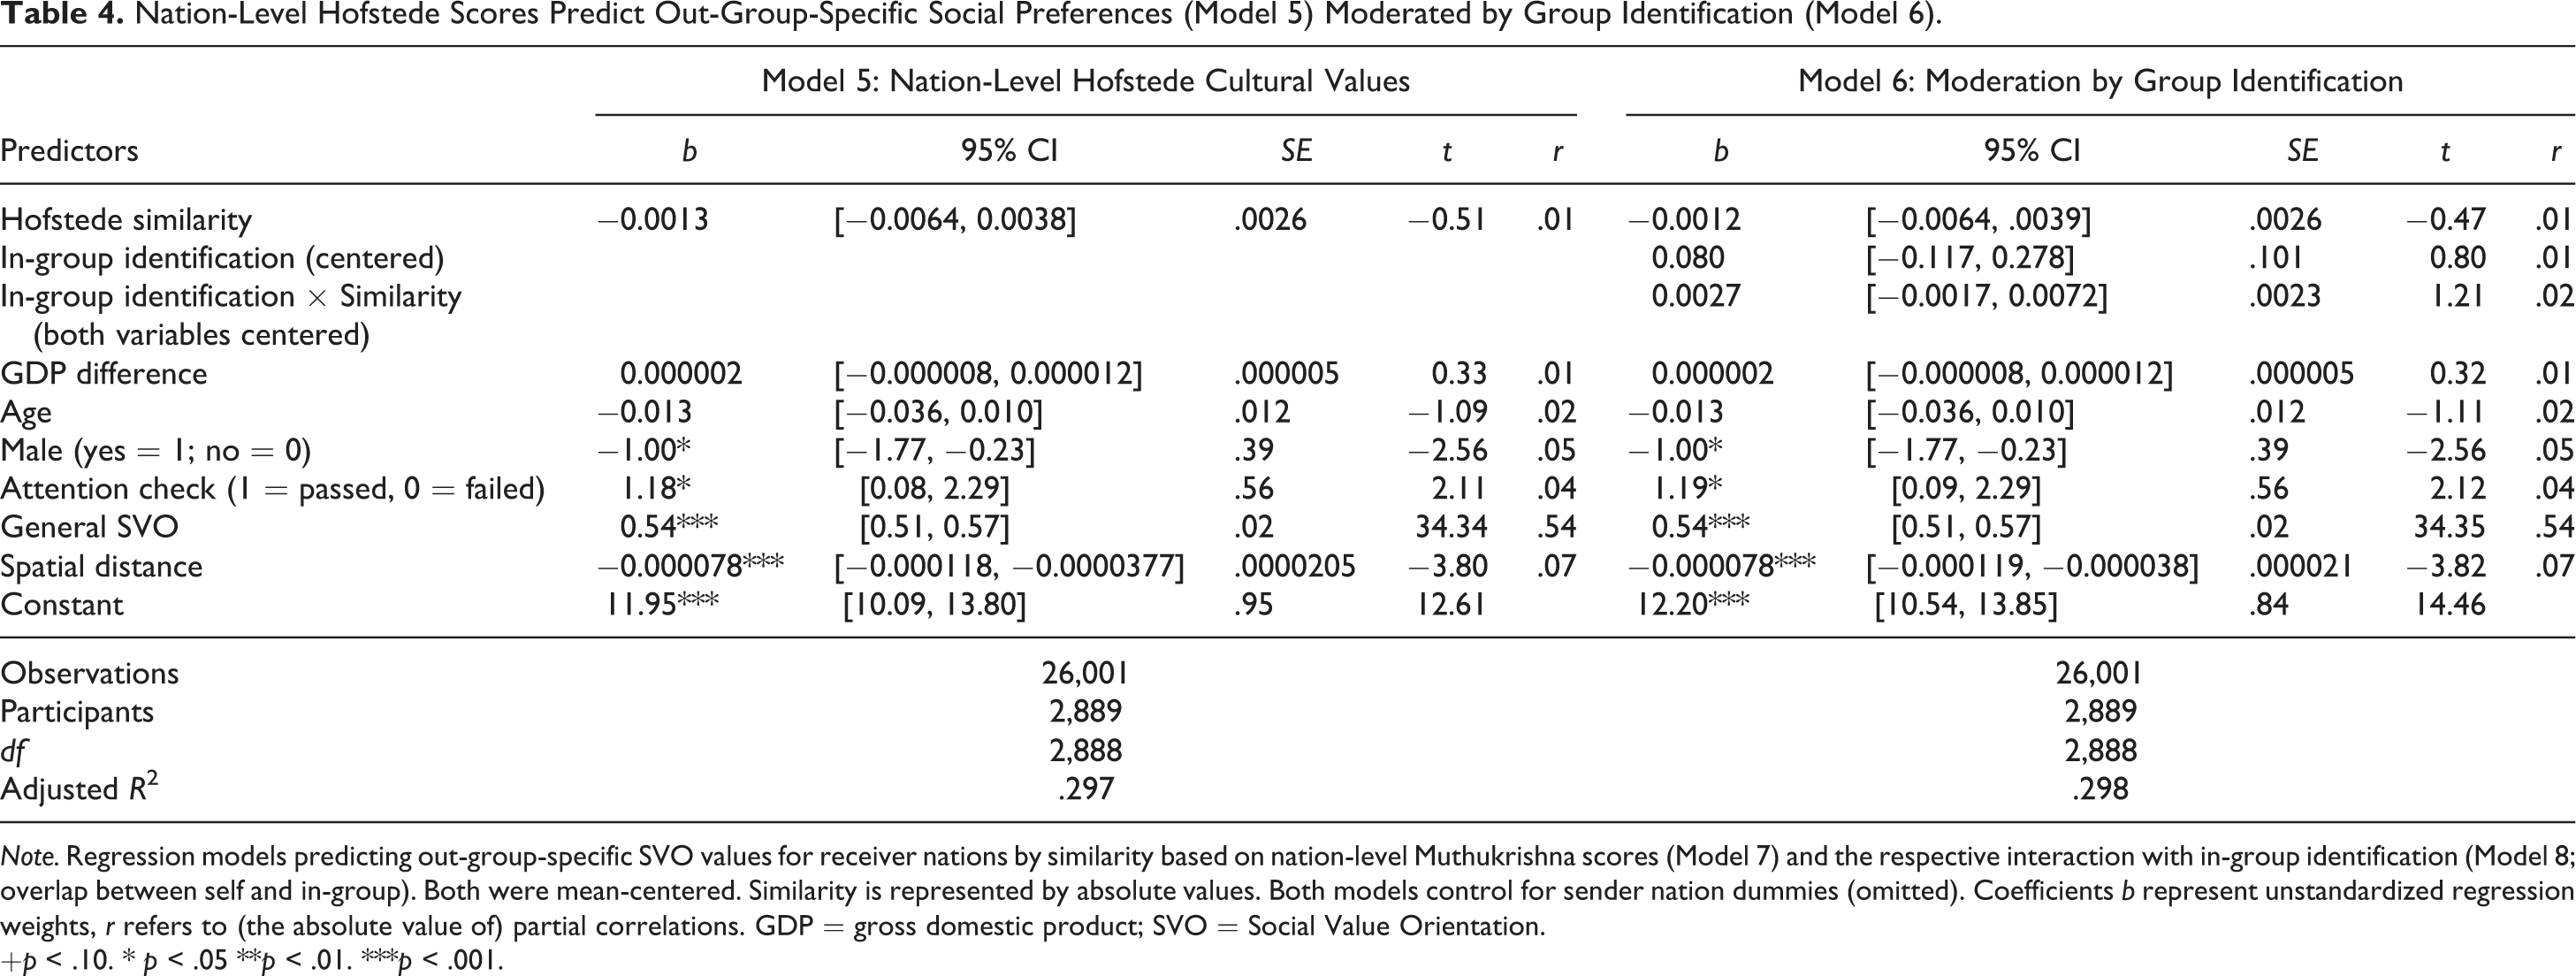
Note. Regression models predicting out-group-specific SVO values for receiver nations by similarity based on nation-level Muthukrishna scores (Model 7) and the respective interaction with in-group identification (Model 8; overlap between self and in-group). Both were mean-centered. Similarity is represented by absolute values. Both models control for sender nation dummies (omitted). Coefficients b represent unstandardized regression weights, r refers to (the absolute value of) partial correlations. GDP = gross domestic product; SVO = Social Value Orientation.
+p < .10. * p < .05 **p < .01. ***p < .001.
Nation-Level Similarity Scores According to Muthukrishna et al. (2020) Predict Out-Group-Specific Social Preferences (Model 7) Moderated by Group Identification (Model 8).
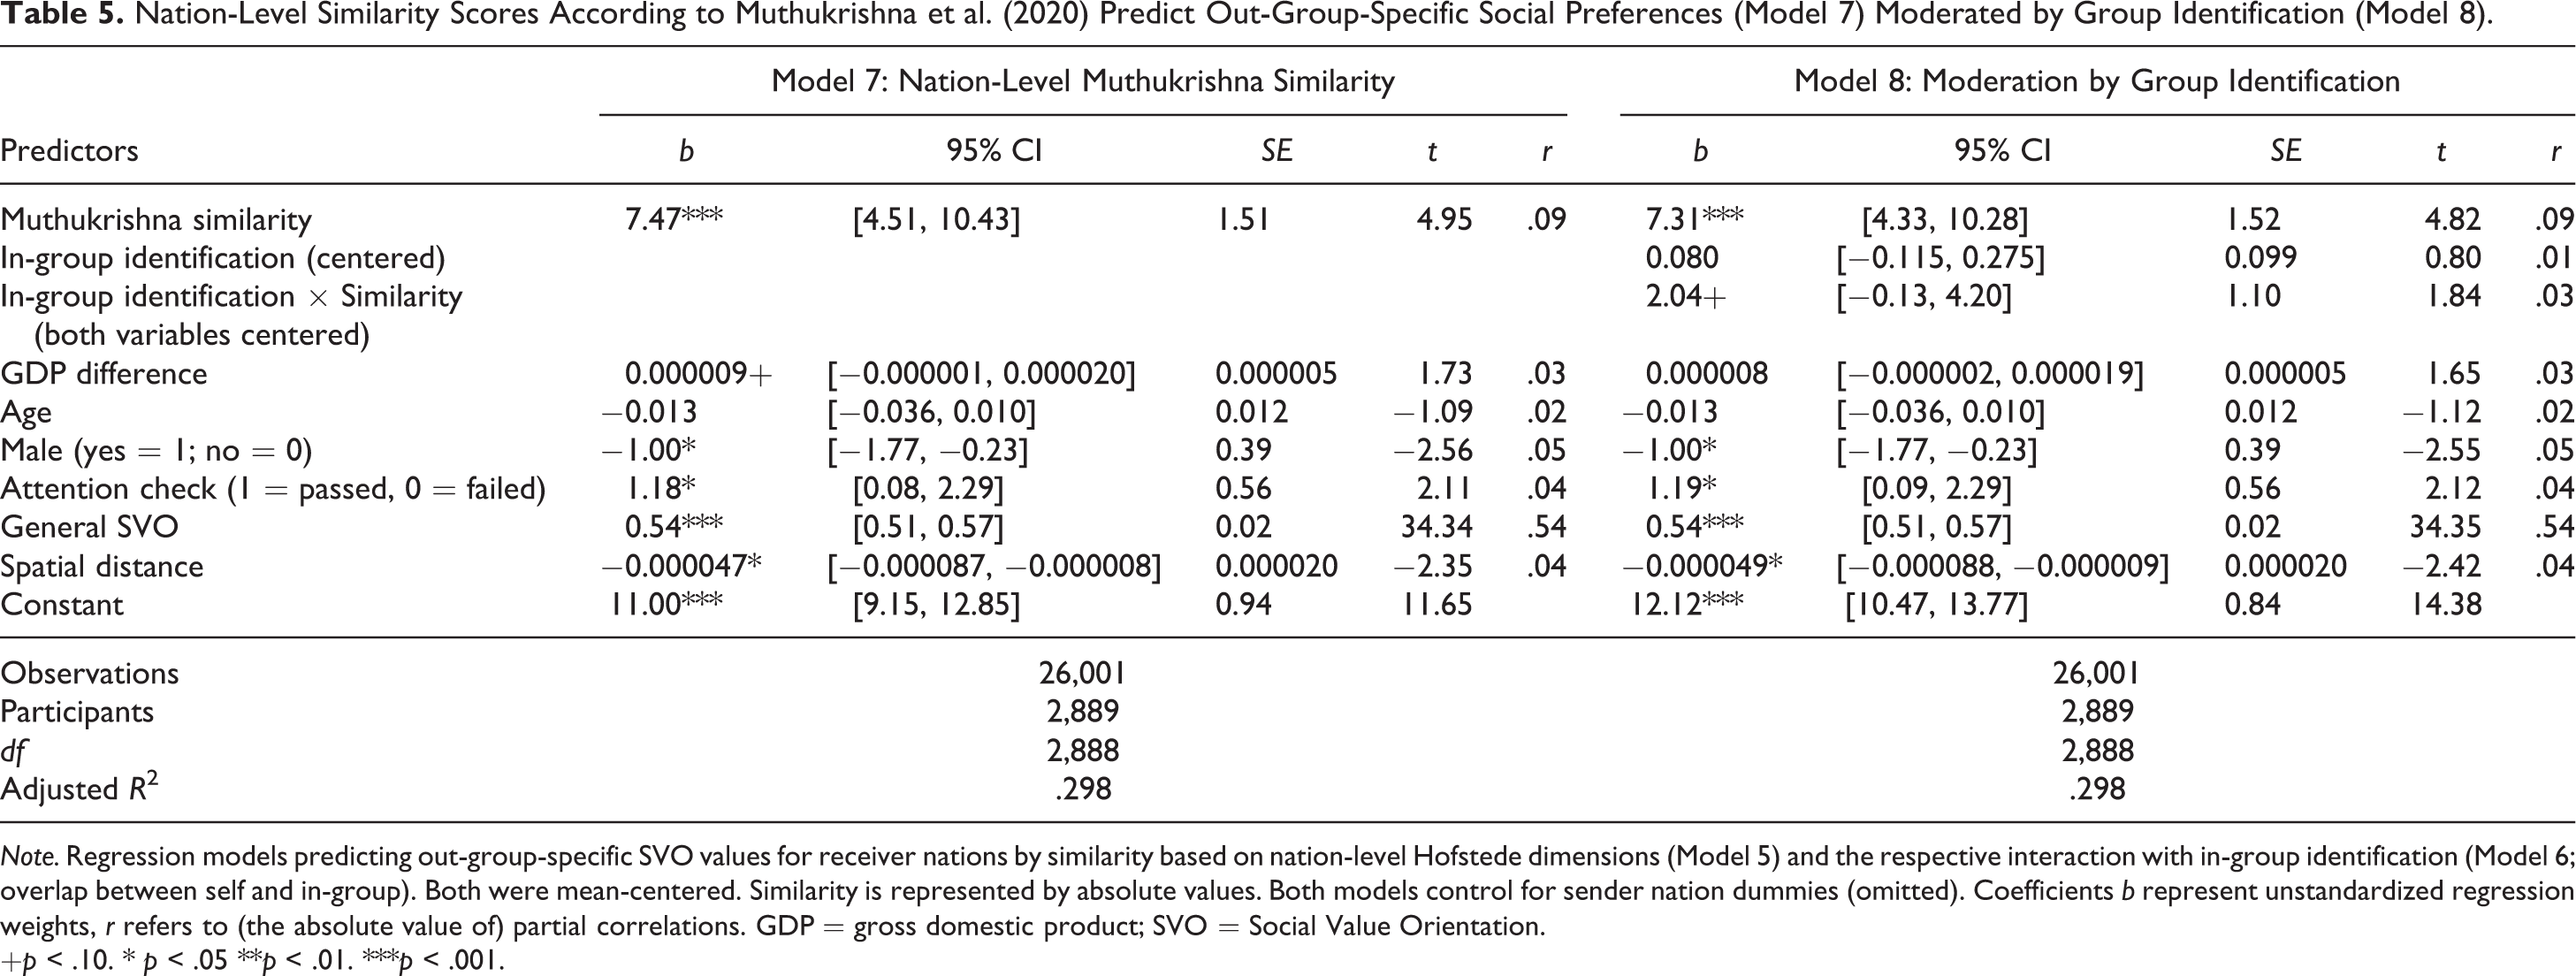
Note. Regression models predicting out-group-specific SVO values for receiver nations by similarity based on nation-level Hofstede dimensions (Model 5) and the respective interaction with in-group identification (Model 6; overlap between self and in-group). Both were mean-centered. Similarity is represented by absolute values. Both models control for sender nation dummies (omitted). Coefficients b represent unstandardized regression weights, r refers to (the absolute value of) partial correlations. GDP = gross domestic product; SVO = Social Value Orientation.
+p < .10. * p < .05 **p < .01. ***p < .001.
Discussion
Many societies are multicultural and participate in international networks. Therefore, individuals from different nations frequently interact with each other. Prosociality is a basis for positive intergroup relations. The current study showed that social preferences (i.e., in how far the other person’s well-being is considered in allocation decisions) toward individuals from different nations depend on perceptions of these nations on cultural and stereotype dimensions. Social preferences were higher toward individuals from similar compared to dissimilar nations. Stereotype similarity was more central to social preferences than cultural values similarity. Stereotype similarity predicted social preferences over and above nation differences, demographic variables, and general social preferences.
We tested competing hypotheses, and findings supported reflective distinctiveness (Spears et al., 2002) in line with self-categorization theory (Turner et al., 1987) rather than reactive distinctiveness based on social identity theory (Tajfel & Turner, 1986). Higher social preferences for members of similar out-groups might therefore trace back to dissimilar out-groups being perceived as clearly distinctive (Turner et al., 1987).
Findings are in line with the group-level theory of helping and altruism (Stürmer & Siem, 2017), which describes dyadic helping within and across groups and showed that individuals are more inclined toward helping culturally similar out-group members. Helping members of similar out-groups was based on empathic concerns, whereas helping members of dissimilar out-groups occurred when high rewards and low costs of helping were perceived (Stürmer & Siem, 2017). Cost-benefit analyses might have been less relevant in the current study’s one-time decisions on social preferences, reducing social preferences toward members of dissimilar nations.
The positive relation of similarity and out-group-specific social preferences was more pronounced for high identifiers than for low identifiers. This is in contrast with findings by Jetten and colleagues (2004) where high identifiers showed reactive distinctiveness and low identifiers showed reflective distinctiveness. One explanation for these divergent findings might be that in the current study, distinctiveness on the comparison dimension (i.e., national group membership) was not sufficiently relevant to threaten participants’ social identities (Tajfel & Turner, 1986) and elicit differentiation from similar out-groups (Jetten et al., 2001). Participants were reminded about their interaction partners’ nationality (e.g., flags displayed, Figure 1A); however, they might not have perceived the cross-national context as a relevant comparison dimension. Face-to-face interactions might increase the relevance of the intergroup context to the individuals’ social identity and thus trigger reactive distinctiveness.
In a novel approach, in addition to using nation-level Hofstede scores (Hofstede Insights, 2020), we measured cultural similarity based on participants’ individual ratings of nations on the Hofstede dimensions. This increases statistical power to detect effects due to the larger number of observations for individuals than nations. It also allows taking into account that cultural values of individuals within nations vary extensively (R. Fischer & Schwartz, 2011). Measuring both similarity and social preferences at the individual level avoids the ecological fallacy (i.e., invalid extrapolation from nation-level to individual-level relationships; Smith et al., 2013). Still, individual-level perceptions of Hofstede values were strongly related to nation-level Hofstede scores, providing some convergent validity and indication of accuracy for the assessments of nations’ cultural values (Jussim et al., 2015). Whereas nation-level cultural similarity according to the Hofstede values did not predict out-group-specific social preferences, values based on the recently developed measure of cultural distance (Muthukrishna et al., 2020) positively predicted out-group-specific social preferences. However, both nation-level measures did not interact with group identification (measured at the individual level), underlining the importance of taking into account individual-level measures.
Measuring cultural similarity on the individual level might—together with other differences concerning dependent measures, design features, and the partially low number of countries in earlier work—contribute to the divergent results compared to previous studies. These studies showed evidence for social identity theory processes in multinational cooperation in that individuals tended to be less prosocial toward more similar nations based on nation-level measures. Dorrough and Glöckner (2016) found (unexpectedly) that individuals’ tendency to cooperate more than implied by their expectations about others’ cooperativeness decreased with cultural similarity. Fiedler et al. (2018) showed that in-group favoritism in terms of prosocial giving increased with decreasing cultural distance toward the out-group. In contrast to these studies using nation-level Hofstede scores as measures of cultural similarity/distance and somewhat different dependent variables, we found a null effect for nation-level Hofstede scores. More importantly, we found an (opposing) positive relation for the improved nation-level scores (Muthukrishna et al., 2020) and for our core measure of individual-level similarity (Hofstede and ABC stereotypes). It should be noted that Fiedler et al. (2018) used only five nations that were selected to involve aspects of rivalry (Latin American nations and the United States).
ABC stereotype similarity was the strongest predictor of out-group-specific social preferences, whereas similarity of cultural values was a weaker (sometimes nonsignificant) predictor. This is in line with research showing that stereotypes predict human behavior toward members of different social groups (Jenkins et al., 2018). Stereotypes about national groups might be more proximal to social preferences, as they are concerned with intergroup relations and status hierarchies (e.g., Cuddy et al., 2008). In line with previous research (Cuddy et al., 2008), communion was the strongest predictor of out-group-specific social preferences. In contrast, cultural values might be more distal to social preferences, as they describe general values of how daily life is organized. These values are not directly related to intergroup relations and hierarchies and might therefore be less relevant for out-group-specific social preferences.
Limitations
National subsamples were adequately large to investigate individual-level relationships of social perceptions and social preferences; however, future studies should include more nations to increase test power for national-level effects. To balance survey length and repeated measurements (i.e., participants rated all ten nations), individual perceptions of the Hofstede cultural dimensions and ABC stereotypes were assessed with single items, and measurement equivalence between nations could not be tested. Future research should replicate the findings using multiple-item measures and explore whether results also hold if social preferences are assessed in a between-participants design without repeated measurement. Finally, effect sizes were small (partial correlations for similarity ranging between .01 and .12 for main effects and between .02 and .10 for interactions). We argue that these small effects can be of practical significance and societal relevance for cross-national cooperation. Due to globalization and digitalization, interactions between individuals from different nations occur both frequently and repeatedly (for a similar argument about discrimination due to implicit associations, see Greenwald et al., 2015).
Conclusion
Previous research investigated social preferences mainly to predict stable interindividual differences in cooperation behavior (Murphy & Ackermann, 2014). The current research shows that social preferences systematically vary depending on the nation the other person is from. Above and beyond stable, global individual differences in social preferences, the cross-national context consistently explains part of the intergroup bias in prosociality. Similarity promotes social preferences and cross-national cooperation. Thus, in situations of interdependence (e.g., international collaborations), individuals might behave more prosocially toward others from similar cultural groups. Creating a common in-group identity or making superordinate identities salient might foster cross-national cooperation. Future research on similarity and out-group-specific social preferences should include process variables (Stürmer & Siem, 2017) and further measures of prosocial behavior.
Supplemental Material
Supplemental Material, Online_Supplementary_Materials_R1 - Similarity Predicts Cross-National Social Preferences
Supplemental Material, Online_Supplementary_Materials_R1 for Similarity Predicts Cross-National Social Preferences by L. Froehlich, A. R. Dorrough, A. Glöckner and S. Stürmer in Social Psychological and Personality Science
Footnotes
Declaration of Conflicting Interests
The author(s) declared no potential conflicts of interest with respect to the research, authorship, and/or publication of this article.
Funding
The author(s) received no financial support for the research, authorship, and/or publication of this article.
Supplemental Material
The supplemental material is available in the online version of the article.
Note
References
Supplementary Material
Please find the following supplemental material available below.
For Open Access articles published under a Creative Commons License, all supplemental material carries the same license as the article it is associated with.
For non-Open Access articles published, all supplemental material carries a non-exclusive license, and permission requests for re-use of supplemental material or any part of supplemental material shall be sent directly to the copyright owner as specified in the copyright notice associated with the article.