
Abstract
Frequent social contact has been associated with better health and longer life. It remains unclear though whether there is an optimal contact frequency, beyond which contact is no longer positively associated with health and longevity. The present research explored this question by examining nonlinear associations of social contact frequency with health and longevity. Study 1 (N ∼ 350,000) demonstrated that once the frequency of social contact reached a moderate level (monthly or weekly), its positive association with health flattened out. Study 2 (N ∼ 50,000) extended these findings to longitudinal and mortality data: Although low contact frequency was associated with poor health and low survival rates, increasing the frequency of social interactions beyond a moderate level (monthly or weekly) was no longer associated with better health and longevity and, in some cases, was even related to worse health and increased mortality risks.
Decades of research have highlighted the importance of social contact for health. Higher levels of social integration (e.g., more frequent contact with friends) have been associated with better physical health and a lower likelihood of a range of conditions (Al-Kandari, 2011; Heffner et al., 2011; Valtorta et al., 2016), as well as a healthier lifestyle including more physical exercise, healthier diet, and more regular medical screening behaviors (Uchino, 2006; Umberson et al., 2010).
As evidenced in several meta-analyses, social contact has also been associated with the ultimate outcome of health—reduced mortality risks (Holt-Lunstad et al., 2010, 2015; Shor & Roelfs, 2015). This association manifests across various forms of social contact including interacting with children, socializing with relatives and friends, having a larger social network, and even receiving a higher number of online friendship requests (de Brito et al., 2017; Hobbs et al., 2016; Smith et al., 2018). The effect of social contact on mortality risks rivals the effect of many well-established physical and behavioral factors such as smoking, alcohol consumption, physical activity, and air pollution (Holt-Lunstad et al., 2010). Guided by these findings, nation-wide health policies were developed to strengthen social ties as a health improvement strategy at the population level (Holt-Lunstad, 2018; International Council on Active Aging, 2017; Umberson & Montez, 2010).
However, most existing literature focused on testing the linear relationship between social contact and health outcomes, assuming that the more social contact, the better. In the current research, we questioned the assumption of linearity by examining the nonlinear association between social contact and health/longevity. We focused on one specific aspect of social contact—contact frequency—and explored whether the social contact frequency (e.g., socializing with one’s friends and colleagues) has a nonlinear association with health and longevity.
It has been recently proposed that the focus on linear relationships in the well-being literature could have obscured the prevalence of nonlinear effects (Grant & Schwartz, 2011). According to Aristotle’s philosophy (1999), for many positive factors (or virtues, in Aristotelian language), it is the moderate rather than the highest level that yields the best well-being and health outcomes. This idea has been recently picked up by psychological research (Grant & Schwartz, 2011; Oishi et al., 2007) that detected an inverted U-shaped pattern in several areas. For example, moderate (vs. high) life satisfaction has been associated with lower reemployment chances in unemployed individuals (Rose & Stavrova, 2019), moderate (vs. high) volunteering frequency has been associated with higher subjective well-being (Windsor et al., 2008), and moderate (vs. high) level of optimism predicted slower disease progression in patients on antiretroviral therapy (Milam et al., 2004).
There is some indirect evidence that the associations between social contact frequency and health/mortality might follow a nonlinear pattern as well. A recent study showed that people’s social media usage (Facebook messenger) was associated with mortality in an inverted U-shaped manner, with the moderate level yielding the lowest mortality risks (Hobbs et al., 2016).
Why could highly (vs. moderately) frequent social contact be associated with no better health and longevity? The effect of social interactions might follow the general principle of marginal utility, according to which any additional unit of a good consumed yields smaller and smaller satisfaction (or utility), up to a point where further consumption does not yield any satisfaction at all but rather becomes uncomfortable. Consistent with this idea, the emotional benefits of some social activities last longer than 1 day (Burleson et al., 2007), suggesting that socializing could be sufficient at a certain level (e.g., every other day), and additional socializing (e.g., daily) might have little additional health benefits.
In addition, extremely frequent social contact can divert resources from other activities that could have benefited one’s health and longevity. In fact, sometimes people actively seek solitude (Burger, 1995; Ren et al., 2016), experience some activities (e.g., wilderness) as more enjoyable in solitude (Long & Averill, 2003), and use solitude as a way to relax and regulate emotions (Lay et al., 2019; Nguyen et al., 2018). Not spending enough time in solitude has been linked with diminished well-being (Coplan et al., 2019). As time is a limited resource, frequent contact with others is likely to deprive one from the valuable moments of solitude. In addition, sometimes frequent social contact might be stressful in and of itself (Rook, 1990), and stress is a well-known predictor of poor health (Thoits, 2010). Finally, frequent socializing can interfere with the goals in other life domains including work, family life, or staying healthy (Grund et al., 2014; Riediger & Freund, 2004).
The Present Research
We tested whether the association between social contact frequency and physical health as well as mortality risks follows a nonlinear pattern, with moderate levels of social contacts corresponding to the best health and longevity outcomes. Study 1 tested the nonlinear association between social contact frequency and self-rated physical health using cross-sectional survey data from a large international dataset. Study 2 used longitudinal data and examined whether the prospective effect of social contact frequency on self-rated physical health and mortality risks follows a nonlinear pattern too. The data of Study 1 and all analyses scripts (Studies 1 and 2) are available at https://osf.io/kd42b/?view_only=1c505cf3b1fc4734bc45160dcf112ed4. The data of Study 2 can be downloaded at the study website (https://www.diw.de/en/soep).
Study 1
Method
Participants
We used data from the European Social Survey (ESS, 2018). ESS is a large-scale international survey that examines peoples’ beliefs, values, and well-being in 37 European countries. Every wave recruits a new nationally representative (a random probability) sample in each country.
We used the data from all the waves available at the time of writing (nine waves, 2002–2018). The sample consisted of 392,195 individuals (M age = 48.23, SD age = 18.50, 46.3% male) residing in 37 countries. The list of countries and the country descriptive statistics are shown in Table S1 (Supplementary Materials).
Measures
To measure social contact frequency, participants indicated how often they socially meet with friends, relatives, and colleagues. Response options were 1 = never, 2 = less than once a month, 3 = once a month, 4 = several times a month, 5 = once a week, 6 = several times a week, and 7 = every day. We mean centered this variable before computing its quadratic term. 1
To measure self-rated physical health, participants responded to the following prompt: “How is your health in general? Would you say it is very good, good, fair, bad, or very bad?” (see Figure S1 for frequencies). We recoded the responses such that higher values reflect better physical health.
As the following socio-demographic and economic characteristics have been linked to both social relationships (e.g., Bianchi & Vohs, 2016) and health (e.g., Elo, 2009), we included them as covariates in the present analysis: age, gender (1 = male, 0 = female), education (number of years), marital status (four categories: married [reference category], divorced, widowed, or never married), employment status (five categories: employed [reference category], unemployed, student, retired, and other], and household income (“Which of the descriptions on this card comes closest to how you feel about your household’s income nowadays? 1 = living comfortably on present income, 2 = coping on present income, 3 = finding it difficult on present income, and 4 = finding it very difficult on present income”; responses were recoded such that higher values reflect a higher income).
Results
Social contact frequency was positively associated with self-rated physical health in all 37 countries. The association ranged between r = .09 (p < .001) and r = .36 (p < .001) and, on average, reached r = .21 (p < .001). However, an examination of average self-rated health corresponding to each social contact frequency (Figure 1) suggests that this association might not be perfectly linear.
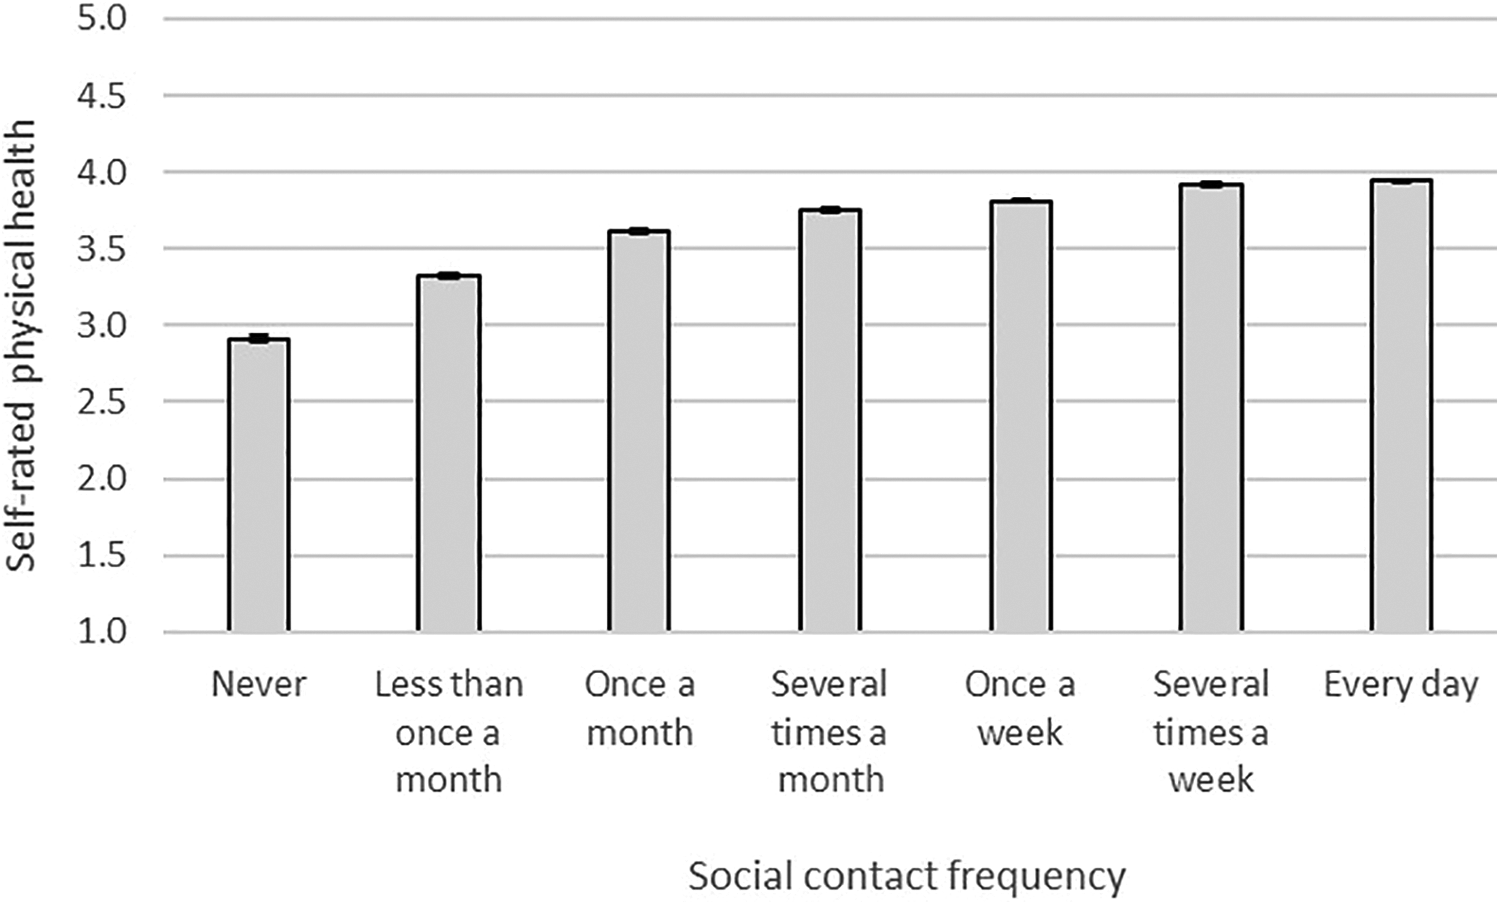
Social contact frequency and self-rated physical health, Study 1. Note. Error bars reflect standard errors.
To test the nonlinear association between social contact frequency and self-rated health, we used multilevel regression analysis with participants nested within both countries and waves (cross-classified models). The models included a random intercept at the level of countries and waves. In Model 1, we regressed self-rated physical health on linear and quadratic terms of social contact frequency. Table 1 shows unstandardized coefficients. The linear term was significant (b = .10, p < .001). Critically, the quadratic term was significant too (b = −.02, p < .001), providing evidence for the nonlinear association. Both the linear and the quadratic terms were robust against controlling for sociodemographic variables (Model 2: b linear = .04, p < .001; b quadratic = −.02, p < .001).
Multilevel Regression Results (Unstandardized Coefficients), Study 1.
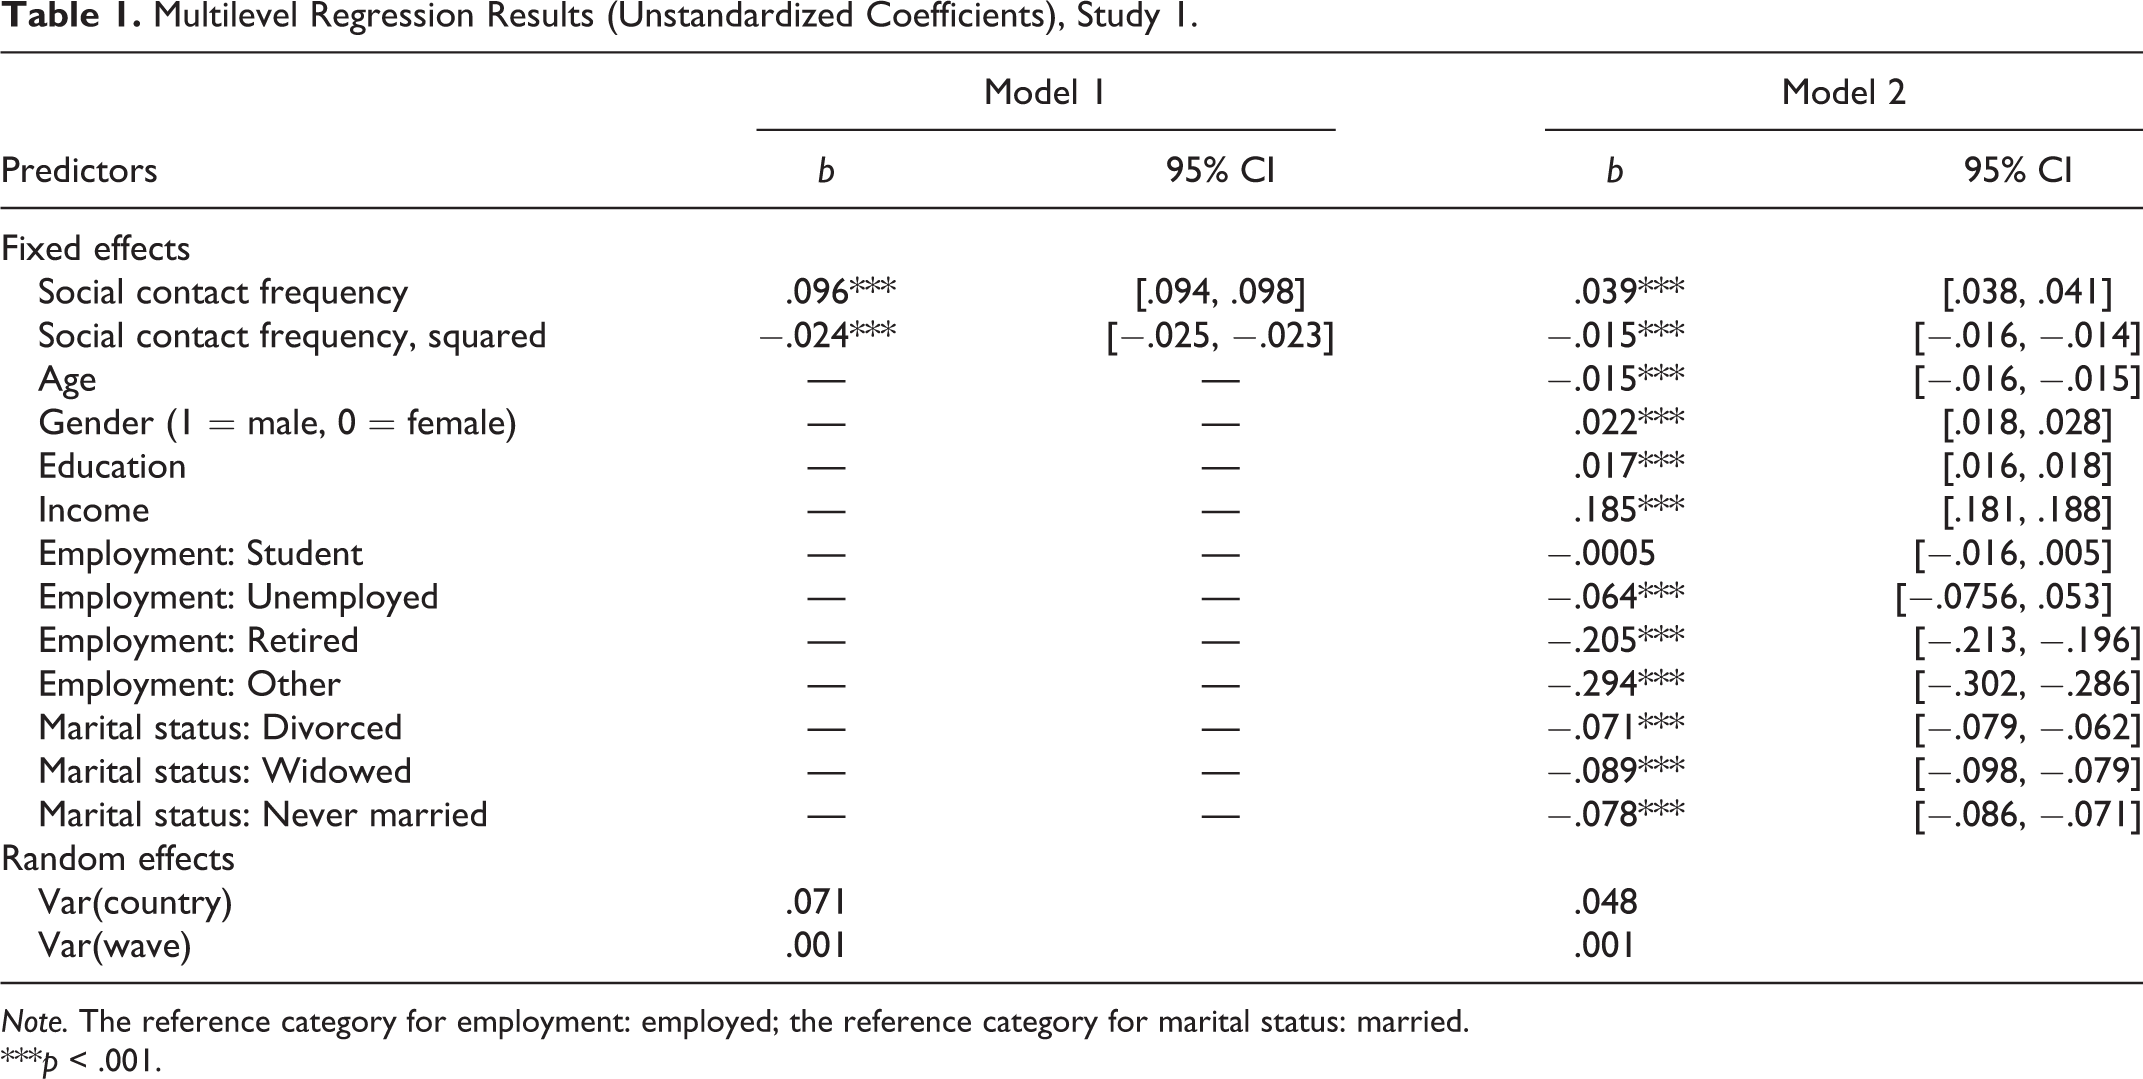
Note. The reference category for employment: employed; the reference category for marital status: married.
***p < .001.
Increasing frequency of social contacts is positively associated with self-rated physical health up to a point (roughly around “several times a month”), where this association flattens out (Figure 2). We used pairwise comparison tests (as implemented in the package LmerTest: Kuznetsova et al., 2017) to compare the differences in health between the seven categories of social contact. Given that this test involved 21 comparisons, we adjusted the α level to .002 (.05/21; Bonferroni correction). The differences between all seven categories of social contact were significant (ps < .00001).
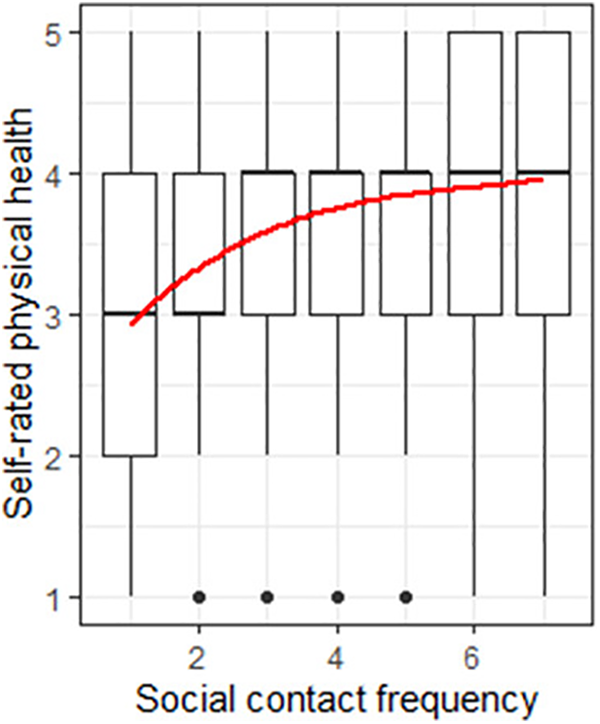
The nonlinear effect of social contact frequency on self-rated physical health, Study 1. Note. Red line shows the estimated association based on multilevel modeling (Model 1; Table 1).
Comparing linear and quadratic models
A likelihood ratio test showed that the quadratic model (including linear and quadratic terms) fitted the data better than the linear model (including only the linear term), χ2(1) = 2,057.2, p < .001.
Discussion
Study 1 provided first evidence of a nonlinear association between social contact frequency and physical health. It showed that increasing the frequency of social contacts from yearly to monthly is associated with significant health improvement. Yet increasing the frequency of social contacts beyond this point (e.g., from monthly to daily) is associated with very little additional benefits.
Study 2
Study 1 provided the initial demonstration of the nonlinear association between contact frequency and health. Yet its use of cross-sectional data does not provide any evidence for the suggested causal direction. Therefore, in Study 2, we tested the nonlinear effect of contact frequency on health using longitudinal data. Additionally, Study 2 examined whether the nonlinear pattern extends beyond self-rated physical health to mortality.
Method
Participants
We used the data from the German Socio-Economic Panel (SOEP, 2018; Version 34) study. SOEP is a nationally representative annual panel study conducted in Germany since 1984. The data contain the information about respondents’ survival status, including the year of death, throughout 2017. Six waves (1990, 1995, 1998, 2003, 2008, and 2013) included several questions regarding respondents’ social contact frequency. Of those, five waves (1995–2013) also included a measure of self-rated physical health. Therefore, the analyses of physical health are based on the data from these five waves and the sample of 49,675 participants (born between 1897 and 1996, average year of birth = 1962, 47.2% male).
For the analysis of mortality risks, our sample consisted of individuals who participated in at least one of the six waves that included social contact frequency measures and had valid values on the key variables (social contact frequency, vital status): N = 52,542 (born between 1894 and 1996, average year of birth = 1960, 47.5% male).
Measures
Social contact frequency
Participants indicated how often they took part in the following two activities: mutual visits to/from neighbors, friends, and acquaintances and mutual visits to/from family members, and relatives. Responses were given on a 5-point scale: 1 = daily, 2 = at least once a week, 3 = at least once a month, 4 = seldom, and 5 = never. We recoded the values such that higher values represent a higher frequency of contact. We mean centered this variable before computing its quadratic term.
Self-rated physical health
To measure self-rated physical health, participants were asked “How would you describe your current health? 1 = very good, 2 = good, 3 = satisfactory, 4 = poor, and 5 = bad.” Responses were recoded such that higher values reflect better health.
Mortality
Participants’ vital status (1 = deceased, 0 = alive) was available through 2017. Survival time was computed in years, starting from the year of joining the study (or more precisely, completing the social contact frequency questions for the first time) until death or censoring (in 2017).
Control variables
We included the same set of sociodemographic and economic control variables as in Study 1: participants’ age 2 , gender (1 = male, 0 = female), education (number of years), marital status (four categories: married [used as reference category], divorced, widowed, and never married), employment status (five categories: employed [used as reference category], unemployed, retired, student, and other), and household income (monthly net household income, in Euro). These variables were measured repeatedly all six waves, allowing us to use them as time-dependent covariates.
Results
Means, standard deviations, and zero-order correlations among the variables are shown in Table 2 (also see Figure S2). 7.9% (n = 4,172) of the sample passed away within the observation period. The survival time ranged between 1 and 27 years (on average, 13.68 years).
Mean, Standard Deviations, and Zero-Order Correlations, Study 2.
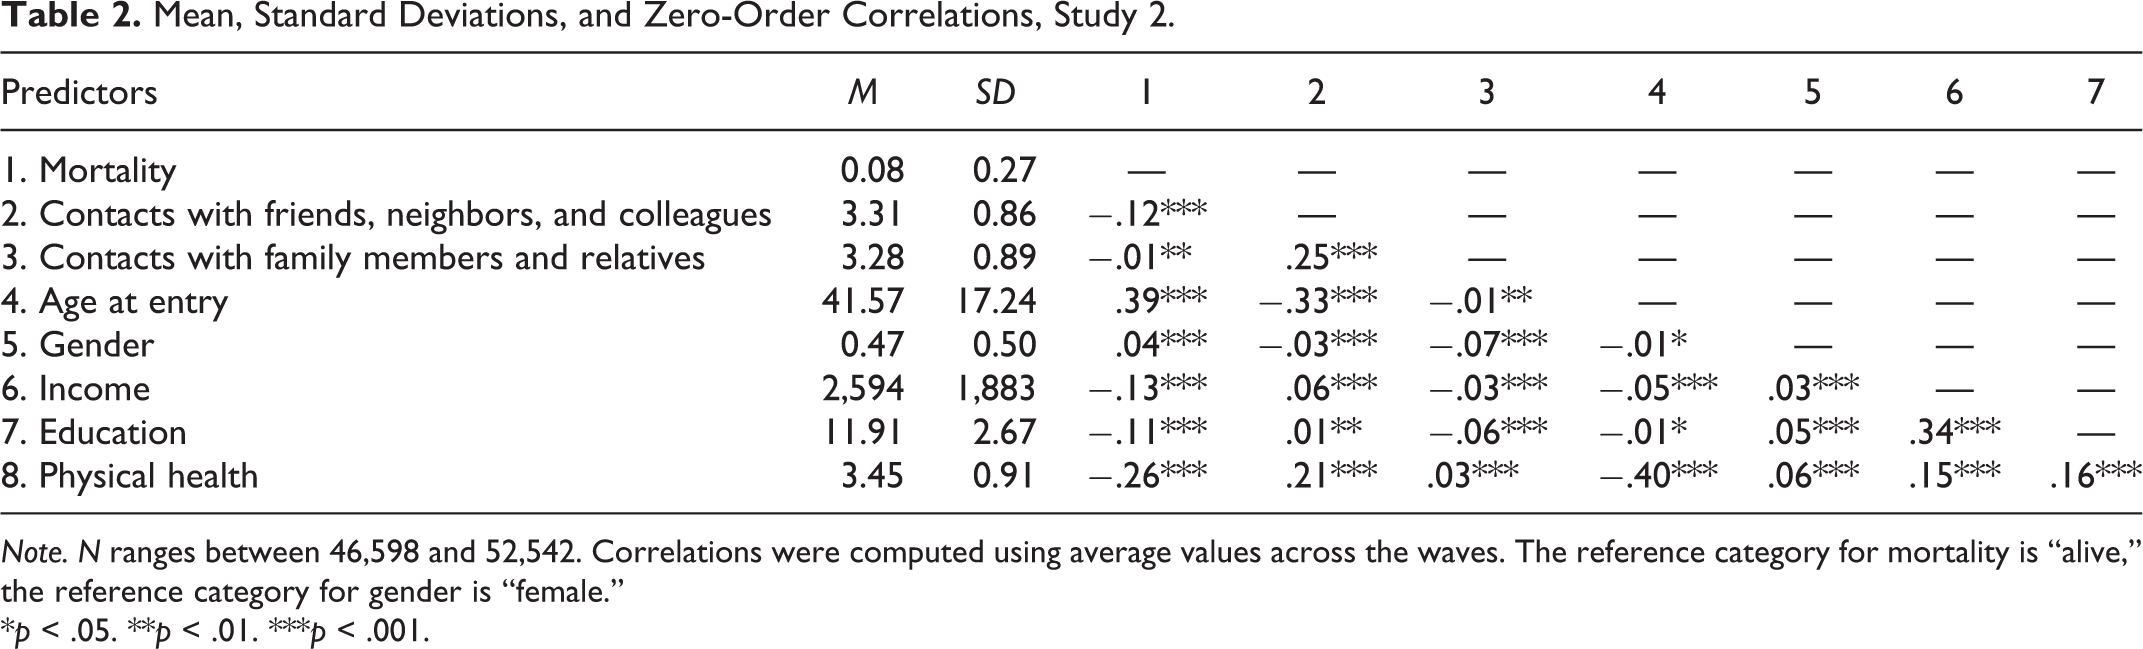
Note. N ranges between 46,598 and 52,542. Correlations were computed using average values across the waves. The reference category for mortality is “alive,” the reference category for gender is “female.”
*p < .05. **p < .01. ***p < .001.
Physical Health
Prospective effect of social contact frequency on physical health
We used multilevel regression, with waves of data collection nested within participants. We regressed physical health at time t on the linear and quadratic terms of social contact frequency at time t −1 and physical health at time t −1. Respondents had to participate in at least two waves of the study to be included in this analysis (see Table 3 for the number of participants for each model).
Multilevel Regression (Unstandardized Coefficients) Predicting Physical Health at t, Study 2.
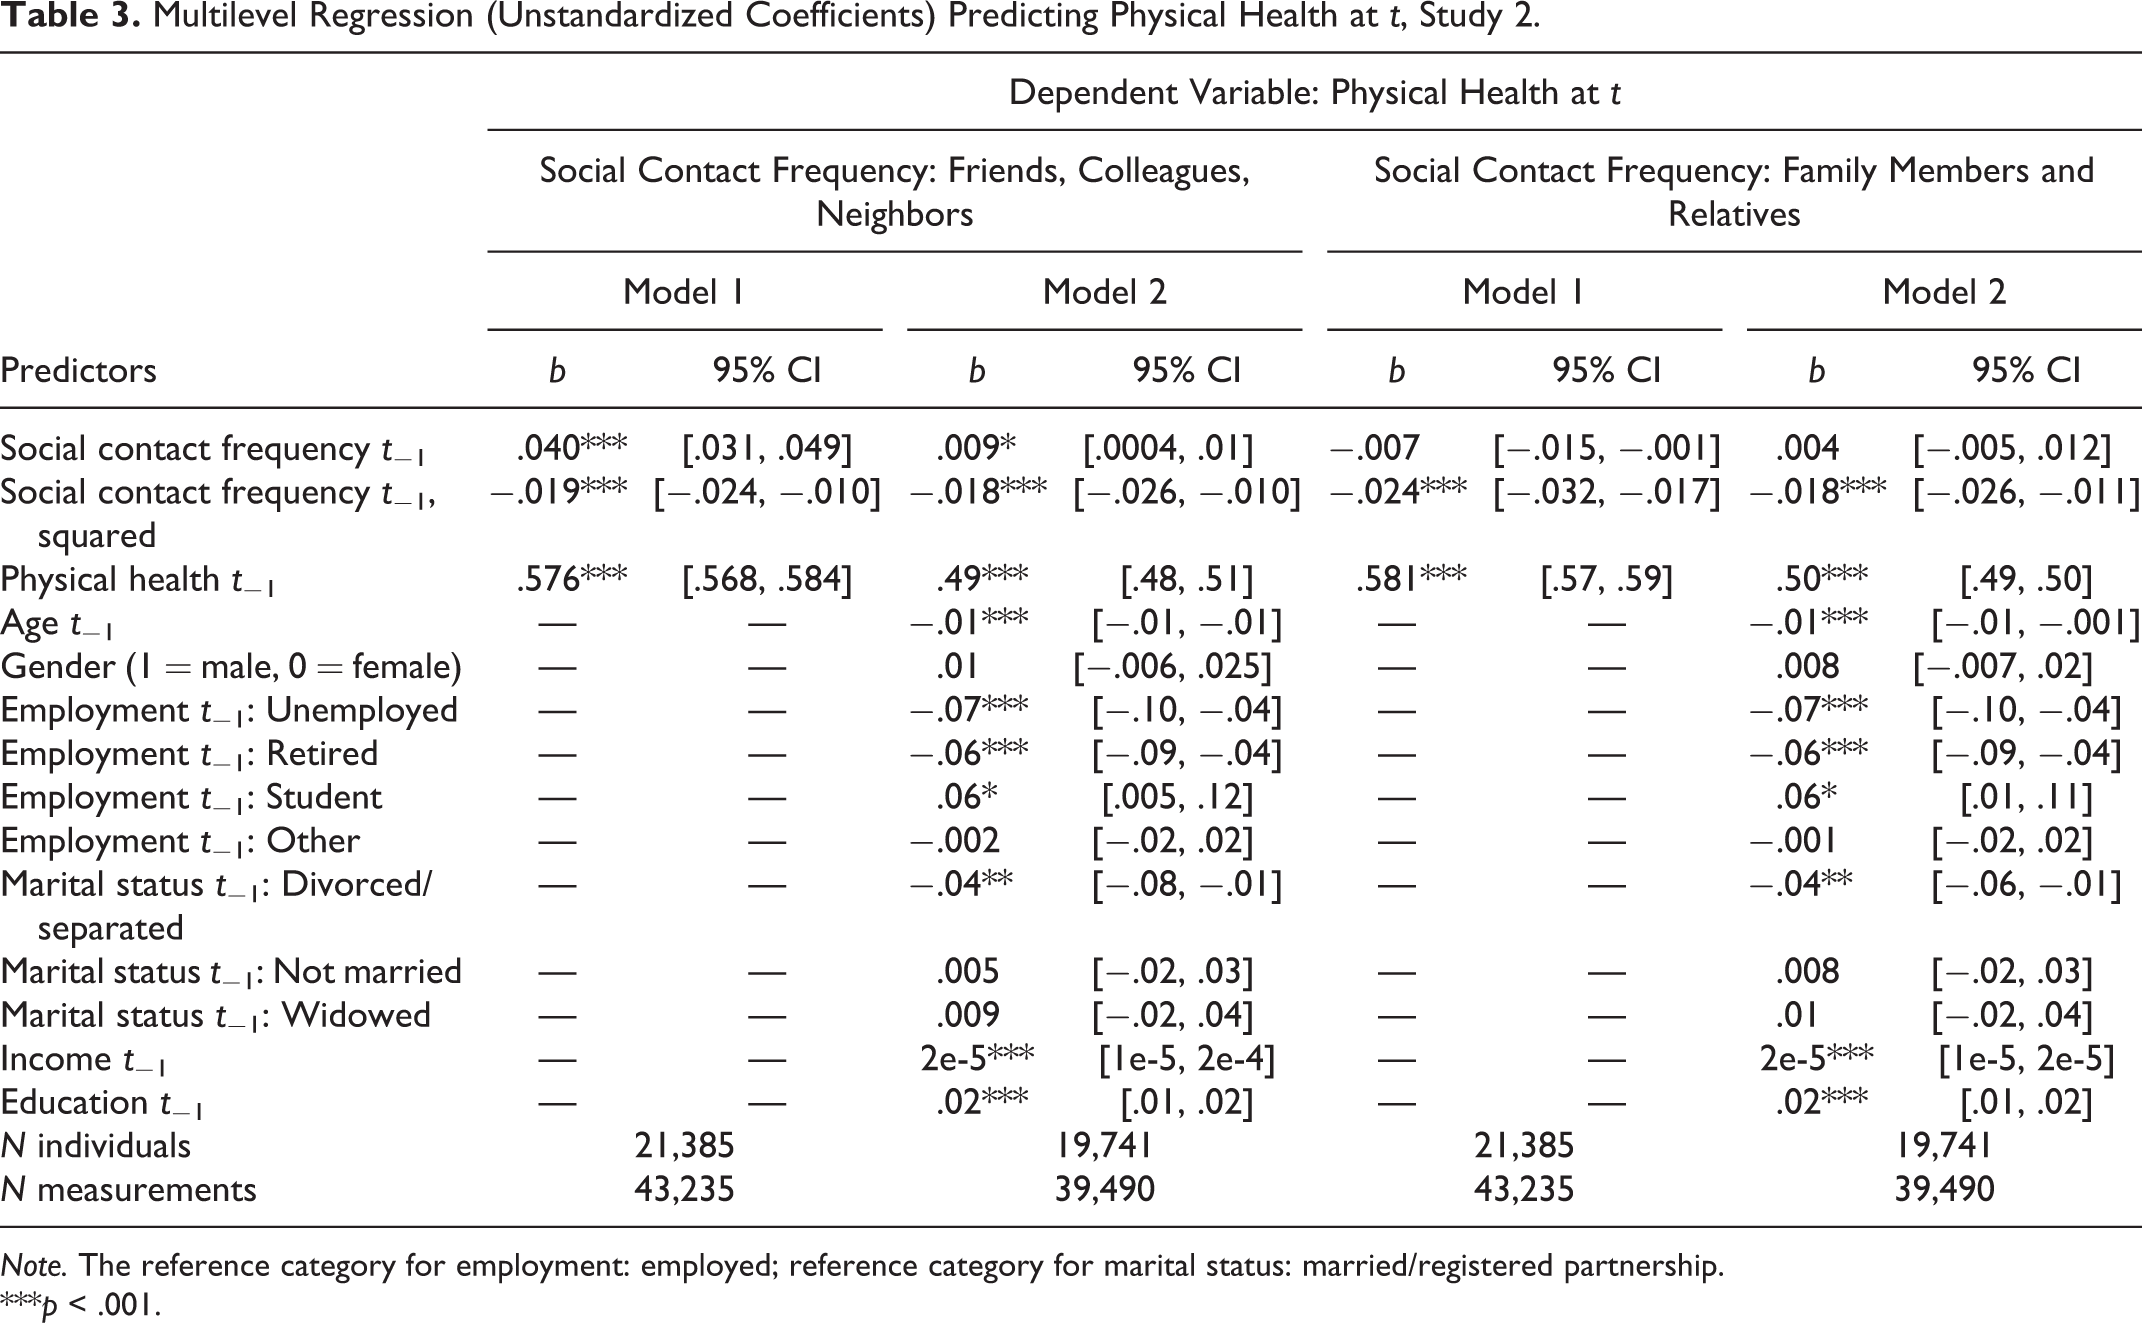
Note. The reference category for employment: employed; reference category for marital status: married/registered partnership.
***p < .001.
For contacts with friends, neighbors, and colleagues, both the linear and the quadratic coefficients reached significance (b linear = .01, p = .04; b quadratic = −.02, p < .001; Table 3 and Figure 3). Like in Study 1, we compared the differences in health between the five categories of social contact using an adjusted α level (.005; .05/10 tests). At lower levels of contact frequency (up to once a month), more (vs. less) frequent contact at one time point is associated with better health at a follow-up (all ps < .001); however, at higher levels of contact frequency, this association levels off. Specifically, increasing contact frequency beyond monthly was no longer associated with a significant improvement in health (p = .026 and p = .519).
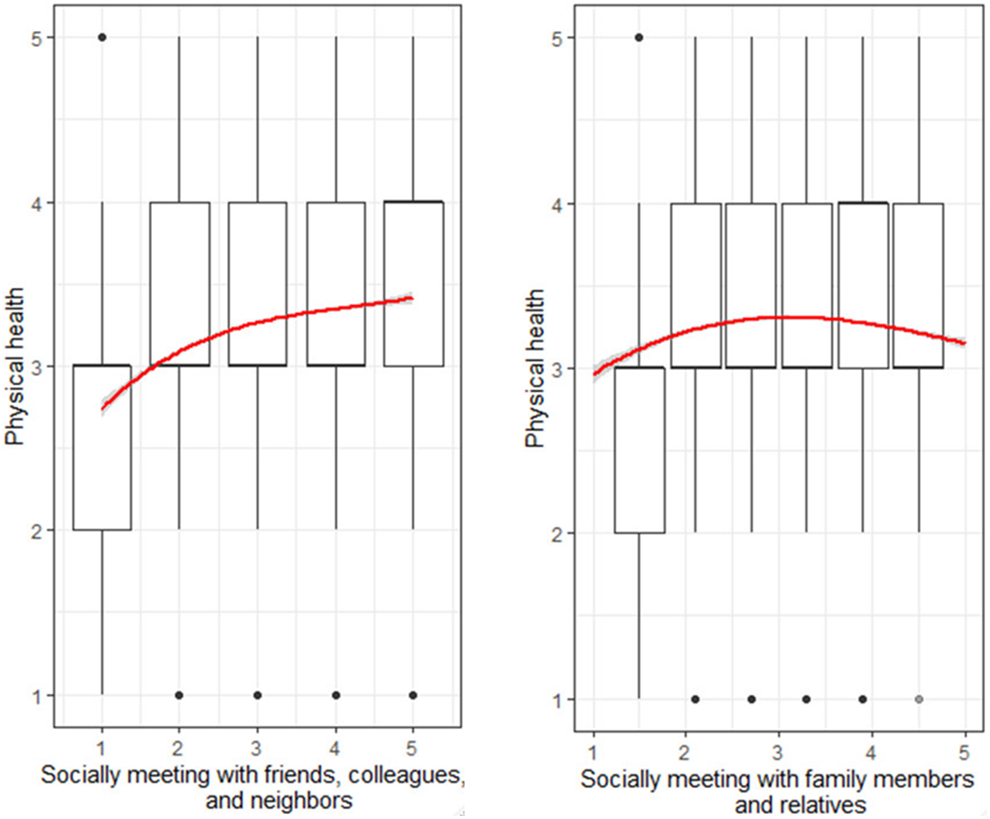
Social contact frequency (time t − 1) and self-rated physical health (time t), Study 2. Note. Error bars are 95% confidence intervals.
For contacts with family members and relatives, only the quadratic term was significant (b quadratic = −.02, p < .001). More frequent contacts with family members and relatives at time t −1 is associated with better health at time t, controlling for health at t − 1. Yet this is true up to a point (monthly contact) where this effect reverses: More frequent (than monthly) interactions predict worse physical health. Indeed, the pairwise comparisons (with an adjusted α of .005) showed that increasing contact from never to seldom and from seldom to at least once a month was associated with significantly better health (p < .001 and p = .002). Increasing contact beyond that was associated with significantly worse health (from weekly to daily: p = .001; to weekly: p = .003). Interestingly, never seeing family members and relatives was equally bad as seeing them daily (p = .019). In case of both types of contact (with friends/colleagues/neighbors and family members/relatives), the quadratic terms were robust against adding the sociodemographic and economic control variables (b quadratic = −.02, p < .001).
Comparing linear and quadratic models
A likelihood ratio test showed that the quadratic model (that included health at t − 1, the linear and the quadratic terms of contact frequency) fitted the data better than the linear model (that included health at t − 1 and the linear term of contact frequency), for both contact with friends/neighbors/colleagues, χ2(1) = 25.26, p < .001, and family/relatives,(χ2(1) = 44.71, p < .001.
Mortality Risks
Effect of contact frequency on the probability of death
First, we explored whether social contact frequency was associated with mortality within the observation period. We conducted a logistic regression analysis with age, linear and quadratic terms of contact frequency as predictors and the event of death (1 = yes, 0 = no) as the outcome. The results are shown in Table 4. For both contact variables, only the quadratic term was significant (see Model 2; Table 4). Figure 4 shows that individuals with the moderate (monthly) frequency of contact had the lowest risk of mortality within the observation period. Pairwise comparisons (with an adjusted α of .005) showed that increasing contact from never to seldom and from seldom to at least once a month was associated with a lower likelihood of death (ps < .001). However, increasing contact beyond this point (from monthly to weekly and from weekly to daily) was associated with higher mortality risks (ps < .001). A similar pattern emerged for the frequency of contact with family members and relatives: increasing contact from never to seldom and from seldom to at least once a month was associated with a lower likelihood of death (ps < .001). We found no significant difference between monthly and weekly contact (p = .030); however, increasing contact from weekly to daily was associated with higher mortality risks (p < .001).
Logistic Regression Model Predicting the Probability of Death, Study 2.
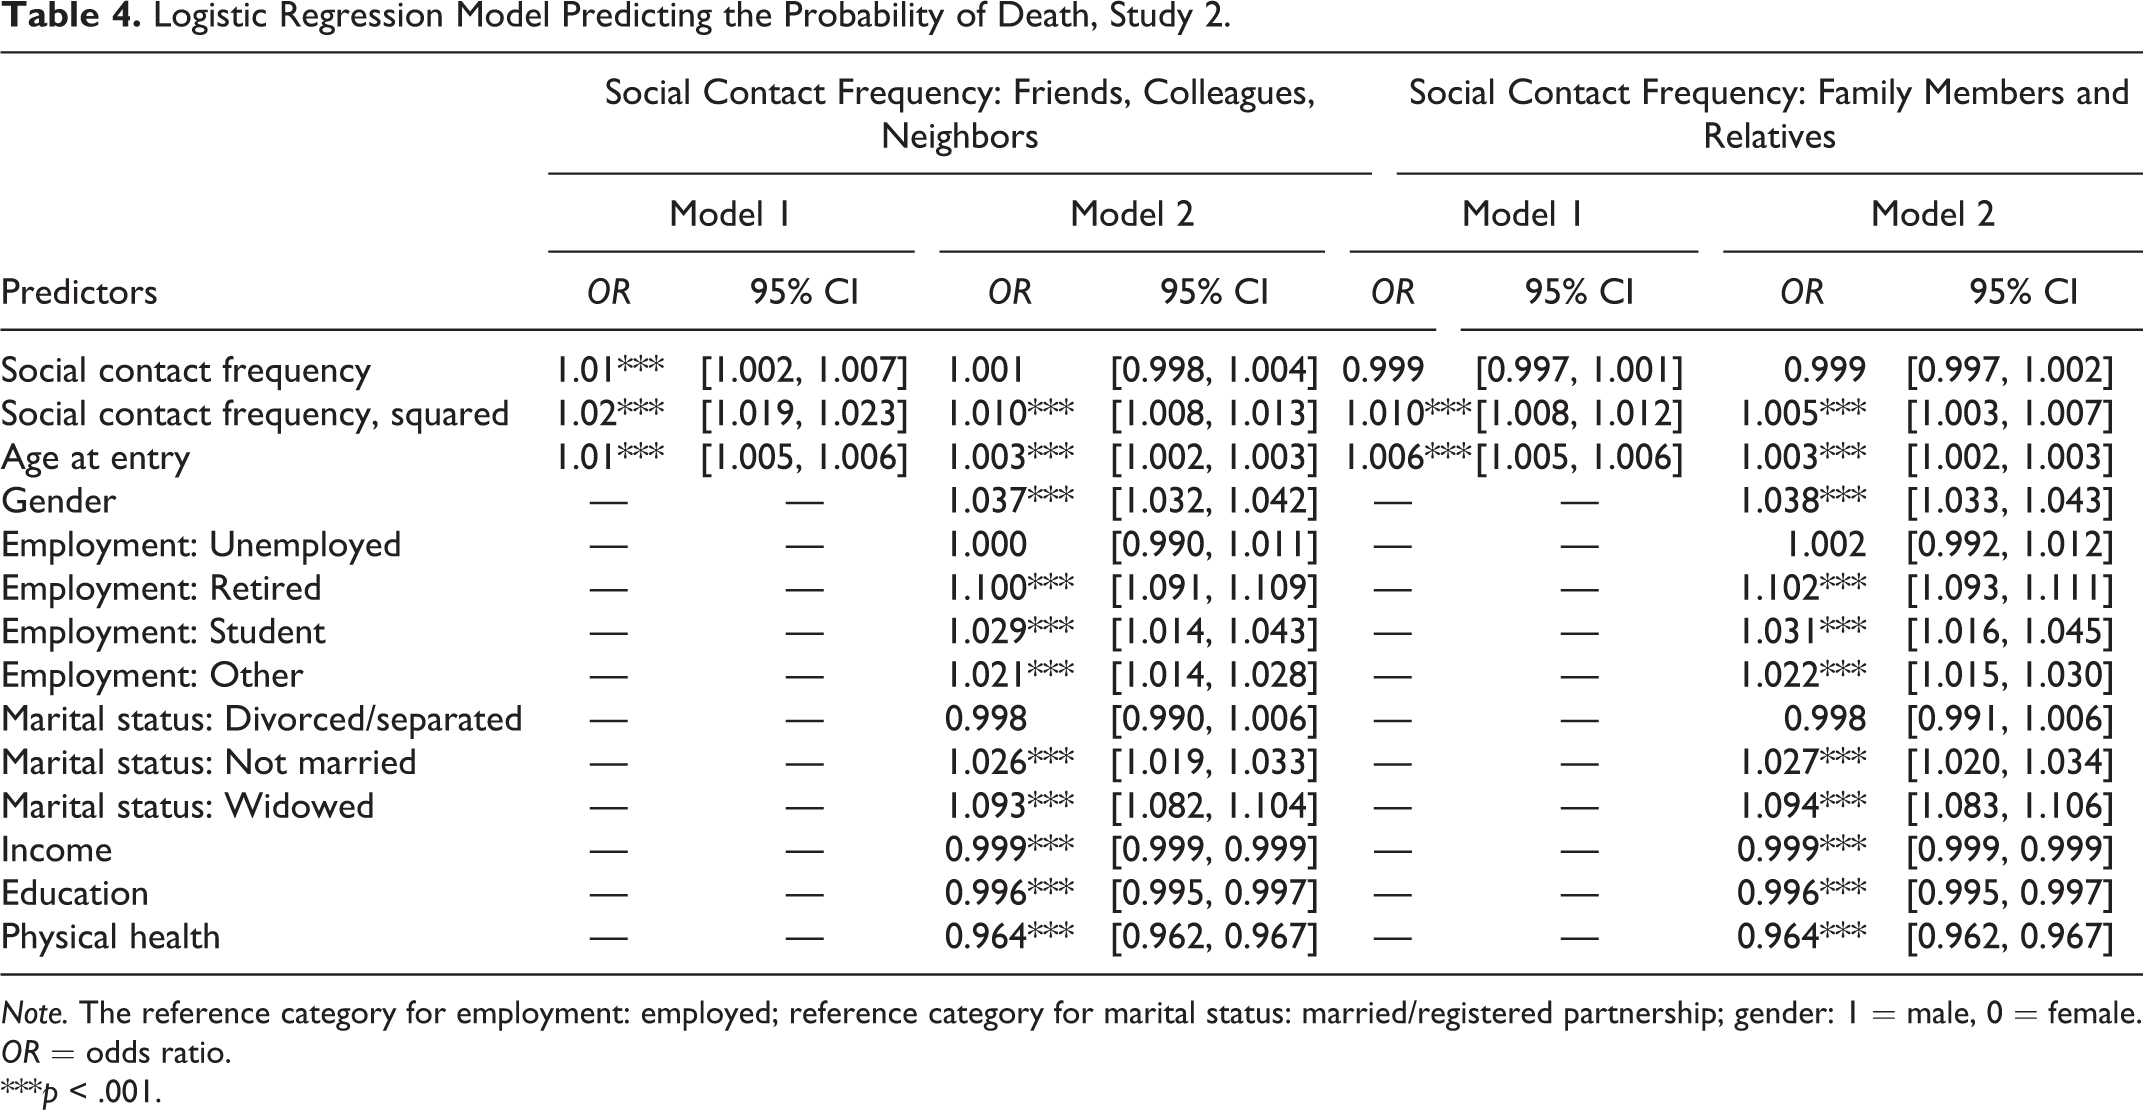
Note. The reference category for employment: employed; reference category for marital status: married/registered partnership; gender: 1 = male, 0 = female. OR = odds ratio.
***p < .001.
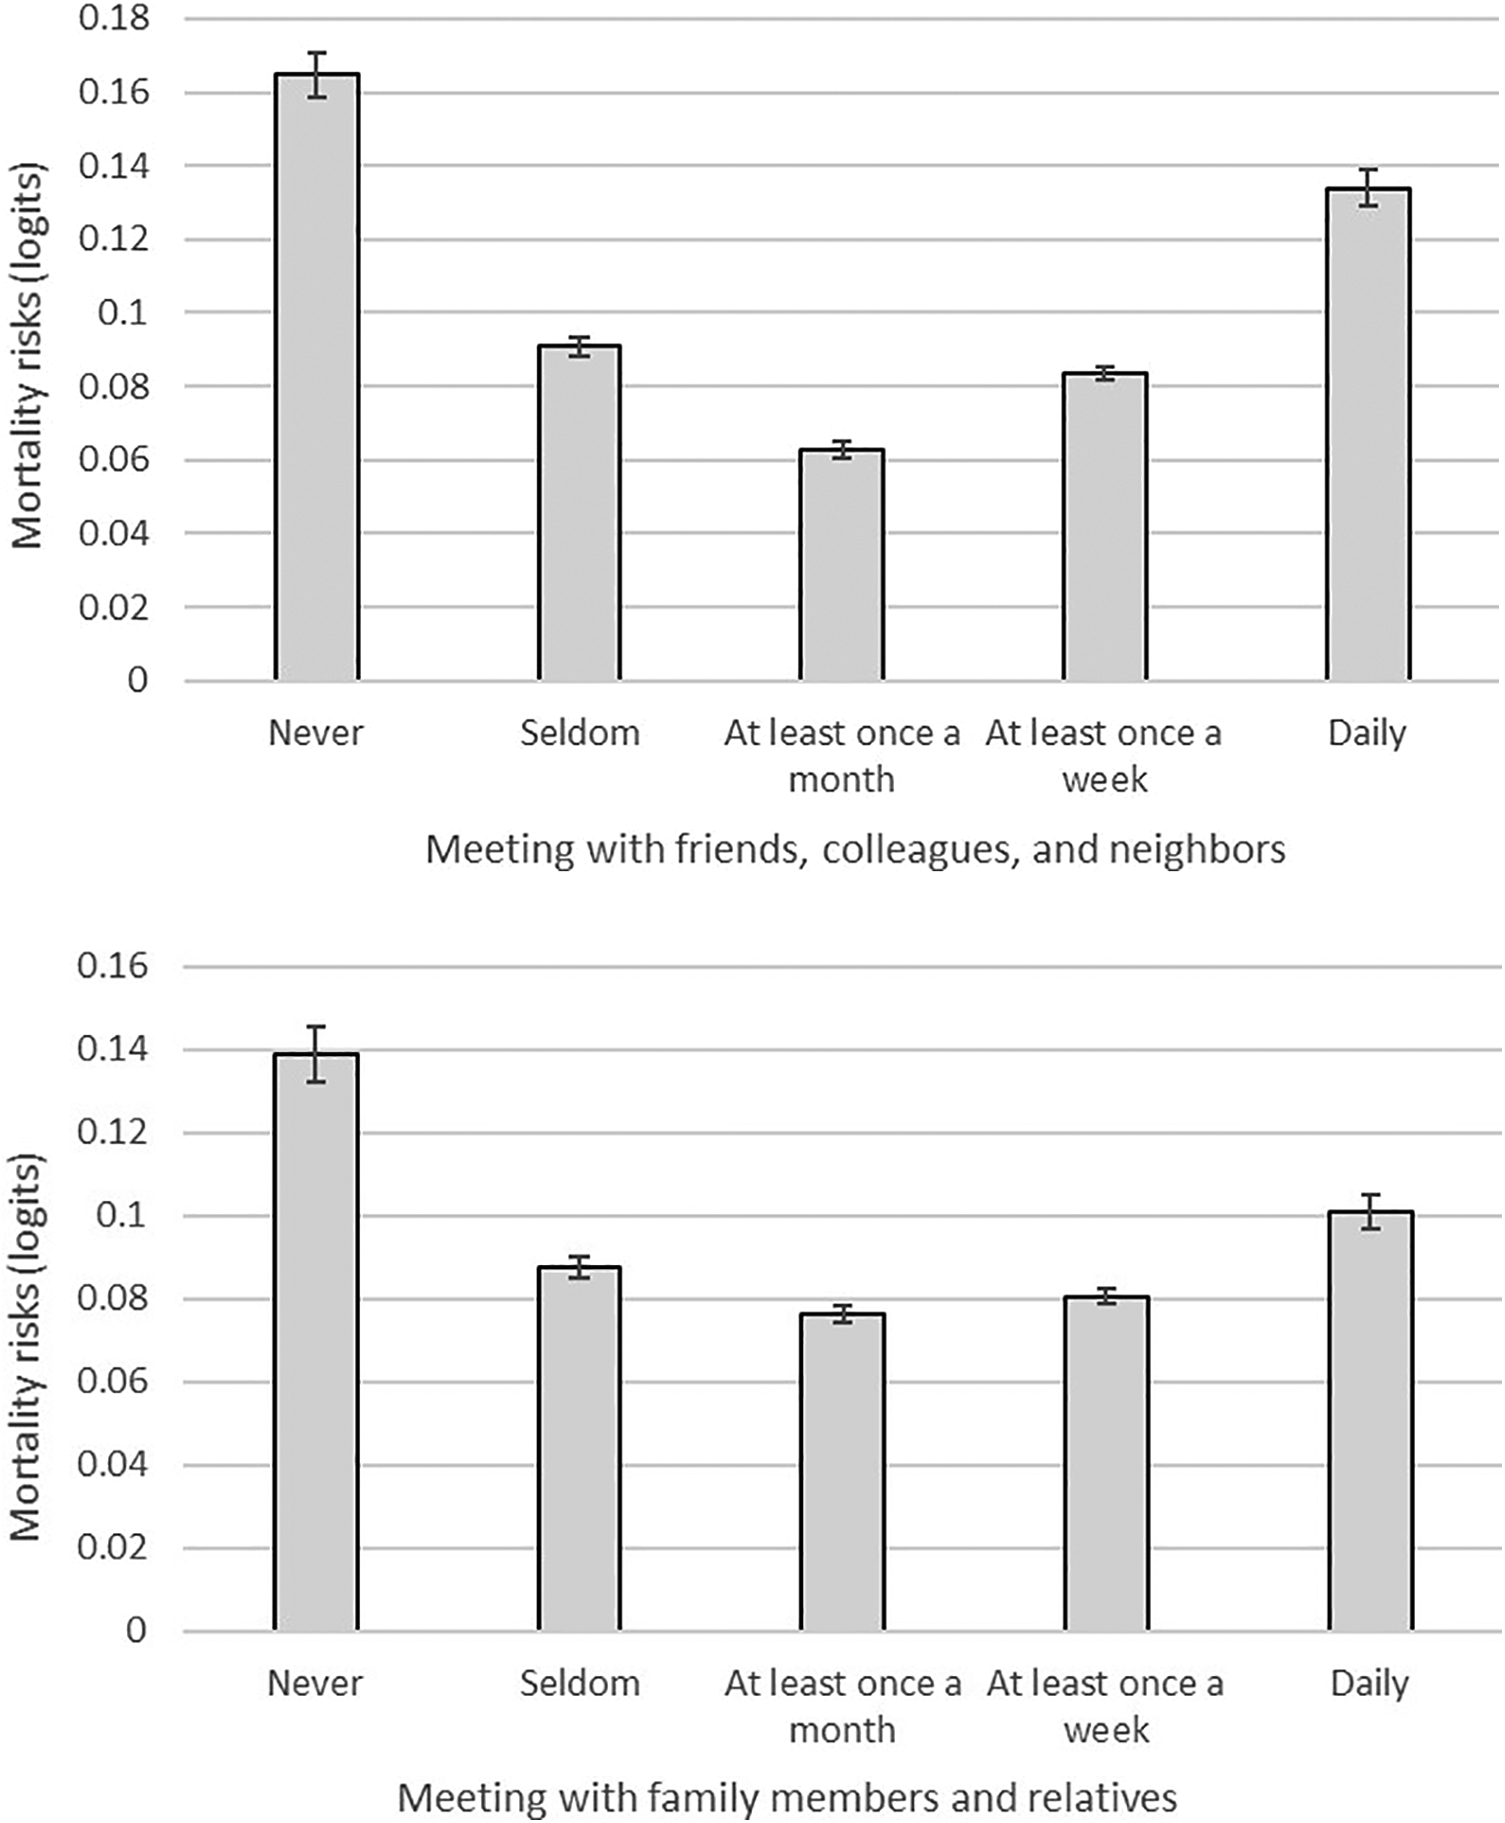
Social contact frequency and mortality risks (overall sample), Study 2. Note. Error bars represent standard errors.
Comparing linear and quadratic models
A likelihood ratio test showed that the quadratic model (that included age, the linear and the quadratic terms of contact frequency) fitted the data better than the linear model (that included age and the linear term of contact frequency), for both contact with friends/neighbors/colleagues and family/relatives (both ps < .001).
Effect of contact frequency on survival time
First, we plotted the survival time of deceased respondents against the frequency of their social contacts (as reported in the year they entered the study; Figure 5). We observed the highest survival times for participants with a moderate (monthly) frequency of social relationships.
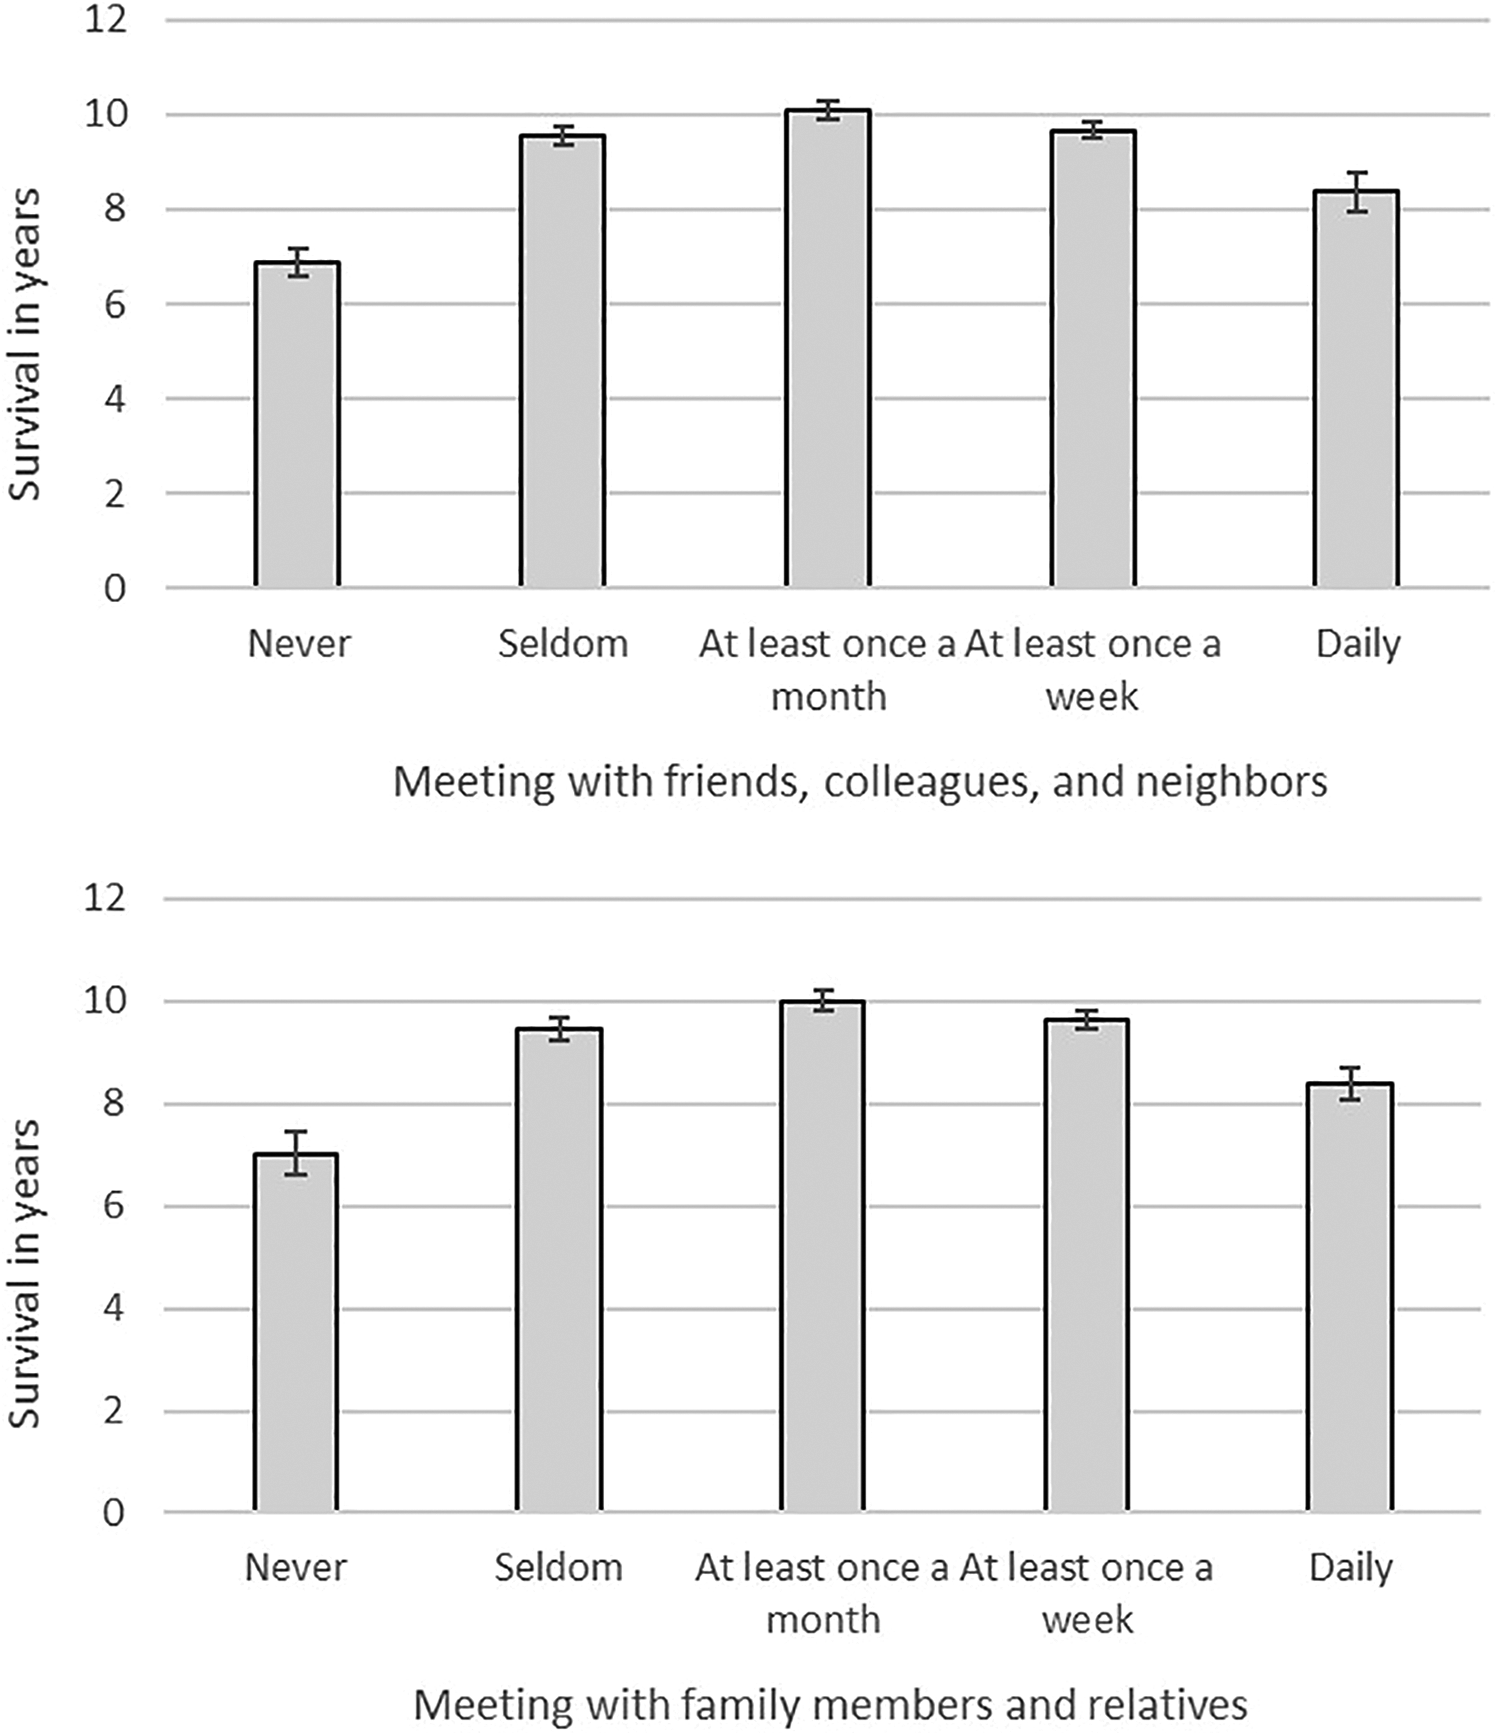
Social contact frequency and survival in years (deceased respondents), Study 2. Note. Error bars reflect standard errors. Social relationship values are the ones from the waves the respondents completed the measure for the first time.
To test the nonlinear association between social contact frequency and mortality, we used the Cox proportional hazard model. As the predictors were measured multiple times within the observation period (at most, six times), we recurred to a time-dependent Cox model. This analysis allows the predictors to change their values over time during the follow-up period and estimates the effect of social contact frequency using the most recently obtained values (before mortality). The analyses were conducted with the survival package in R (Therneau, 2015). Survival time was recorded in years, starting from the time of entering into the study till death or censoring. To control for delayed entries, we included participants’ age at entry as a covariate.
The results are shown in Table 5. In case of social interactions with friends, colleagues, and neighbors, only the quadratic (but not the linear) effect reached significance (HRlinear = 1.002, p = .92; HRsquared = 1.17, p < .001), providing evidence for the nonlinear effect. The quadratic term of social contact remained significant when adding sociodemographic and economic control variables, and self-rated physical health (OR linear = 1.01, p = .63; OR squared = 1.10, p < .001; see Figure S3, Supplementary Materials).
Time-Dependent Cox Proportional Hazard Model, Study 2.
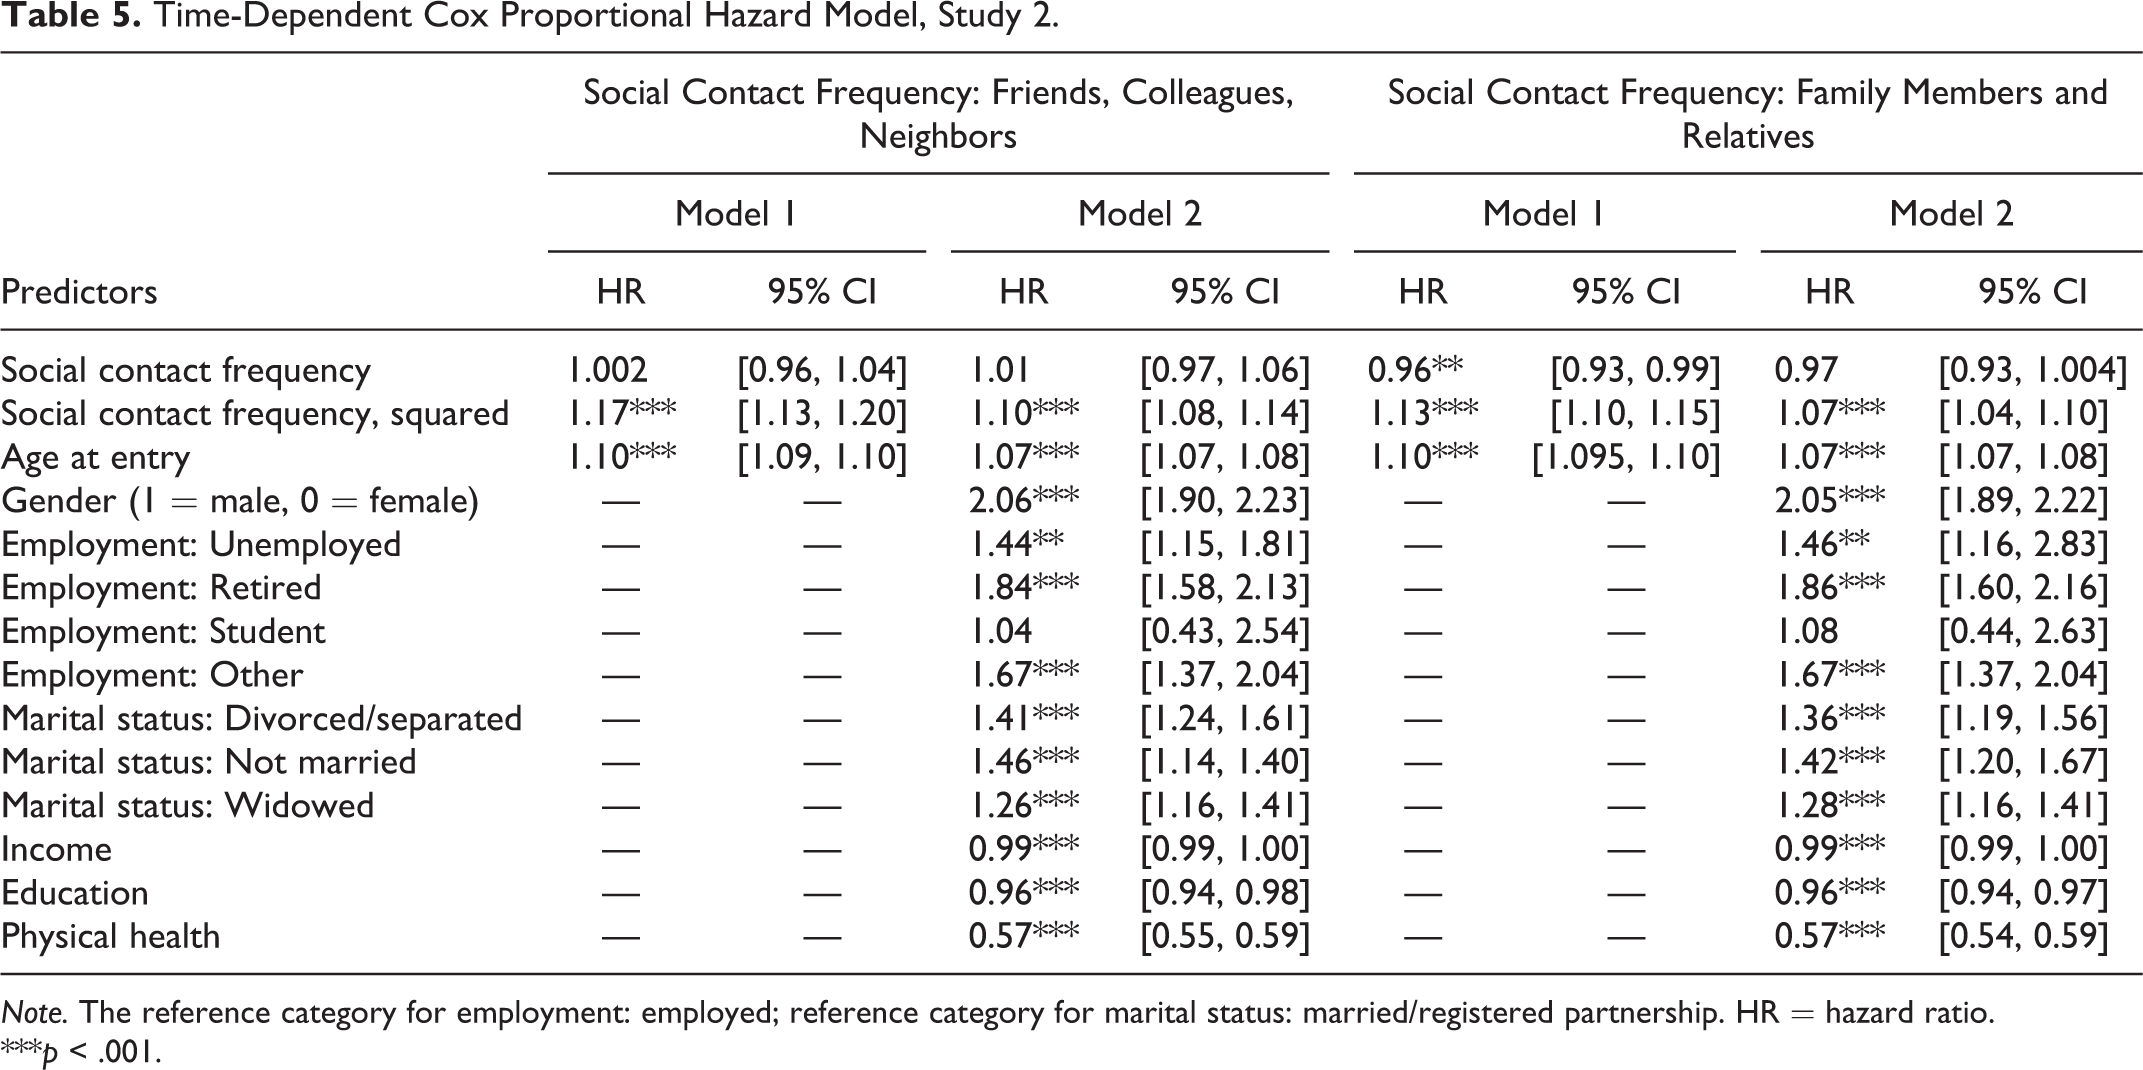
Note. The reference category for employment: employed; reference category for marital status: married/registered partnership. HR = hazard ratio.
***p < .001.
To examine the shape of this effect, we plotted the survival curves for each level of the frequency of social contacts with friends, colleagues, and neighbors. These results are shown in Figure 6. We used a log-rank test to compare the survival curves. Given the number of comparisons, we adjusted the α level to .005 (.05/10 comparisons). For all contact categories, the survival rate decreases as time goes by. However, the decrease is the steepest for individuals who indicated to never meet with friends, colleagues, and neighbors (black line). Individuals with a moderate (monthly and weekly, blue and yellow lines, respectively) contact frequency showed the highest survival rate. Given the large sample size, all pairwise comparisons of the survival curves reached the adjusted level of significance (all ps < .005), except for the comparison between monthly and weekly (p = .40).
We repeated these analyses using the other type of social contacts—socially meeting with relatives and family members. Model 1 showed significant linear and quadratic effects (OR linear = 0.96, p = .008; OR squared = 1.13, p < .001; Table 5). Controlling for sociodemographic and economic information, as well as for self-rated physical health, rendered the effect of the linear but not the quadratic term of social contact frequency nonsignificant (OR linear = 0.97, p = .077; OR squared = 1.07, p < .001; see Figure S3, Supplementary Materials).
Figure 6 demonstrates that the lowest (never) frequency of social contacts (black line) is associated with the steepest survival rate. Pairwise comparisons revealed that the survival curve of individuals with the lowest contact frequency (never) was significantly steeper than the survival curves of the remaining four levels of contact (ps < .001). The survival curve of individuals with the highest contact frequency (daily) did not significantly differ from the survival curves of individuals with more moderate (weekly, monthly, seldom) contact frequency (ps > .005).
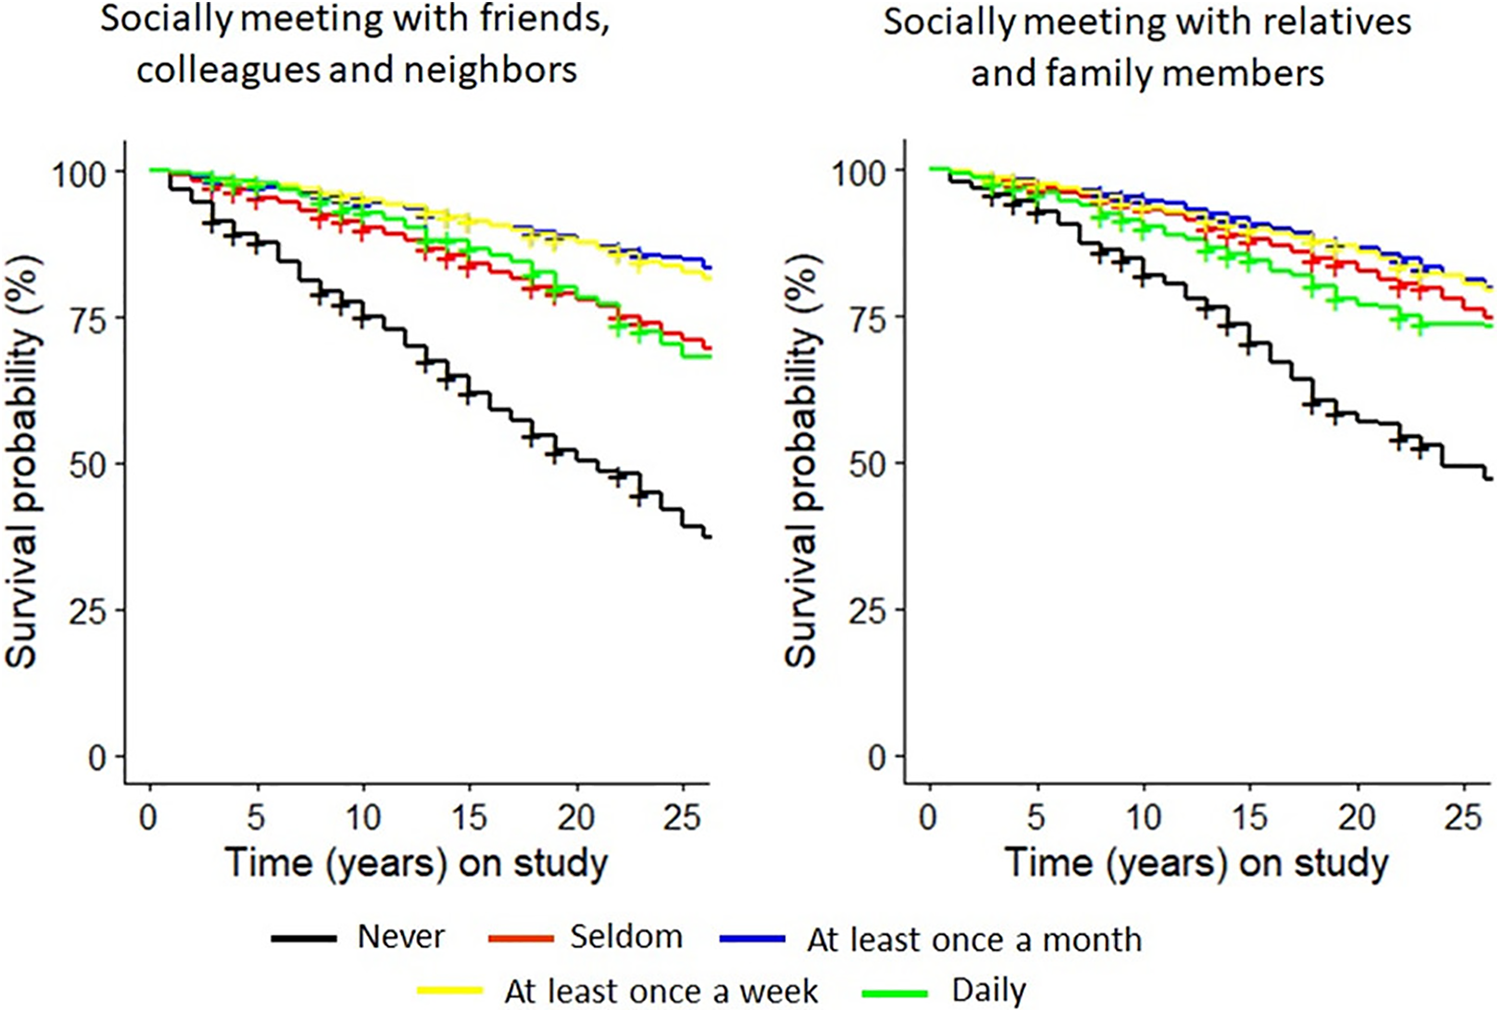
Survival curves for different levels of social contact frequency.
Comparing linear and quadratic models
A likelihood ratio test showed that the quadratic model (that included age, the linear and the quadratic terms of contact frequency) fitted the data better than the linear model (that included age and the linear term of contact frequency), for both contact with friends/neighbors/colleagues, χ2(1) = 114.11, p < .001, and family/relatives, χ2(1) = 78.36, p < .001.
Discussion
Study 2 showed that the highest (daily) frequency of social contact is not associated with substantially better health and longer life than the moderate (monthly) frequency. In fact, interaction frequency beyond a certain point (e.g., daily) can even be associated with higher mortality risks and lower survival time.
General Discussion
Aristotle (1999) claimed that any generally advantageous behavior when exercised above or below a certain level can turn disadvantageous and destroy health. In the present research, we examined whether this observation is true with respect to the frequency of social interactions. Study 1, based on survey responses of about 390,000 individuals from 37 countries, demonstrated that higher frequency of social contacts was positively associated with self-rated physical health. However, once the frequency of social contacts reached a moderate level (monthly or weekly), its positive association with health flattened out.
Study 2 extended these findings to longitudinal and mortality data. Using the data from about 50,000 individuals followed for up to 27 years, it showed that although greater contact frequency was prospectively associated with better health, increasing the frequency of social interactions beyond a moderate level (e.g., to daily frequency) was no longer associated with better health and was even related to higher mortality risks.
We consider these effects to be meaningful and practically important. For example, increasing the frequency of contact with friends, colleagues, and neighbors from never to monthly and from monthly to daily was associated with a 10% decrease and an 8% increase in the mortality risk, respectively (Figure 4). These effects are comparable to those of other well-established predictors of mortality, such as gender (e.g., in Study 2, being male (vs. female) was associated with a 4% higher mortality risk) or marital status (in Study 2, being married was associated with a 3% lower mortality risk than being not married). These results are not only important for current theories of health and well-being but can also inform intervention work by helping practitioners setting the target level of contact for reaching the greatest benefits of social interaction interventions.
Could this nonlinear pattern be explained by the possibility that highly (vs. moderately) frequent social contact is a reflection of poor health in the first place? For example, as individuals approach death and their health deteriorates, they might be more likely to need and seek particularly intensive (e.g., daily) contact and support. To test this possibility, we made use of the longitudinal data in Study 2 and examined whether worse health at t − 1 predicted higher contact frequency at t, when controlling for contact frequency at t − 1. With respect to contact with friends, colleagues, and neighbors, we found that worse health at t − 1 predicted less (not more) contact at t. With respect to contact with family members and relatives, the association between health and contact frequency was flat, except for the lowest level of health: extremely poor health at t − 1 was associated with decreasing (not increasing) contact frequency with family members at t (Figure S4 and Tables S2 and S3). In summary, if anything, these results suggest that deteriorating health (e.g., approaching death) is prospectively associated with decreasing (not increasing) contact frequency. This is not consistent with the alternative explanation according to which the positive effect of increased contact on mortality is driven by individuals having more frequent contact with family and relatives when their health deteriorates. Nevertheless, given the nonexperimental nature of the present data, we emphasize that the positive association between high (vs. moderate) contact frequency and mortality risks might still be driven by further unexplored third variables and should therefore be interpreted carefully.
Why isn’t daily socializing particularly healthy? Social ties have been linked to a higher likelihood of following a healthy lifestyle including more physical exercise, a healthy diet, and more regular medical screening behaviors (Umberson et al., 2010). Potentially, executing these healthy behaviors beyond a certain level (e.g., more often than recommended medical screening) is simply not incrementally beneficial for health.
In addition, a particularly high (vs. moderate) frequency of social contacts may be associated with social contacts of lower quality. In a similar vein, daily social contacts might be stressful and the stress counteracts the potential positive effects that social relationships typically bring along. If daily socializing is stressful, why don’t people just bring the frequency of social contacts down to a level that they are more comfortable with? One possibility is that even though daily socializing might be stressful, individuals might not perceive it as such. People are generally not very skilled in predicting what will make them happy (Wilson & Gilbert, 2005) and might be bad at calibrating their social contacts to serve their needs in an optimal way. Alternatively, individuals might maintain a particularly high frequency of social contacts not because that’s what they want but because that’s what they have to do. We hope that further studies would shed light on social or cultural norms that could prescribe individuals to socialize with others beyond the personally comfortable level. While the results of Study 1 provided initial evidence of the generalizability of the nonlinear effect of contact frequency on health across 37 counties, there might still be differences in the size of this effect across countries and cultures. Identifying the sociocultural factors that could explain these differences could be an interesting endeavor for future studies.
While the present studies focused on social contact frequency, exploring whether a similar nonlinear pattern will emerge with respect to other dimensions of social relationships, in particular, relationship quality (e.g., closeness, satisfaction) represents an important step for future studies. Similarly, the measures of social contact in the present studies did not properly differentiate between different targets (e.g., friends, colleagues, and neighbors). Hence, more fine-grained and comprehensive measures (e.g., the Social Network Index; Cohen et al., 1997) are needed to be able to compare the effect of contact with different others.
It is noteworthy that across the studies, types of contact, and dependent measures, the data fitted the nonlinear (quadratic) model better than the linear one. At the request of an anonymous reviewer, we additionally examined the model performance in out-of-sample data, using 10-fold cross-validation (Kuhn & Johnson, 2013). This procedure entails using a part of the data to obtain model parameters (i.e., regression coefficients) and then using these model parameters to obtain predicted values of the outcome variable (e.g., health) in the rest of the data (out-of-sample data). The details of these analyses are shown in the Supplementary Materials. In brief, the out-of-sample performance of the quadratic model was comparable to the level of accuracy obtained in previous research that used behavioral variables to predict individual differences (e.g., Matz et al., 2019; Park et al., 2015; Youyou, Kosinski, & Stillwell, 2015). However, it was not substantially better than the performance of the linear or the null model (i.e., model without any predictors). Potentially, models built to explain behavior might not do a great job predicting it in out-of-sample data (Yarkoni & Westfall, 2017). We hope that future research will test whether more complex predictive models (e.g., random forest) would attain better accuracy.
Conclusions
Our results showed that higher frequency of social interactions is not necessarily associated with the best outcomes. Instead, a more moderate frequency of social contacts can be considered optimal: Socializing with others on a weekly or even monthly basis seems to be sufficient to yield the health benefits often associated with social relationships. A higher (e.g., daily) frequency of social contacts is no longer associated with better health and is even related to higher mortality risks.
Supplemental Material
Supplemental Material, SOM_final - Is More Always Better? Examining the Nonlinear Association of Social Contact Frequency With Physical Health and Longevity
Supplemental Material, SOM_final for Is More Always Better? Examining the Nonlinear Association of Social Contact Frequency With Physical Health and Longevity by Olga Stavrova and Dongning Ren in Social Psychological and Personality Science
Footnotes
Declaration of Conflicting Interests
The author(s) declared no potential conflicts of interest with respect to the research, authorship, and/or publication of this article.
Funding
The author(s) received no financial support for the research, authorship, and/or publication of this article.
Supplemental Material
The supplemental material is available in the online version of the article.
Notes
References
Supplementary Material
Please find the following supplemental material available below.
For Open Access articles published under a Creative Commons License, all supplemental material carries the same license as the article it is associated with.
For non-Open Access articles published, all supplemental material carries a non-exclusive license, and permission requests for re-use of supplemental material or any part of supplemental material shall be sent directly to the copyright owner as specified in the copyright notice associated with the article.