
Abstract
In four experiments, students read that their university was creating either an ethnic space (a space geared to people of particular ethnic groups) or a general space for students. In an internal meta-analysis, underrepresented students of color (N = 205), but not White students (N = 760), who read about the ethnic space reported greater belonging, value of underrepresented students by the university, support, and academic engagement compared to those who read about a general space. Ethnic spaces may hold broader psychological significance than that of mere gathering places, improving outcomes even for those who do not frequently use them. Creating ethnic spaces may be one strategy for making university environments more welcoming for underrepresented students of color.
Many universities create physical spaces for groups that are underrepresented. For example, 18 of the top 26 universities on U.S. News and World Report’s (2020) undergraduate rankings advertise a space for underrepresented students of color such as an ethnic cultural center or Casa Latina. These ethnic spaces espouse goals such as promoting the academic, personal, and professional growth of students. However, they are controversial because they are perceived as limiting interaction across student identities and committing resources to a subset of students (Afshar-Mohajer & Sung, 2002; DePalma, 1991; Gettinger, 2010; Jaschik, 2016). Indeed, some policymakers have called for their elimination (Jaschik, 2016). Universities faced with shrinking budgets may be tempted to stop funding them, especially if they appear underused.
We suggest that critics of these types of ethnic spaces may be missing part of the picture. By thinking about them as gathering places catering to a small group of students of color who use them (e.g., Gettinger, 2010), the debate is necessarily focused on users of the spaces. However, ethnic spaces may also have symbolic value because their presence signals that underrepresented students of color belong in the broader university context and are valued. Benefits of ethnic spaces may thus extend beyond regular users to two other populations: (a) those who possess an identity for which the space is intended but do not frequently use the space and (b) those who receive reminders about the space, even if they may already know about it. In university contexts where students of color are vastly underrepresented, ethnic spaces may hold broader psychological significance than that of mere gathering places.
The need to belong is a fundamental human motivation (Baumeister & Leary, 1995), but belonging may not come easily for people who have been historically devalued in a domain. In particular, students of color have concerns about belonging in educational contexts, where they are often underrepresented and face negative stereotypes (Shapiro & Neuberg, 2007; Sinclair & Kunda, 1999; Steele et al., 2002). Accordingly, when entering these contexts, they look for ways to feel valued and accepted (Schmader & Sedikides, 2017).
Institutions can increase sense of belonging by having cues that validate people’s identities. For members of underrepresented groups, such cues include diversity-focused recruitment materials (Brady et al., 2015; Purdie-Vaughns et al., 2008), inclusion in curricula (Brannon et al., 2015), and visible demographic diversity (Murphy et al., 2007; Unzueta & Binning, 2012). The presence of these cues improves outcomes such as belonging and performance for members of groups underrepresented in those institutions.
Physical cues influence institutional outcomes as well. Women perceive greater belonging in computer science when objects in computer science classrooms and companies are less stereotypically masculine (e.g., art posters vs. Star Trek posters; Cheryan et al., 2009). Similarly, religious minorities (i.e., non-Christians in Canada) report greater belonging in neutral spaces than spaces with Christmas decorations (Schmitt et al., 2010). Physical cues of inclusion also lead to better performance and engagement for underrepresented students (Cheryan et al., 2009; Master et al., 2016; Murphy et al., 2007; Schmitt et al., 2010).
Involvement in ethnic organizations is one source of belonging and support for underrepresented students of color. For example, African Americans who engage with ethnic organizations and curricula show a greater sense of academic fit, creativity, and persistence on math and verbal tasks relative to those who do not (Brannon et al., 2015). Engagement with ethnic organizations is also associated with academic persistence and feelings of involvement in university (Reyes, 1997), while also facilitating relationships with ethnically similar peers and faculty (Guiffrida, 2003). At the same time, engagement in ethnic organizations may hinder positive interactions with the majority group (Sidanius et al., 2004). Thus, engagement in ethnic organizations increases belonging and fit with others involved in those organizations but may also decrease the potential for relationships with out-group students.
This research examines how ethnic spaces influence underrepresented students’ outcomes at the university as a whole. Whereas users of ethnic spaces may be a relatively small group, considering the symbolic value widens the potential pool of beneficiaries to all underrepresented students of color aware of the space. With this line of thinking, creating ethnic spaces would benefit many underrepresented students of color, not just those who regularly use them.
Studies 1–4: Approach and Method
Students read that their university was creating a space—either an ethnic space or a general space—and then reported belonging, value of underrepresented students, support, campus and academic engagement, and academic expectations. We expected that reading about an ethnic space would lead underrepresented students of color to (a) perceive greater belonging, value of underrepresented students, and support; (b) anticipate greater campus and academic engagement as well as increased academic expectations; (c) experience benefits irrespective of ability to use the space; (d) experience benefits irrespective of intentions to use the space; and (e) experience benefits even if they already know about the space. To restrict participants’ ability to use the space (point c), in some studies, we told participants that the construction projects would not be completed until a few years in the future, preventing current students from having an opportunity to use them. To examine intentions to use the space (point d), we measured the extent to which participants anticipated using the space.
To address an alternative explanation for the benefits of ethnic space, we measured perceptions of underrepresentation on campus to determine whether the presence of ethnic space signaled that the university had a higher proportion of underrepresented students. Finally, we included White students in these experiments to understand how they react to knowledge that their university is creating an ethnic space. Although we did not expect that ethnic space would benefit White students, we did expect that they would report that the institution values underrepresented students more than when reading about a general space.
Meta-Analytic Approach
We conducted four experiments that we meta-analyzed rather than presenting each study individually because (a) methods were similar across studies and (b) individual studies had small sample sizes, due to the focus on groups that were especially underrepresented on their university campus (10% underrepresented students of color; University of Washington Office of the Registrar, 2010). Our meta-analytic approach is consistent with current recommendations to conduct a mini meta-analysis when presenting multiple studies, particularly for underpowered samples (Goh et al., 2016; Lakens & Etz, 2017). We included all studies and dependent measures that tested our space hypotheses, including those without statistically significant findings.
Participants
Across Studies 1–4, 205 underrepresented students of color 1 (88 Black, 89 Latinx, 17 multiethnic, 2 and 11 Native American) and 760 White students in the United States (see Table 1 for breakdown by study) were recruited during a mass testing session in an introductory psychology course or in locations on the University of Washington (UW) campus. Sample sizes were determined by the number of students present at mass testing. However, Studies 1–3 were supplemented with data collection around campus. Participants included 563 women and 402 men with a mean age of 18.79 to 19.69 years. Achieved statistical power by study is reported in Table 2.
Demographic Characteristics Across Studies.
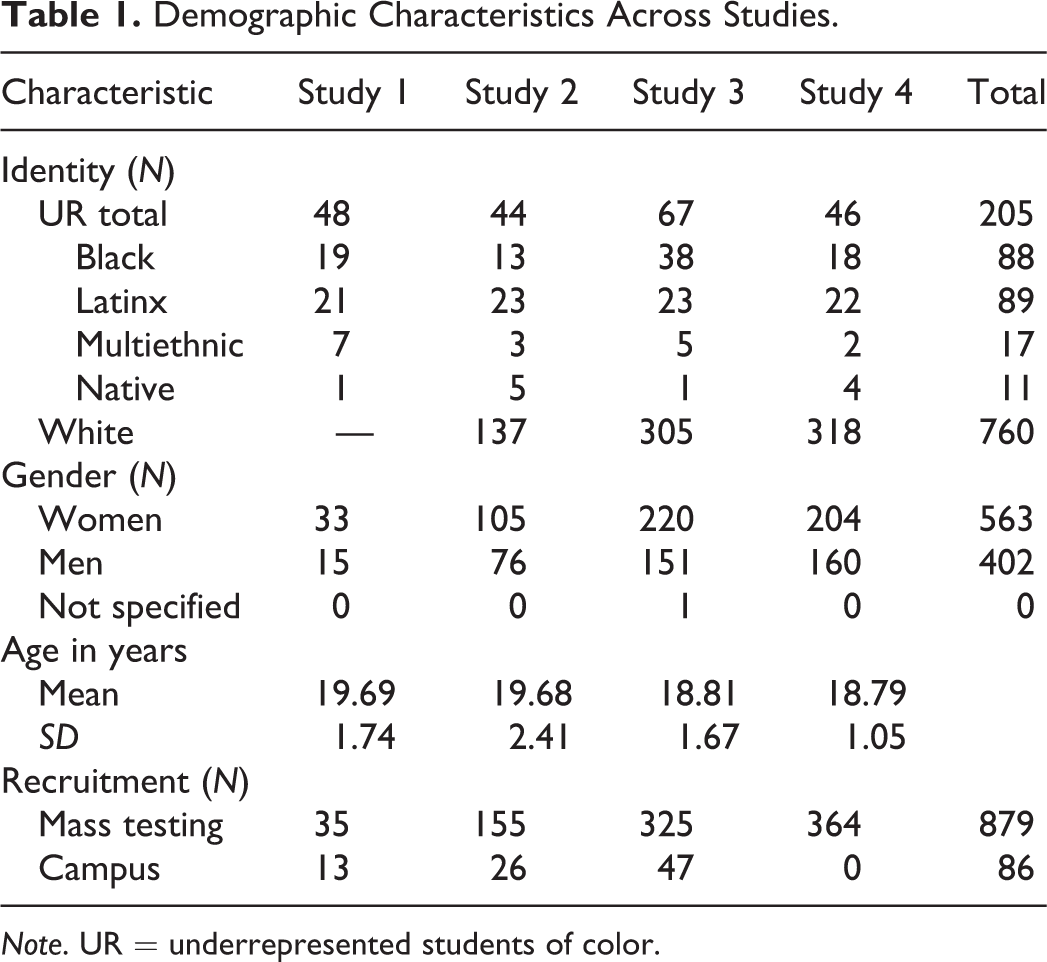
Note. UR = underrepresented students of color.
ANOVA Results (Effect Sizes and p Values) and Achieved Power Across All Experiments.
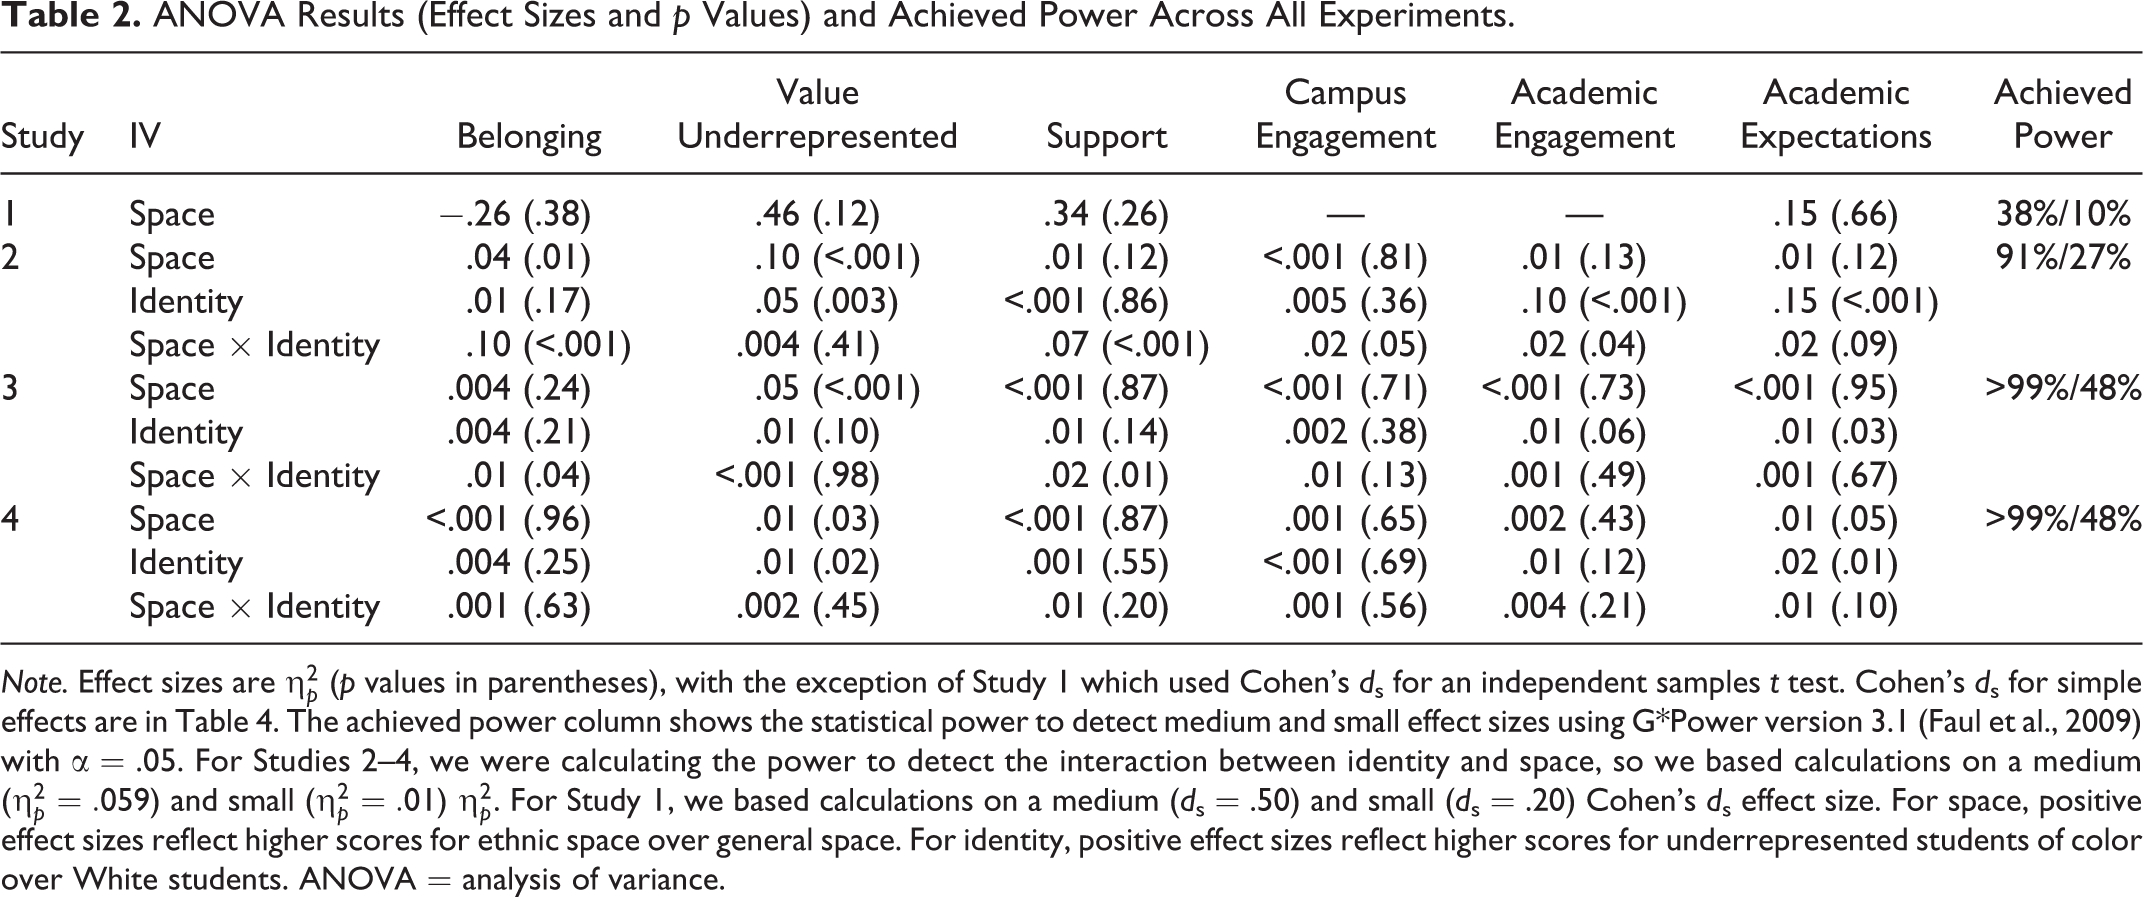
Note. Effect sizes are
Design and Time Line of Studies
All studies had a 2 (Space: ethnic vs. general) × 2 (Identity: underrepresented vs. White) between-participants design, with the exception of Study 1, which only included underrepresented students of color. The studies capitalized on the fact that new buildings were going to be constructed on campus, one targeted to underrepresented students of color (an ethnic cultural center) and one targeted to all students (a student union building). These new buildings were expansions of smaller spaces that already existed on campus.
Construction had not been widely announced to students when Study 1 was conducted, but students were largely aware of the new buildings by the start of Study 2. We measured knowledge of the construction projects to ensure that it did not account for differences in Study 2.
Procedure
Students were randomly assigned to read that their university was creating an ethnic student center or a general student center (full manipulation text is in the Online Supplemental Material; materials and data are available at https://osf.io/8ar6j/). The description of the general student center in all studies was identical to that of the ethnic center description except that it removed words (indicated with brackets below) such as “ethnic” and “cultural” and replaced them with words such as “student” and “union” when appropriate.
In Study 1, students imagined that the university was creating a “new student resource center for all members of the campus [specifically for members of your ethnic group].” 3 In Study 2, participants read about the history, design, and goals of the previous center (e.g., a Husky Union Building [an “Ethnic Cultural Center] that promotes an inclusive and educational environment…and exchange of multiple [multicultural] perspectives and values”). They then read about construction of a new center with a similar purpose. Construction was said to begin in 6 months to test the benefits of reading about a space not immediately available for use. Materials were modeled after the original email sent to students and staff announcing construction of the ethnic cultural center (ECC; e.g., “Last spring, the ECC received over US$15 million from the Services and Activities Fee Committee to construct a brand new three-story, 25,000-square foot building”).
In Study 3, we asked participants to imagine that an “[ethnic] student resource center would exist to help [underrepresented] students navigate the college experience.” We used a more stringent test of benefits to non-users by stating that construction would start in 5 years. The new building was described as costing US$10 million. A visual rendering of the planned space was also included. Finally, Study 4 asked participants to imagine a “new resource center for prospective [ethnic minority] students (i.e., [ethnic minority] students who are currently in high school).” The space focused on high school students so that our university sample would be non-users of the space.
In Studies 1 and 4, participants completed demographic questions before reading about the space. In Studies 2 and 3, they completed demographic questions after other measures.
Measures
In Studies 1 and 4, participants responded to all questions on a 1 (not at all) to 7 (very much) scale, unless otherwise noted. In Studies 2 and 3, they responded compared to how they felt before knowing about the new building, using a 1 (much less than before) to 7 (much more than before) scale. The exact wording and items included varied across studies. Table 3 shows individual items comprising each measure along with scale reliabilities by study. Other items irrelevant to the hypotheses were included in all studies (e.g., in Studies 1, 3, and 4, “What percentage of UW students do [would] you think are [were] of your ethnic background?”; in Studies 2–4, “What spaces [campus resources] currently exist for underrepresented students?”). These items were intended to be attention checks, to gauge awareness of the campus context, or as demographic or individual difference information.
Dependent Measures in Studies 1–4.
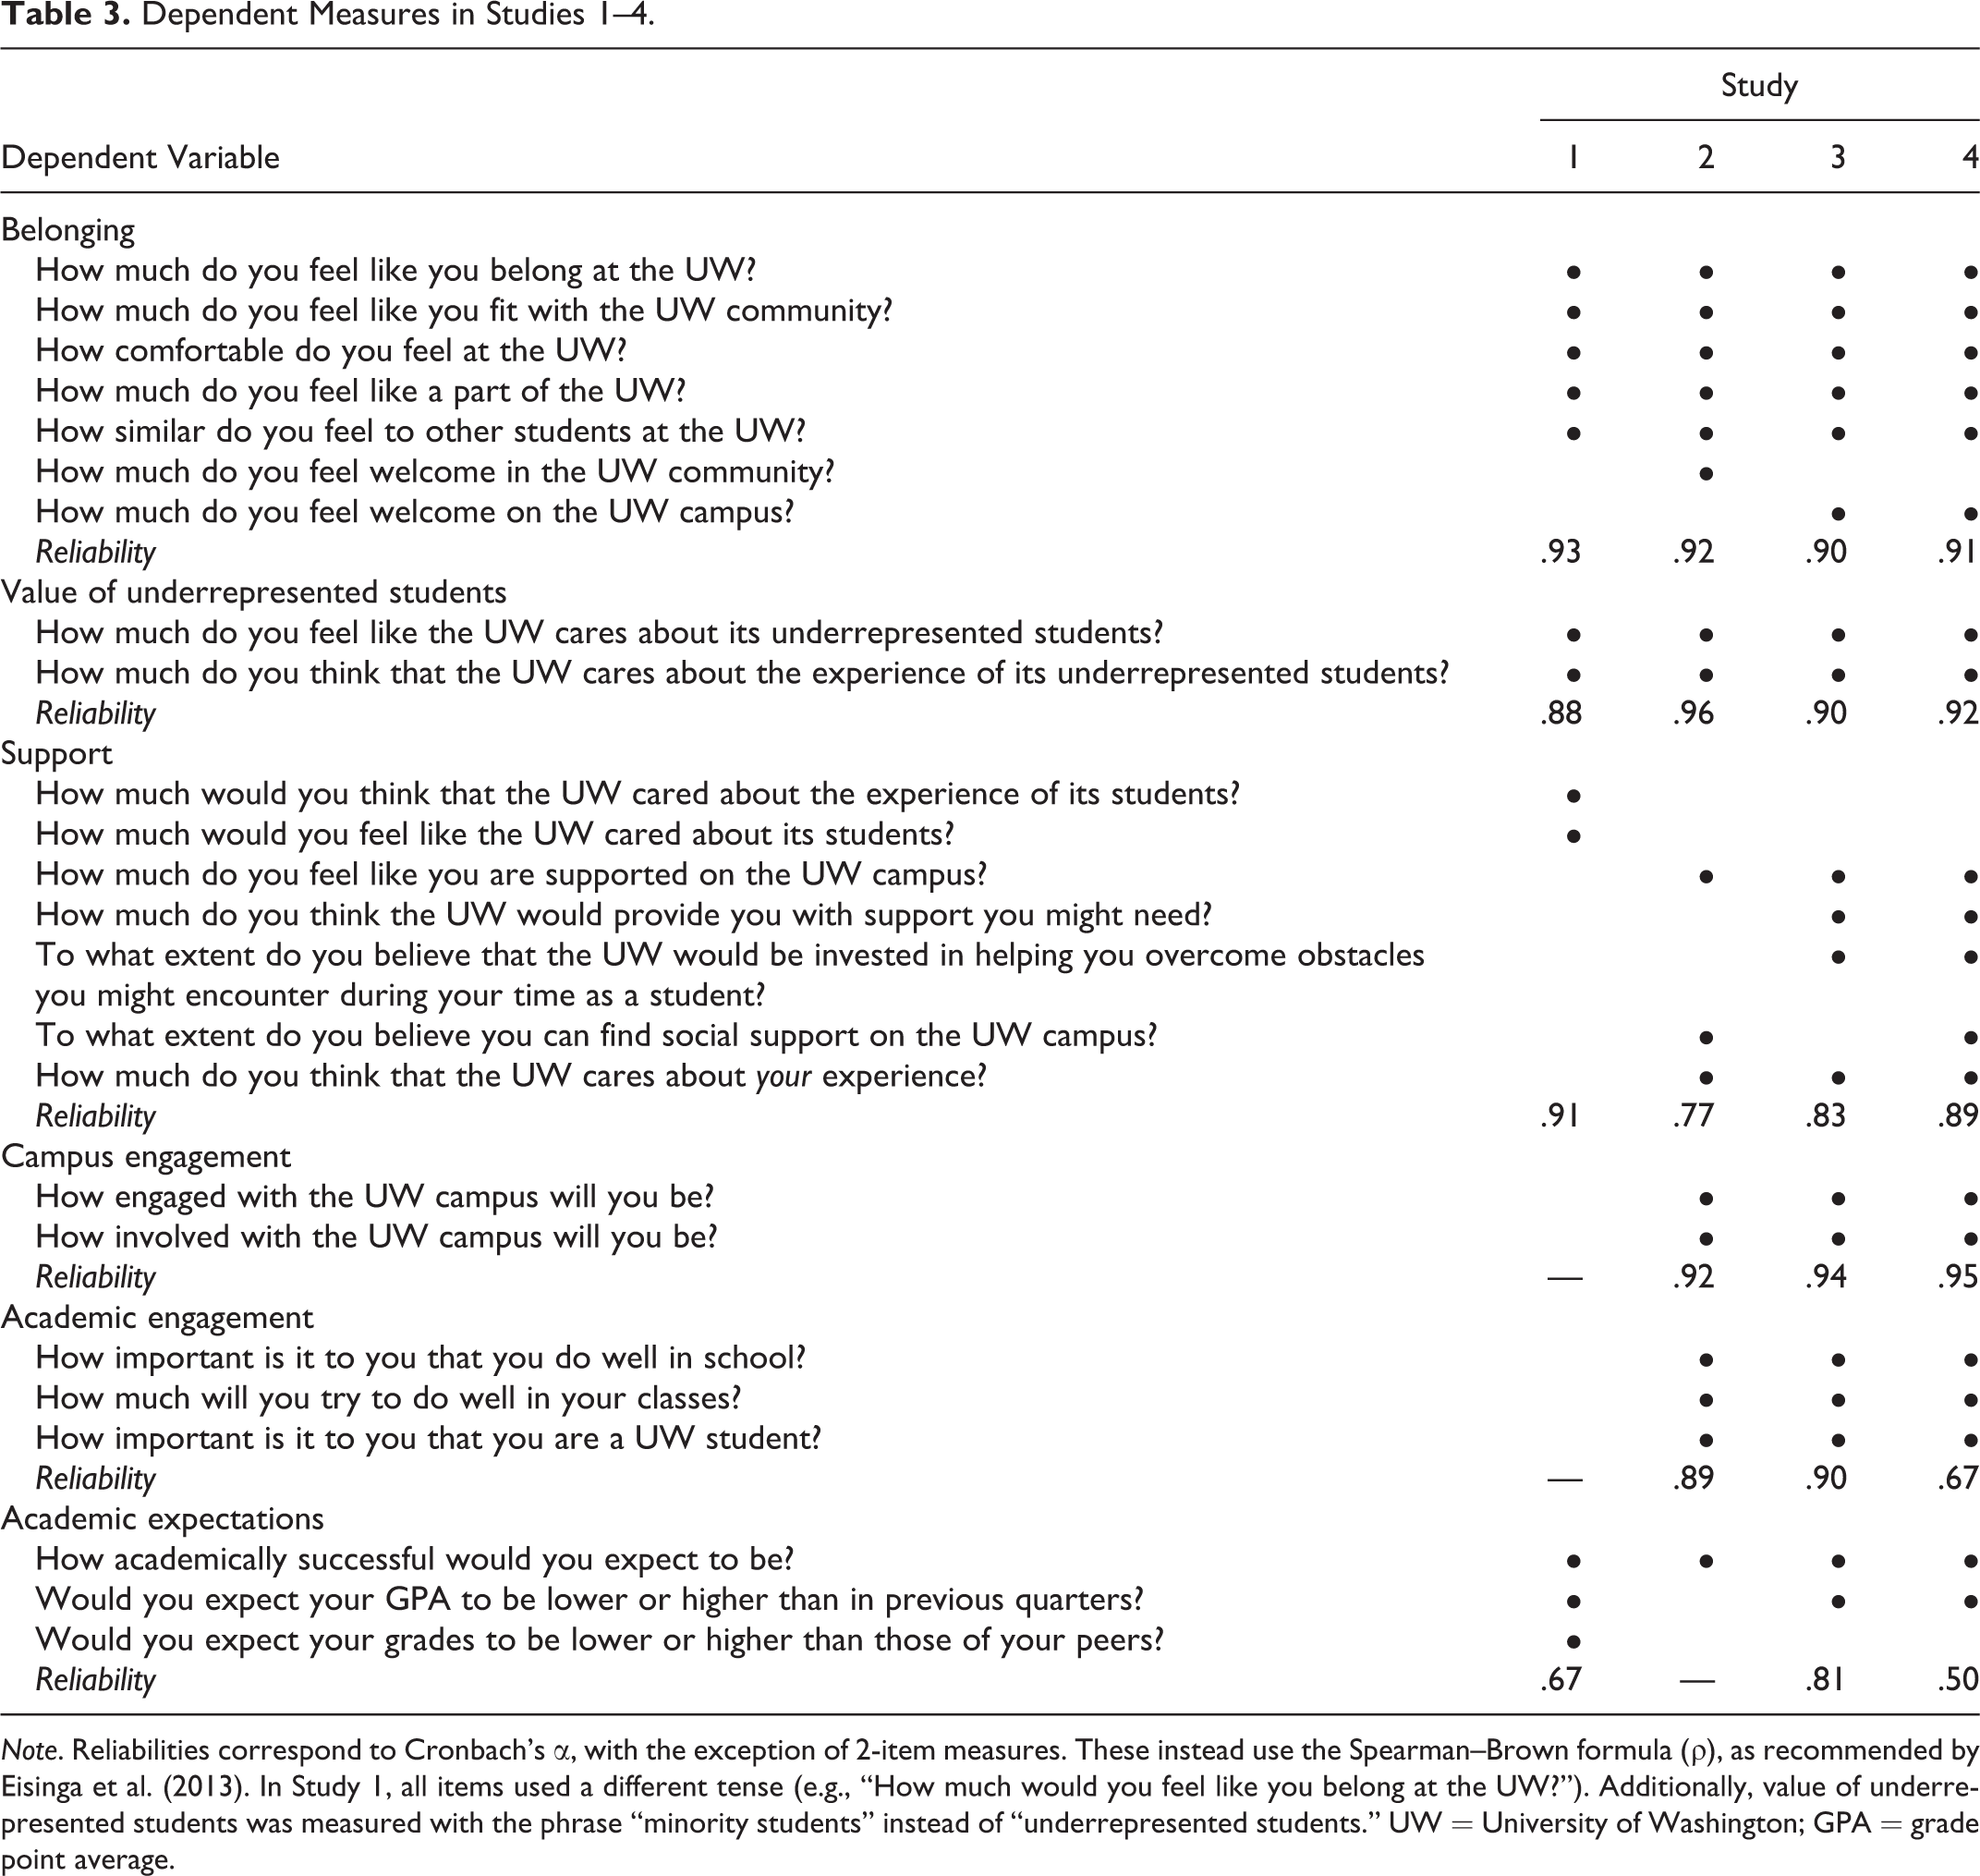
Note. Reliabilities correspond to Cronbach’s α, with the exception of 2-item measures. These instead use the Spearman–Brown formula (ρ), as recommended by Eisinga et al. (2013). In Study 1, all items used a different tense (e.g., “How much would you feel like you belong at the UW?”). Additionally, value of underrepresented students was measured with the phrase “minority students” instead of “underrepresented students.” UW = University of Washington; GPA = grade point average.
Belonging
Belonging at their university was assessed with 5–6 items (e.g., “How much do you feel like you belong at the UW?”; adapted from Walton & Cohen, 2007).
Value of underrepresented students
Perceptions of how much the university values its underrepresented students were assessed with 2 items (e.g., “How much do you feel like the UW cares about its underrepresented students?”).
Support
Perceptions of support within and from the university were assessed with 2–5 items (e.g., “How much do you feel like you are supported on the UW campus?”).
Campus engagement
Campus engagement was assessed with two questions in Studies 2–4 (“How engaged with the UW campus will you be?”; “How involved with the UW campus will you be?”).
Academic engagement
Academic engagement was measured using 3 items in Studies 2–4 adapted from Walton and Cohen’s (2007) academic identification measure (e.g., “How important is it to you that you do well in school?”).
Academic expectations
Academic expectations were measured with 1–3 items (e.g., “How academically successful would you expect to be?”; “Would you expect your GPA [grade point average] to be lower or higher than in previous quarters?”; and “Would you expect your grades to be lower or higher than those of your peers?”). A scale of 1 (much lower) to 7 (much higher) was used for the second item in Studies 1, 3, and 4 and for the final item in Study 1.
Perceived underrepresentation
To determine whether benefits of ethnic spaces could be attributed to a perceived increase in the proportion of underrepresented students on campus (Murphy et al., 2007), we asked students, “What percentage of UW students do you think are from underrepresented groups?” in an open-ended format. In Study 1, we asked, “What percentage of UW students would you think were ethnic minorities?”
Usage and knowledge of space
In Studies 1–2, we asked, “How much would you expect to use the student resource center (Study 1)/new building (Study 2)?” to understand their anticipated usage of the space. Students responded to a similar question in Study 3 (“Do you expect to utilize the space?”) with yes (1) and no (0) as response options. In Study 2, we also asked, “Have you heard about this construction project before today?” with the option to respond yes or no. These questions were included as potential covariates or moderators.
Manipulation check
Participants responded to an open-ended question about the purpose of the space (e.g., “Who would be served by this resource center?”; What is this new space for?”).
Results
All data sets and materials are available at https://osf.io/8ar6j/.
Manipulation Checks
Open-ended answers revealed that a large majority of participants (67%–94% across studies) demonstrated an understanding of the space as geared toward people in general or toward particular ethnic groups (by explicitly mentioning underrepresented ethnic groups or people of color in the latter case). Those who did not show clear evidence of understanding their condition neglected to respond at all, gave an irrelevant response, or gave a relevant response but neglected to mention underrepresented students of color specifically in the ethnic space condition. To maximize statistical power, we retained all participants in the analyses below.
Knowledge of Space
In Study 2, most students who read about the general space expressed awareness of the upcoming general student center construction project, and it was comparable for underrepresented students of color (75%) and White students (91%), χ2 = 3.18, p = .07. Among those who read about the ethnic student center, underrepresented students of color demonstrated much greater awareness of the new ethnic cultural center construction (70%) than did White students (21%), χ2 = 18.71, p < .001 (overall χ2 = 6.25, p = .01). Including knowledge of the construction project as a covariate in Study 2 analyses did not change the interpretation of results below, with the exception of campus engagement. The interaction between space and identity was no longer statistically significant for that measure, p = .11.
Main Analyses
Analysis of variance (ANOVA) statistics for individual studies are presented in Tables 2, 4, 5 for all dependent variables. ANOVAs tested main effects of space (general space = 0; ethnic space = 1) and identity (White = 0; underrepresented = 1) as well as the interaction between space and identity (Table 2). Simple effect analyses for effects of space separated by identity are presented in Table 4.
Descriptive Statistics and Simple Effect Analyses for Space on Dependent Variables by Identity.
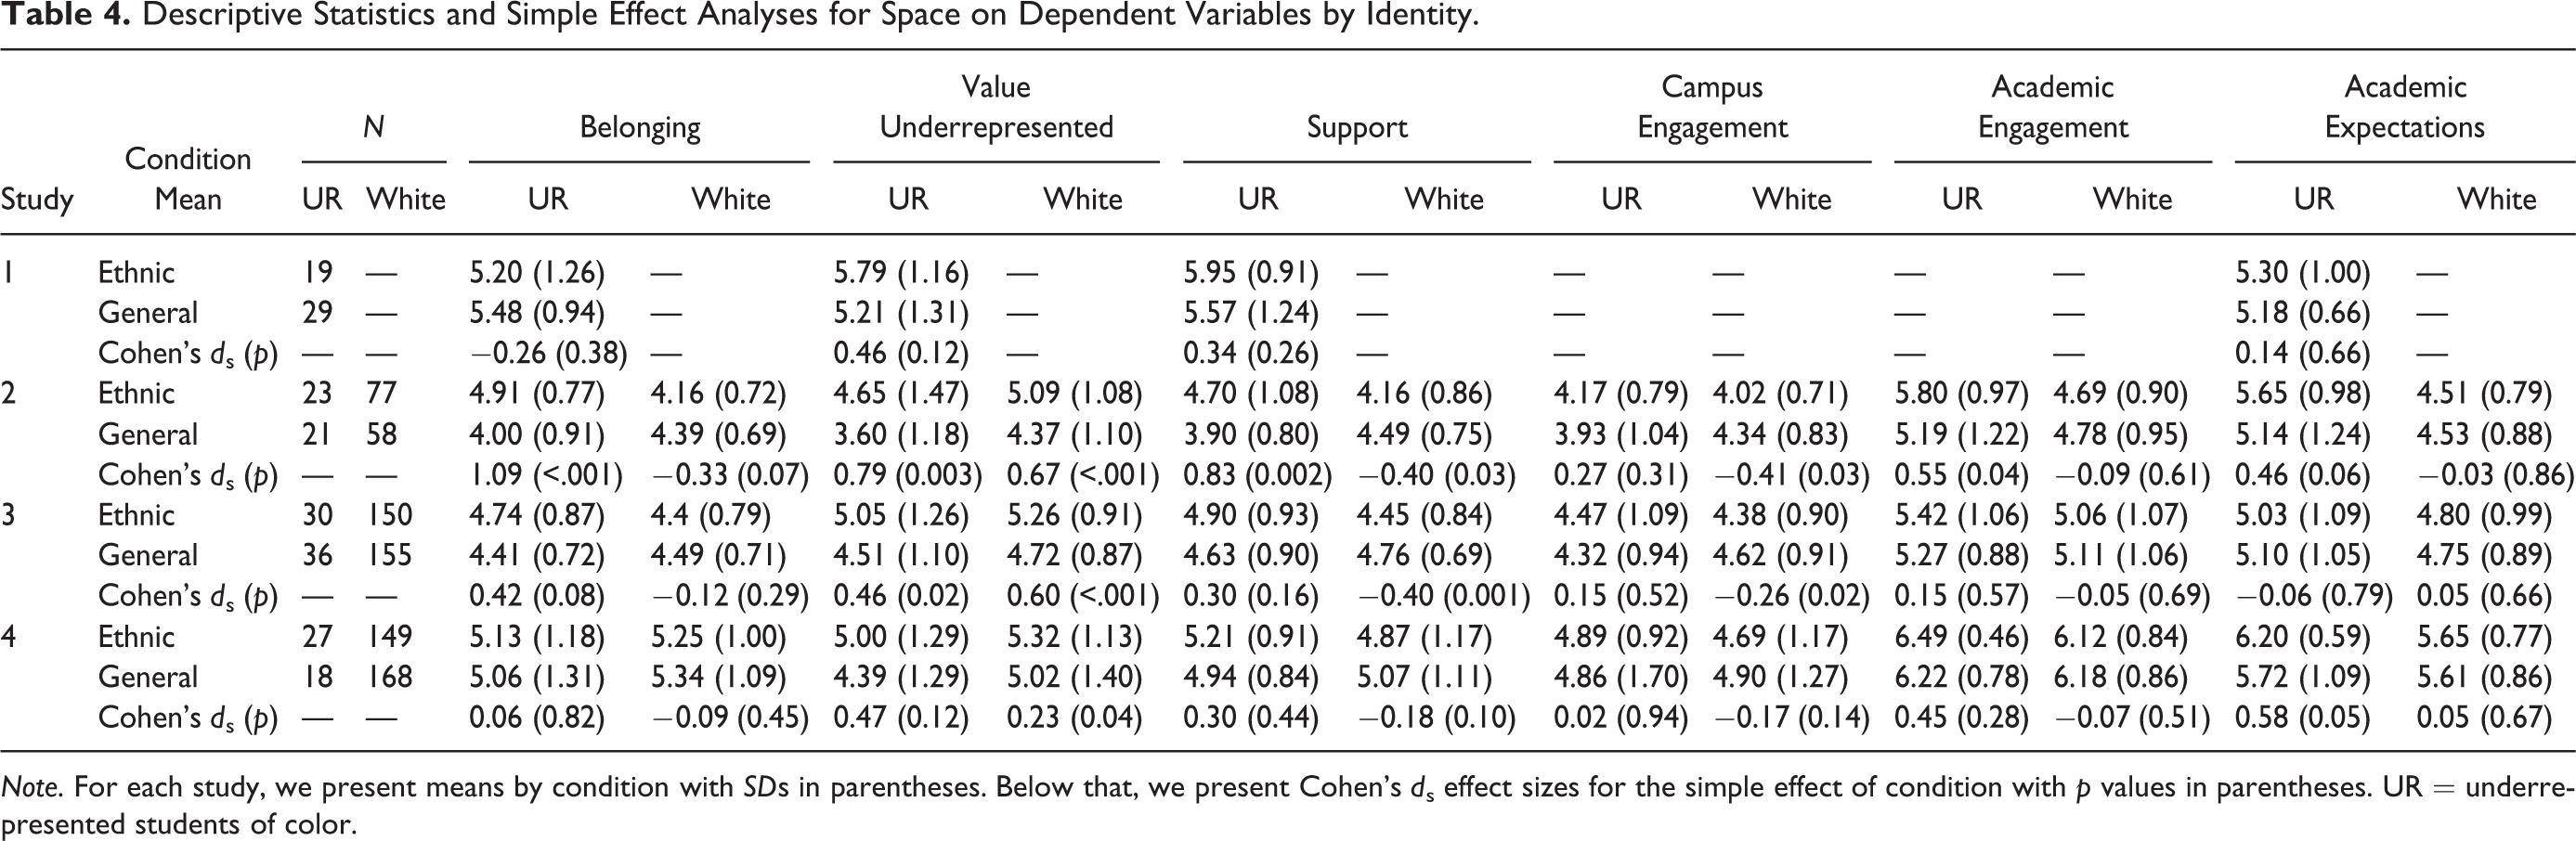
Note. For each study, we present means by condition with SDs in parentheses. Below that, we present Cohen’s d s effect sizes for the simple effect of condition with p values in parentheses. UR = underrepresented students of color.
ANOVA Results (Effect Sizes and p Values) for Alternative Explanation (Perceived Underrepresentation) Across All Experiments.
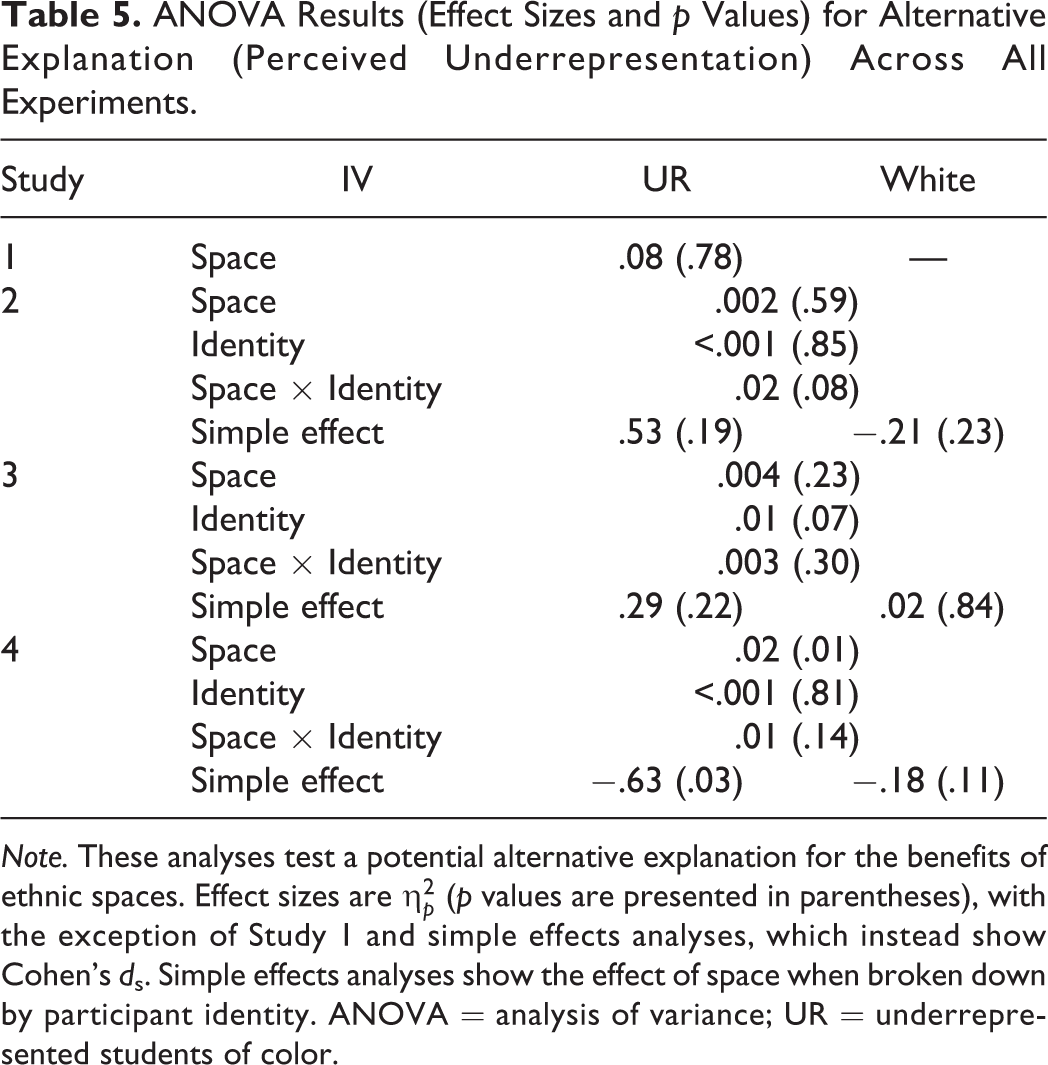
Note. These analyses test a potential alternative explanation for the benefits of ethnic spaces. Effect sizes are
Meta-analyses of the effects of space
Meta-analyses tested effects of space (general space = 0; ethnic space = 1) for underrepresented students of color (1) compared to Whites (0), separately for each dependent variable (belonging, value of underrepresented students, support, campus engagement, academic engagement, and academic expectations). All meta-analyses used fixed-effects models, which are appropriate when a meta-analysis has a small number of effect sizes (Borenstein et al., 2009), and were conducted with the MetaF.sps SPSS macro (Lipsey & Wilson, 2001; Wilson, 2005).
We calculated achieved meta-analytic power for underrepresented students of color to detect a medium and small Cohen’s d s for the effect of space using the shinyapp provided by Tiebel (2018). To detect a medium effect (d s = 0.50), achieved power ranged from .94 (when assuming no heterogeneity in the meta-analysis) to .43 (assuming high heterogeneity). To detect a small effect (d s = 0.20), achieved power ranged from .30 (assuming no heterogeneity) to .11 (assuming high heterogeneity).
Do underrepresented students of color and White students respond differently to space?
Consistent with hypotheses, the meta-analysis showed a significant Space (ethnic, general) × Identity (underrepresented, White) interaction on belonging, support, campus engagement, and academic engagement (as indicated by between-groups heterogeneity tests comparing underrepresented students of color to White students; see Table 6). Also consistent with hypotheses, there was no Space (ethnic, general) × Identity (underrepresented, White) interaction on value of underrepresented students. There was only a main effect of space, such that both underrepresented and White students who read about the ethnic space perceived that the university valued underrepresented students to a greater extent than those who read about the general space. Inconsistent with the hypotheses, there was no significant Space (ethnic, general) × Identity (underrepresented, White) interaction on academic expectations. Simple effects of space are broken down by identity in the next section.
Heterogeneity Statistics for Meta-Analysis of the Effect of Space on Dependent Variables.
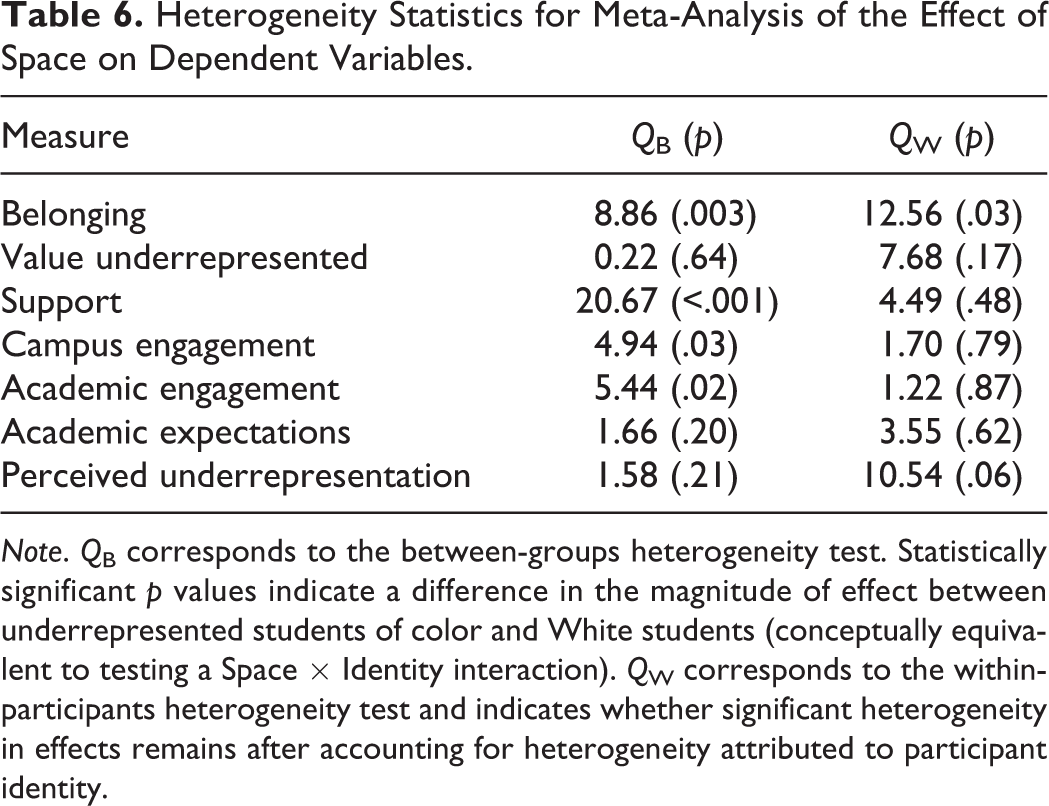
Note. Q B corresponds to the between-groups heterogeneity test. Statistically significant p values indicate a difference in the magnitude of effect between underrepresented students of color and White students (conceptually equivalent to testing a Space × Identity interaction). Q W corresponds to the within-participants heterogeneity test and indicates whether significant heterogeneity in effects remains after accounting for heterogeneity attributed to participant identity.
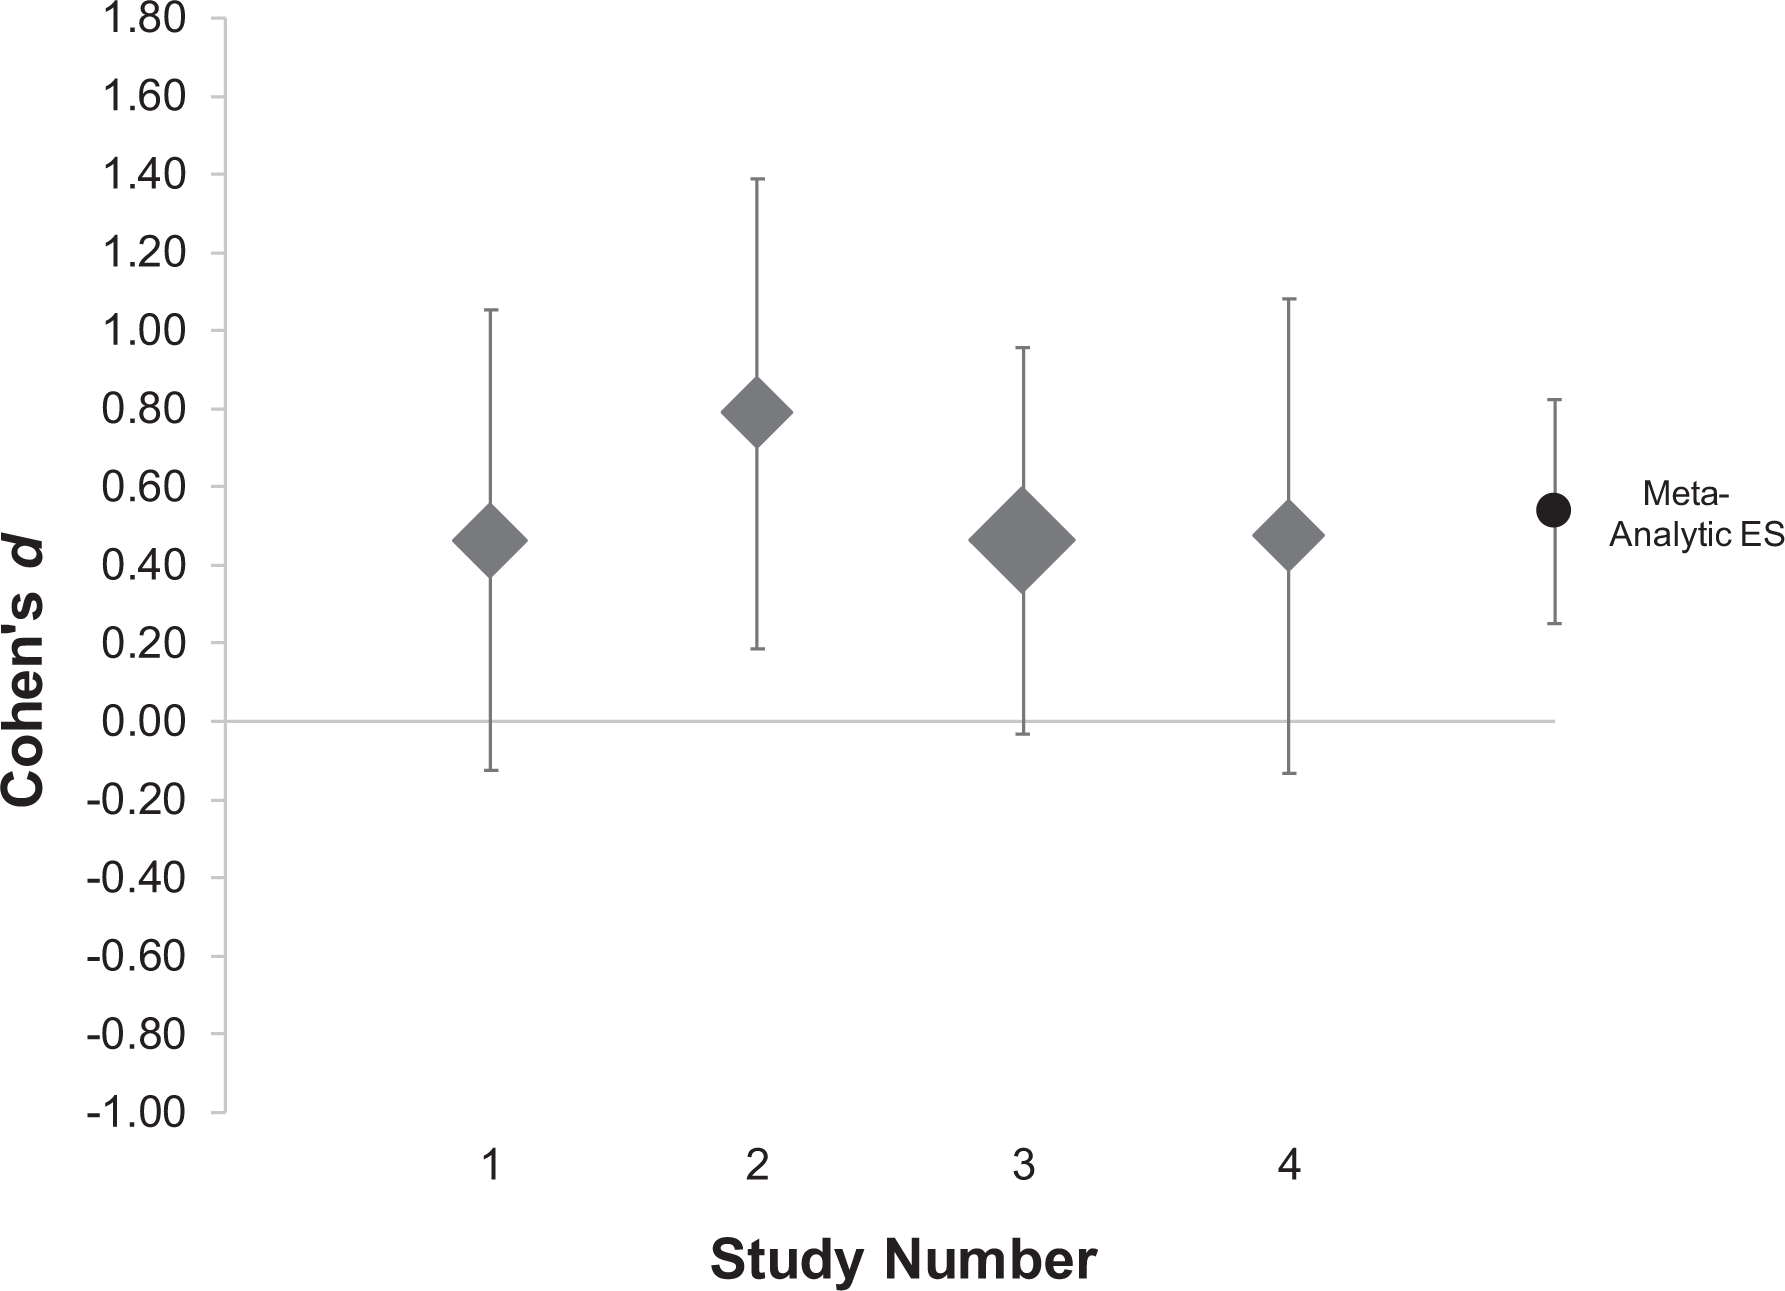
When accounting for differences due to identity, the remaining heterogeneity across study effect sizes was not statistically significant, with the exception of the belonging measure (see Table 6). Statistical power to detect heterogeneity was limited, but Figures 1 –6 show forest plots that visualize the heterogeneity for belonging, value of underrepresented students, and support across the studies.
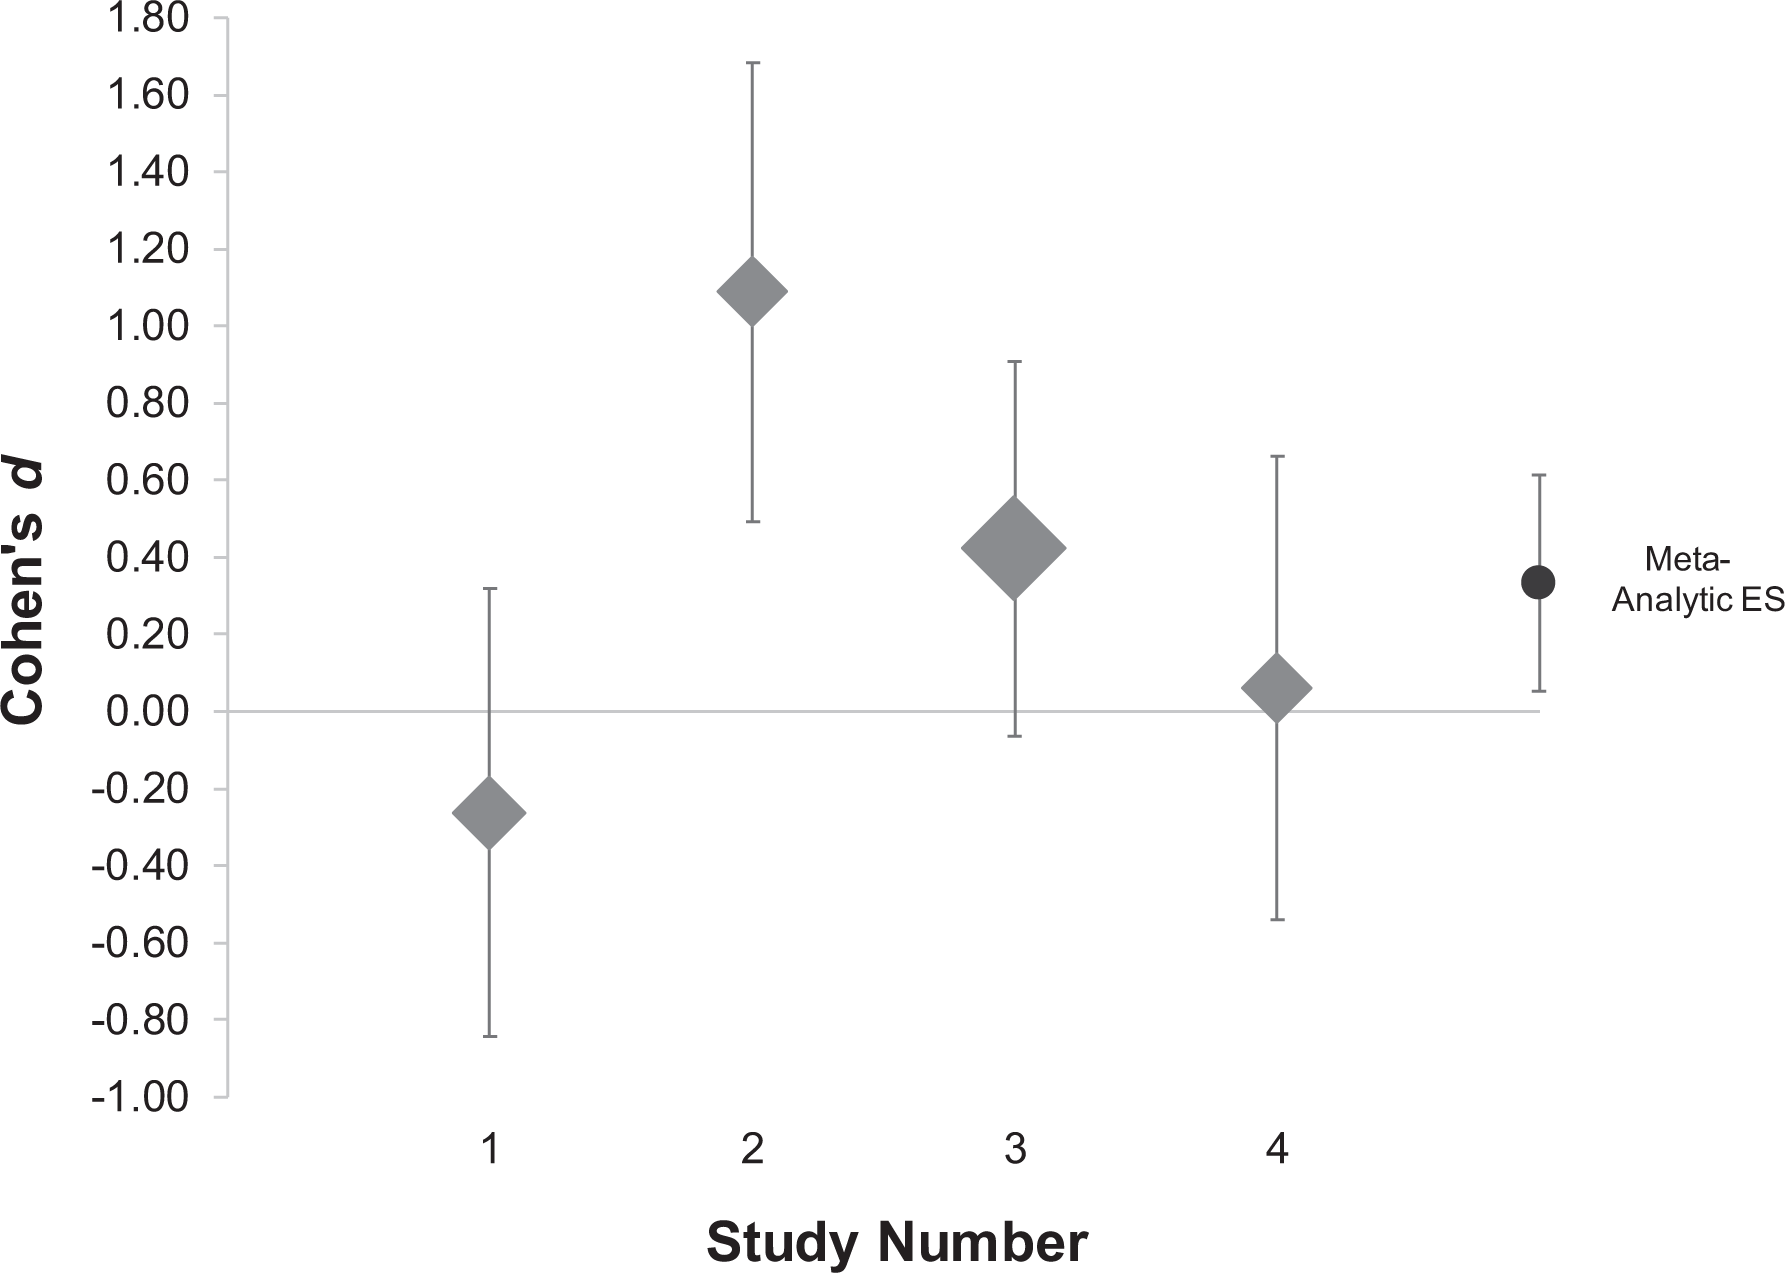
Forest plot of the effect of space (Cohen's ds) on belonging among underrepresented students of color. Effect sizes above 0 indicate greater belonging in the ethnic relative to general space condition. Error bars indicate 95% confidence intervals. Diamond size reflects relative weight of effects.
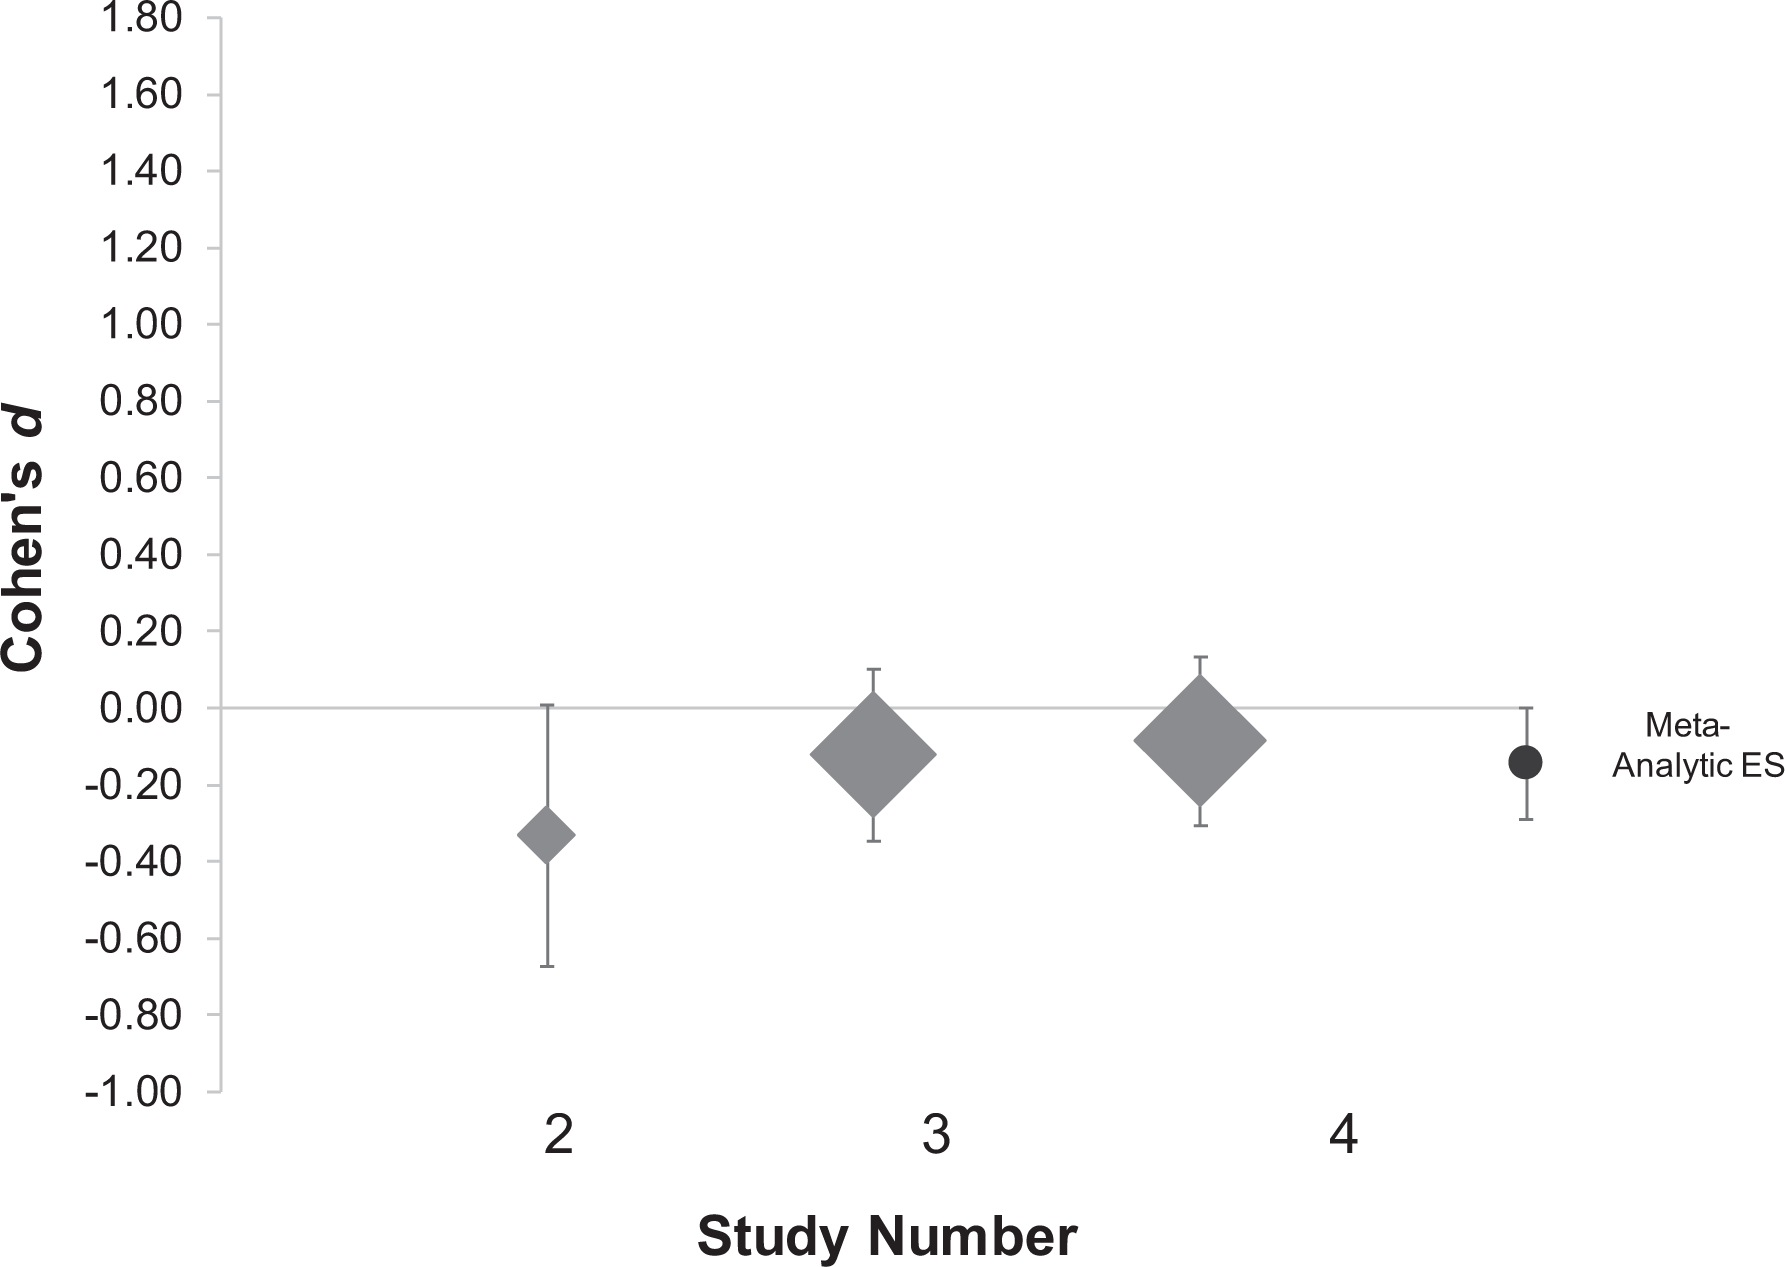
Forest plot of the effect of space (Cohen's ds) on belonging among White students. Effect sizes above 0 indicate greater belonging in the ethnic relative to general space condition. Error bars indicate 95% confidence intervals. Diamond size reflects relative weight of effects.
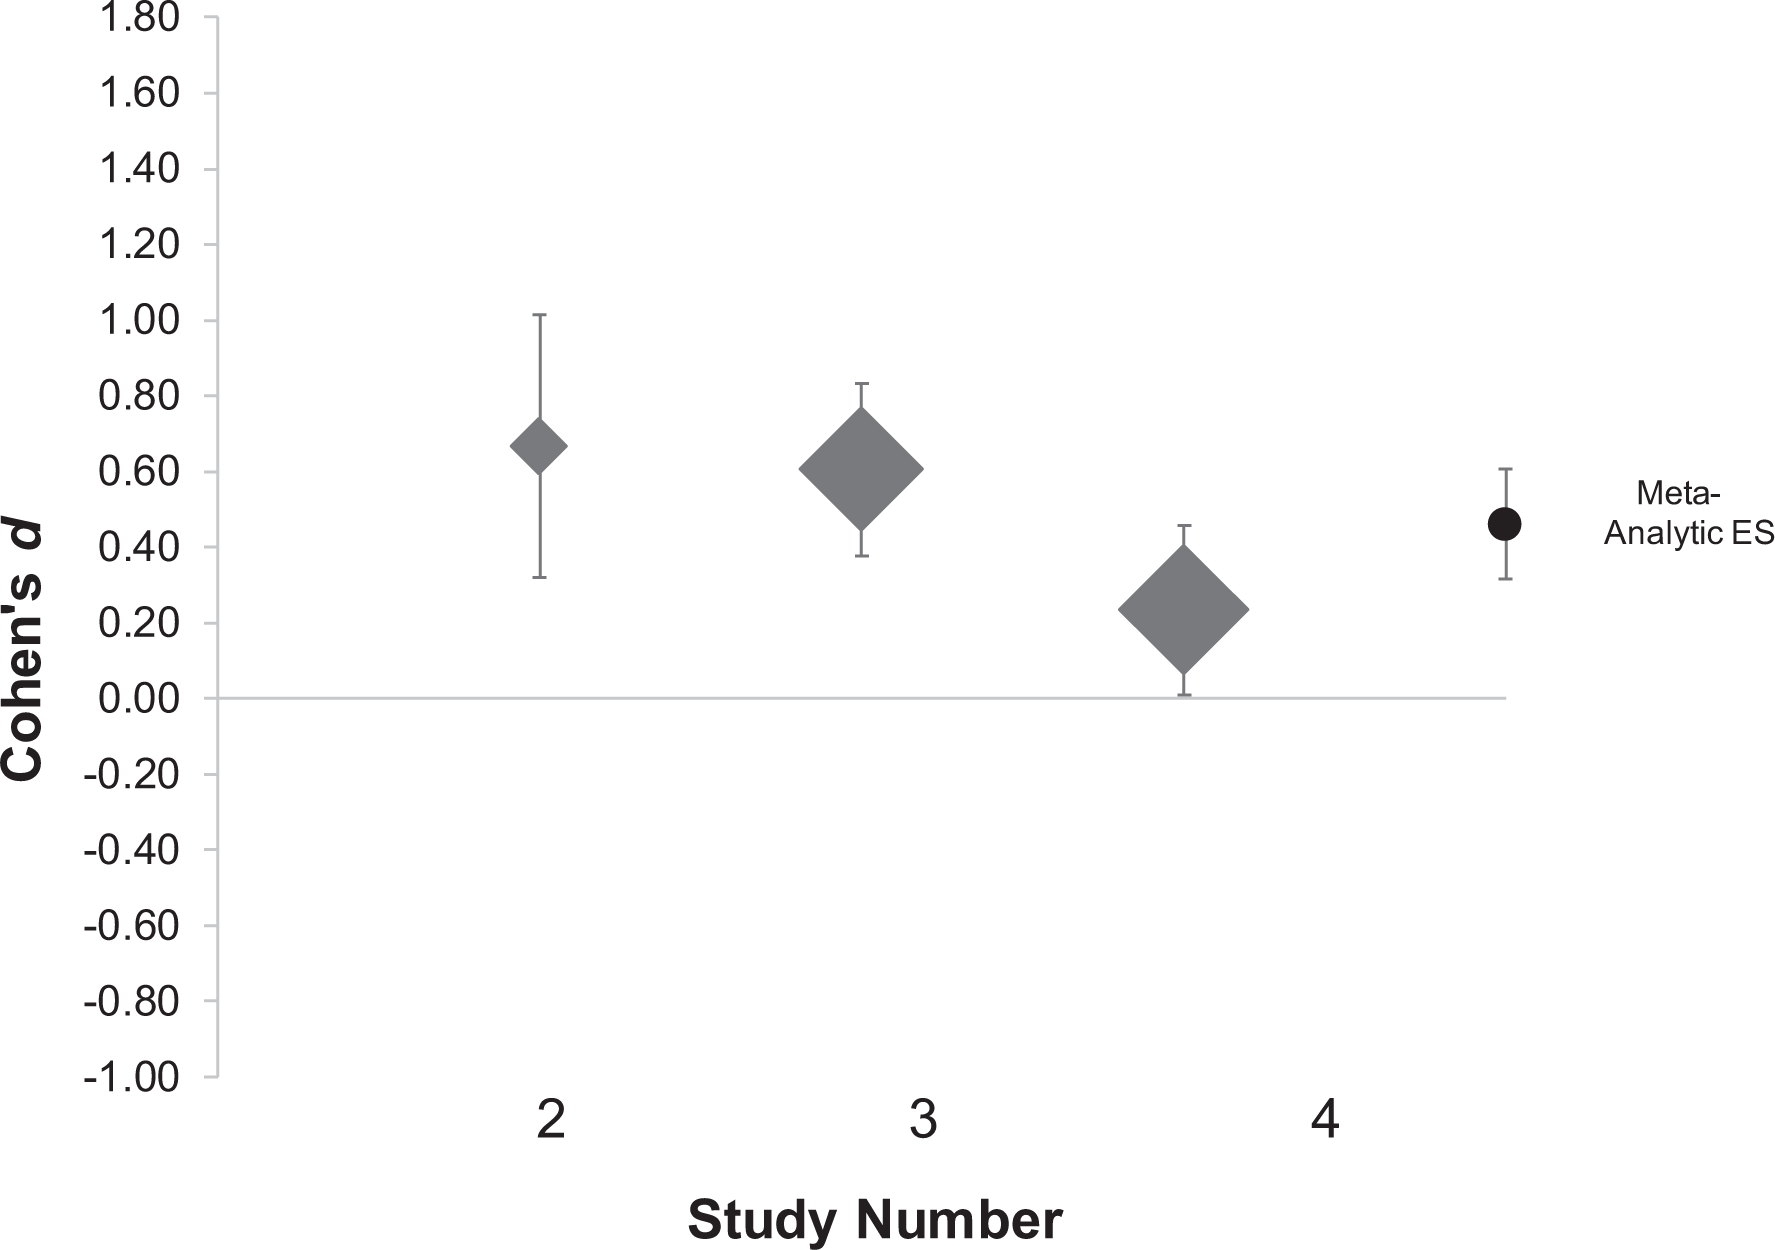
Forest plot of the effect of space (Cohen's ds) on value of underrepresented students among underrepresented students of color. Effect sizes above 0 indicate greater value of underrepresented students in the ethnic relative to general space condition. Error bars indicate 95% confidence intervals. Diamond size reflects relative weight of effects.
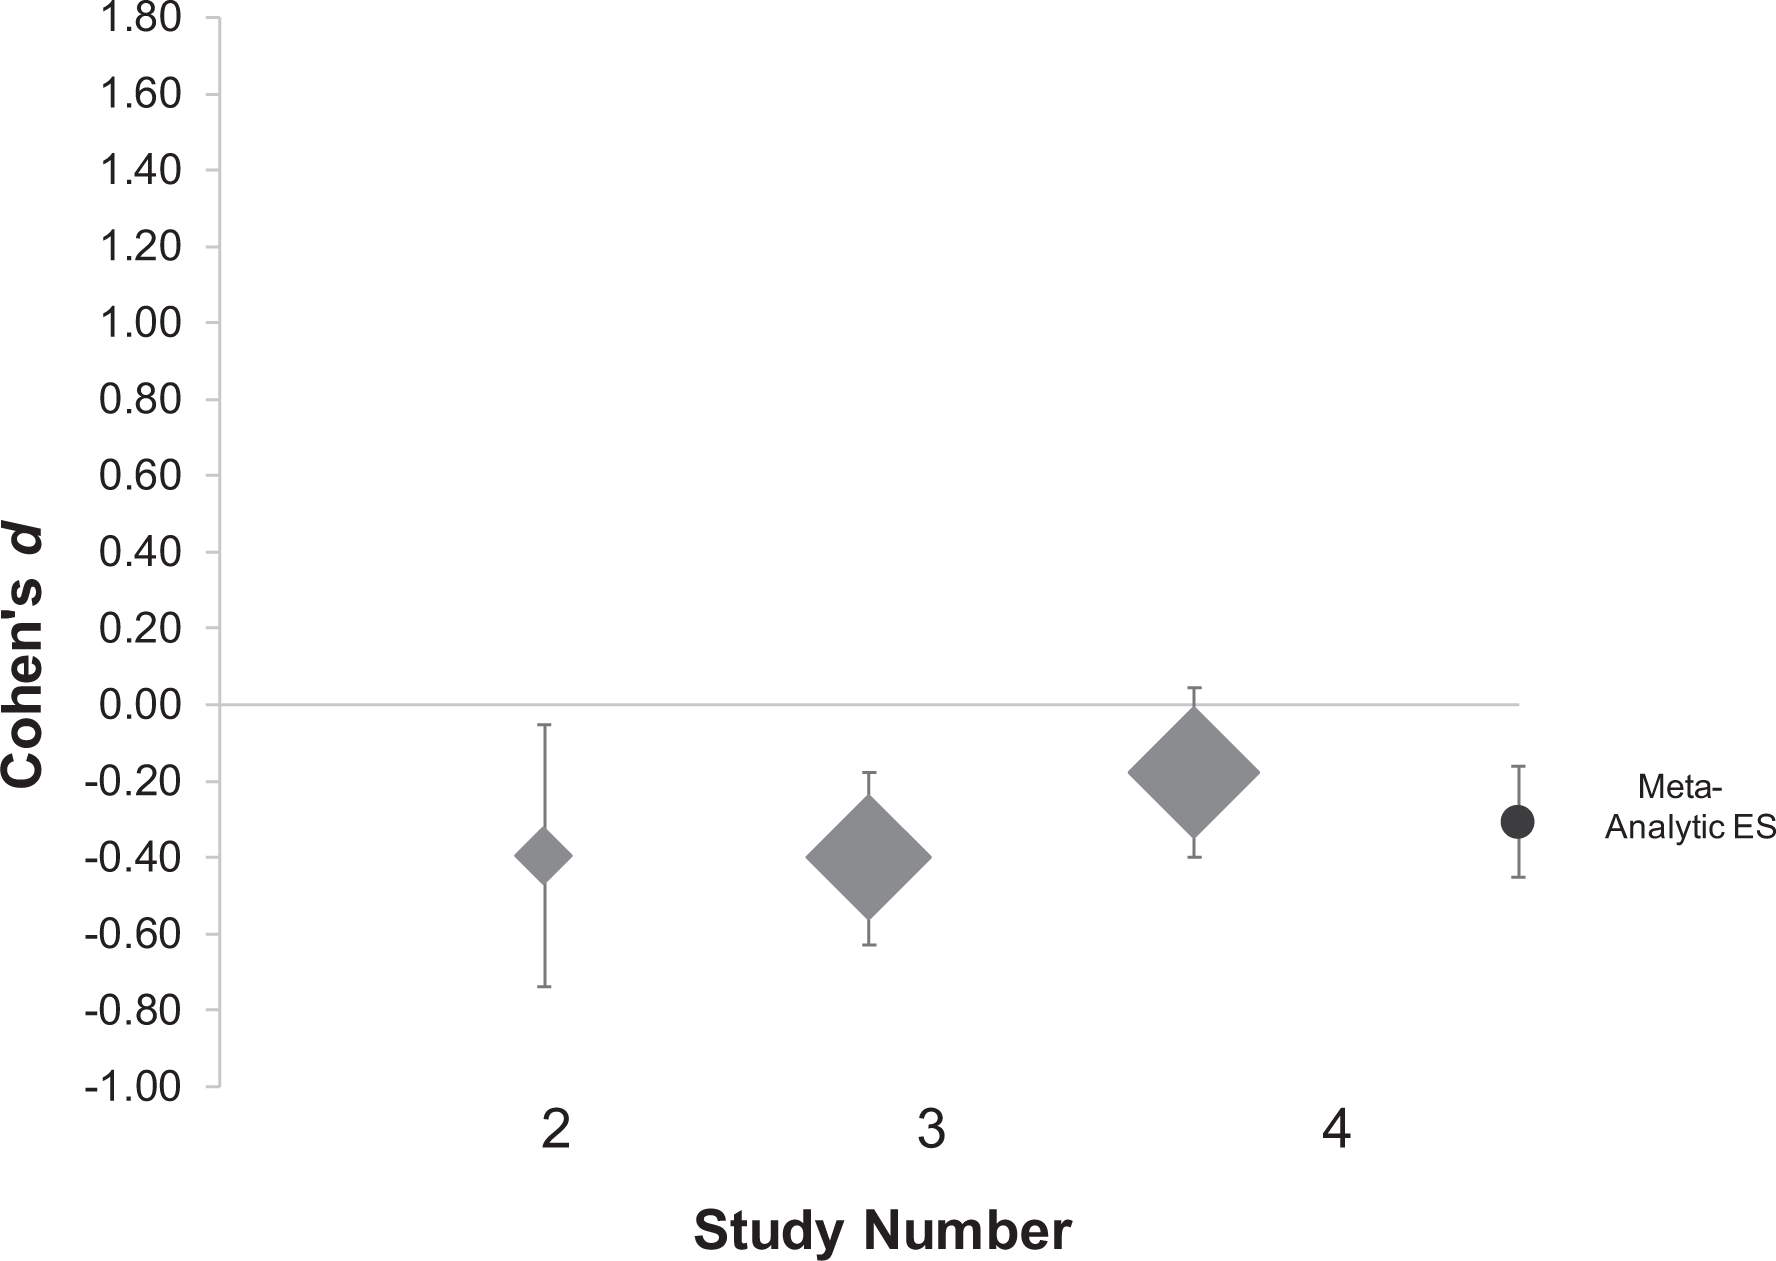
Forest plot of the effect of space (Cohen's ds) on university's perceived value of underrepresented students among White students. Effect sizes above 0 indicate greater value of underrepresented students in the ethnic relative to general space condition. Error bars indicate 95% confidence intervals. Diamond size reflects relative weight of effects.
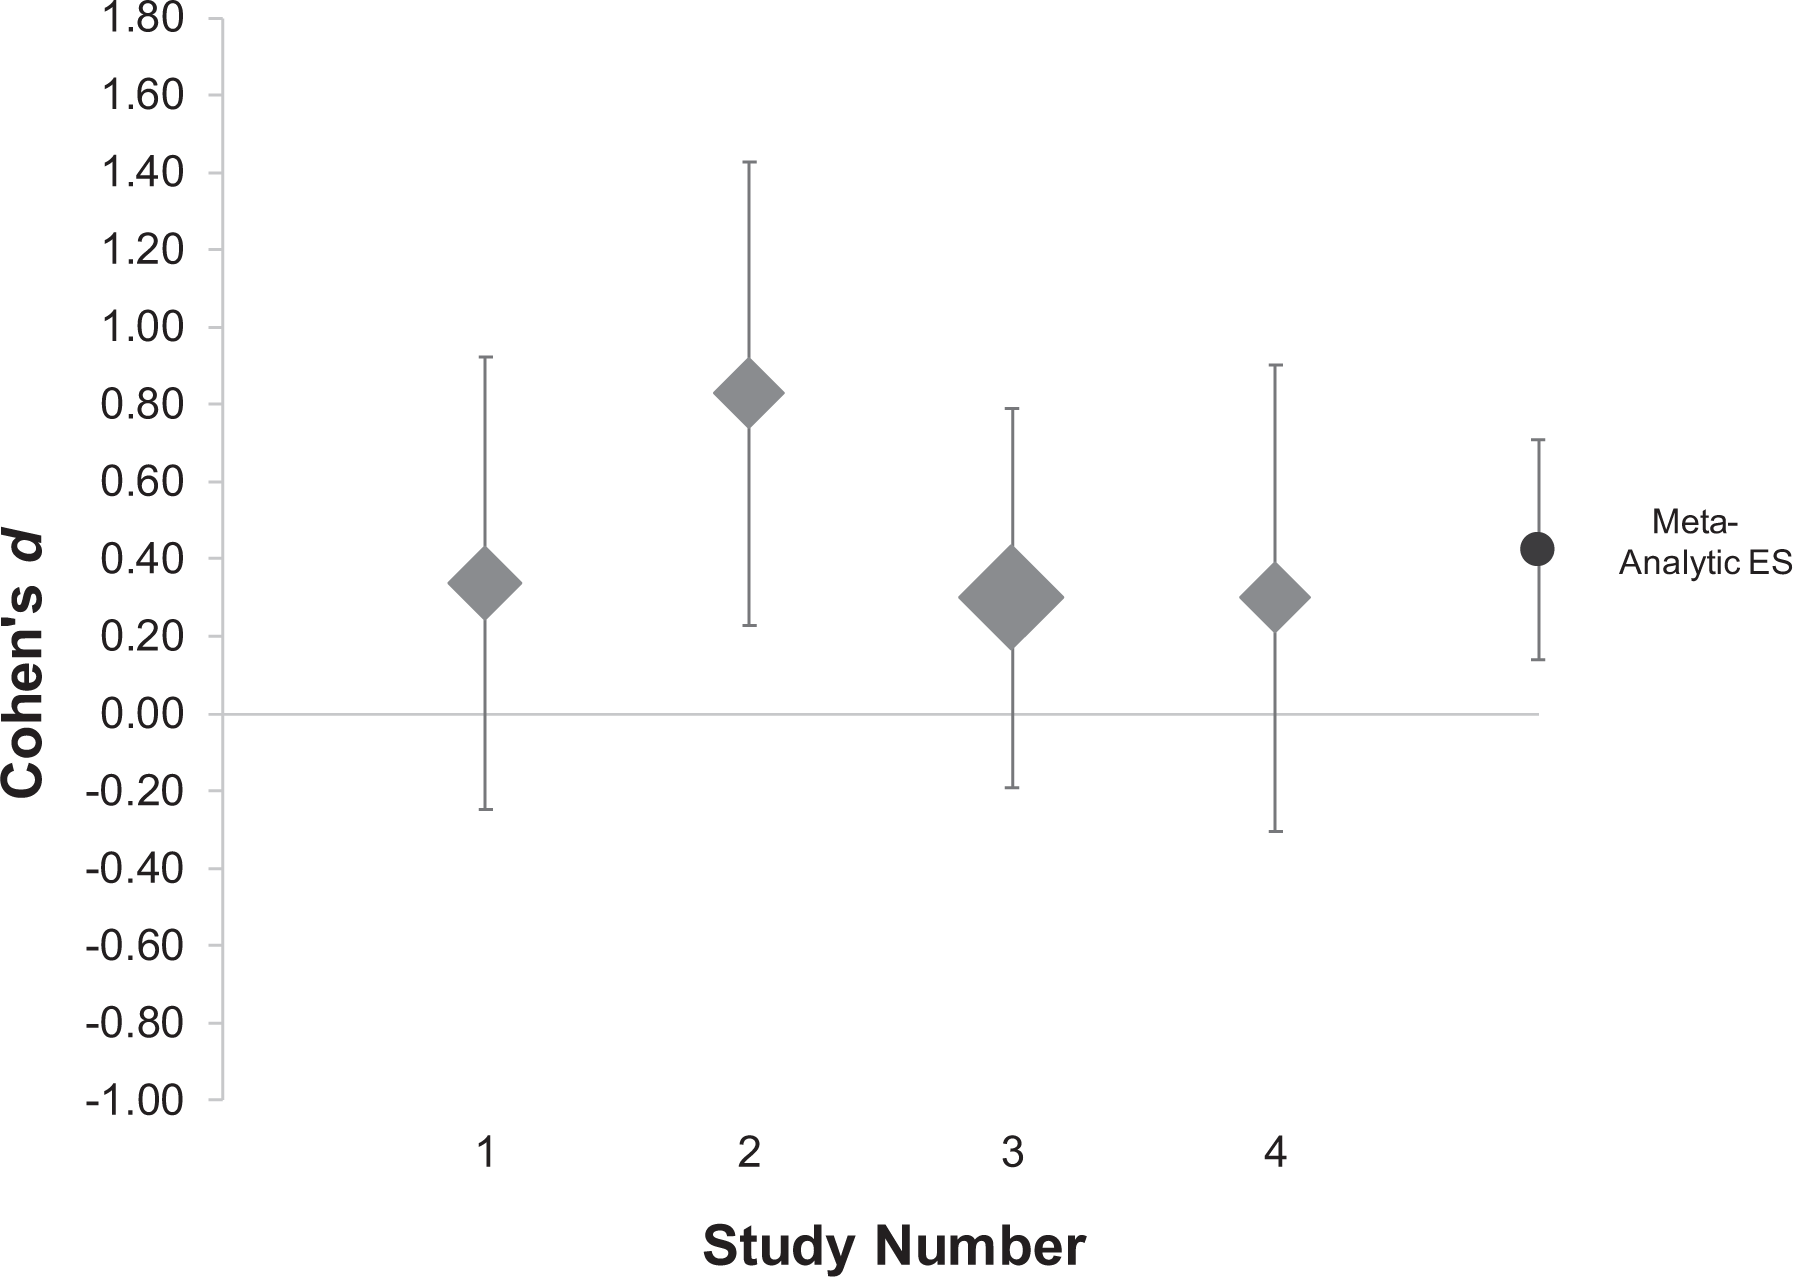
Forest plot of the effect of space (Cohen's ds) on support among underrepresented students of color. Effect sizes above 0 indicate higher support in the ethnic relative to general space condition. Error bars indicate 95% confidence intervals. Diamond size reflects relative weight of effects.
Forest plot of the effect of space (Cohen's ds) on support among White students. Effect sizes above 0 indicate higher support in the ethnic relative to general space condition. Error bars indicate 95% confidence intervals. Diamond size reflects relative weight of effects.
Effect of space for underrepresented students of color
As hypothesized, when reading about an ethnic space, underrepresented students of color reported greater belonging, value of underrepresented students, support, and academic engagement than when reading about a general space (see Table 7 for full statistical details). Space did not have a statistically significant effect on campus engagement or academic expectations. Finally, space did not affect their perceived underrepresentation, suggesting that the benefits of ethnic spaces could not be attributed to increased perceptions of underrepresented students on campus.
Fixed Effects Meta-Analysis of Effect of Space on Dependent Variables Separated by Identity.
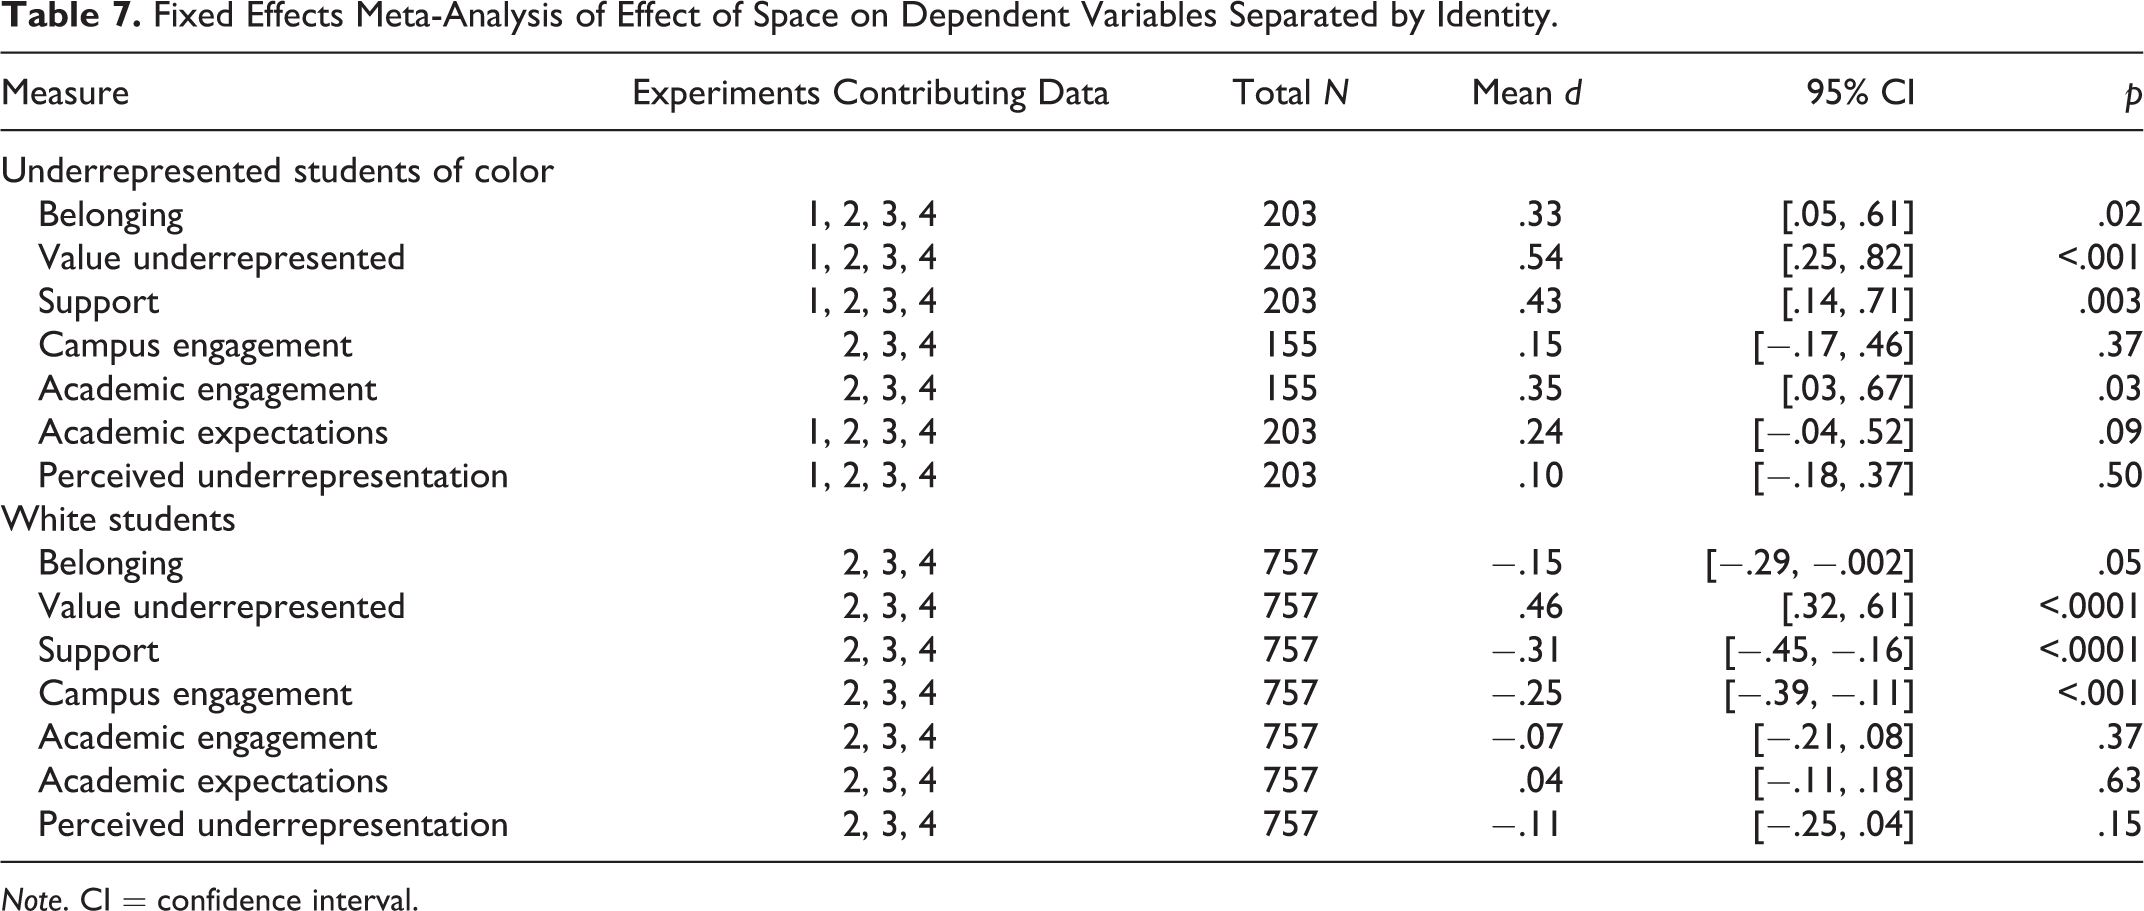
Note. CI = confidence interval.
Effect of space for White participants
As expected, reading about the ethnic space increased White students’ perceptions that the university valued underrepresented students. White students’ academic engagement and expectations were not significantly impacted by reading about the ethnic versus general space. However, White students who read about an ethnic space reported lower belonging, support, and campus engagement than White students who read about a general space. Full statistical details are presented in Table 7.
Do benefits depend on anticipated usage?
Among underrepresented students of color, we examined whether the benefits held for those who anticipated infrequent usage of the spaces. We explored this question in two ways below.
First, we meta-analytically compared the results of Studies 1 and 2 to Studies 3 and 4. Studies 3 and 4 were more stringent tests of our hypotheses that ethnic spaces are beneficial even for non-users. Study 3 included a space for which construction would not start until 5 years in the future (which would preclude most undergraduates from using the space while they were students), and Study 4 included an ethnic space for prospective students instead of current students. We compared the aggregate effects from Studies 1 and 2 (less stringent tests) to Studies 3 and 4 (more stringent tests).
There were no differences in the magnitude of the effect across the two groups of studies for any dependent measures, 4 Fs < .93 and ps > .33. Effects were directionally, but not statistically significantly, larger for the less stringent (Studies 1–2) than stringent tests (Studies 3–4) on all measures: belonging (d s = 0.40 vs. .28, respectively), value of underrepresented students (d s = 0.62 vs. 0.47), support (d s = 0.58 vs. 0.30), campus engagement (d s = 0.27 vs. 0.10), academic engagement (d s = 0.55 vs. 0.27), and academic expectations (d = 0.30 vs. 0.20).
Second, for Studies 1–3, we compared underrepresented students of color who anticipated using the space frequently to those who did not. The space usage question was on a continuous 1–7 scale in Studies 1–2 and on a binary (yes or no) scale in Study 3. In order to aggregate all three studies in one meta-analysis, we performed a variation in a midpoint split 5 on the continuous usage questions in Studies 1 and 2 to make the three studies comparable. We then computed Cohen’s d s for each dependent variable separately for those low (0) and high (1) in usage.
As shown in Table 8, there were no statistically significant differences between frequent and infrequent users on reported belonging, value of underrepresented students, support, campus engagement, academic engagement, or academic expectations, suggesting that benefits of ethnic space were not restricted to those who anticipated more usage of the space. Three of the six measures revealed effects that were directionally, but not statistically significantly, larger for infrequent than frequent users: belonging (d s = 0.39 vs. 0.33, respectively), value of underrepresented students (d s = 0.81 vs. 0.19), and campus engagement (ds = −0.03 vs. 0.61). The other three revealed the opposite pattern: support (d s = 0.40 vs. 0.46), academic engagement (d s = 0.03 vs. 0.75), and academic expectations (d = −0.11 vs. 0.29).
Heterogeneity Statistics for Meta-Analysis of Effects of Space Comparing Low and High Anticipated Usage Among UR.
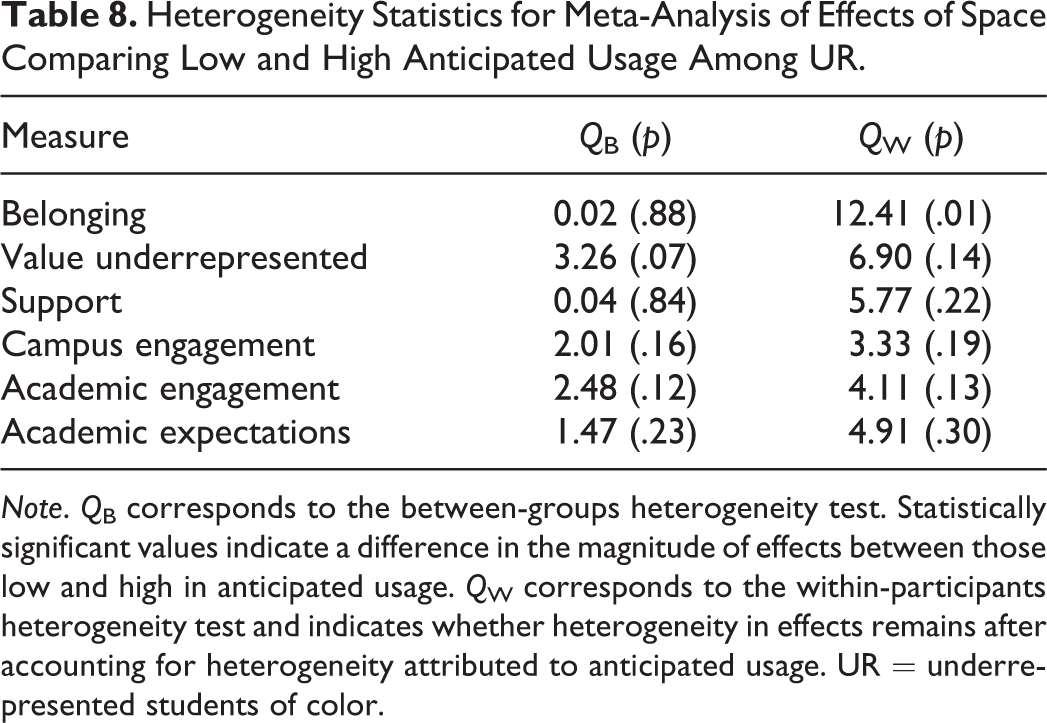
Note. Q B corresponds to the between-groups heterogeneity test. Statistically significant values indicate a difference in the magnitude of effects between those low and high in anticipated usage. Q W corresponds to the within-participants heterogeneity test and indicates whether heterogeneity in effects remains after accounting for heterogeneity attributed to anticipated usage. UR = underrepresented students of color.
Do benefits hold for those already aware of construction?
In Study 2, we asked whether participants were already aware of the construction projects. Knowledge of the projects did not moderate effects among underrepresented students of color, ps > .15. Due to limited statistical power, we also examined the effects of reading about the spaces among those with and without previous knowledge of them. Among those without previous knowledge (N = 12), effects of space ranged from d = 0.24 to 1.64, although these effect sizes should be interpreted cautiously due to the particularly small sample size. Among those with previous knowledge (N = 31), effect of spaces on the same variables ranged from d = 0.02 to 0.88. These findings tentatively suggest that even reminders of ethnic space may have some benefits.
General Discussion
Underrepresented students of color told about an ethnic space on their campus reported increased belonging, perceived value of underrepresented students by the university, support, and academic engagement than students told about a general student space. Increased academic engagement is especially important because it predicts performance at university (Richardson et al., 2012). Benefits of ethnic space occurred irrespective of physical presence in the space or the intention or ability to use it, suggesting that it served as a signal of a more welcoming university context for underrepresented students. Thus, creating ethnic spaces may be one feasible way to promote engagement and belonging among underrepresented students of color. Because underrepresented students of color often face chronic concerns about belonging and performance at university (Shapiro & Neuberg, 2007; Steele et al., 2002), interventions such as this one may be especially impactful.
Theoretical Contributions
The current work makes three primary contributions to the literature. First, whereas previous work has focused on the costs and benefits of physical spaces for those who enter them (Cheryan et al., 2009; Schmitt et al., 2010), this work demonstrates that effects of physical space extend to spaces that do not yet exist. Reading about a future space for one’s group increased belonging, perceived value and support by the university, and academic engagement—even for those who could not use the space. Benefits of physical spaces may extend beyond whether those spaces are frequently used.
Second, these studies demonstrate that physical spaces send signals about the inclusiveness of the broader environment. Physical space can thus function similarly to other cues such as diversity statements, course materials, and demographic diversity (Brannon et al., 2015; Murphy et al., 2007; Schmader & Sedikides, 2017). The allocation of space may be seen as a particularly genuine and resource-intensive gesture compared to other types of initiatives (see Smith et al., 2012), although this remains an open empirical question.
Third, the current work suggests that simple reminders of inclusion may improve outcomes for underrepresented students. Even though the majority of underrepresented students knew about plans to build an expanded ethnic space at the university, being reminded of it benefited them. Periodically reminding underrepresented students of color of existing and forthcoming ethnic spaces may boost belonging and academic engagement.
Impact on White Students
White students reported lower belonging, support, and campus engagement when reading about ethnic relative to general spaces. It was unclear whether reading about the ethnic space decreased their belonging, support, and campus engagement or whether reading about the general student center instead increased perceptions relative to baseline.
If knowledge of ethnic space indeed impacted White students, this would be consistent with research showing that Whites are more likely than people of color to embrace zero-sum thinking or a belief that resources allocated to an out-group lead to fewer resources for their own group (Wilkins et al., 2015). Many Whites also feel excluded and threatened by multicultural initiatives (Dover et al., 2016; Plaut et al., 2011). Strategies such as all-inclusive multiculturalism that explicitly include Whites in initiatives can alleviate these concerns (Jansen et al., 2015; Stevens et al., 2008). Creating ethnic spaces that welcome White student allies may be one way forward. However, opening up the space could decrease benefits for underrepresented students of color. Attempts to make ethnic spaces more palatable for White students should not come at a cost to underrepresented students of color.
Caveats and Future Directions
There are several areas of future work. First, future research could examine whether the benefits of ethnic spaces extend to all underrepresented groups equally. Although Black, Latinx, and Native American students may have some commonalities in terms of experiences of discrimination on campus, they also face distinct issues (Fryberg & Eason, 2017; Zou & Cheryan, 2017). In addition, members of groups based on other identities (e.g., sexual orientation, social class) may have different responses to spaces for their groups.
Second, our studies were conducted on a campus where Black (3%), Latinx (6%), and Native American (1%) students are particularly underrepresented. Celebrating diversity may be more beneficial when there is already moderate representation of one’s group (e.g., 40%; Apfelbaum et al., 2016). However, other research suggests that multicultural approaches are more beneficial when representation is low (Purdie-Vaughns et al., 2008). These competing hypotheses need to be more closely examined in future research.
Third, other research has shown that involvement in ethnic organizations is associated with ethnic divisions (Sidanius et al., 2004). Understanding how to retain the benefits of ethnic space, while alleviating negative consequences for intergroup conflict, should be examined.
Fourth, this research should be considered alongside other scholarship suggesting that diversity structures reduce sensitivity to discrimination (Kaiser et al., 2013; Kirby et al., 2015). Ethnic spaces may similarly reduce majority group members’ detection of discrimination. Inclusive cues are important but must be paired with vigilance to the realities of discrimination that occur. Finally, we did not compare ethnic and general space to other types of initiatives, which could have provided clarity about whether space facilitates more or different benefits for underrepresented groups compared to other initiatives.
Conclusion
In 2016, the Tennessee legislature passed a bill to cut all funding for ethnic centers at the University of Tennessee (Jaschik, 2016). Decisions to cut funding for ethnic spaces may appear to impact only a subset of underrepresented students of color using the space. However, the presence of these spaces is an important source of belonging and engagement even for underrepresented students of color who may not use them. Constructing spaces for underrepresented students of color could be a meaningful way of creating a more welcoming climate on campuses.
Supplemental Material
Supplemental Material, Ethnic_spaces_supplement_8Dec2019 - The Symbolic Value of Ethnic Spaces
Supplemental Material, Ethnic_spaces_supplement_8Dec2019 for The Symbolic Value of Ethnic Spaces by Teri A. Kirby, Joshua A. Tabak, Maria Ilac and Sapna Cheryan in Social Psychological and Personality Science
Footnotes
Declaration of Conflicting Interests
The author(s) declared no potential conflicts of interest with respect to the research, authorship, and/or publication of this article.
Funding
The author(s) disclosed receipt of the following financial support for the research, authorship, and/or publication of this article: This work was supported by National Science Foundation Graduate Research Fellowships awarded to the first and second authors and the Economic and Social Research Council (grant number ES/S00274X/1 awarded to the first author).
Supplemental Material
The supplemental material is available in the online version of the article.
Notes
References
Supplementary Material
Please find the following supplemental material available below.
For Open Access articles published under a Creative Commons License, all supplemental material carries the same license as the article it is associated with.
For non-Open Access articles published, all supplemental material carries a non-exclusive license, and permission requests for re-use of supplemental material or any part of supplemental material shall be sent directly to the copyright owner as specified in the copyright notice associated with the article.