
Abstract
How do the very wealthy spend their time, and how does time use relate to well-being? In two studies in the Netherlands, the affluent (N = 863; N = 690) and the general population (N = 1,232; N = 306) spent time in surprisingly similar ways such as by spending the same amount of time working. Yet the nature of their time use differed in critical ways that are related to life satisfaction. In Study 1, millionaires spent more time engaged in active leisure (e.g., exercising and volunteering) rather than passive leisure (e.g., watching television and relaxing). In Study 2, millionaires spent more time engaged in tasks at work over which they had more control. The affluent sample belongs to the top of the income and wealth distribution, representing a significantly wealthier sample than in previous studies. These results further our understanding of when and how wealth may translate into greater well-being. All materials for this article are available at https://osf.io/vndmt/
Previous research documents a robust yet weak relationship between wealth and overall life satisfaction (Boyce, Daly, Hounkpatin, & Wood, 2017; Clark, Frijters, & Shields, 2008; Diener, Sandvik, Seidlitz, & Diener, 1993; Hagerty & Veenhoven, 2003; Jebb, Tay, Diener, & Oishi, 2018; Kahneman & Deaton, 2010; Lindqvist, Ostling, & Cesarini, 2018; Lucas & Dyrenforth, 2006; Lucas & Schimmack, 2009). Collectively, these findings point to the question of whether wealth is related to greater life satisfaction, and if so, through what avenues.
Most research aiming to understand the conditions under which wealth might translate into greater happiness has addressed this question by examining purchase decisions. Specifically, previous research finds that wealth can translate into greater subjective well-being if people spend their money in ways that promote happiness (Dunn, Aknin, & Norton, 2014). For example, spending money on others (vs. on one’s self) causally shapes happiness (Dunn, Aknin, & Norton, 2008). Similarly, people experience greater happiness and social connection after spending money on experiences as opposed to spending money on material purchases (e.g., Carter & Gilovich, 2012; Van Boven & Gilovich, 2003; cf. Weidman & Dunn, 2016). Instead of material purchases, buying time, such as by outsourcing disliked tasks, is also positively related to happiness (Whillans, Dunn, Smeets, Bekkers, & Norton, 2017). Together, these findings provide a great deal of evidence that wealth can translate into greater well-being, particularly when people spend their discretionary income in ways that are likely to promote happiness.
However, less research has focused on whether wealth can shape happiness to the extent that money changes the way that people spend their time. In the current article, we focus on the question of whether the very wealthy spend their time in happier ways. Study 1 investigates time use in daily life, including leisure activities, eating, shopping, childcare, and household chores. Study 2 focuses on time use at work, examining the extent to which the very wealthy have greater job autonomy.
In light of rising rates of income inequality, millionaires have received increased attention from policy makers, academics, and the press. For example, numerous articles have focused on what it is like to be wealthy (The New York Times, 2015; The Independent, 2016). Yet we know little about how the very wealthy spend their time. Previous research has not been able to address this question because of a lack of data. For example, research has examined the time use and happiness of upper middle-class individuals—showing that relatively richer individuals are more likely to spend their time in ways that undermine happiness—such as by spending more time commuting and working (Kahneman, Krueger, Schkade, Schwarz, & Stone, 2006). Other research has examined the time use and happiness of wealthier individuals—using publicly available data sets such as the American Time Use Survey. These studies show, for example, that income predicts the frequency and nature of social contact, such that wealthier individuals on average spend less time socializing with their family (Bianchi & Vohs, 2016).
Yet a limitation of past research examining time use and happiness is the fact that these studies only include a handful of individuals from the top of the wealth distribution (e.g., Aaker, Rudd, & Mogilner, 2011; Bryson & MacKerron, 2016; Kahneman et al., 2006; Kushlev, Dunn & Lucas, 2015; Wang et al., 2012). Wealthy people can behave quite differently than the general population, for example, in charitable giving decisions (Smeets, Bauer, & Gneezy, 2015). Thus, it is important to understand how any differences in time use between the wealthy and general population relate to the well-being of both groups. We sought to address the question of whether the very wealthy spend their time in more happiness-inducing ways than the general population.
On the one hand, money can exert a large influence over time use, affording people control over the nature of their daily activities (Kraus, Piff, Mendoza-Denton, Rheinschmidt, & Keltner, 2006). This increased control might in turn predict positive psychological and physical health outcomes such as improved mood (Deci & Ryan, 1987; Gallo, Bogart, Vranceanu, & Matthews, 2005; Gallo & Matthews, 2003; Smith, Langa, Kabeto, & Ubel, 2005) and greater life satisfaction (Howell & Howell, 2008; Johnson & Krueger, 2006). These results point to the possibility that higher levels of wealth may increase control over the way that people spend their time, with positive consequences for happiness.
On the other hand, very wealthy individuals might focus more on money than the general population and be less likely to spend their time in ways that are beneficial for life satisfaction. As described above, the results of research using general population surveys suggest that higher income is related to spending more time working and commuting, two activities that are negatively related to well-being (Bryson & MacKerron, 2016; Kahneman et al., 2006). This focus on working and making money could be particularly strong among the very wealthy because being busy is perceived as a status symbol, especially among the affluent (Bellezza, Paharia, & Keinan, 2016). Wealthier individuals who are trying to maintain their social status might therefore spend less time on “nonproductive” activities that are typically associated with greater happiness such as by spending less time socializing.
Indeed, people who prioritize money are less satisfied with their lives than people who prioritize time (Hershfield, Mogilner, & Barnea, 2016; Whillans, Weidman, & Dunn, 2016) in part because they spend less time engaging in activities that are associated with greater happiness, such as by spending less time socializing in daily life (Hershfield et al., 2016; Hur, Lee-Yoon, & Whillans, 2018; Whillans et al., 2016; Whillans & Dunn, 2018).
In sum, to understand when wealth might translate into greater well-being, it is important to examine whether and how the very wealthy spend their time. We examine whether the very wealthy engage more frequently in activities that are positively related to life satisfaction. We study two critical domains that occupy most people’s time: leisure activities (Study 1) and work (Study 2). Across both studies, we surveyed affluent Dutch samples and representative samples of Dutch adults. By recruiting individuals from diverse socioeconomic backgrounds and asking identical happiness and time-use questions, we can assess whether the affluent differ from the general population and explore the wealth thresholds at which any differences emerge.
Study 1—Daily Time Use of Millionaires and the General Population
Method
Respondents
To examine the time use and well-being of the very wealthy and the general population, we recruited a high-net-worth (HNW) sample of adults in the Netherlands (N = 863, Mwealth = EUR2,375,905, see Table 1 for descriptive statistics). We recruited these respondents from the Giving in the Netherlands survey in July 2015 using public data to target affluent individuals residing in the Netherlands (Bekkers, Schuyt, Gouwenberg, & De Wit, 2017). Critically, the affluent are unaware of the fact that they are recruited because they are rich, thus reducing any potential influence of demand on respondents’ answers to our survey questions.
Basic Demographic Characteristics of Respondents in Each Sample in Study 1.]
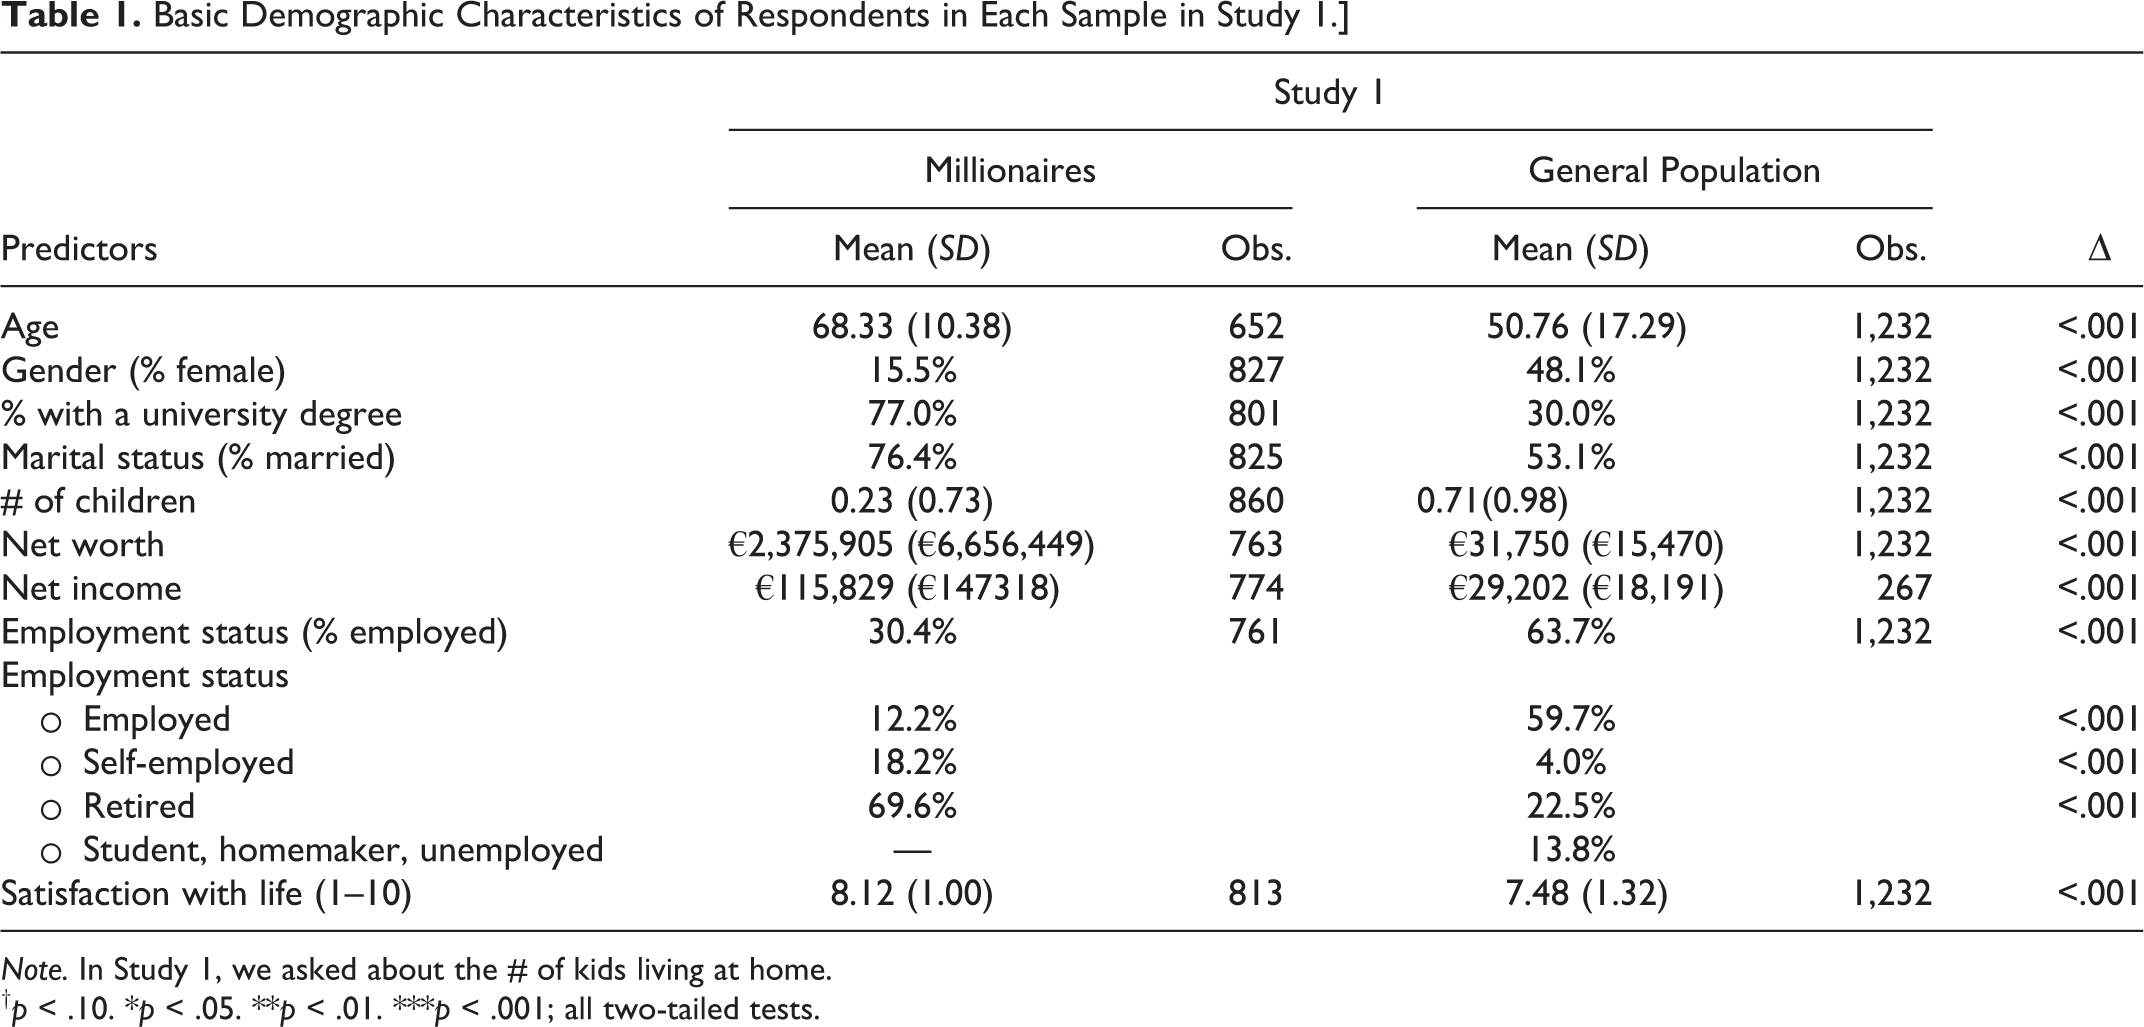
Note. In Study 1, we asked about the # of kids living at home.
†p < .10. *p < .05. **p < .01. ***p < .001; all two-tailed tests.
Within the same period, we implemented the identical survey to a nationally representative sample of Dutch adults (N = 1,232, Mwealth = EUR31,750). These respondents completed the 2015 wave of the Giving in the Netherlands Panel Study (Bekkers, Boonstoppel, & De Wit, 2017). This sample was recruited via a leading survey agency in the Netherlands. Both surveys met the ethical regulations and procedures for minimal risk research at one of the authors’ universities. Neither participants in the general population sample nor in the affluent sample were paid for participation, so participants likely completed the survey out of intrinsic motivation.
We defined wealth as the total value of net assets excluding people’s own house. All questions used in Study 1 can be found in the Supplemental Online Material (SOM). Of the HNW sample, 50.3% (n = 428) belongs to the top 5% and 22.0% (n = 187) belongs to the top 1.5% of the wealth distribution in the Netherlands (Statistics Netherlands, 2018b). Income refers to total yearly gross family income, which combines income from labor, business, and income generated by wealth. 11.7% (n = 100) of respondents are in the top 5% in terms of household income, and 23.8% (n = 202) belong to the top 10%, see SOM.
Procedure
Respondents reported their overall life satisfaction using a 1-item survey question previously used in large-scale survey research (cf. Jowell, 2007): How would you rate your satisfaction with life in general on a scale from 1 to 10? Such single-item measures assessing life satisfaction have been commonly used in prior research (see p. 33 of the SOM for additional details).
Respondents also reported how they had spent their time in the last 24 hr using items adapted from Kahneman, Krueger, Schkade, Schwarz, and Stone (2006). Specifically, they indicated how many minutes they spent on different activities such as cooking, eating, commuting, working, relaxing, volunteering, and hobbies. Following previously published research (Kahneman et al., 2006), all descriptive statistics are reported as episode-weighted statistics, where the percentage of time that respondents reported spending on each activity in the last 24 hr is weighted by the total amount of time they spent in various activities that day. We classified respondents’ time-use activities in the last 24 hr into composites in line with past research (Kahneman et al., 2006).
Active leisure is a composite of praying, socializing, intimate relations, exercise, hobbies, and volunteering. Passive leisure is a composite of watching TV, napping and resting, relaxing, and doing nothing. Necessities is a composite of shopping, childcare, cooking, and household chores. Work and commuting is a composite of time spent working and commuting. Eating is the percentage of time that respondents spent eating. We also included variables that were not originally included in Kahneman et al. (2006): “percentage of time spent on the phone” and “percentage of time spent on the computer” to account for the fact that people today spend a great deal of time on their phones and on their computers each day (Nielsen, 2018; Pew Research Center, 2015). In this study, we calculated “other” as a composite measure of a self-selected “other” category as determined by respondents as well as time spent waiting. We rely on self-reported time use; recent research suggests high similarity between self-reported activities and objectively obtained activity measures (Lathia, Sandstrom, Mascolo, & Rentfrow, 2017).
Results
Results Overview
Our results show that the wealthy spend their time in surprisingly similar ways as the general population (Figures 1 and 2) but spent more time on active leisure and less time on passive leisure. All the results hold when using Bonferroni corrections to control for the use of multiple comparisons (see SOM). 1
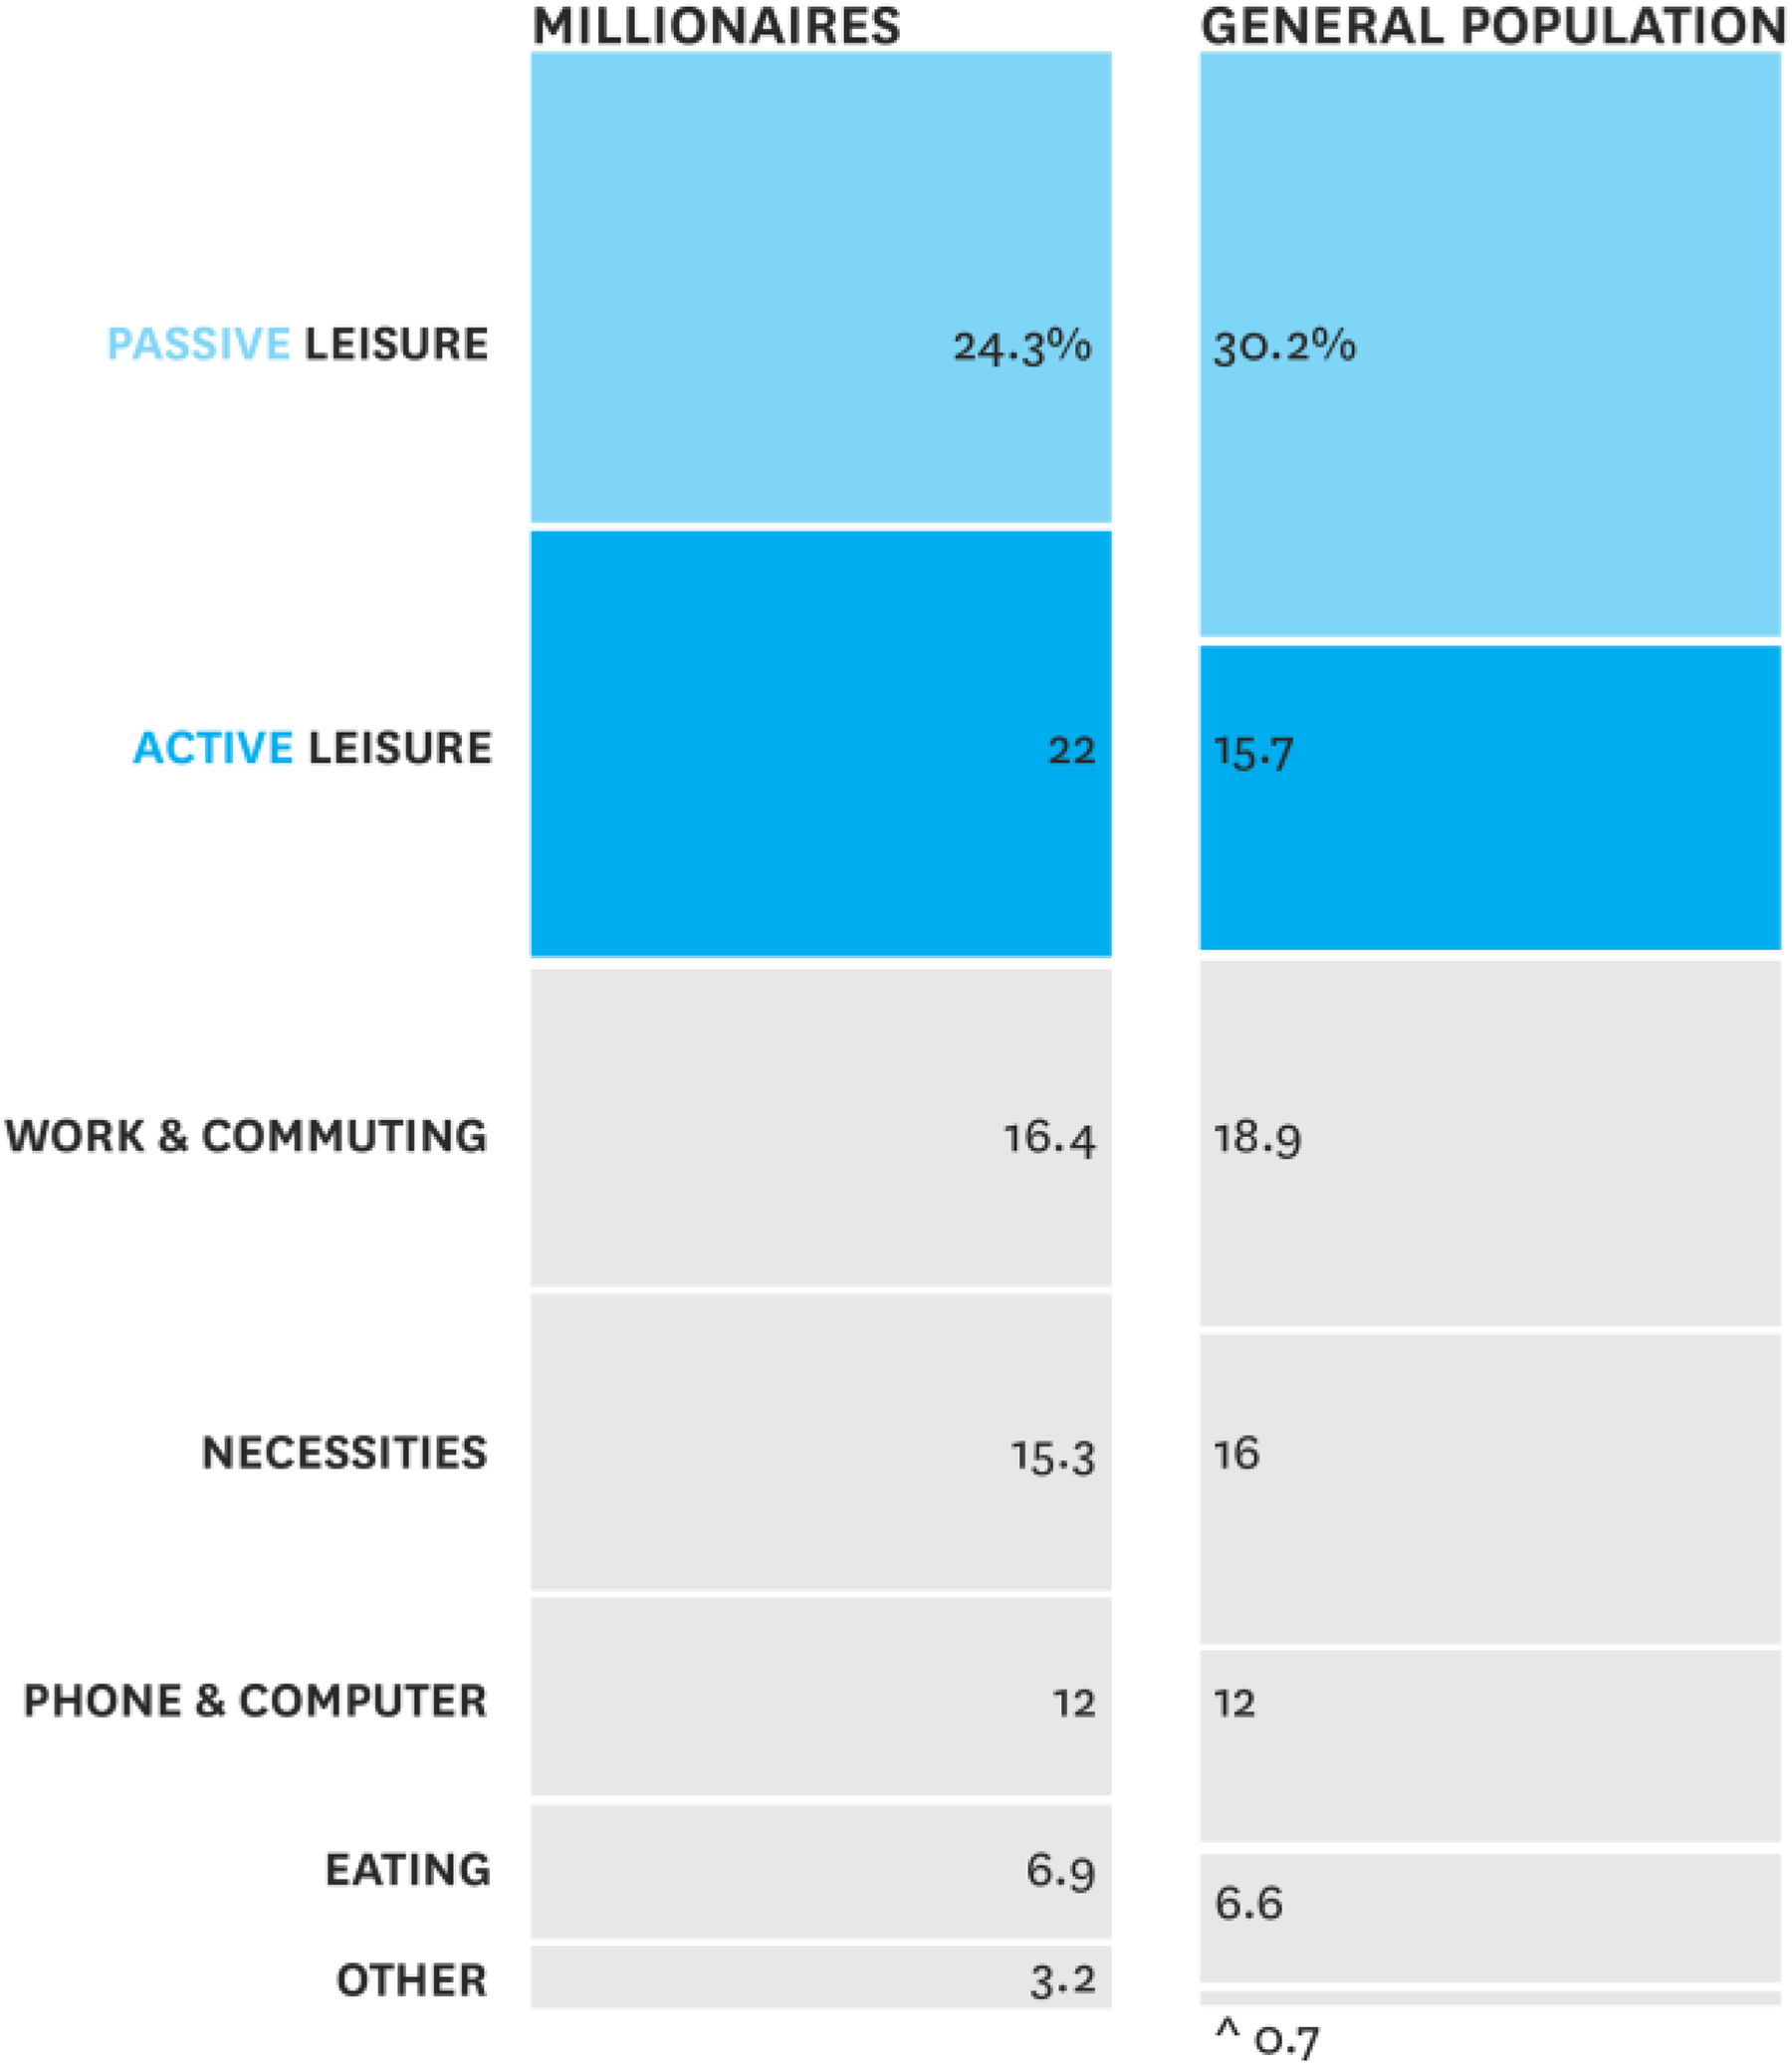
Time use differences between millionaires and the general population. All descriptive statistics are reported as episode weighted statistics (Kahneman et al., 2006). Additional descriptive information about this figure as well as detailed box and whisker plots are available in the SOM (see Figure S1).
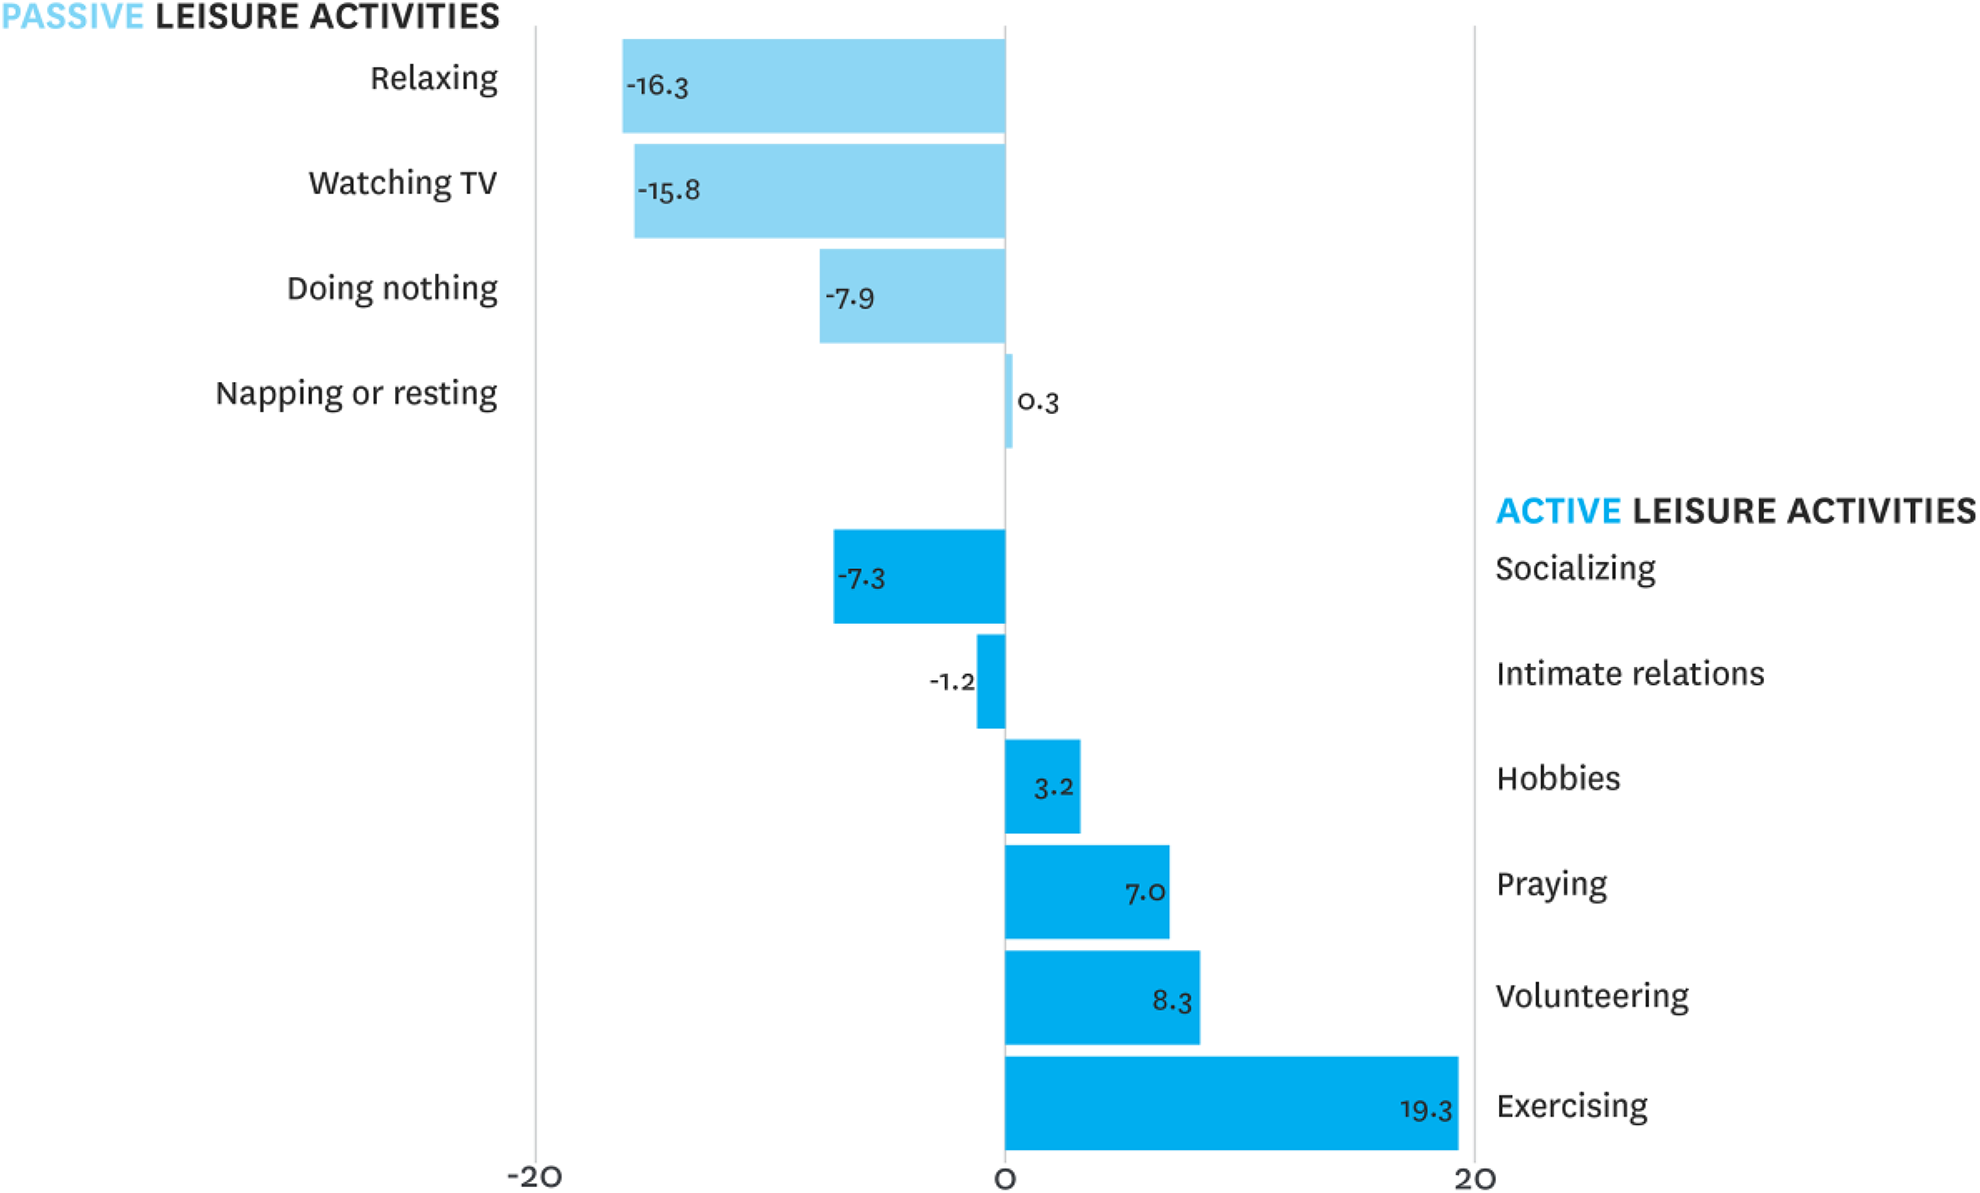
Differences in passive and active leisure activities between millionaires and the general population, in minutes. All bars represent the difference in minutes spent on each activity between millionaires and the general population. The analysis adjusts for episode length.
Detailed Results
Work and commuting
Overall, millionaires spent less time working and less time commuting than the general population (Figure 1), but this result was entirely explained by the larger fraction of millionaires who were retired (Tables S1, S2, and S4). 2 Among the employed, the wealthy reported spending a larger fraction of their time at work and commuting than the general population: 29.5% versus 24.5%, t(1,040) = 2.72, p = .007, 95% CI [1.41, 8.73], d = .17 (Table S1a). Also, in the sample of retired respondents, the wealthy reported spending a larger fraction of their time on work and commuting: 9.1% versus 6.2%, t(733) = 2.77, p = .006, 95% CI [0.84, 4.90], d = .20 (Table S1b). Overall, in both of the subgroups of working and retired individuals, the wealthy worked more. This result is consistent with previous time-use data showing that upper middle-class individuals spend more time working than the general population (Kahneman et al., 2006). Although the wealthy sample had a higher proportion of retired respondents than the representative sample, it is quite common for a substantial group of individuals to continue working in retirement. In the third quarter of 2015, when our study took place, 10.3% of people aged 65–74 in the Netherlands were working (Statistics Netherlands, 2018a). In the United States, 18.0% of people aged 65 or older were working in June 2015 (U.S. Bureau of Labor Statistics, 2018). Among millionaires, 60% report they envision “always being involved in commercial or professional work of some kind,” regardless of their age (Barclays, 2010).
Necessities
The wealthy spent the same amount of time on necessities as the general population (Figure 1). Looking at these activities separately, the wealthy and the general population spent the same amount of time cooking and shopping, while the wealthy spent less time on childcare and more time on household chores (Table S3). This is consistent with research suggesting that even when people can afford to do so, they often fail to outsource daily tasks such as cooking, cleaning, and shopping (Whillans et al., 2017). Again, these results held after controlling for differences in characteristics between the wealthy and general population (Table S7).
Leisure
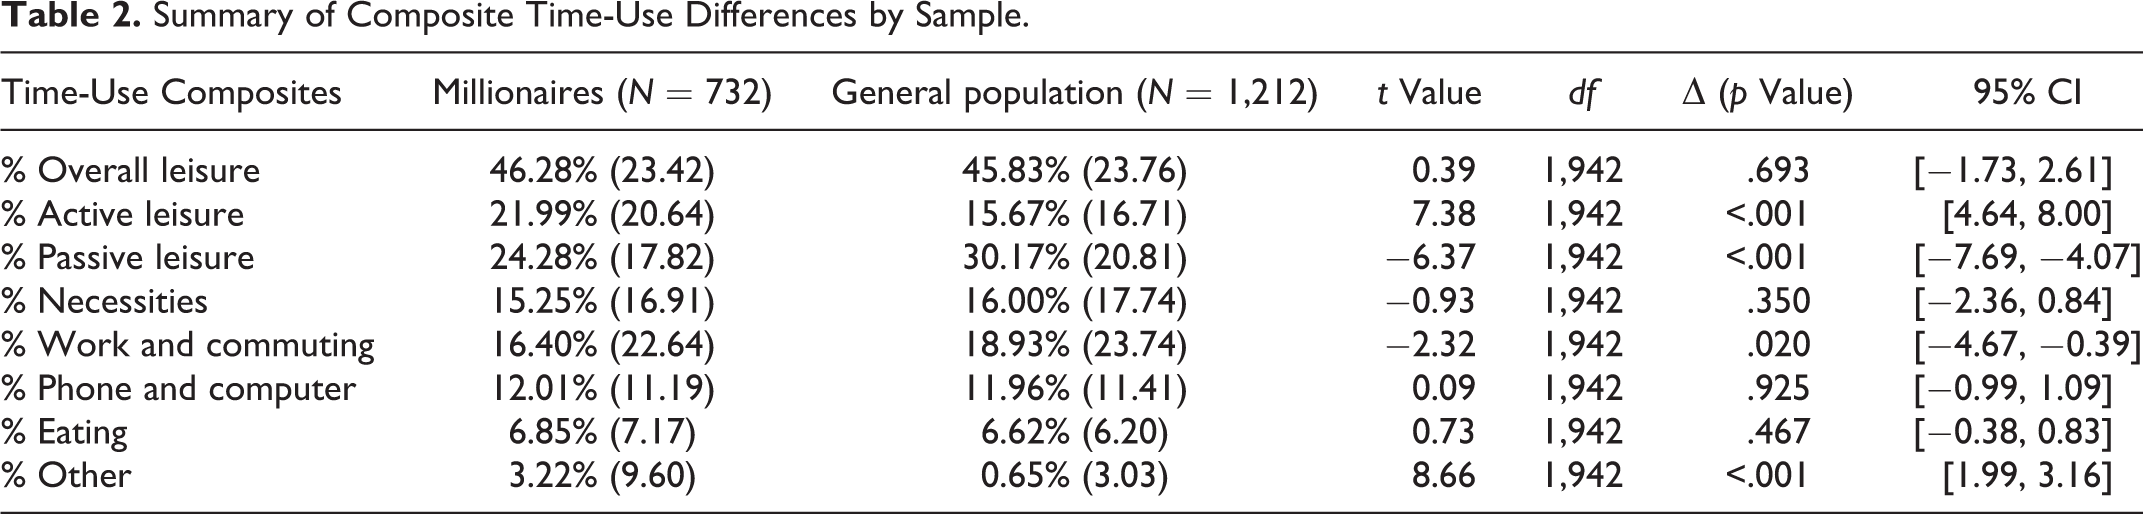
The wealthy reported spending the same amount of time on overall leisure as the general population (46.3% and 45.8%, respectively), 3 but the wealthy spent their leisure time differently than the general population (Figure 1; Tables 2–4; for additional details, see Figure S1). The wealthy spent significantly more time on active leisure (22.0% vs. 15.7%), t(1,942) = 7.38, p < .001, 95% CI [4.64, 8.00], d = .34, and they spent significantly less of their time on passive leisure (24.3% vs. 30.2%), t(1,942) = −6.37, p < .001, 95% CI [−7.69, −4.07], d = −.29. Critically, these findings held controlling for demographic differences between the samples including age, gender, employment status, and education (Tables 3 and 4). Moreover, the finding that the wealthy engage in more active and less passive leisure than the general population held in different subsamples of both working and retired respondents (Table S2a and S2b). These results show that differences between the rich and the nonrich are not simply explained by the fact that the wealthy tend to be male, older, and have more education.
Summary of Composite Time-Use Differences by Sample.
Negative Binomial Analyses of Active Leisure (%) on Sample (1 = Affluent).
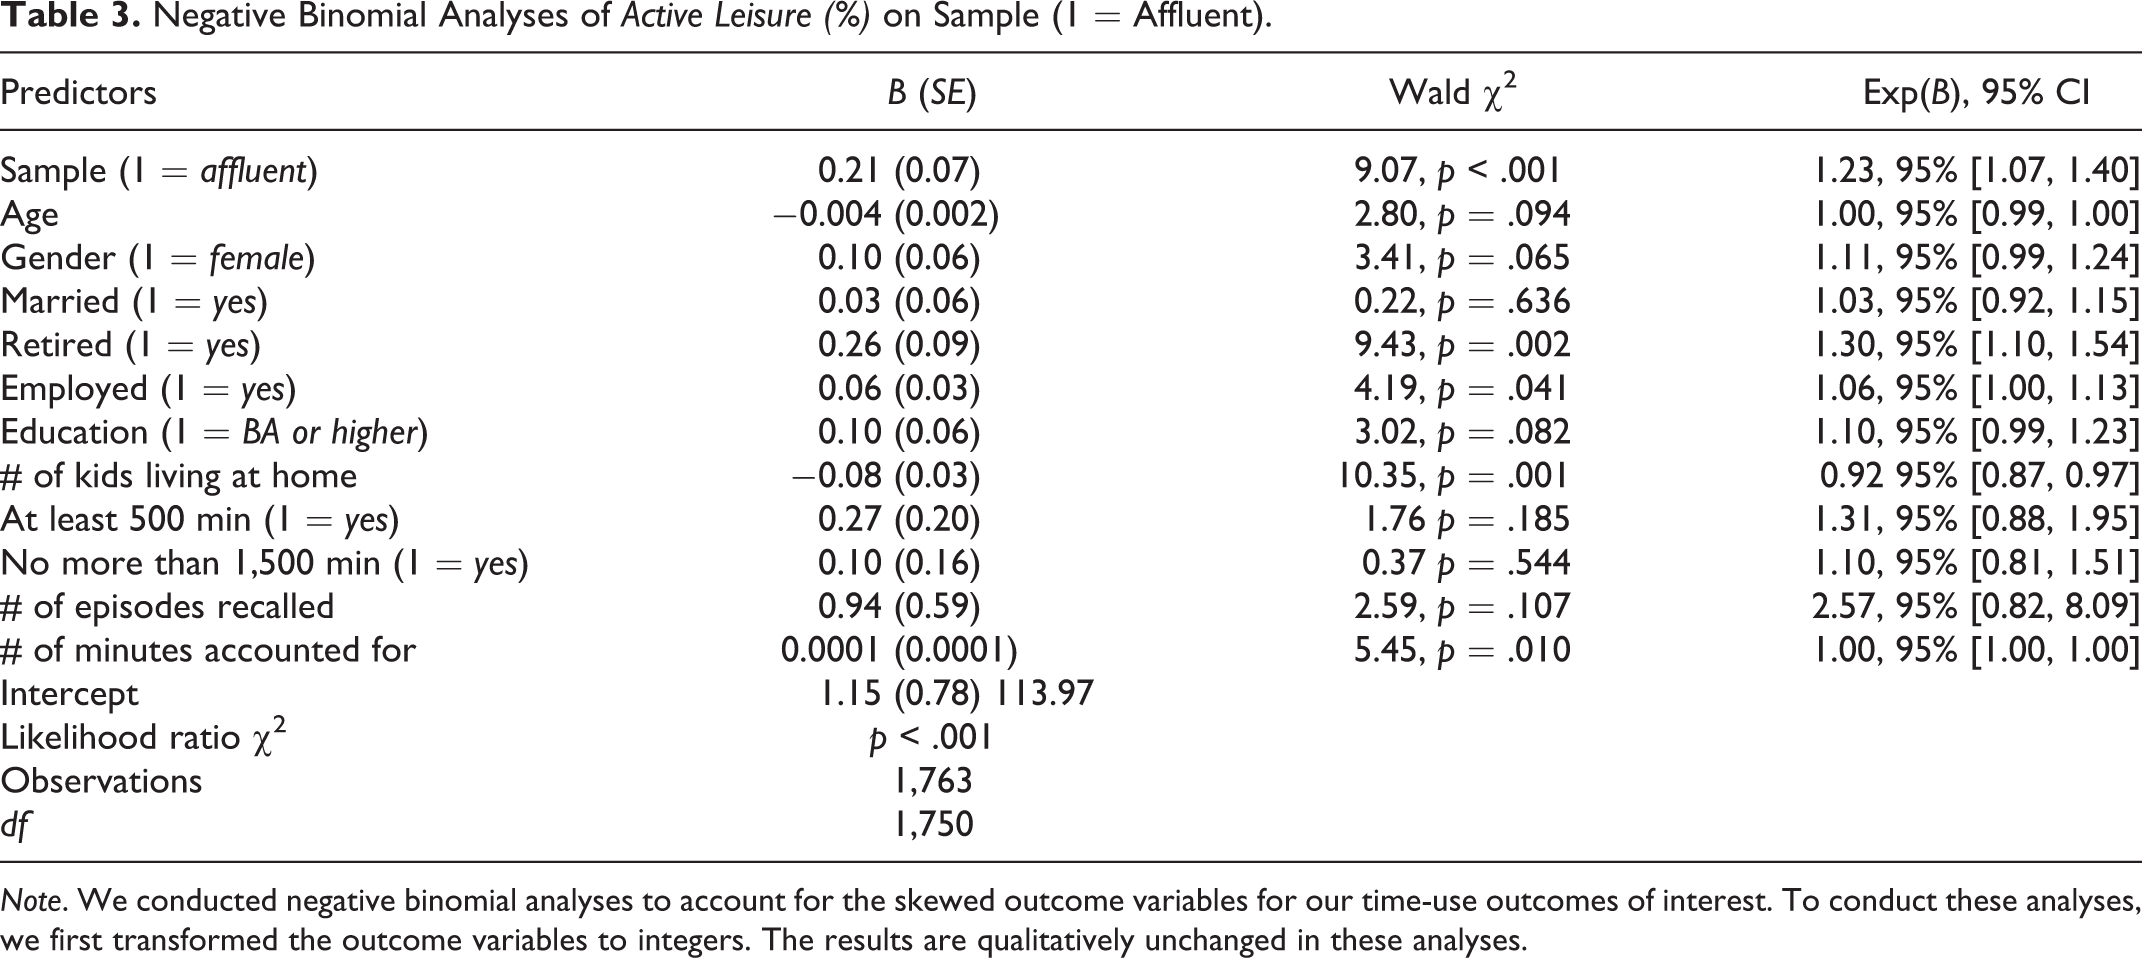
Note. We conducted negative binomial analyses to account for the skewed outcome variables for our time-use outcomes of interest. To conduct these analyses, we first transformed the outcome variables to integers. The results are qualitatively unchanged in these analyses.
Negative Binomial Analyses of Passive Leisure (%) on Sample (1 = Affluent).
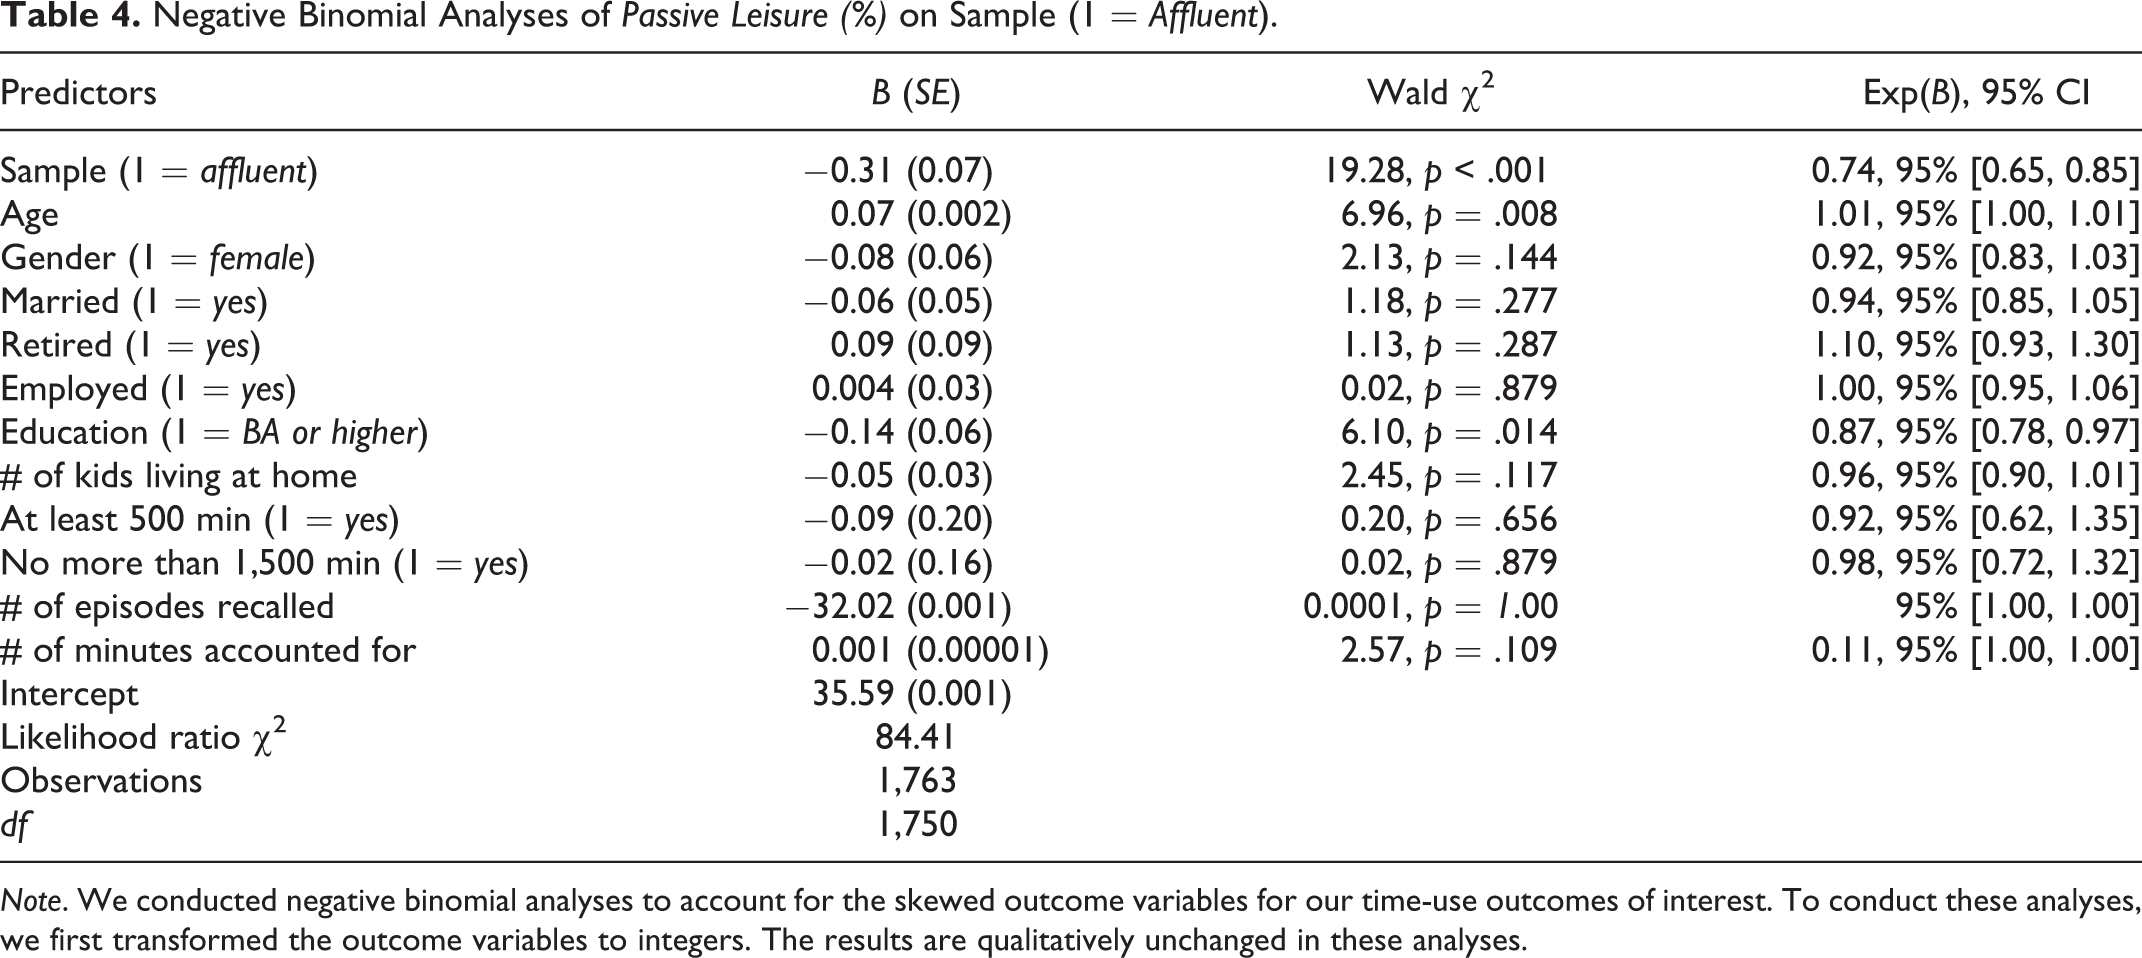
Note. We conducted negative binomial analyses to account for the skewed outcome variables for our time-use outcomes of interest. To conduct these analyses, we first transformed the outcome variables to integers. The results are qualitatively unchanged in these analyses.
Reported differently, millionaires spent approximately 29 more minutes in the last 24 hr engaged in active leisure activities as compared to the general population, with the largest contributors being the approximately 19 more minutes that millionaires spent exercising, t(1,944) = 7.04, 95% CI [13.91, 24.65] and the 8 more minutes that millionaires spent volunteering in the last 24 hr t(1,944) = 3.86, 95% CI [4.08, 12.50] compared to the general population (ps < .001).
The affluent also spent approximately 40 min less engaged in passive leisure activities as compared to the general population, with the largest contributors being the 16 fewer minutes that the affluent spent relaxing and the 16 fewer minutes that the rich spent watching TV as compared to the rest, t(1,944) = −3.89, p < .001, 95% CI [−24.45, −8.06], d = −.30, and t(1,944) = −3.05, p < .001, 95% CI [−24.38, −7.31], respectively (Figure 2).
Consistent with past research (Kahneman et al., 2006), active leisure is a composite of praying, socializing, intimate relations, exercise, hobbies, and volunteering. Passive leisure is a composite of watching TV, napping and resting, relaxing, and doing nothing. Necessities comprise of shopping, childcare, cooking, and household chores. Other comprises of time spent waiting and a self-selected “other” category. All descriptive statistics are reported as episode weighted statistics (1). This table reports the results of two-tailed t tests. Using Bonferroni correction, to adjust for examining multiple outcomes simultaneously, our adjusted significance criterion for these analyses is p < .006. None of the interpretations that we report in text are changed when applying the Bonferroni correction to adjust for multiple comparisons.
Are Differences in Time Use Related to Life Satisfaction?
Overall, the data show that the wealthy reported greater life satisfaction (M = 8.12, SD = 1.00) than the general population (M = 7.48, SD = 1.32); t(2,043) = 11.87, p < .001, 95% CI [0.53, 0.75], d = .53. Because very few respondents (just 8.6%) rated their life satisfaction below 6 or above 9—such that the scale effectively spans only four points—this 0.64 difference is substantial. Reported using regression, millionaires rated their life satisfaction significantly higher than the general population, β = 0.25, t(2,046) = 11.53, p < .001, 95% CI [0.21, 0.29], a difference in life satisfaction similar in magnitude to the reduction in life satisfaction that occurs immediately after a divorce (β = −0.27; Lucas, 2005). These results are consistent with previous research suggesting that wealth can have a positive relationship with overall life satisfaction (Deaton, 2008; Stevenson & Wolfers, 2013; Lindqvist et al., 2018).
Does the greater engagement of millionaires in active leisure relate to life satisfaction? Table 5 shows that more time spent on active leisure is positively related to the life satisfaction of millionaires, while passive leisure is negatively related to life satisfaction. Interestingly, similar results can be observed for the general population, for whom active leisure is also positively related and passive leisure negatively related to life satisfaction. Consistent with previous research (Richards et al., 2015; Wang et al., 2012), our participants seem to benefit from active leisure. At the same time, the analyses above show that the wealthy engage in significantly more active leisure and significantly less passive leisure than the general population, providing suggestive evidence that millionaires are more likely to spend time in ways that are associated with greater happiness.
Life Satisfaction Related to Each Activity by Sample.
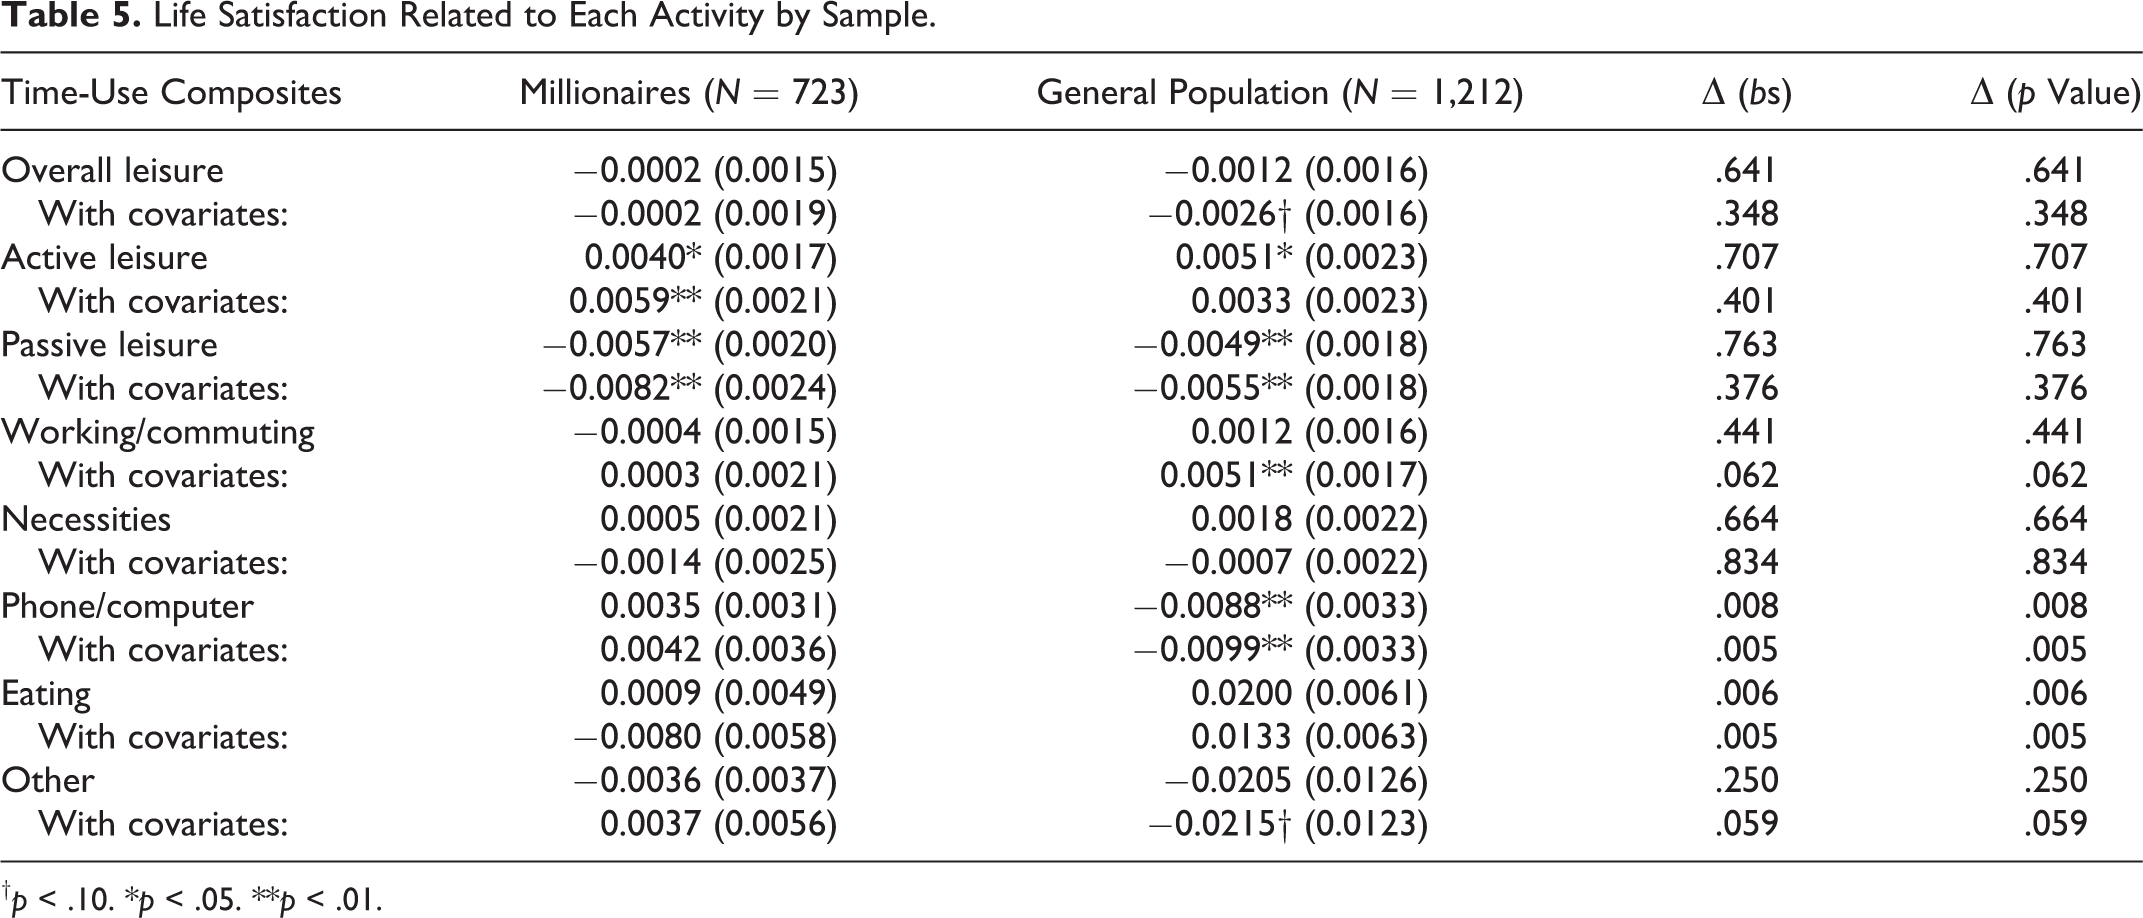
†p < .10. *p < .05. **p < .01.
This table presents unstandardized β coefficients and standard errors. Consistent with the analyses reported in the main text, we control for age, gender, marital status, a retired dummy, an employed dummy, education, and number of kids living at home that the respondent reported at least 500 min and reported no more than 1,500 min and day of week (1 = weekend). We also control for the number of episodes recalled and the number of minutes spent on other activities than leisure.
Study 2—Job Autonomy
In Study 2, we investigate whether the wealthy have greater control over their time, such as by experiencing greater job autonomy than the general population. We conducted a second study with different respondents (see Table 6 for the demographic characteristics of this sample).
Basic Demographic Characteristics of Respondents in Each Sample in Study 2.
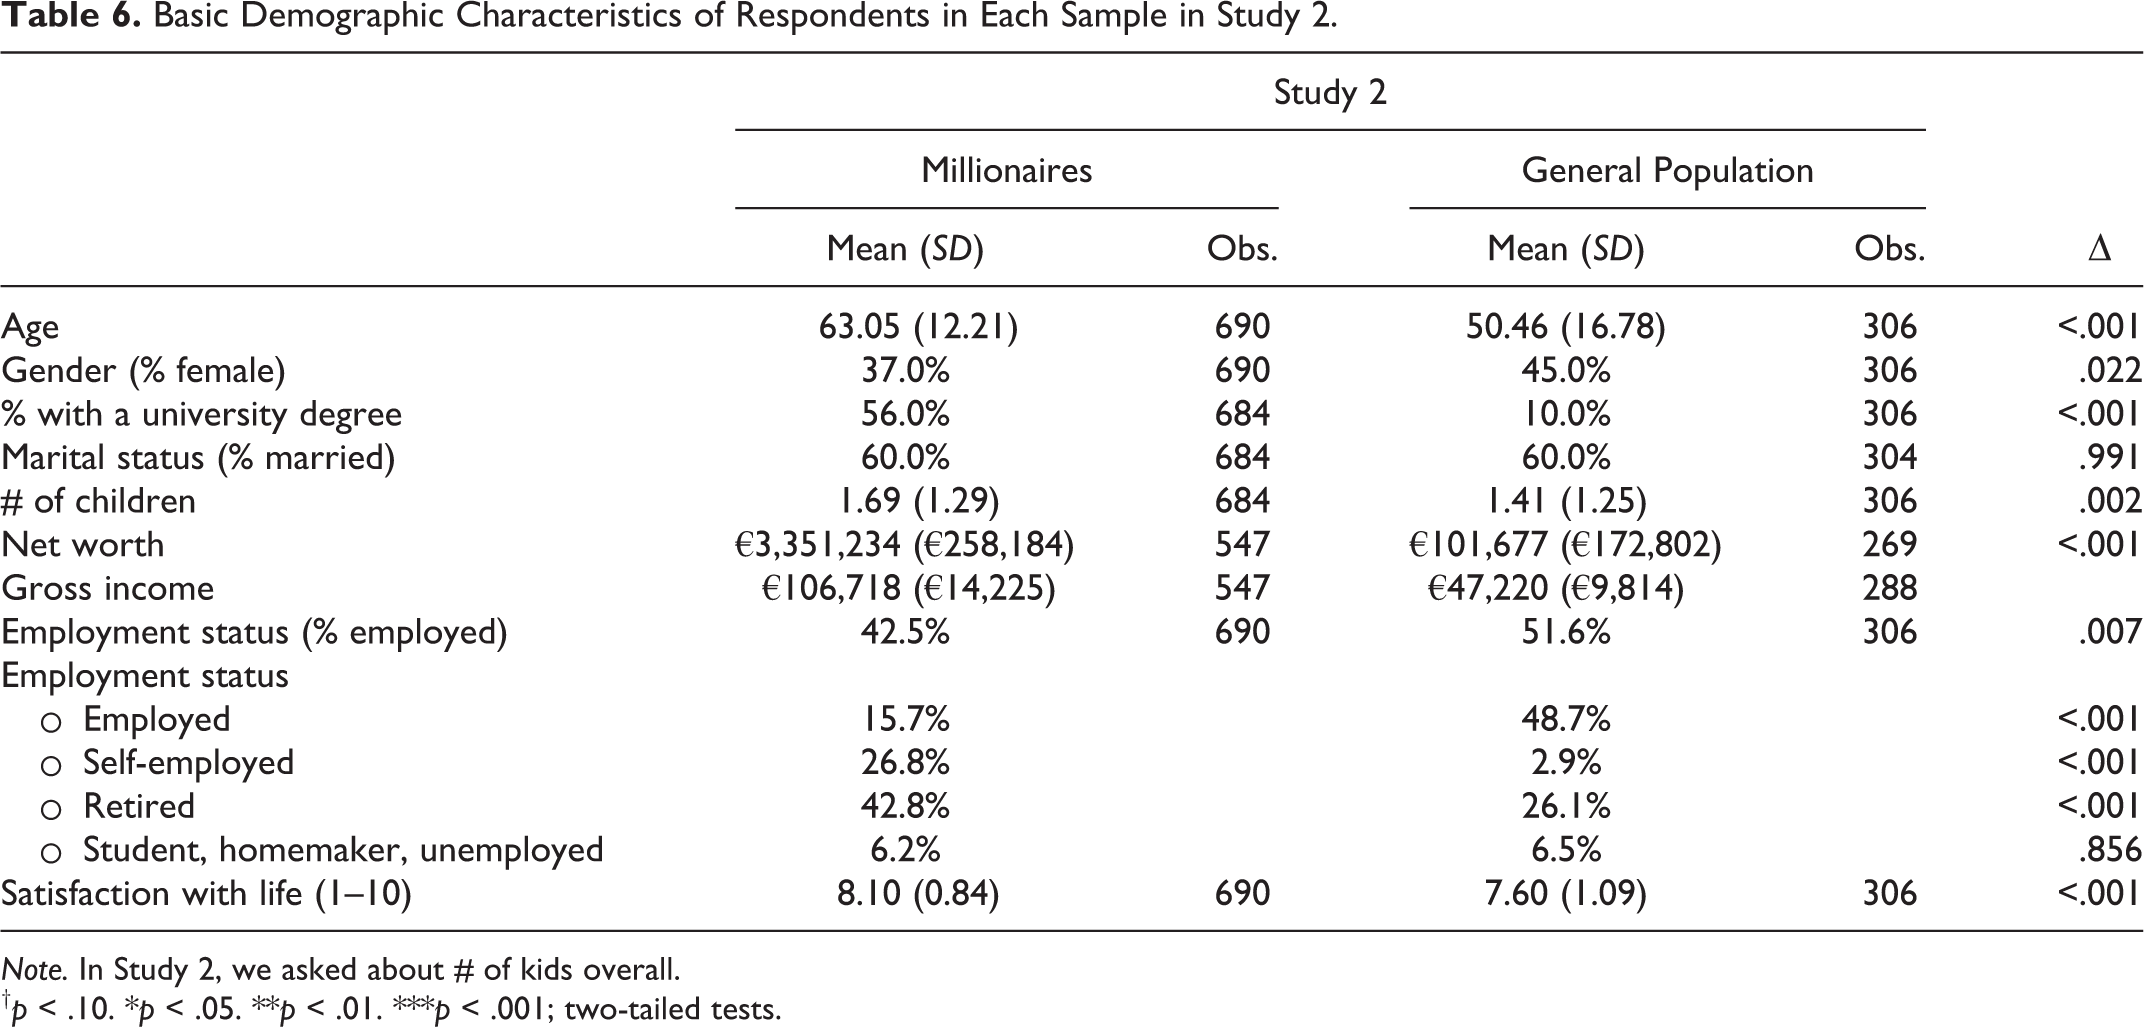
Note. In Study 2, we asked about # of kids overall.
†p < .10. *p < .05. **p < .01. ***p < .001; two-tailed tests.
Method
Participants
In Study 2, we recruited a new sample of affluent individuals in the Netherlands via ABN AMRO MeesPierson (N = 690, Mwealth = EUR3,351,234, see Table 6), a private bank for wealthy clients; this sample has been used in previous research (Smeets et al., 2015; 2017). Again, we implemented the same survey with a nationally representative sample of Dutch adults (N = 306, Mwealth = EUR101,677) via the Flycatcher panel, also previously used in Smeets, Bauer, and Gneezy (2015). This survey research met the ethical regulations and procedures for minimal risk research at one of the authors’ universities.
In Study 2, we defined wealth as the total value of net assets. In contrast to Study 1, this includes people’s own home. Of the private banking sample, 77.0% (n = 421) had at least 1 million euros of wealth, including the value of their home. This places these individuals in the top 2.5% of the wealth distribution in the Netherlands (Statistics Netherlands, 2018b). Income refers to total yearly gross household income, which combines income from labor, business, and income generated by wealth. About 12.8% (n = 70) of respondents are in the top 5% in terms of income and 25.6% (n = 140) are in the top 10% of the income distribution (see SOM).
Procedure
Respondents first reported their overall life satisfaction with the identical measure from Study 1. Respondents then indicated how many hours they worked yesterday, and they reported the percentage of those hours where they decided what to do and how to do it versus following the guidance/instructions of someone else. Moreover, respondents indicated their agreement to 3 items on a 1–7 Likert-type scale (cf. Breaugh, 1985 and see SOM).
Results
Job Autonomy
The wealthy reported greater job autonomy than the general population (Table 7). Among those who were employed, both the wealthy and the general population reported working about 8 hr in the prior 24 hr, t(326) = −1.29, p = .198, 95% CI [−1.10, 0.23], d = −.14 (wealthy: M = 7.39, SD = 3.30; general population: M = 7.82, SD = 2.00). However, of those hours, the wealthy decided what to do and how to do it 92.6% of the hours that they spent working, compared to 76.4% for the general population, t(446) = 7.49, p < .001, 95% CI [11.97, 20.48], d = .71. Stated differently, the wealthy worked autonomously for 1 hr more than the general population. Furthermore, revealing the greater job autonomy experienced by the rich, wealthy respondents reported having significantly more control over the methods they used at work, when they worked, and their goals at work (Table 7).
Work Autonomy for Millionaires and Individuals From the General Population.
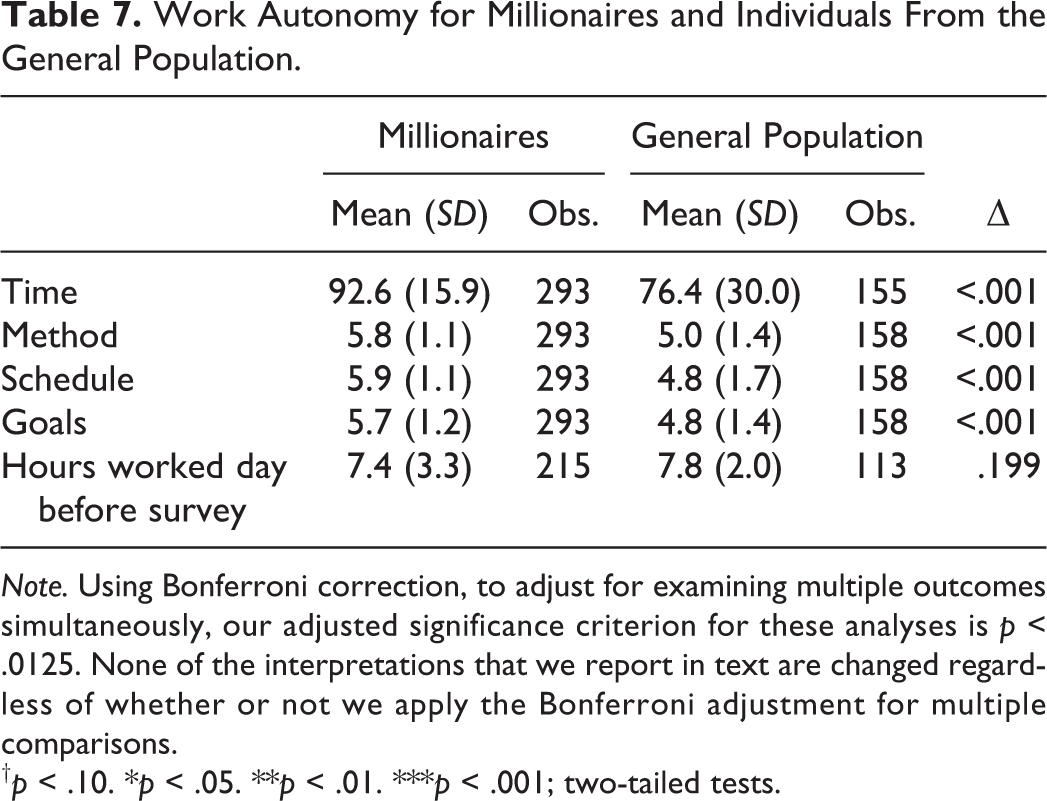
Note. Using Bonferroni correction, to adjust for examining multiple outcomes simultaneously, our adjusted significance criterion for these analyses is p < .0125. None of the interpretations that we report in text are changed regardless of whether or not we apply the Bonferroni adjustment for multiple comparisons.
†p < .10. *p < .05. **p < .01. ***p < .001; two-tailed tests.
Life Satisfaction
Consistent with Study 1, wealthy respondents reported greater life satisfaction (M = 8.10, SD = 0.84) than the general population (M = 7.60, SD = 1.09), t(994)=8.93, p < .001, 95% CI [0.44, 0.69], d = .57. Once again, few respondents (15.2%) rated their life satisfaction below 6 or above 9, suggesting that the difference in life satisfaction between the wealthy and the general population samples was substantial: half a point on the scale. Analyzing the results using regression, the wealthy reported significantly greater life satisfaction than the general population, β = 0.18, t(995) = 5.67, p < .001, 95% CI [0.12, 0.24].
Job Autonomy and Life Satisfaction
As with active leisure in Study 1, job autonomy was positively related to life satisfaction for both wealthy respondents and the general population (Tables 8 and 9). Although both samples reported greater satisfaction with life given a certain level of job autonomy, the rich experienced greater job autonomy on average. Like Study 1, these results suggest that how wealthy individuals spend time (i.e., engaged in autonomous work) may explain differences in life satisfaction between the wealthy and representative samples
The Relationship Between Life Satisfaction and Job Autonomy (Affluent).
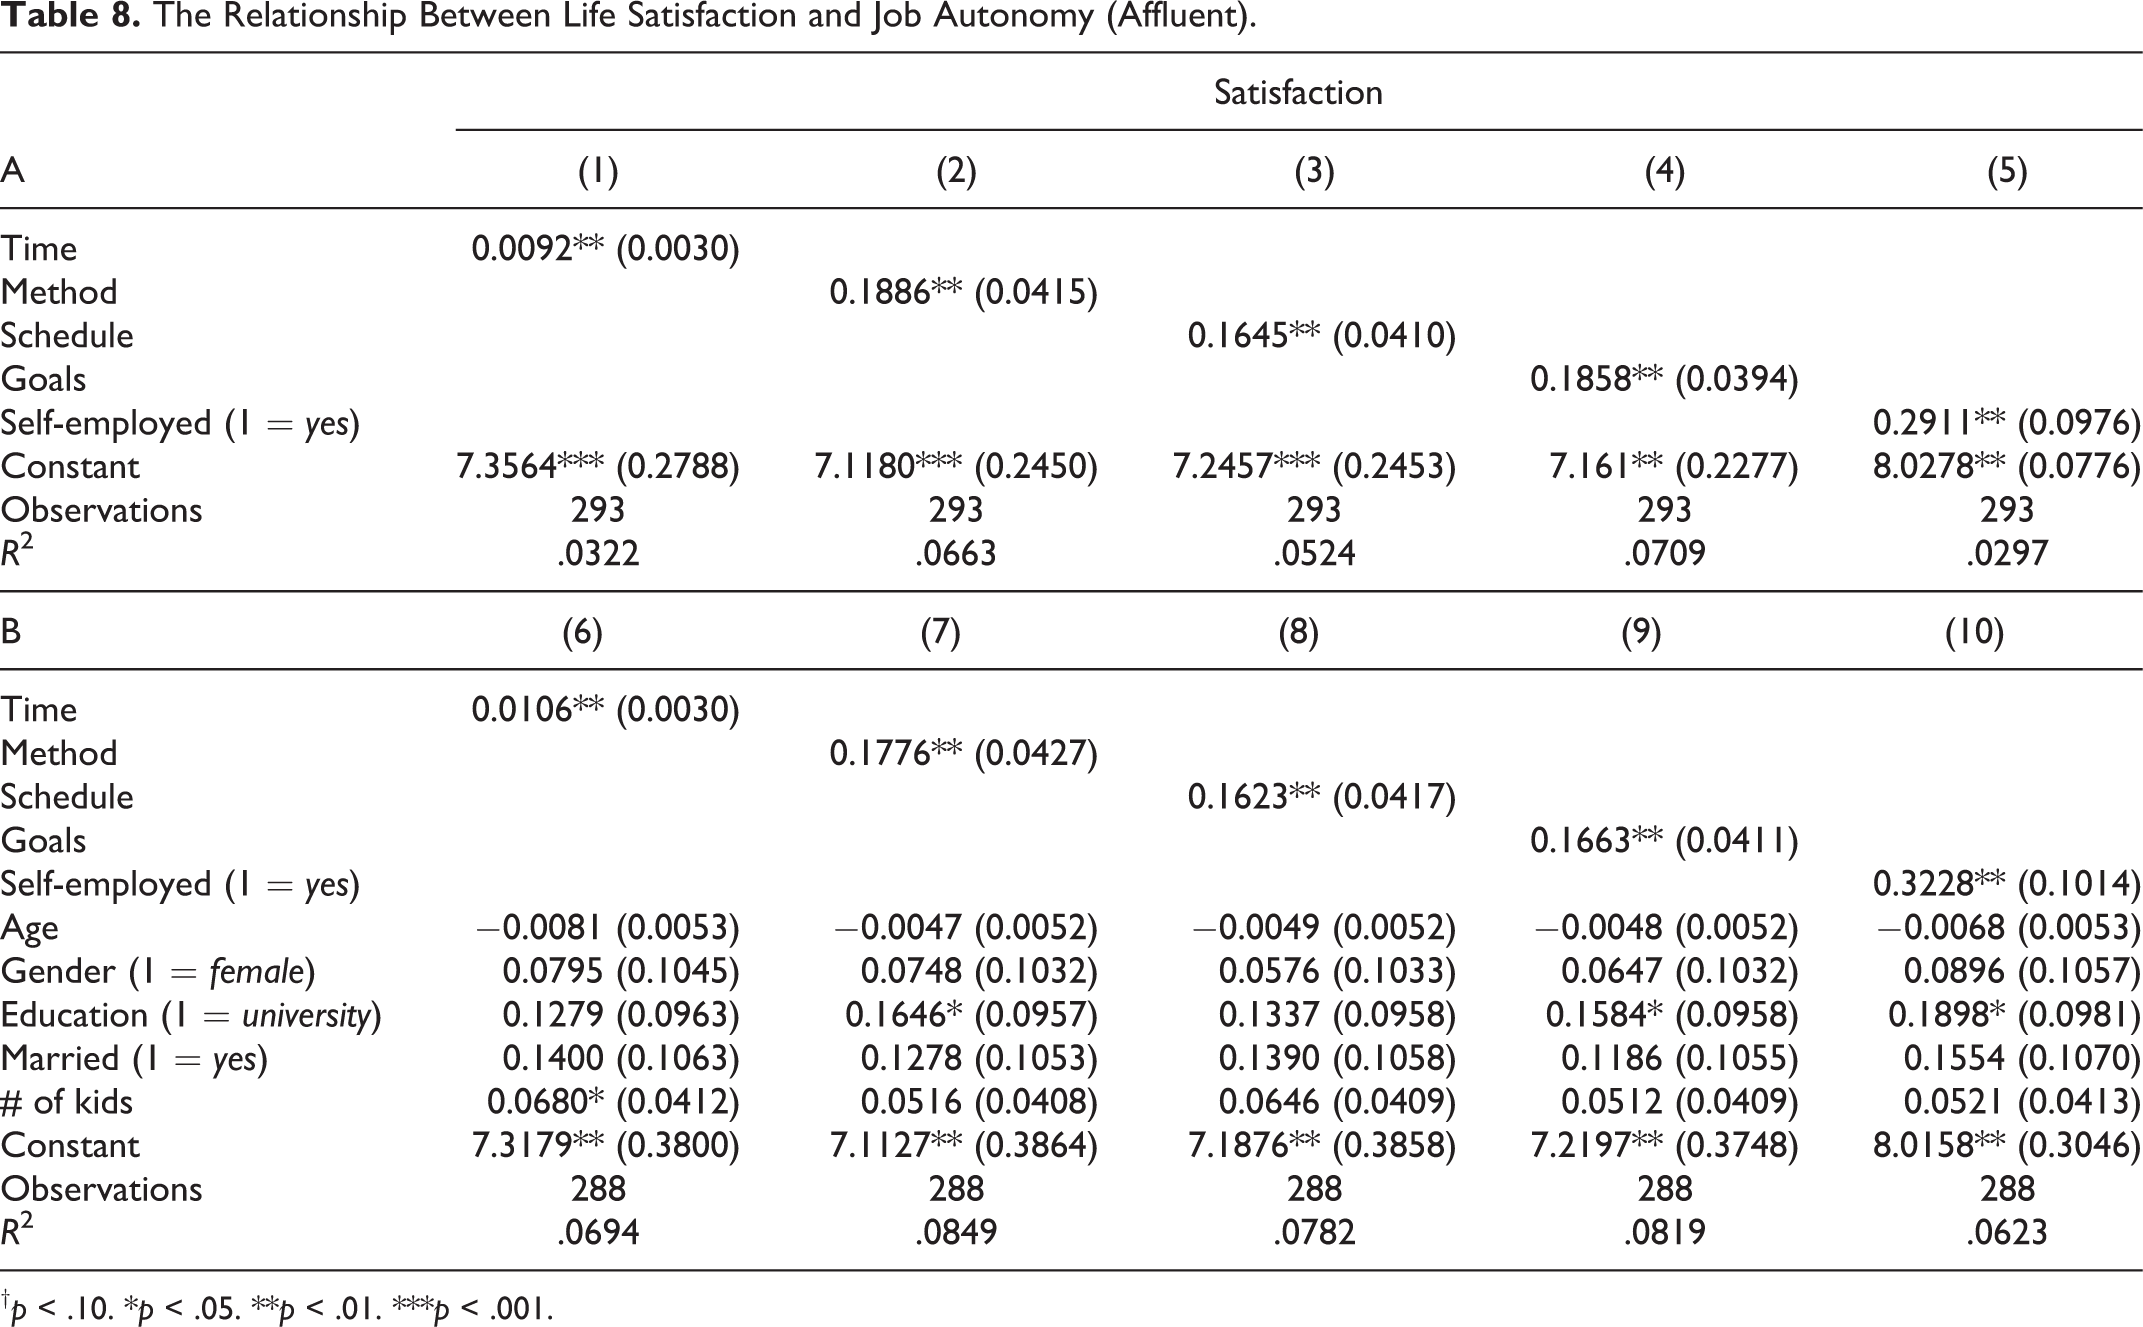
†p < .10. *p < .05. **p < .01. ***p < .001.
The Relationship Between Life Satisfaction and Job Autonomy (General Population).
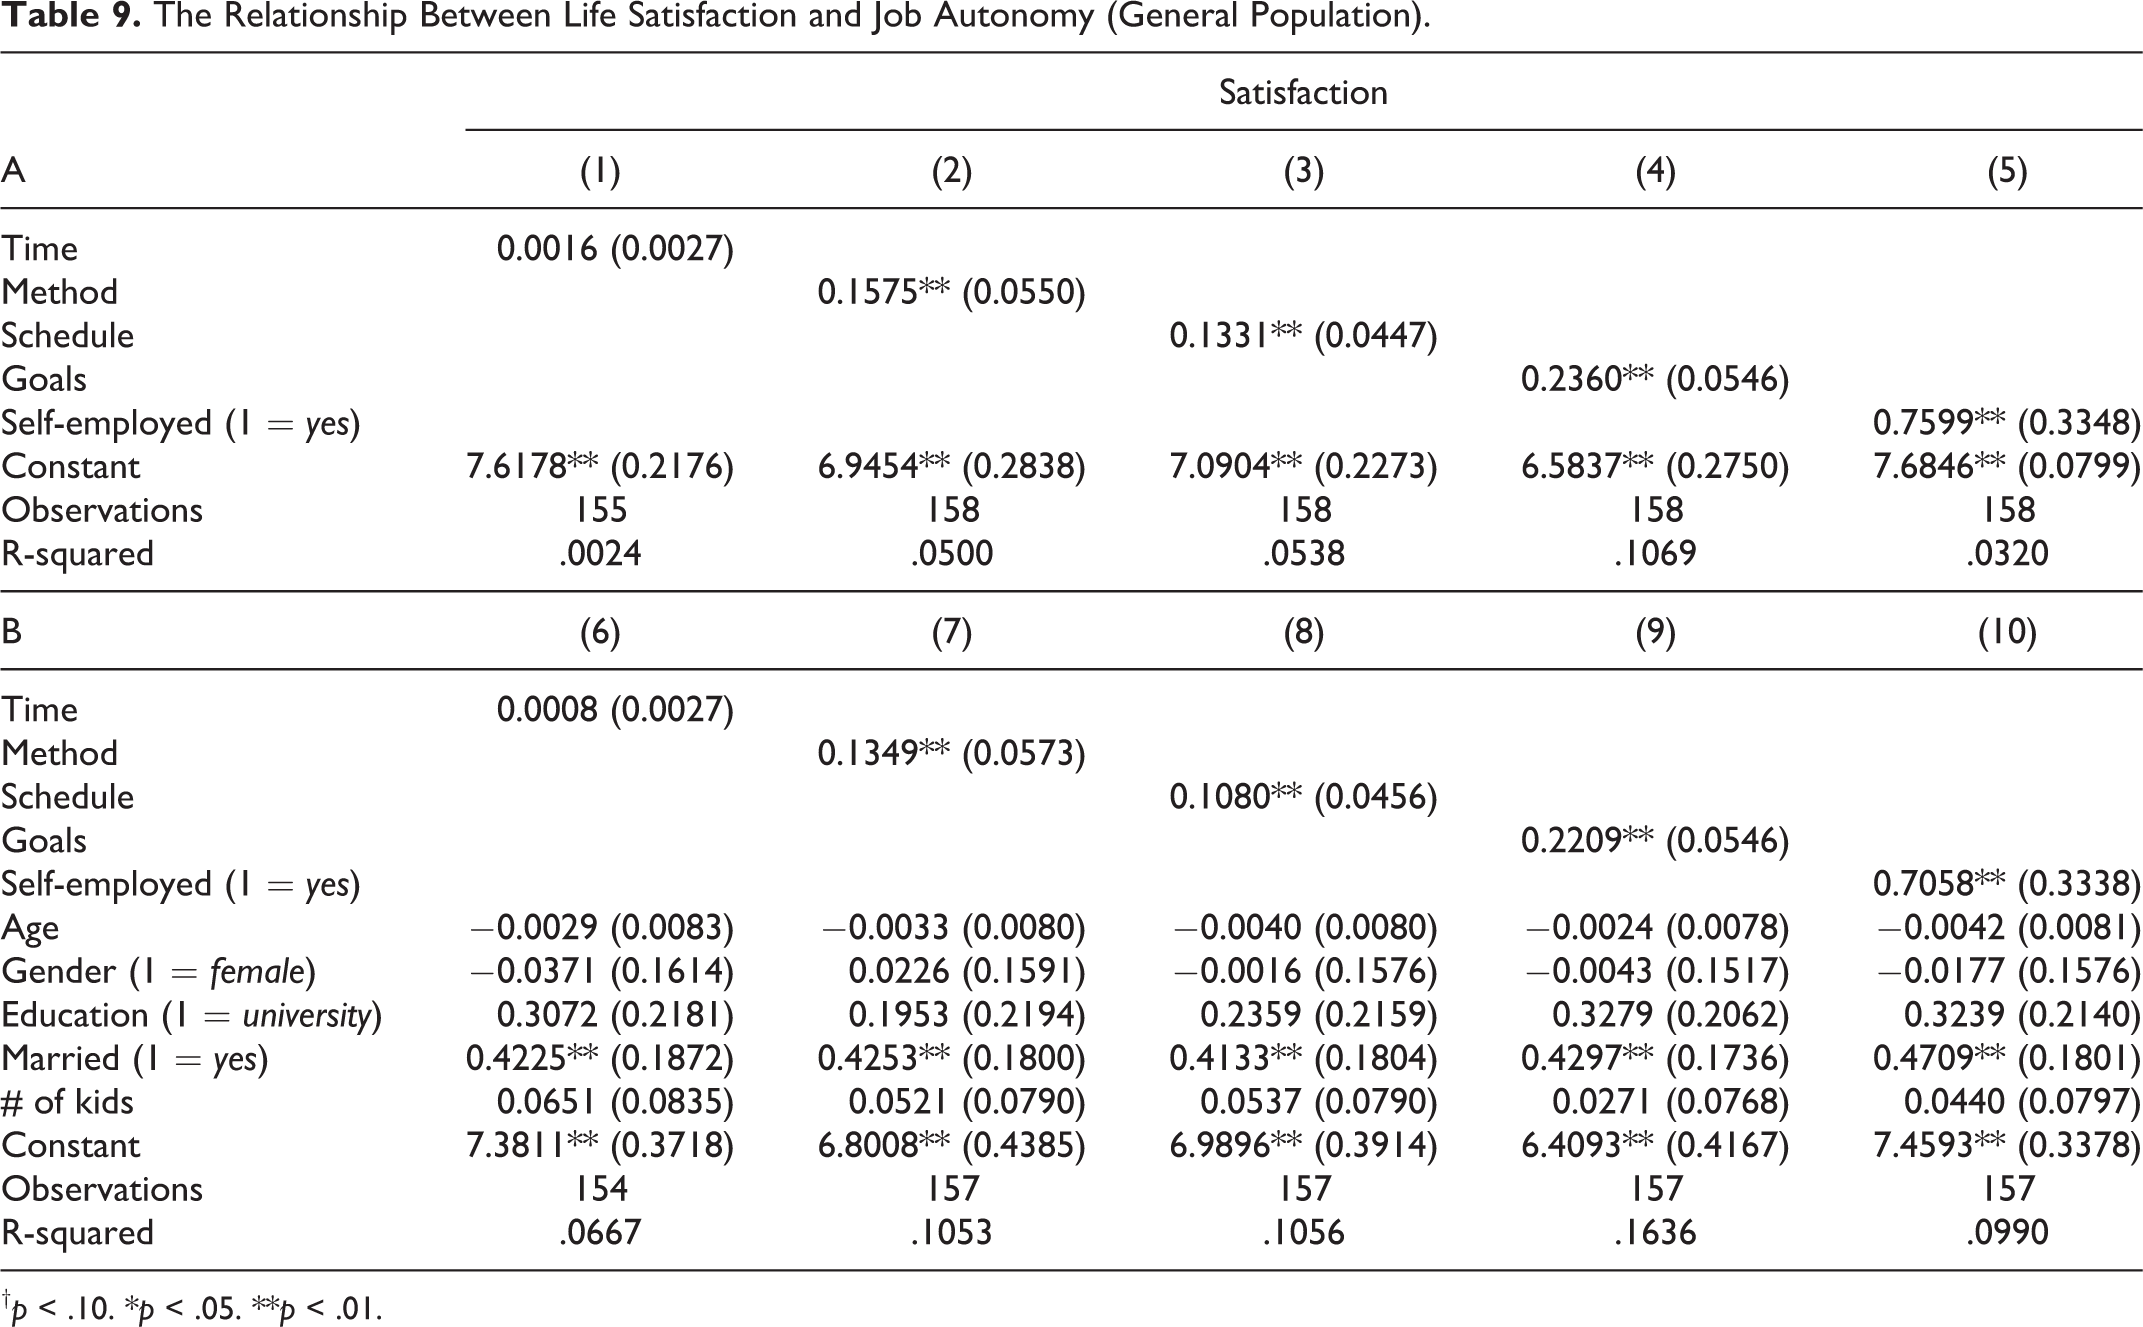
†p < .10. *p < .05. **p < .01.
General Discussion
We show that millionaires spend their time in surprisingly similar ways as the general population. In Study 1, we find that respondents with high income/net worth and the general population spent the same amount of time on overall leisure, but millionaires engaged in less passive—and more active—leisure. We also show that these differences in time use between the affluent and the general population could have potential implications for happiness, given that active leisure was positively related to life satisfaction, but passive leisure was negatively related to life satisfaction. In Study 2, we show that millionaires have greater job autonomy than the general population. Greater job autonomy was associated with higher happiness. Together, these studies point to the possibility that how the wealthy spend time at work and outside of work may help to explain when wealth positively shapes well-being.
The greater control over time at work observed among the wealthy might also help to explain why they were able to exert more effort and energy over other aspects of their lives—such as by engaging in active leisure activities like volunteering. Wealthier individuals might be able to engage in greater active leisure because they come home from work feeling more energized and less fatigued. Future research could more specifically examine this possibility.
Of course, millionaires differ from the general population in their demographic characteristics, which could account for our results. Millionaires in general are more likely to be male, older, retired, and have a higher level of education. For example, the top 10 richest people in the world are nearly all old (53, 61, 81, 87, 33, 81, 72, 75, 68, 81 men; Time Magazine, 2017). We observe similar differences between the wealthy and the general population. Importantly, however, our key results showing that the wealthy engage in more active and less passive leisure than the general population are robust to controlling for these differences, regardless of whether we use ordinary least squares regression, negative binomial regressions, or propensity score matching techniques.
In addition to differences in job autonomy and demographic characteristics, millionaires might differ in other ways from the general population that could influence time use and happiness. Personality characteristics that predict wealth and/or are shaped by wealth (Leckelt et al., 2018) could help to explain why wealthy individuals engage in more active leisure. Investigating the moderating role of personality is a promising avenue for future research (see also Matz, Gladstone, & Stillwell, 2016). For example, wealthier individuals tend to be more oriented toward personal control and report a greater desire to have control over their daily decisions (Abele & Wojciszke, 2007; Kraus, Piff, & Keltner, 2011; Markus & Kitayama, 2010; Stephens, Markus, & Townsend, 2007).
Relatedly, active leisure is associated with greater personal control: In an online study using the Flycatcher panel, respondents (N = 102) reported that engaging in active leisure activities required significantly higher levels of deliberate choice (M = 77.82, SD = 19.66) compared to engaging in passive leisure activities (M = 61.59, SD = 22.55), t(102) = 7.58, paired samples t test, p < .001, d = 1.50. Thus, the links between engaging in active leisure with life satisfaction may be driven in part by the greater existence and preference for control over time that wealth engenders. Indeed, our result that millionaires reported greater job autonomy than the general population is in line with the greater control the rich both experience and exert over their time (Kraus et al., 2006).
Several other differences between the rich and the nonrich are worthy of exploration in future research on time use and happiness. First, richer individuals tend to be healthier than less rich individuals (Ecob & Smith, 1999; Sorlie, Backlund, & Keller, 1995). It could therefore be the case that wealthy individuals engage in more active leisure and less passive leisure than the general population because their physical condition is better. Better health has also been shown to be positively related to life satisfaction (Diener, 1984; Palmore & Luikart, 1972).
Second, wealthy individuals tend to live in different neighborhoods than the general population. The neighborhood in which people live can influence both time use and happiness. For example, if a neighborhood has a nice city park and good sports facilities, running actively will be more attractive as compared to a neighborhood that is less inspiring (Cramm, Van Dijk, & Nieboer, 2012; Saelens, Sallis, Black, & Chen, 2003). Moreover, social pressure of the neighborhood could influence the behavior of millionaires differently, such as by encouraging individuals to volunteer if other individuals in their community engage in this behavior.
We note that our study took place in the Netherlands. The gap in time use and happiness between the rich and the nonrich could be different in other countries. For example, in the Netherlands, the income inequality is much smaller than in other countries like the United States (Piketty, 2014). The Dutch government actively promotes sports and physical activity, also among less wealthy people (Rijksoverheid, 2018). Thus, differences in time use between the affluent and the general population could even be larger in more unequal countries.
Our results show a positive correlation between active leisure and life satisfaction. Future research should investigate the causal relationship between these two variables. A recent meta-analysis shows that the correlation between physical activity and happiness is robust across many studies. A few randomized controlled trials hint to the possibility that this relationship might be causal, but the evidence base is still weak (Zhang & Chen, 2019). In a similar vein, success not only influences happiness, happy people also tend to be more successful (Lyubomirsky, King, & Diener, 2005; Walsh, Boehm, & Lyubomirsky, 2018). Given the strong correlations between active leisure and happiness, as well as happiness and financial success, a promising avenue for future research is to establish a causal relationship between leisure, happiness, and productivity.
While most research examining the associations between wealth and time use has focused on between-subject comparisons, additional research should focus on how much satisfaction individuals from different wealth backgrounds reap from various activities throughout the day. For example, less wealthy individuals might derive greater immediate mood boosts from passive leisure (to the extent that they come home tired), whereas wealthier individuals might derive greater immediate mood boosts from active leisure (to the extent that they gain social status benefits from engaging in active leisure such as volunteering). Differences in the immediate mood benefits of various activities may help to explain why wealthy and less wealthy groups engage in different amounts of these activities each day. Over time, the additional active leisure conducted by the wealthy daily could translate into experiencing greater satisfaction with their lives (as we have observed in the current data).
Taken together, our findings offer new insights for an emerging body of research focusing on the contributions of time and money to life satisfaction (Aaker et al., 2011; Hershfield et al., 2016; Mogilner & Aaker, 2009; Whillans et al., 2017; Whillans et al., 2016). While past research has primarily focused on the direct relationship between money and life satisfaction (Boyce et al., 2017; Clark et al., 2008; Diener et al., 1993; Dunn et al., 2008; Hagerty & Veenhoven, 2003; Kahneman & Deaton, 2010; Kahneman et al., 2006; Kraus et al., 2006; Lucas & Dyrenforth, 2006; Lucas & Schimmack, 2009), often by plotting income against life satisfaction, we show that wealth is associated with different expenditures of time. In addition to assessing the direct relationship between money and happiness and examining the effects of spending decisions on happiness, one fruitful avenue for future research centers on the fact that wealth might shape the way that people think about and spend their time.
The current study is the first to document differences in both time use and life satisfaction between millionaires and the general population and to demonstrate their interconnected nature. Kahneman et al. (2006) document a relationship between income and time use using a sample with only a handful of wealthy individuals, while Donnelly, Zheng, Haisley, and Norton (2018) examine the happiness of millionaires without assessing time use. While the wealthy have received enormous media attention, little is known about their daily lives. We find that, surprisingly, millionaires spent their time in remarkably similar ways to the general population. Yet they engage in more active leisure and enjoy greater job autonomy than the general population, two aspects that are positively related to life satisfaction.
Supplemental Material
Supplemental Material, SOM_Time_Use_Millionaires_SUPPLEMENTARY - Time Use and Happiness of Millionaires: Evidence From the Netherlands
Supplemental Material, SOM_Time_Use_Millionaires_SUPPLEMENTARY for Time Use and Happiness of Millionaires: Evidence From the Netherlands by Paul Smeets, Ashley Whillans, Rene Bekkers and Michael I. Norton in Social Psychological and Personality Science
Footnotes
Declaration of Conflicting Interests
The author(s) declared no potential conflicts of interest with respect to the research, authorship, and/or publication of this article.
Funding
The author(s) disclosed receipt of the following financial support for the research, authorship, and/or publication of this article: Nederlandse Organisatie voor Wetenschappelijk Onderzoek (Grant No. 016.Veni.175.019).
Supplemental Material
The supplemental material is available in the online version of the article.
Notes
References
Supplementary Material
Please find the following supplemental material available below.
For Open Access articles published under a Creative Commons License, all supplemental material carries the same license as the article it is associated with.
For non-Open Access articles published, all supplemental material carries a non-exclusive license, and permission requests for re-use of supplemental material or any part of supplemental material shall be sent directly to the copyright owner as specified in the copyright notice associated with the article.