
Abstract
Background
Accurate donor-recipient matching of the femoral condyle radius of curvature (ROC) in osteochondral allograft (OCA) transplantation may aid in minimizing articular surface incongruities. Matching linear femorotibial dimensions, such as the femoral condyle anterior-posterior length (APL), femoral condyle width (lateral-medial length, LML), femoral hemicondyle width (HCW), and tibial plateau width (TPW), can provide similar results if they correlate well with ROC. This study investigates the relationship between femorotibial dimensions and ROC at the cartilage surface using magnetic resonance imaging (MRI).
Methods
Deidentified MRI images of 63 patients (35 men, 33 ± 10 years old, and 28 women, 27 ± 8 years old) were analyzed. Axial images were used for APL, LML, and TPW (TPW-Ax) measurements, while coronal images were used for HCW and TPW (TPW-Cor) measurements. Cartilage was segmented in true sagittal images at the medial femoral condyle (MFC) and lateral femoral condyle (LFC) to calculate their specific cartilage surface ROCs. Linear regression models were used to determine the relationship between the femorotibial dimensions and ROC.
Results
Cartilage ROC was significantly correlated with all the linear femorotibial dimensions at the MFC (P < 0.01, R2 = 0.78, 0.69, 0.67, 0.59, and 0.37 for ROC correlations with APL, LML, TPW-Ax, TPW-Cor, and HCW, respectively), and the LFC (P < 0.01, R2 = 0.81, 0.61, 0.56, 0.54, and 0.41 for ROC correlations with APL, LML, TPW-Ax, TPW-Cor, and HCW, respectively).
Conclusions
The APL was the most predictive femorotibial dimension of the cartilage surface ROC. Donor-recipient APL matching in OCA transplantation may provide a similar level of matching to that achievable by direct ROC measurements. The APL matching may help reduce cartilage incongruities, particularly for patients with large osteochondral lesions, in which the ROC measurement cannot be accurately determined.
Keywords
Introduction
Focal osteochondral lesions of the femoral condyle may result in knee pain and loss of function in the general population and athletes.1,2 Autologous chondrocyte implantation (ACI), osteochondral autograft transfer system (OATS), and osteochondral allograft (OCA) transplantation are common surgical treatments that may be used to restore the articular surface.3,4 OCA transplantation, in particular, offers a single-stage solution to treat large focal lesions using well-matched grafts from deceased donors.2,3,5 OCA transplantation has been performed for decades and has shown favorable patient-reported outcomes and survivorship of nearly 90% at 5 years and 75% at 10 years.3,6
Several investigations have focused on the matching process of an OCA to the recipient condyle and the potential impacts on the clinical outcomes and the survivorship rate of the graft.3,4,7 OCA matching aims to optimize the contour congruity at the cartilage surface by minimizing the size and morphology differences between the curvature of the graft and the recipient condyle.3,8,9 The radius of curvature (ROC) of the femoral condyle has been investigated by Bernstein et al. 10 as an isolated criterion for donor-recipient matching in OCA transplantation, which resulted in a significantly higher surface restoration rate compared with the traditional matching process based on femorotibial dimensions. Gursoy et al. 7 have reported the negative impacts of donor-recipient ROC mismatches on midterm clinical outcomes, where mean Knee injury and Osteoarthritis Outcome Scores (KOOS) for function in daily living, as well as in sport and recreation were higher in patients with matched ROCs. ROC matching has also been recommended for OCA transplantations in the glenohumeral joint 11 and OATS procedures in the knee. 12 Nevertheless, in patients with large osteochondral lesions, the native topography or the cartilage surface has been significantly altered, and an accurate ROC measurement is highly unlikely.
The donor-recipient matching process for OCA transplantation of large lesions might be performed using simple femorotibial dimensions if they correlate well with the femoral condyle ROC. Several femorotibial dimensions have been previously used in the literature for the OCA donor-recipient matching process, such as the femoral condyle anterior-posterior length (APL), femoral condyle width (lateral-medial length, LML), femoral hemicondyle width (HCW), and tibial plateau width (TPW).4,10,13-16 Du et al. 13 reported significant positive linear correlations between ROC and APL for both the medial femoral condyle (MFC) and lateral femoral condyle (LFC) performed on magnetic resonance (MR) images. Correlations of other femorotibial dimensions with the cartilage surface ROC have not been investigated nor compared with the ROC/APL correlation. Jerban et al. 17 have recently investigated such correlations measured on computed tomography (CT) images and observed significant ROC correlations with APL, LML, TPW, and HCW, where ROC/APL correlation was the highest. Notably, ROC measurement using standard CT images is limited to the osseous surface, which is likely different from the cartilage surface ROC given variations in cartilage thickness in different areas of the femoral condyle.18-20
The main objective of this study is to investigate the cartilage surface ROC correlations with the femorotibial dimensions, APL, LML, HCW, and TPW, as measured on MRI images. This MRI-based study was crucial as most clinicians are obtaining MR imaging preoperatively to assess the chondral lesion. Since the cartilage surface ROC is measured in anterior-posterior plane of the joint, its correlation with APL is hypothesized to be higher than correlations with LML, HCW, and TPW, which are width-related dimensions of the knee joint.
Materials and Methods
Study Design, Inclusion, and Exclusion Criteria
This retrospective study was performed on knee MR images of patients with potential chondral lesions on MFC or LFC. Deidentified knee MR images of 63 patients were provided by Joint Restoration Foundation (JRF). MFCs and LFCs with large lesions were excluded, which could create challenges for reasonable ROC measurements. However, MFCs and LFCs with minor lesions were included in the study. Cartilage surfaces of minor lesions and disruptions were approximated by a semiautomatic processing algorithm created by an experienced image analyst in MATLAB software (Mathworks, MA, USA), which is not expected to affect the accuracy of the ROC measurements adversely. This study was conducted per applicable good clinical practice requirements, relevant guidelines, and regulations and was Health Insurance Portability and Accountability Act compliant.
Femorotibial Dimension Measurement
The APLs were measured by scrolling through the axial fat-saturated T2-weighted (FS T2-W) images that were available for all patients, selecting an optimal slice showing the longest distance between the most anterior and posterior points of the cartilage surface on the MFCs and LFCs. The optimal image selection was performed via visual evaluation by an experienced medical image analyst (S.J.) with over 10 years of image processing experience. This approach is consistent with others in the literature and among tissue banks.13,17
Fig. 1A shows a representative FS T2-W image of the knee joint in the axial plane, where the APL measurements of the MFC and LFC are demonstrated schematically. The APLs of MFC and LFC were measured on the same slice. All measurements were performed using an in-house semiautomatic algorithm that let the image analyst to select 2 points on the image for each femorotibial dimension. The APL of the MFC was defined as the distance between the medial margin of the femoral trochlea cartilage (first selected point) and the center of the cartilage surface of the far posterior MFC (second selected point). Likewise, the APL of the LFC was defined as the distance between the lateral margin of the femoral trochlea cartilage and the center of the cartilage surface of the far posterior LFC.
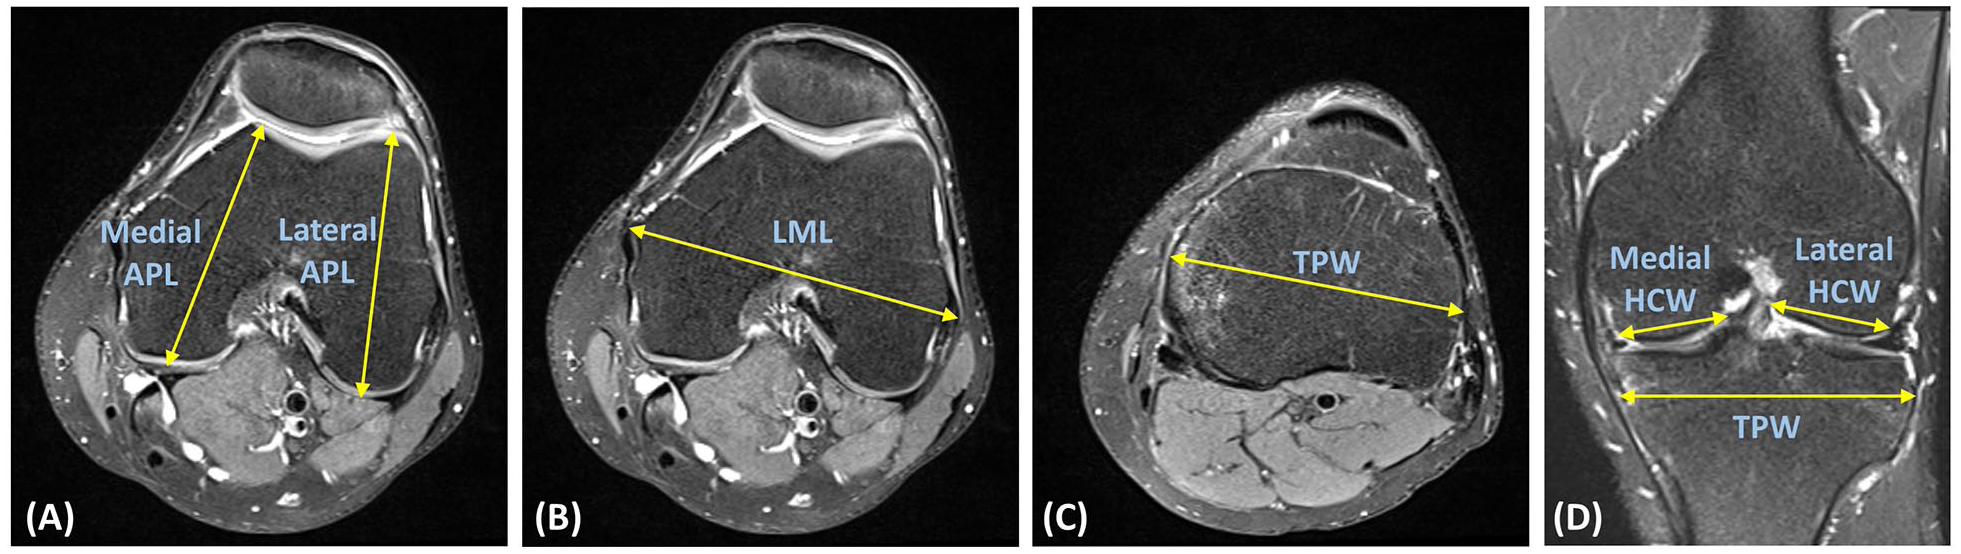
Schematics of femorotibial dimension measurements illustrated on fat-saturated T2-weighted (FS T2-W) MRI images of a representative knee joint (right side). (
LML (condyle width) was measured on an optimal axial slice, showing the longest distance between the most medial and lateral points of the epicondylar region. Notably, the axial MR image used for the APL measurements was often also used for LML measurement. Fig. 1B shows the schematics of the LML measurement on the same representative FS T2-W image of the knee joint in the axial plane. LML was defined as the distance between the outer surfaces of the medial and lateral epicondyles.
The TPW was first measured on the axial plane on the tibial plateau, as shown in Fig. 1C . Axial MR images were scrolled by the same medical image analyst to select an optimal slice showing the longest distance between the medial and lateral surfaces of the tibial plateau within the epiphysis. TPW on the axial plane (TPW-Ax) was defined as the distance between the center points of the most lateral and medial surfaces of the tibial plateau.
The TPW was measured again on the coronal FS T2-W images. Coronal MR images were scrolled by the same medical image analyst to select an optimal slice showing the longest distance between the medial and lateral surfaces of the tibial plateau within the epiphysis. Measuring the TPW on the coronal plane (TPW-Cor) was accompanied by the HCW of MFC (medial HCW) and LFC (lateral HCW) measurements. HCWs were defined as the distances from the peripheral surfaces to the intercondylar fossa (lines were drawn parallel to the cartilage surface of the respective condyle). Fig. 1D shows the schematics of the TPW-Cor, medial HCW, and lateral HCW measurements on a representative FS T2-W image of the knee joint in the coronal plane.
ROC Measurement
MFC and LFC ROCs were measured on the true sagittal plane of the MFC and LFC, respectively. ROC measurements were performed using proton density-weighted (PD-W) images or T1-weighted (T1-W) images, if the PD-W images were unavailable. ROC measurements on the MFC and LFC are presented schematically in
Fig. 2A-F
, respectively, for a representative right knee dataset. The true sagittal planes were reconstructed from standard sagittal images to match the plane of the APL measurement directions for both compartments (yellow dashed line in
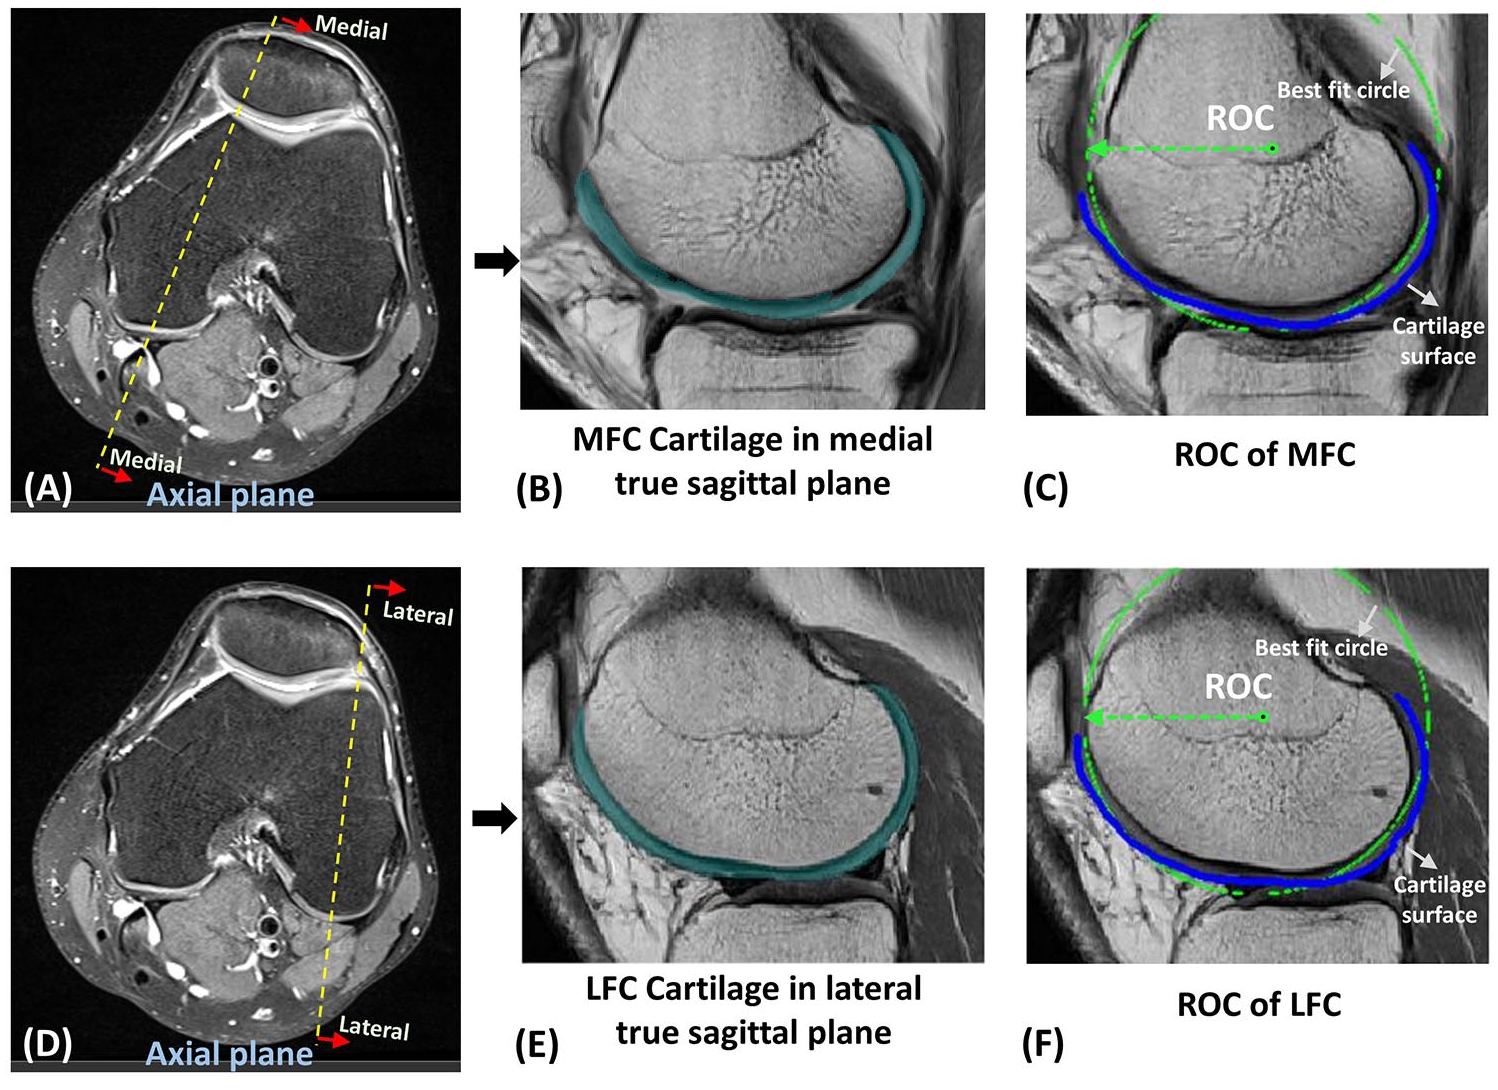
Schematics of a representative knee joint showing the plane (yellow dashed line) of the anterior-posterior length (APL) measurements for the (
Statistical Analysis
Linear regression models were defined to study the ROC relationship with the femorotibial dimensions and their statistical significance (Student’s t-test). The most predictive femorotibial dimension was determined by comparing the obtained coefficient of determination, R2, between all models.
A multivariable linear regression model (ROC = α0+ α1 × APL + α2 × LML + α3 × TPW + α4 × HCW) was also used to determine whether there is an optimal linear combination of the femorotibial dimensions for the ROC prediction in MFC and LFC. Such linear multivariable regression models also help to explore the correlations of ROC with APL while controlling for variations in other femorotibial dimensions. The collinearity between femorotibial dimensions were also investigated using linear regression models.
Moreover, correlations between MFC’s and LFC’s measures were investigated using linear regression models. Paired Student’s t-test was used to examine the differences.
P values below 0.05 were considered as significant. With at least 50 datasets, we have a power of 80% or higher to detect a coefficient of determination of 0.15 or greater between any 2 measures. For MFC and LFC comparisons, we have at least 80% power to detect a large effect size of 0.65 (i.e., 65% of the standard deviation of each measure).
The measurements of ROCs and APLs were repeated for 15 randomly selected scans (approximately 25% of the total dataset) by the first reader to investigate the intraobserver reliability. The same measurements were independently performed by a second reader, blinded to the first reader’s measurements, to investigate the interobserver reliability. Intraclass correlation coefficients (ICCs) were calculated for the repeated measures.
Results
The measured femorotibial dimensions and ROCs of the MFC and LFC are presented in Table 1 . In total, the femorotibial dimensions and ROC of 52 MFCs and 54 LFCs (63 patients; 35 men, 33 ± 10 years old, and 28 women, 27 ± 8 years old) were measured in this study. MFC and LFC measurements for 11 and 9 datasets were excluded, respectively, due to exceptionally large lesions, which created challenges for reasonable ROC measurements. On average, ROC and HCW measurements were lower in the MFC than in the LFC (P < 0.01). ROC was not significantly different between MFC and LFC.
ROC and Femorotibial Measurements in 52 MFCs and 54 LFCs.
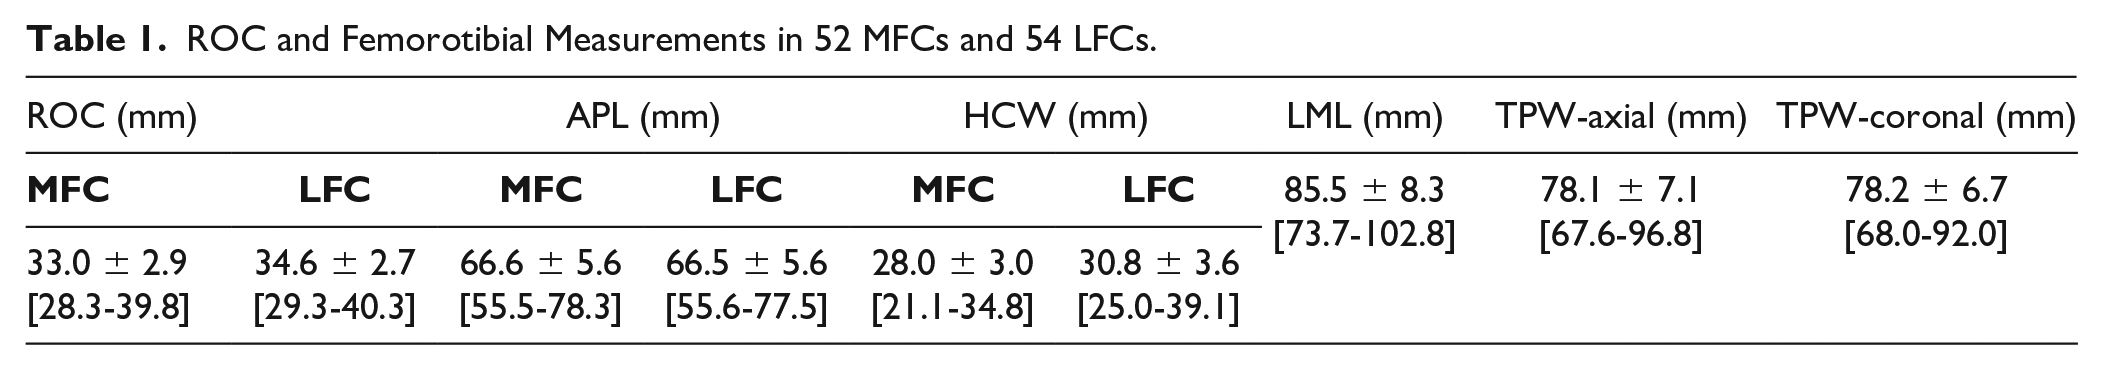
Fig. 3 shows the ROC correlations with APL, HCW, LML, and TPW (measured in axial and coronal view) measurements at MFC and LFC. All femorotibial dimensions showed significant correlations with ROC (P < 0.01). APL was the most predictive femorotibial dimension, demonstrating the highest correlation to the ROC of the MFC (R2 = 0.78) and LFC (R2 = 0.81). The ROC correlations with femorotibial dimensions were found in the following descending order: APL (R2 = 0.78-0.81), LML (R2 = 0.61-0.69), TPW-Ax (R2 = 0.56-0.67), TPW-Cor (R2 = 0.54-0.59), and HCW (R2 = 0.37-0.41).
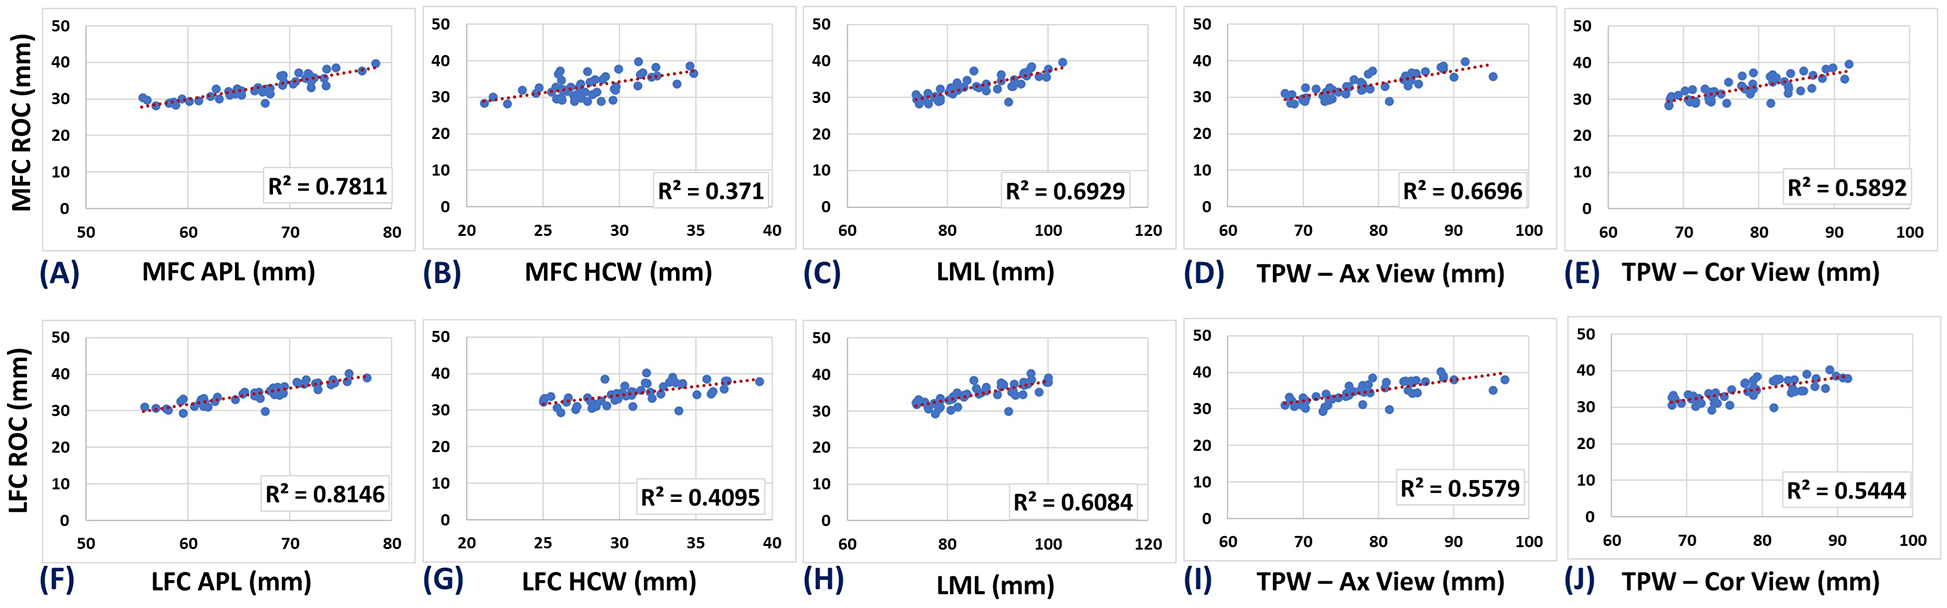
Scatter plots and linear regressions of the MFC ROC and LFC ROC on (
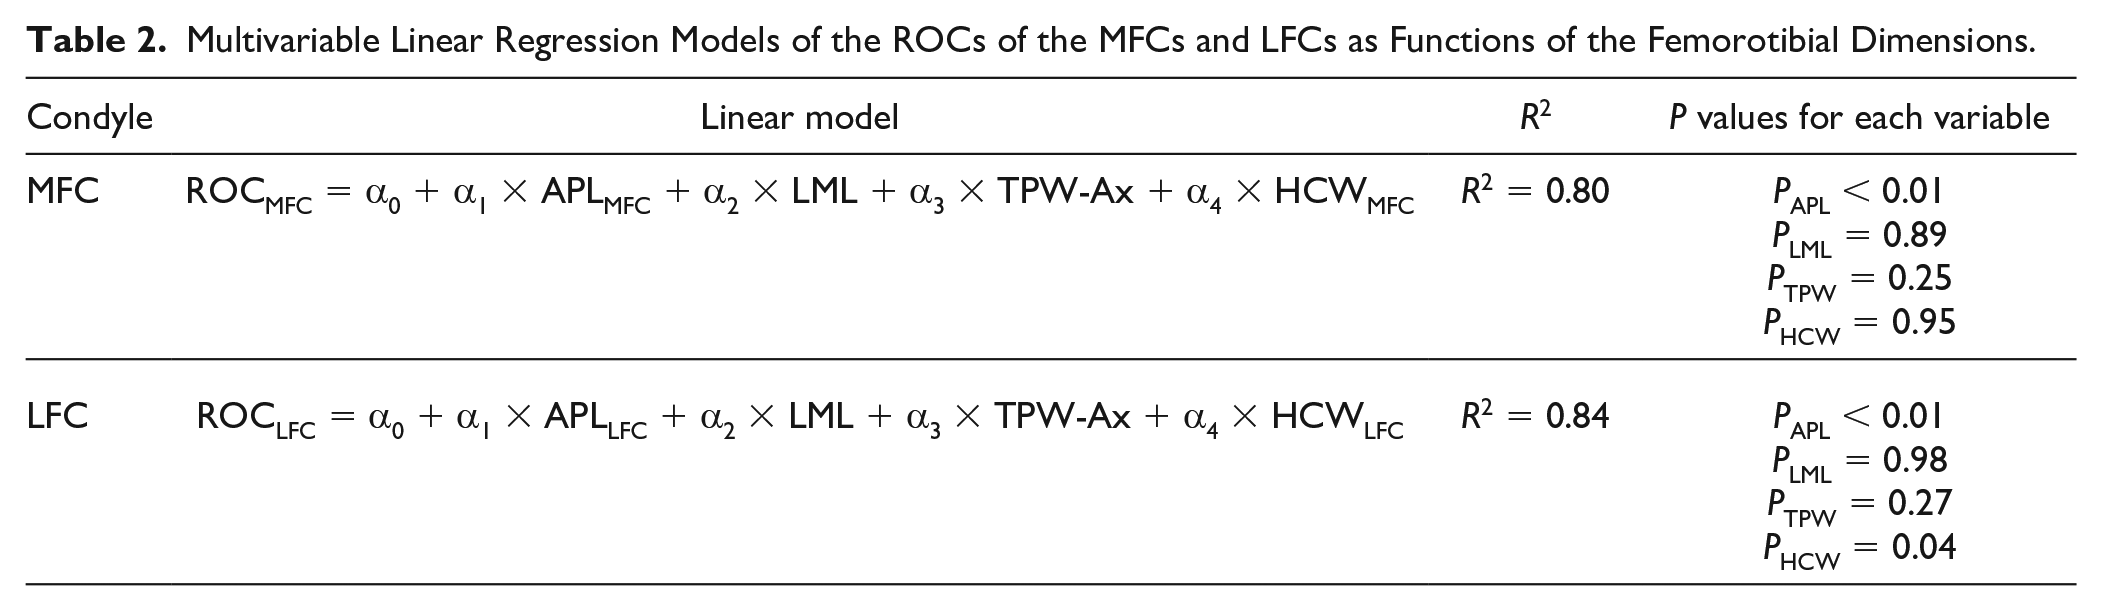
The multivariable linear regression models of the ROCs of the MFCs and LFCs as functions of all femorotibial dimensions (APL, LML, TPW, and HCW) are presented in Table 2 . The adjusted coefficient of determinations (i.e., R2) did not improve substantially by combining all femorotibial dimensions compared with APL alone. The multivariable regression models also confirm that the ROC/APL correlations were still significant (P < 0.01) when controlling for variation of LML, TPW, and HCW.
Multivariable Linear Regression Models of the ROCs of the MFCs and LFCs as Functions of the Femorotibial Dimensions.
As presented in Table 3 , all measured femorotibial dimensions were significantly correlated (P < 0.01) with each other in the MFCs and LFCs.
Linear Correlations Between Femorotibial Dimensions in the MFC and LFC.
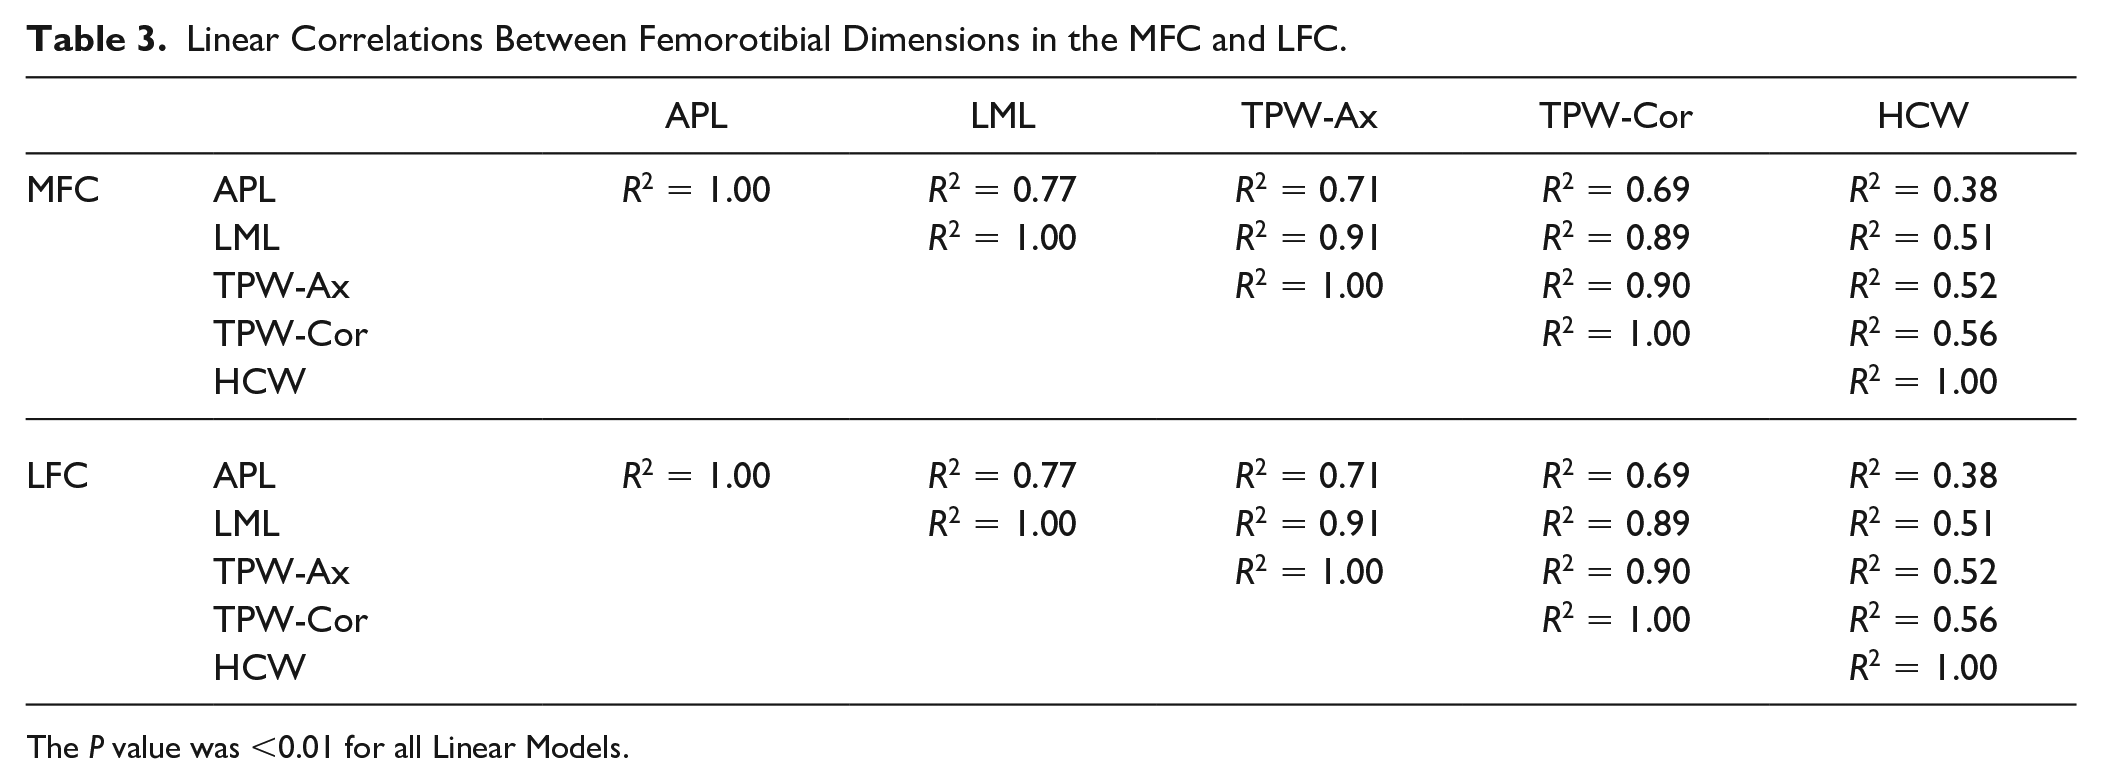
The P value was <0.01 for all Linear Models.
Table 4 presents the correlations between the MFC and LFC measurements. The MFC/LFC correlations for ROC, APL, and HCW were significant.
Linear Correlations Between the Studied Femorotibial Dimensions of the MFC and LFC.
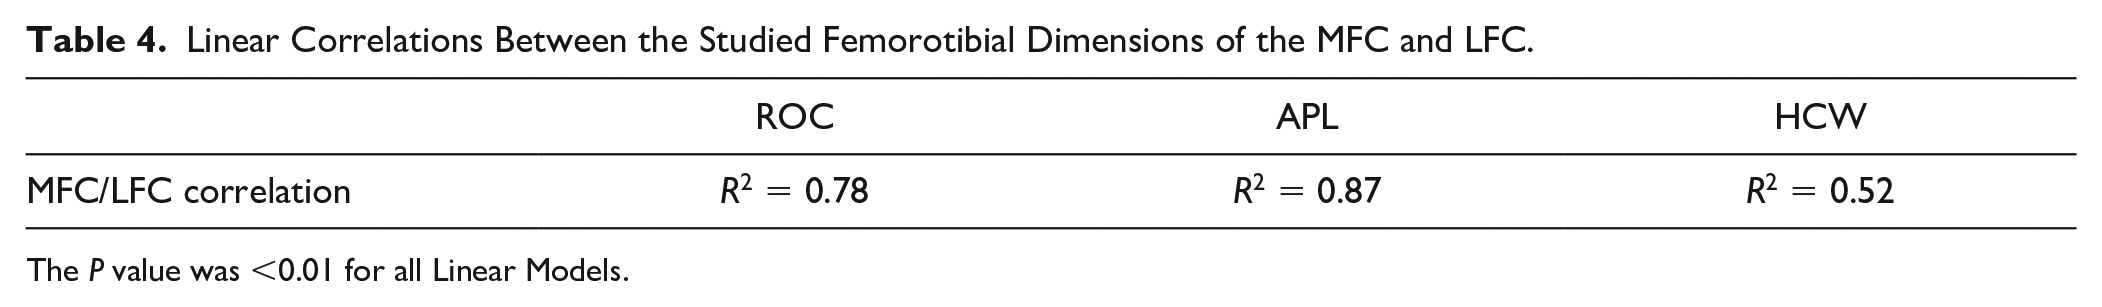
The P value was <0.01 for all Linear Models.
Fig. 4 presents the intraobserver and interobserver reliability levels for the APL and ROC measurements. ICCs were above 0.9 for both measurements confirming excellent reliability. Higher ICC values for the APL measurements were achieved, implying its consistent implementation compared with ROC.
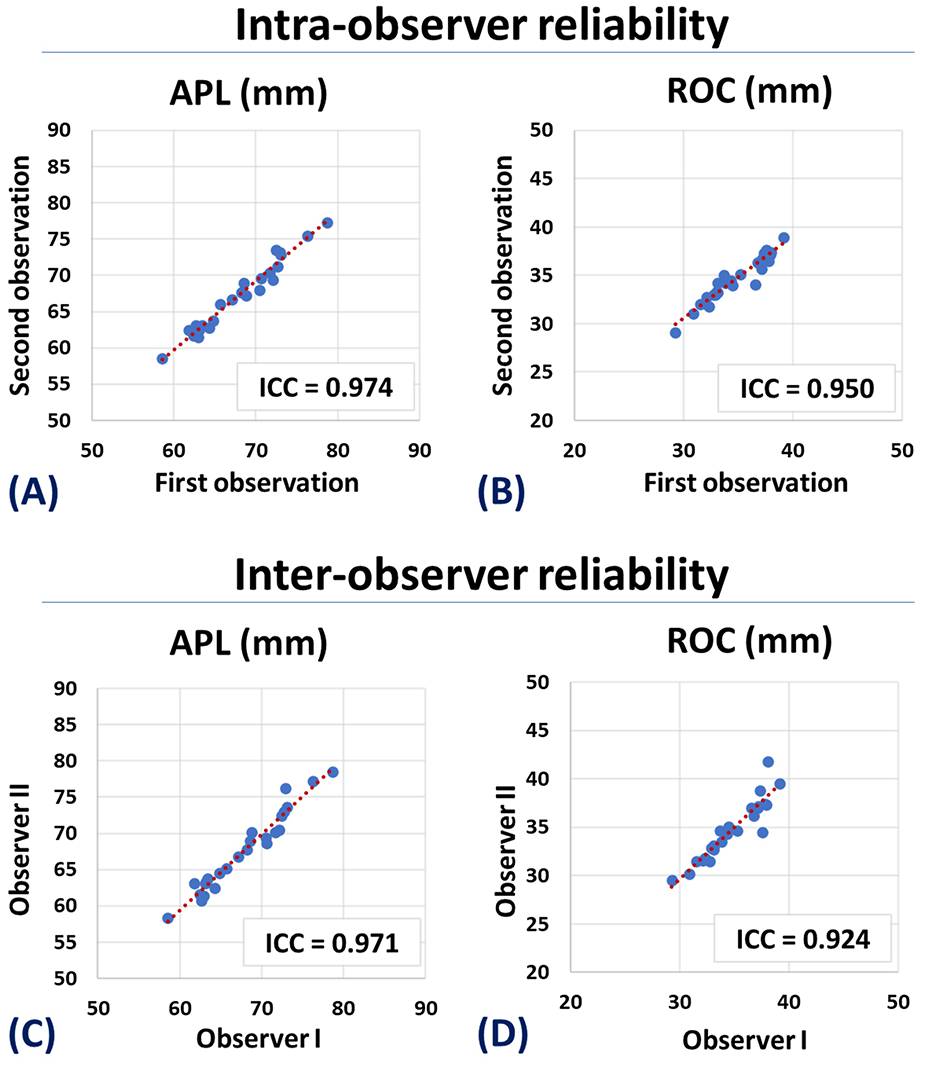
Scatter plots and ICC values for the intraobserver and interobserver reliability of (
Discussion
This study demonstrates that the cartilage surface ROC is strongly correlated with the APL measurements of the knee in both the MFCs and LFCs. It was also shown that APL is the most predictive femorotibial dimension of ROC. Therefore, matching the APL between the recipient and donor condyles in OCA transplantation likely provides a similar level of matching achievable by direct ROC measurements. 10 Although it requires further validations, the strong ROC/APL correlation can introduce APL matching as a surrogate for direct ROC matching in OCA transplantation in clinical practice. The APL matching would be particularly useful for patients with large osteochondral lesions, where a precise delineation of the cartilage surface is not feasible, precluding an accurate ROC measurement. Moreover, a consistent APL measurement of recipients and donors is much simpler to achieve than the ROC measurement, which would require more sophisticated resources. Accurate APL measurement can be performed on axial plane MR images; however, the accurate ROC measurement should be performed on the true sagittal plane which is not routinely available in clinical practice.
This study complements a previous investigation performed on CT images showing strong significant correlations between the femoral osseous surface ROC and APL. 17 Our study showed slightly lower ROC/APL correlation levels compared with the CT results (R2 = 0.78 and 0.81 versus 0.83 and 0.84 for MFC and LFC, respectively). However, the ROC correlations with other femorotibial dimensions were higher in this study, though still lower than the ROC/APL correlation level. The differences between the current MRI-based study and the previously reported CT-based results were likely due to the natural differences between the ROCs of the osseous and cartilaginous surfaces. Lower consistency and more challenges in cartilage surface delineation in MRI images compared with osseous surface detection might be factors, too. It should be noted that performing this MRI-based study was crucial as most clinicians are obtaining MR imaging preoperatively to assess the chondral lesion and concomitant pathology, as MR provides excellent image contrast evaluating most tissues in the knee joint.
Significant correlations between cartilage surface ROC and APL were first reported by Du et al. 13 performed on MRI images. Yet, correlations were lower than in our study (R2 = 0.56 and 0.45 versus 0.78 and 0.81 for MFC and LFC, respectively). This was likely due to differences in methodology between our studies. For example, the previous study used traditional sagittal plane images acquired by the technologists, whereas our study used reconstructed sagittal images for each condyle based on landmarks specific to the individual. In addition, our measurements were semiautomated rather than manually delineated. 13
Since the ROC was measured in the anterior-posterior plane of the MFC and LFC, lower correlations with the width-related measures such as LML, TPW, and HCWs were expected. The medial-lateral ROCs of the MFC and LFC are likely to show higher correlations with the width-related measures, which need to be examined in a future investigation. Among the width-related dimensions, LML and TPW-Ax were measured on the axial images between simple, recognizable anatomical sites (i.e., medial and lateral epicondyles or medial and lateral plateau surfaces) that should only be minimally affected by the joint positioning in the coil and scanner. However, HCWs and TPW-Cor were measured in coronal MR images that might not be the true coronal plane for all provided datasets. As a result, lower correlation levels for HCW and TPW were observed compared with LML.
Employing multivariable linear regression models to predict ROC by combining all femorotibial dimensions as input was not substantially better than using APL alone (R2 = 0.80 and 0.84 versus 0.78 and 0.81 for MFC and LFC, respectively). This was likely due to the significant interdependency and collinearity between the femorotibial dimensions in the studied knee joints ( Table 3 ). The multivariable regression models also confirm that the ROC/APL correlations were still significant (P < 0.01) when controlling for variation other femorotibial dimensions. Therefore, using only APL as a single measure, instead of a combination of femorotibial dimensions, may be adequate for ROC restoration in OCA transplantation.
Standardization of the APL measurement is required before promoting its widespread utilization for OCA transplantation matching. This study measured the APL at the MFC and LFC separately, along with their true AP directions, which is comparable to approaches used by Du et al. 13 and Jerban et al. 17 On the contrary, Wang et al. 21 used an identical APL for both MFC and LFC, measured along the global AP direction of the knee joint. The controversial outcomes of using APL measurements for donor-recipient matching3,21 are likely due to the lack of literature regarding the standardization of the technique.
Orthotopic OCA matching has traditionally been considered the most accurate approach for restoring focal chondral and osteochondral lesions. However, recent investigations suggest condyle-specific matching is unnecessary, particularly for single-plug transplantations.3,4,8,14,16,22 Similar to the previous CT-based study, 17 we observed strong MFC/LFC correlations for APL and ROC. This shows that nonorthotopic OCA matching, based on APL, may provide a reasonable ROC match between donor and recipient. However, conflicting results have been reported in the literature for MFC/LFC correlations, ranging from significant correlations for ROC 23 to nonsignificant correlations, 24 depending on the methods used for the ROC measurements.
This study was limited in a few aspects. First, this study requires future validation in a real clinical OCA transplantation setting. Second, ROC is not a constant over the femoral condyle but varies for the posterior, distal, and anterior portions of the MFCs and LFCs.12,25-28 Future studies are necessary to investigate the potential relationships between the local ROCs with femorotibial dimensions. Third, significant gender- and ethnic-related differences in the condyle anatomy have been reported in the literature,29-33 which may affect the final correlations between femorotibial dimensions and the ROC depending on the subgroup analyzed. Fourth, in theory, anatomic reconstruction requires restoration of not only the chondral surface but also the chondral thickness, and this can most likely be achieved with a matched cartilage thickness between the donor and recipient. Notably, the osseous ROC and chondral ROC relationship varies for the posterior, distal, and anterior portions of the condyle. Fifth, the logistics and the reliability of the measurements of the donor condyle were not considered in this study. Using TPW and LML for the matching process is appropriate if such measurements could be performed with higher accuracy and reproducibility compared with APL in the recovery room.
Conclusion
Linear correlations between the cartilage surface ROC of the femoral condyle and femorotibial dimensions were investigated on MRI images. The APL of MFC and LFC were the most predictive femorotibial dimensions of their cartilage surface ROCs. Therefore, matching APL between donor and recipient in OCA transplantation is likely to provide a similar level of matching achievable by direct cartilage surface ROC measurements.
Footnotes
Acknowledgments and Funding
The author(s) disclosed receipt of the following financial support for the research, authorship, and/or publication of this article: This study was funded by Joint Restoration Foundation (JRF) Ortho. The authors were not affiliated with JRF Ortho, and JRF Ortho was not involved in the design of the study, data analysis, and writing of the article.
Declaration of Conflicting Interests
The author(s) declared no potential conflicts of interest with respect to the research, authorship, and/or publication of this article.
Ethical Approval
To perform this study, the de-identified datasets of patients were provided by JRF Ortho to the authors of this manuscript. Since the investigators did not obtain, use, study, analyze, or generate identifiable private information or identifiable biospecimens, this study was not research involving human subjects. Therefore, IRB approval was not required.