
Abstract
Objective
Obesity is a known risk factor for knee osteoarthritis (OA). Diabetes has been associated with progression of OA and metformin is the first-line treatment in type 2 diabetes. The effect of the body mass index (BMI) and metformin on the expression of certain matrix genes in human chondrocytes is unclear. The purpose of this study was to investigate the effect of BMI and metformin on the expression of matrix genes in primary human chondrocytes.
Design
Adult female patients undergoing knee arthroplasty for end-stage OA were enrolled. Primary chondrocytes were cultivated and stimulated with metformin. Matrix gene expression was analyzed using polymerase chain reaction. Clinical data were used in multivariable regression models to assess the influence of BMI and metformin stimulation on gene expression.
Results
A total of 14 patients were analyzed. BMI was a predictor of increased expression in ADAMTS5 (β = −0.11, P = 0.03). Metformin slightly reduced expression in ADAMTS5 (β = 0.34, P = 0.04), HIF-1a (β = 0.39, P = 0.04), IL4 (β = 0.30, P = 0.02), MMP1 (β = 0.47, P < 0.01), and SOX9 (β = 0.37, P = 0.03). The hip-knee-ankle angle and proton pump inhibitors (PPIs) intake were associated with reduced SOX9 expression (β = 0.23, P < 0.01; β = 2.39, P < 0.01). Higher C-reactive protein (CRP) levels were associated with increased MMP1 expression (β = −0.16, P = 0.02).
Conclusion
We found that BMI exerts a destructive effect via induction of ADAMTS5. Metformin reduced the expression of catabolic genes ADAMTS5 and MMP1 and might play a role in disease prevention. Limb malalignment and PPI intake was associated with a reduced expression of SOX9, and higher CRP levels correlated with increased MMP1 expression, indicating a destructive process.
Introduction
Osteoarthritis (OA) of the knee is among the most debilitating diseases. 1 In the United States, an estimated 14 million people are suffering from symptomatic knee OA, 2 with numbers increasing as the population becomes ever older. This leads to a massive economic burden on the health care system. The lifetime cost for patients diagnosed with knee OA was estimated at around $140,300. 3
The pathophysiologic mechanisms underlying knee OA are complex as knee OA is a multifactorial disease.4,5 There are many known risk factors, such as age, gender, body mass index (BMI), trauma, and genetic background. 6 BMI has been found to alter expression of certain matrix genes such as MMP13 (matrix metallopeptidase 13) or aggrecan. 7 The relationship with other major players in the pathophysiologic process of OA remains unclear, however.
In addition to damage caused by overweight, recent scientific findings indicate that systemic inflammation plays an important role in onset and progression of the disease. 4 This is also evidenced by the fact that in addition to OA of the weightbearing joints, obese patients often suffer from OA of the hand as well. 8 Low-grade systemic inflammation is common in metabolic syndrome. 9 Diabetes, in particular, has been associated with OA and is a risk factor for disease progression.10,11 The first-line treatment in diabetes type 2 is metformin. Clinical studies have found that this biguanide derivative might have a protective effect against knee OA.12-14 In animal models, metformin was found to reduce the expression of the catabolic genes.15,16 So far the effects of metformin on the expression of cartilage matrix genes in human chondrocytes have not been investigated.
The purpose of this study was therefore to address the following questions: (1) What is the effect of BMI on the expression of certain matrix genes playing a major role in the pathogenesis of knee OA? (2) How can metformin influence this gene expression? (3) How do other clinical parameters and medication relate to gene expression? Our hypothesis was that BMI and metformin have significant effects on these matrix genes. To answer these questions, primary human chondrocytes were cultivated and stimulated with metformin. Interrelations of quantitative polymerase chain reaction (qPCR) data and clinical data were analyzed by a multivariable regression analysis.
Methods and Materials
This study was designed as a cross-sectional clinical/experimental laboratory study and conducted at the Department of Orthopaedics of the Medical University of Graz, Austria, starting in February 2019 until December 2019. Patients were asked for written informed consent. The procedures followed were in accordance with the ethical standards of the responsible committee (Ethics Committee, Medical University of Graz, IRB #31-133) and with the Helsinki Declaration.
Study Population
Female patients undergoing knee arthroplasty for end-stage knee OA at the age of 52 to 82 years were enrolled.
Cartilage Samples and Cell Culture
Femoral cartilage was collected intraoperatively and stored in growth medium at 4 °C for 2 to 4 hours. Cartilage was dissected using a scalpel, washed using phosphate buffered saline (PBS) 1× (Gibco Invitrogen, Carlsbad, CA, USA) and digested using 2 mg/mL collagenase B (Gibco) in growth medium at 36 °C for 24 hours. Cells were then filtered using a 70 µm filter, centrifuged, and seeded in cell culture flasks. For cultivation DMEM/F12 (Dulbecco’s modified Eagle medium F-12) growth medium, containing 10% fetal bovine serum (FBS), 1% penicillin-streptomycin (5.000 U/mL), 1%
Cell Viability Assay
In order to find a nontoxic drug concentration for experiments, cell viability assays were performed. Chondrocytes (1 × 10⁴ and 5 × 10³ cells for measurement after 24 and 48 hours respectively) were seeded on 96-well plates and either used as control or treated with metformin in various concentrations (0.5 µM, 0.1 mM, 1 mM, 2 mM). Cell viability was evaluated in 2 patient samples using the CellTiter-Glo Luminescence Cell Viability Assay (Promega, Madison, WI, USA) after 24 and 48 hours according to the manufacturer’s instructions. Background reference values were derived from the culture media. Absorbance values were measured with the Lumistar microplate luminometer (BMC Labtech, Ortenberg, Germany).
Metformin Treatment
Metformin (Sigma-Aldrich, St. Louis, MO, USA) was dissolved in DMSO (Sigma-Aldrich) and stored at a concentration of 100 mM. Cells were stimulated with 1 mM metformin at a confluence of 30% to 50% and incubated for 48 hours. For each patient, a control and a metformin sample (1 mM) was obtained for further analysis.
Gene Expression Analysis by Reverse-Transcription Quantitative Polymerase Chain Reaction (RT-qPCR)
RNA was extracted using the RNeasy Mini kit using spin technology (Qiagen, Hilden, Germany). DNA was digested using RNase-free DNase Set (Qiagen). RNA concentration was determined using spectrophotometry (Nanodrop, ThermoFisher, Waltham, MA, USA). RNA was then analyzed by RNA gel electrophoresis (Bioanalyzer, Agilent, CA, USA). The RNA integrity number (RIN) for all samples was greater than or equal to 9. cDNA was synthesized using 2 µg of extracted RNA using the iScript kit (Bio-Rad Laboratories Inc., Hercules, CA, USA) according to the manufacturer’s recommendations. The following amplification settings were used on a thermocycler (MyCycler, Biorad): Priming at 25 °C for 5 minutes, reverse transcription at 46 °C for 20 min and reverse transcription inactivation at 95 °C for 1 minute. cDNA was stored at −20 °C.
RT-qPCR was performed using SsoAdvanced Universal SYBR Green Supermix (Bio-Rad Laboratories Inc.) according to the manufacturer’s recommendations using technical triplicates. A reaction volume of 10 µL containing 12.5 ng target DNA was used. The following PCR amplification specifications were set on a CFX96 Touch Real-Time PCR Detection System (Bio-Rad): incubation at 95 °C for 30 seconds for polymerase activation and DNA denaturation, followed by 40 amplification cycles of 10 seconds of denaturation at 95 °C and 20 seconds of annealing-elongation at 60 °C. Table 1 shows the primers used for PCR analysis. Results were analyzed using the CFX Maestro Software (Bio-Rad Laboratories Inc., version 1.1). Quantification cycle values (Ct) were exported for statistical analysis. Results with Ct values greater than 32 were excluded from analysis. The arithmetic mean of expression levels of the reference genes RPL and TBP was used for normalization (ΔCt).
Polymerase Chain Reaction (PCR) Primers Used in Quantitative PCR Experiments. a
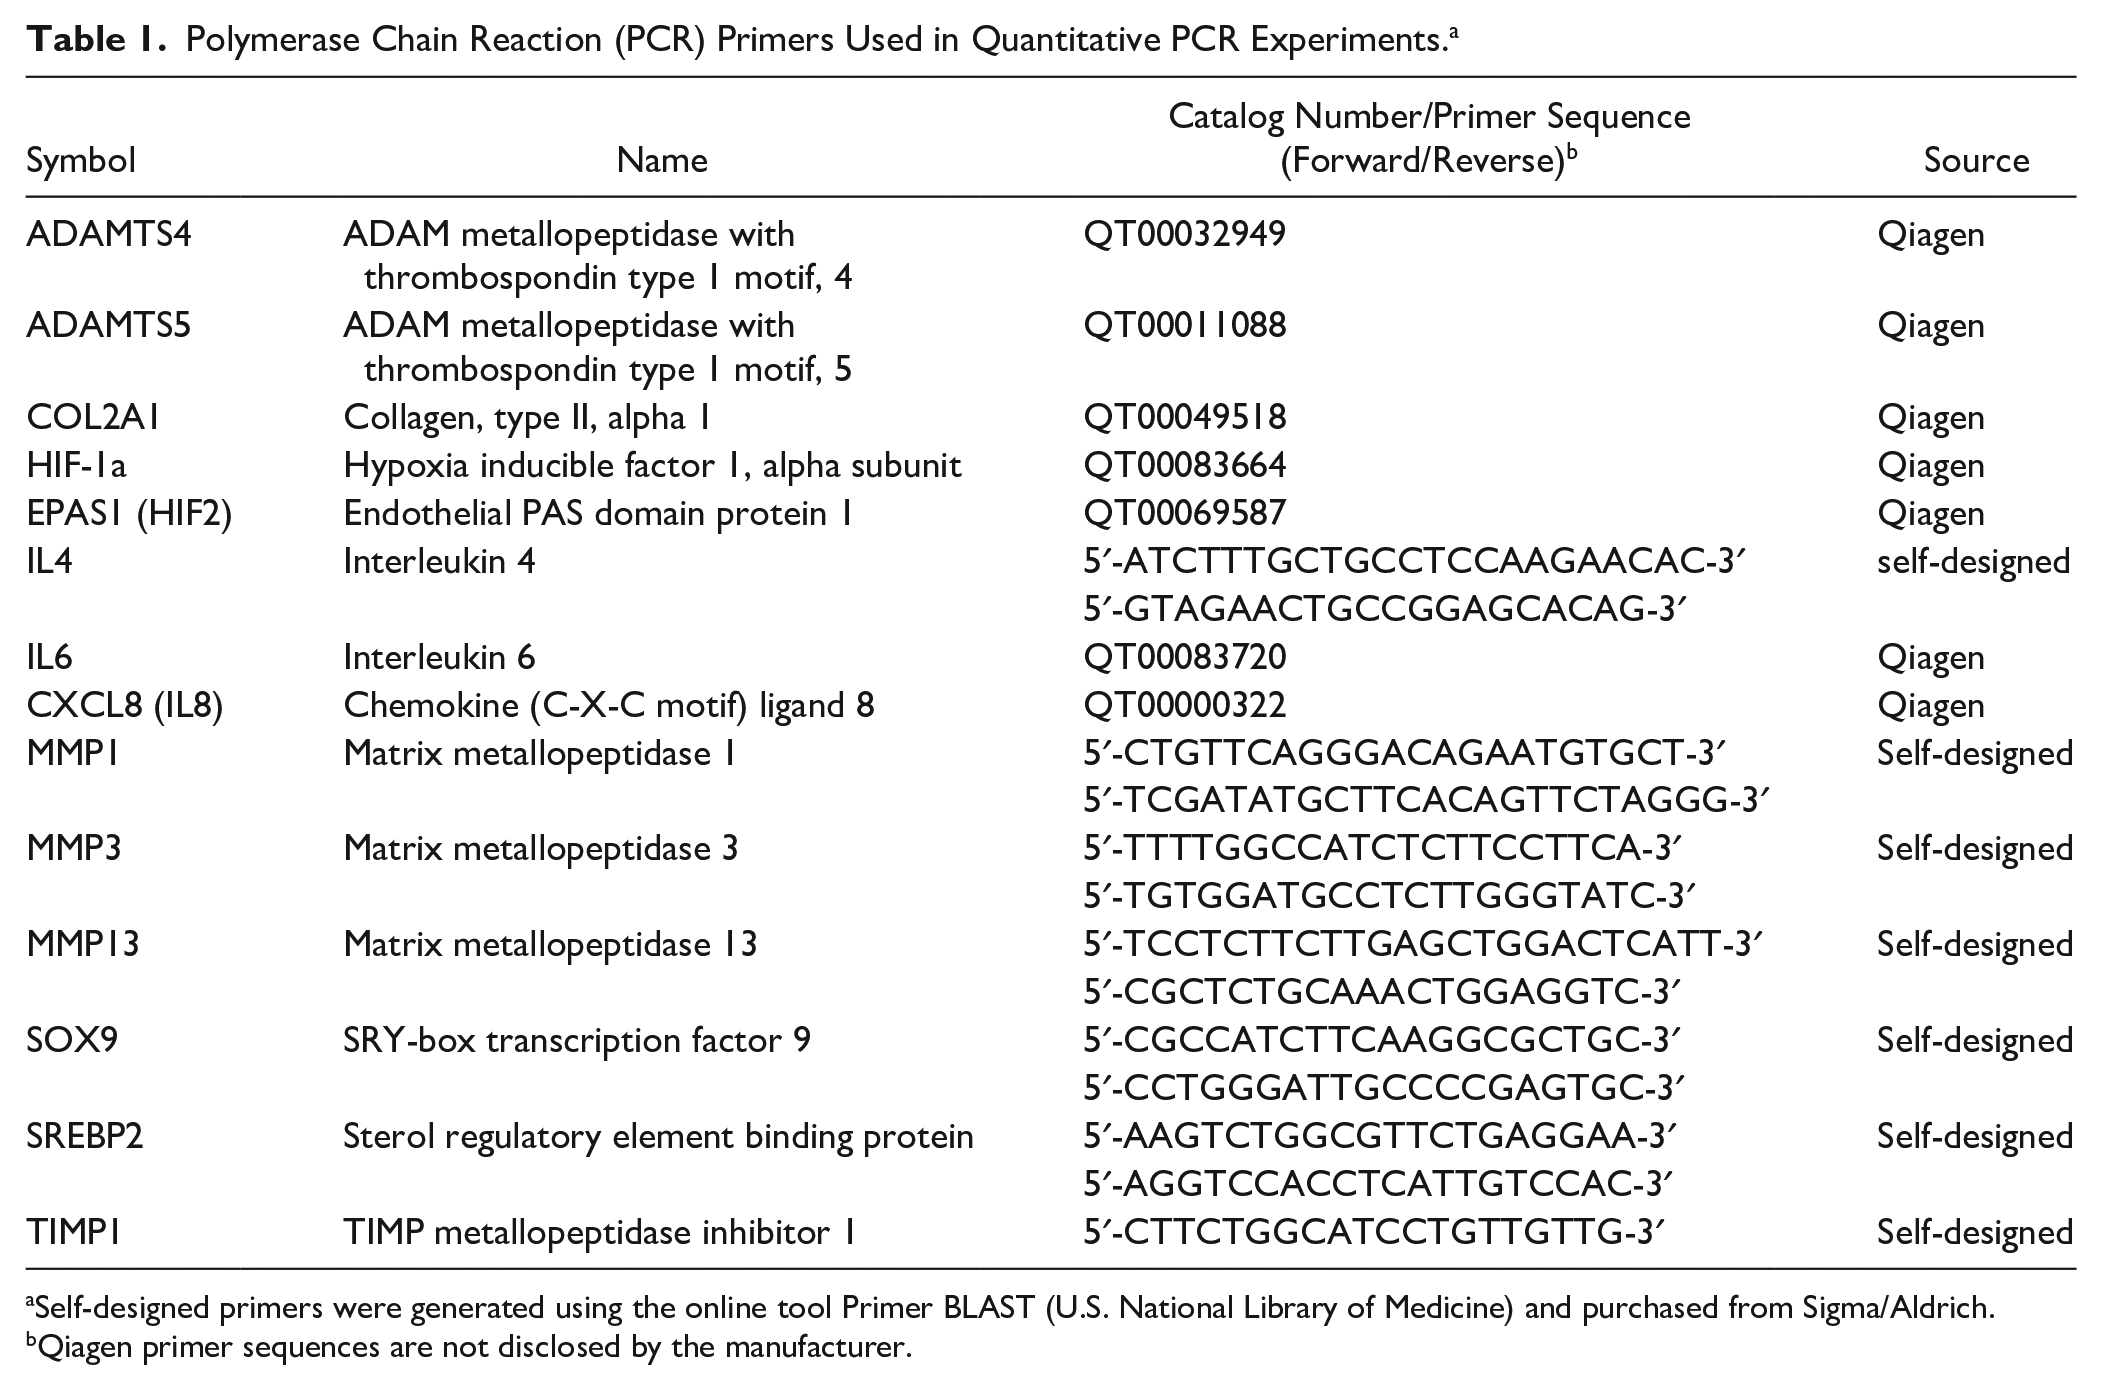
Self-designed primers were generated using the online tool Primer BLAST (U.S. National Library of Medicine) and purchased from Sigma/Aldrich.
Qiagen primer sequences are not disclosed by the manufacturer.
Limb Alignment and Joint Space Width
Preoperative full limb standing x-ray images were obtained for every patient. Images were stored and analyzed using the hospital-wide PACS (picture archiving and communications system) (pacsview, version 3.00.123, Institute for Medical Informatics, Statistics and Documentation, Medical University of Graz, Austria). Analysis was performed by 2 investigators (MS, PS), images were read for medial and later joint space width (JSW) and the hip-knee-ankle angle (HKAA) as outlined previously ( Fig. 1 ). 17 Intraclass correlation coefficient (ICC) was found to be excellent (ICC for HKAA 0.964 [0.891-0.988], ICC for medial JSW 0.923 [0.778-0.975], ICC for lateral JSW 0.881 [0.671-0.960]). For analysis the arithmetic mean of the aforementioned values was used.
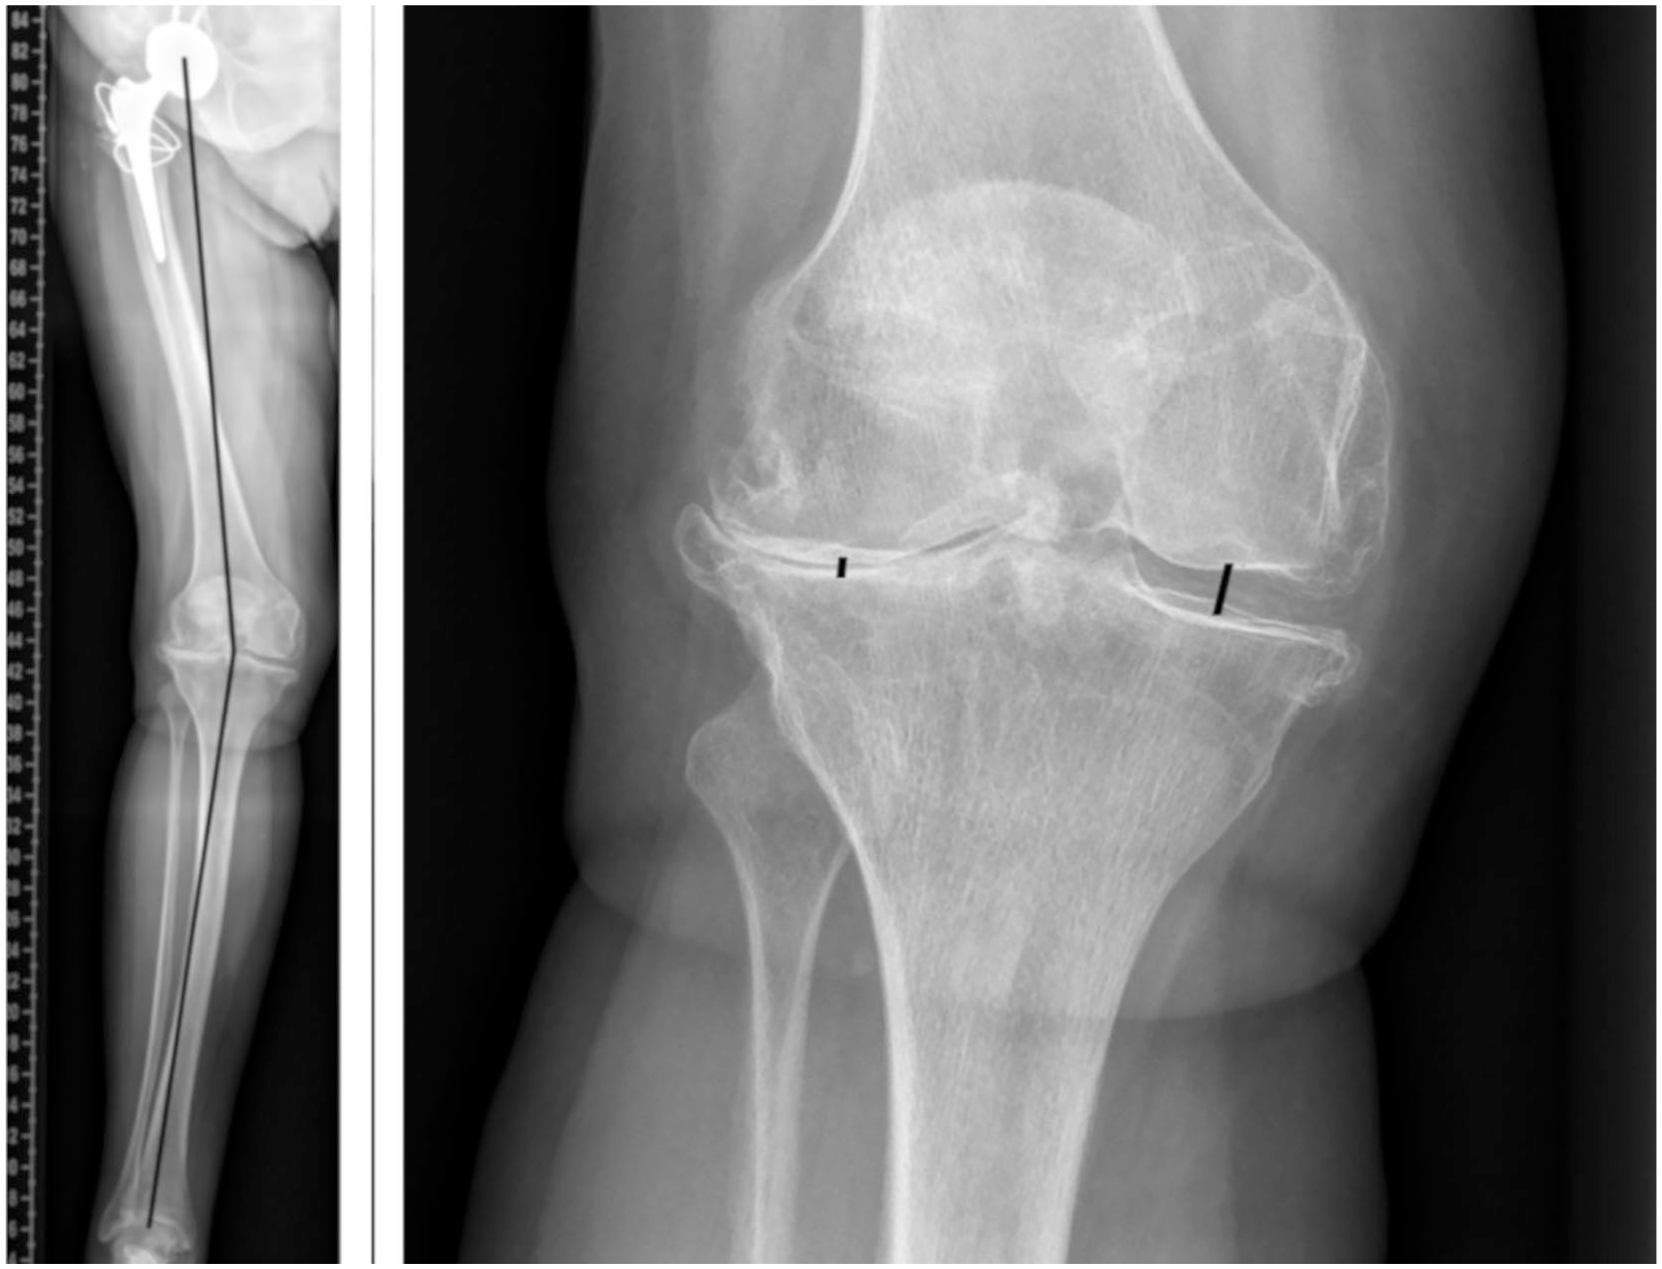
The measurement of the hip-knee-ankle angle (HKAA) (left) and joint space width (JSW) (right). The HKAA is defined as the angle between the mechanical axis of the femur and the mechanical axis of the tibia. The mechanical axis of the femur is a line from the center of the femoral head to the femoral reference point at the knee joint. The mechanical axis of the tibia is formed by a lined from the proximal tibial reference point to the mid ankle reference point. 17 The mechanical axes of the femur and tibia are shown on the left image by the black lines. The JSW was measured on the medial and lateral side as indicated by the black lines on the right image.
Clinical Data
Clinical data collected included: demographic data (age), BMI, inflammation markers (leukocyte count, C-reactive protein [CRP] levels), x-ray analysis (JSW, HKAA), and medication. Medication was grouped based on mode of action.
Statistical Analysis
All statistical analyses were performed using the statistical software R (R Foundation for Statistical Computing, Vienna, Austria, version 3.5.2) on GNU/Linux Debian 10 and SPSS 25 (IBM, Armonk, NY, USA) on Windows 10 (Microsoft, Redmond, WA, USA). 18 The following R packages were used: lme4, lmerTest, tidyverse, car.19-22 Groups were compared using paired Student t test,Wilcoxon rank or Kruskal-Wallis test, where appropriate, after testing for normality using the Kolmogorov-Smirnov test and Q-Q plots. Correlations were assessed using Spearman’s correlation coefficient. Variables showing an association with ΔCt values with a P value <0.1 were used for multivariable analysis. To assess the effect of BMI on gene expression, for each gene of interest a linear regression model was calculated for the control group, using the expression level as outcome and the dependent variables as described above. Similarly, to assess the effect of metformin stimulation and BMI on gene expression, linear mixed models were calculated. A similar approach using regression models for analysis of qPCR data has been described and validated previously and has the advantage of increased flexibility, as it can account for multiple sources of variation compared with the traditional ΔΔCt method. 23 The following modifications were made to the aforementioned protocol: Ct values were averaged, normalized and ΔCt values were then used as the response variable. In mixed models, patient identity was entered as random effect to account for repeated measures. Known risk factors (age, BMI, HKAA) were entered into the models to adjust for them. The final model was selected based on model Akaike information criterion (AIC). Using the β-coefficient of regression models as the ΔΔCt value, the fold increase was calculated as 2−ΔΔCt.24 Model assumptions were assessed using residual versus fitted, normal Q-Q, scale-location and residuals versus leverage plots. A P value <0.05 was assumed to be statistically significant. Due to this study’s exploratory nature, sample size calculation was not performed. A total enrollment of 15 patients was the aim of this study. To asses interrater reliability on x-ray analysis, ICC (ICC 3,1, absolute agreement) was determined. Numerical variables are expressed as mean ± standard deviation. Categorical variables are expressed as count (percentage).
Results
A total of 15 patients were enrolled. Due to technical problems in the PCR experiments, 1 patient had to be excluded from the analysis, so that a total of 14 patients were analyzed. All 14 patients were female, with a mean age of 70.1 ± 10.2 years and a mean BMI of 30.5 ± 6.3 kg/m2. Patients were either classified with an American Society of Anesthesiologists (ASA) score of 2 or 3. Three patients were diagnosed with type 2 diabetes, and no patient was insulin dependent or taking metformin. One patient was managed with lifestyle intervention only and not taking any antidiabetic medication, 1 patient was on linagliptin, the other patient was on gliclazide. Table 2 shows the baseline characteristics.
Baseline Characteristics of Patients Enrolled in the Study. a
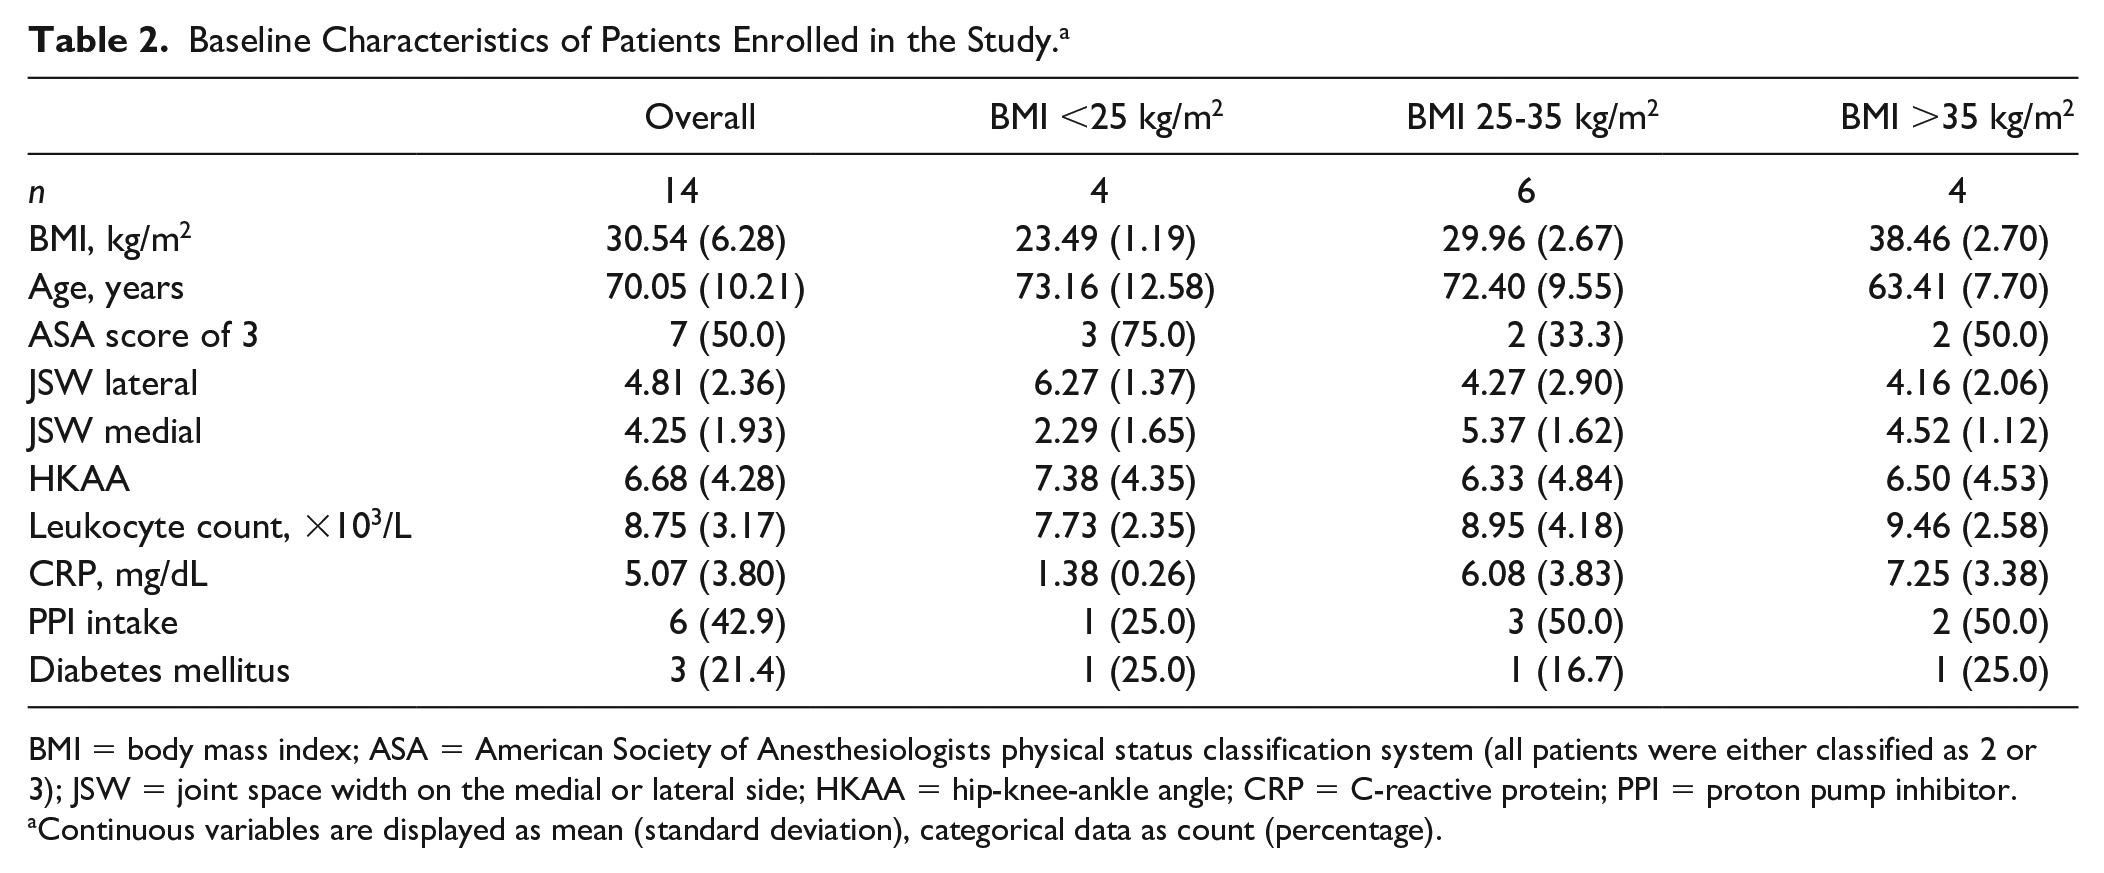
BMI = body mass index; ASA = American Society of Anesthesiologists physical status classification system (all patients were either classified as 2 or 3); JSW = joint space width on the medial or lateral side; HKAA = hip-knee-ankle angle; CRP = C-reactive protein; PPI = proton pump inhibitor.
Continuous variables are displayed as mean (standard deviation), categorical data as count (percentage).
Cell Viability Assay
A metformin concentration of 1 mM (129.16 µg/mL) was found to have no cytotoxic effect in the CellTiter-Glo assay (χ2 = 9, P = 0.342 for values after 24 and 48 hours) ( Fig. 2 ). Steady-state metformin plasma levels in human beings range between 1 and 5 µg/mL (7.7-38.7 µmol/L). 25 A concentration of 1 mM was found to mitigate loss of cell viability by a decreased production of reactive oxygen species (ROS). 14 We are not aware of any study investigating the metformin concentration in synovial fluid. Thus, based on the positive results of the aforementioned study, and supported by the cell viability assay findings, a final metformin concentration of 1 mM was used for all experiments in order to detect changes in expression, if any at all.
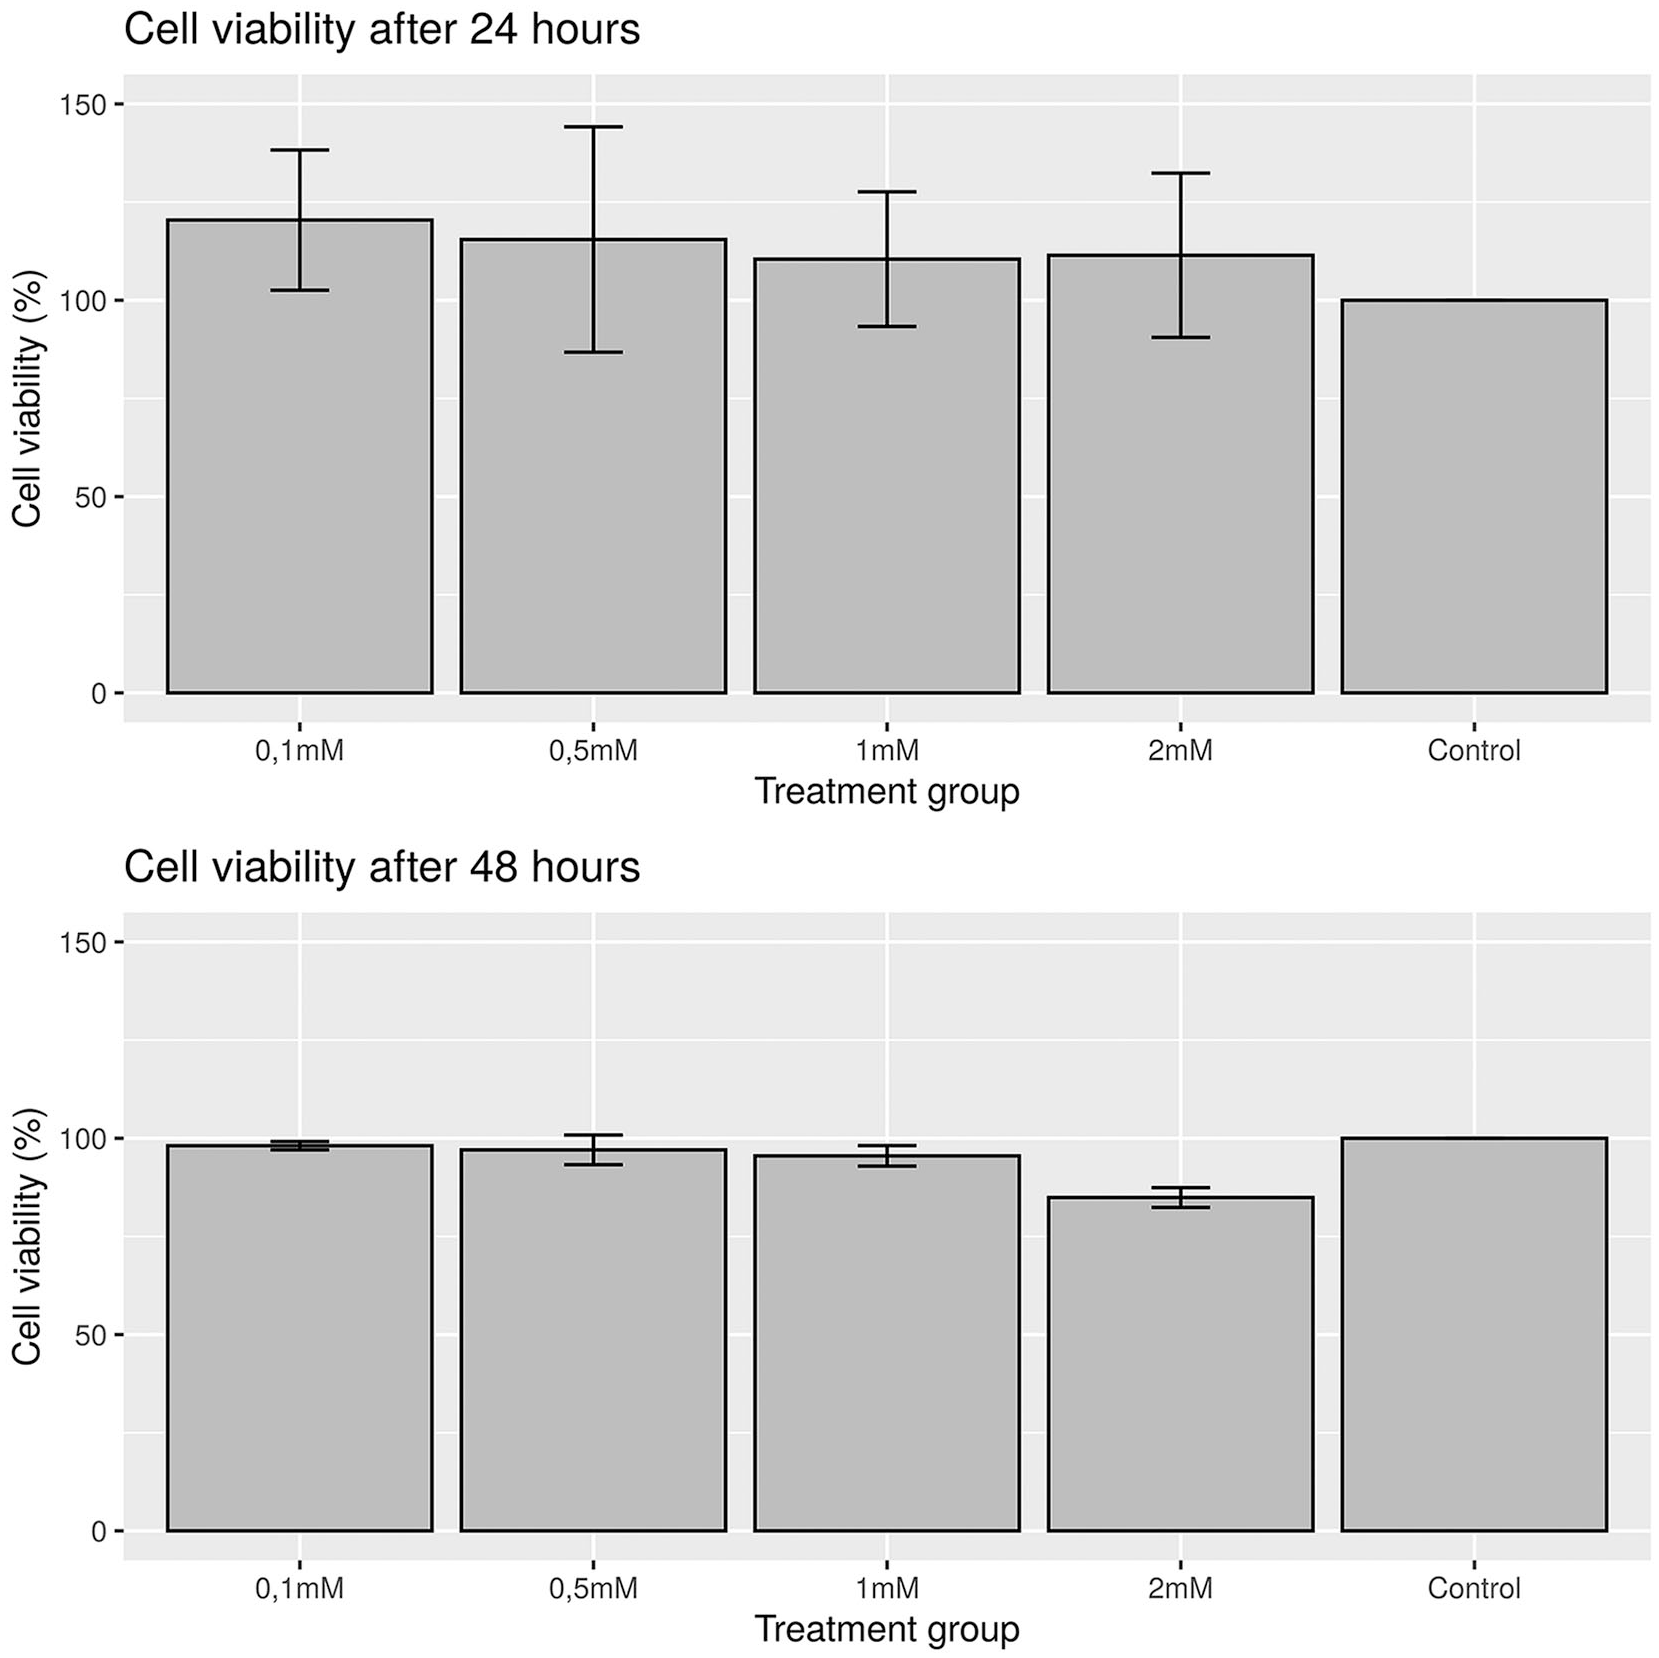
Results from CellTiter-Glo cell viability assay after 24 hours (top) and 48 hours (bottom). Bars indicate mean cell viability in percentage compared with control. Error bars show the standard deviation. No difference between treatment groups after 24 hours and 48 hours could be observed using a Kruskal-Wallis test.
Association of BMI and Gene Expression
BMI correlated only with ADAMTS5 (r = −0.69, P < 0.01) and MMP1 (r = −0.59, P = 0.03) ( Fig. 3 , Table 3 ) in univariable analysis. Multivariable linear regression was performed for each gene. The following variables were included in the regression models for ADAMTS5 and MMP1: age, BMI, HKAA, CRP level. Linear regression model coefficients are shown in Table 4 . BMI was found to be a significant predictor of gene expression in ADAMTS5 (β = −0.11, P = 0.034, n = 14, 1.079-fold increase for a BMI increase of 1 point) after adjusting for age, BMI, and HKAA. This indicates that patients with a BMI of 30 kg/m2 had a 2.14-fold increase in ADAMTS5 expression compared to patients with a BMI of 20 kg/m2 in the control group. Considering the exponential nature of PCR replication, this also indicates an exponential relationship of BMI and ADAMTS5. In our study, this exponential relationship was observed in a BMI range of 22 to 40 kg/m2. For an increase of 1 point of BMI, there is a 1.08-fold increase, while for 10 points of BMI there is a 2.14-fold increase of ADAMTS5 gene expression relative to reference genes ( Fig. 4 ). BMI was not a significant predictor of MMP1 expression in multivariable regression (β = −0.08, P = 0.148). Similar results were obtained in mixed models, were patients with a BMI of 30 kg/m2 had a 1.87-fold increase in ADAMTS5 expression compared to patients with a BMI of 20 kg/m2 ( Table 5 ).
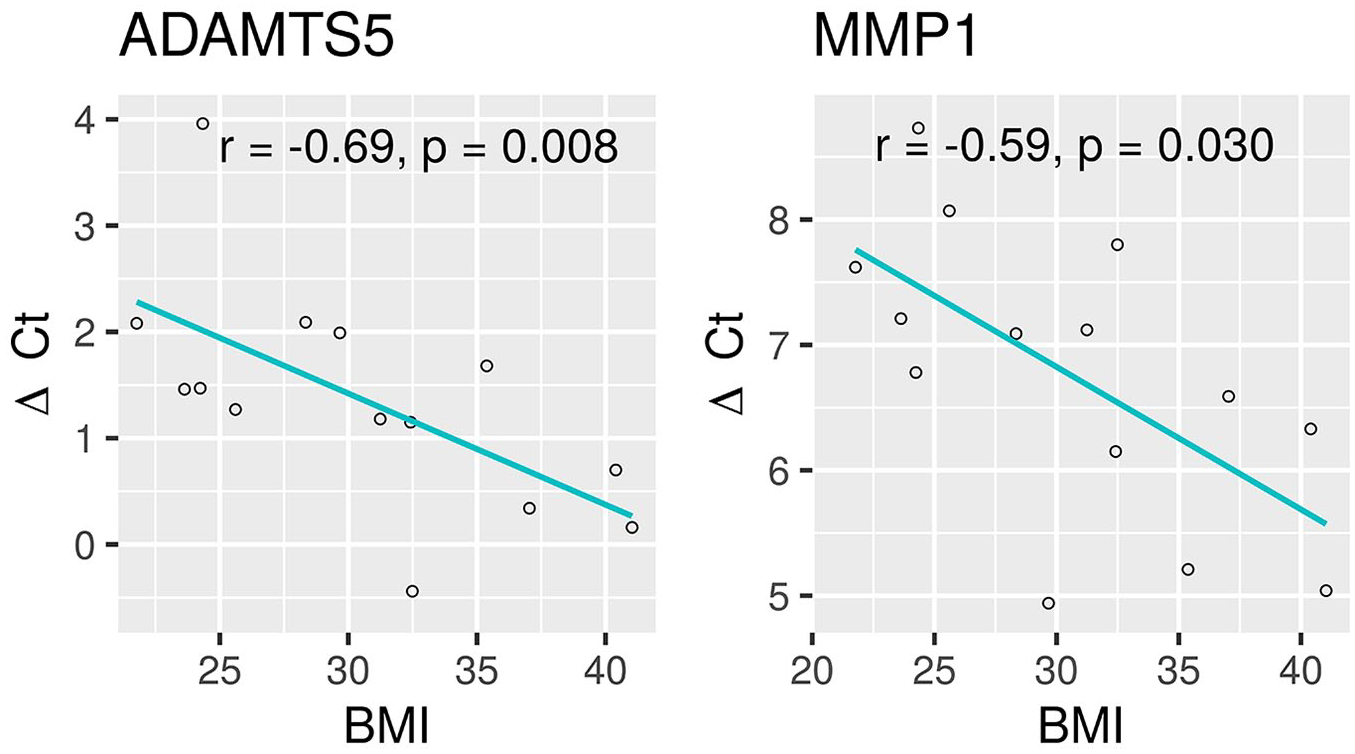
A scatterplot of body mass index (BMI) and ΔCt values of ADAMTS5 (left) and MMP1 (right) with a regression line showing a significant negative correlation. In patients with higher BMI, there is an increased expression of these two genes (a small ΔCt value indicates higher expression levels). r, Spearman’s rank correlation coefficient; P, P value.
Correlation Coefficients of BMI with the ΔCt Values of Genes of Interest Using Spearman’s Rho in the Control Group. a
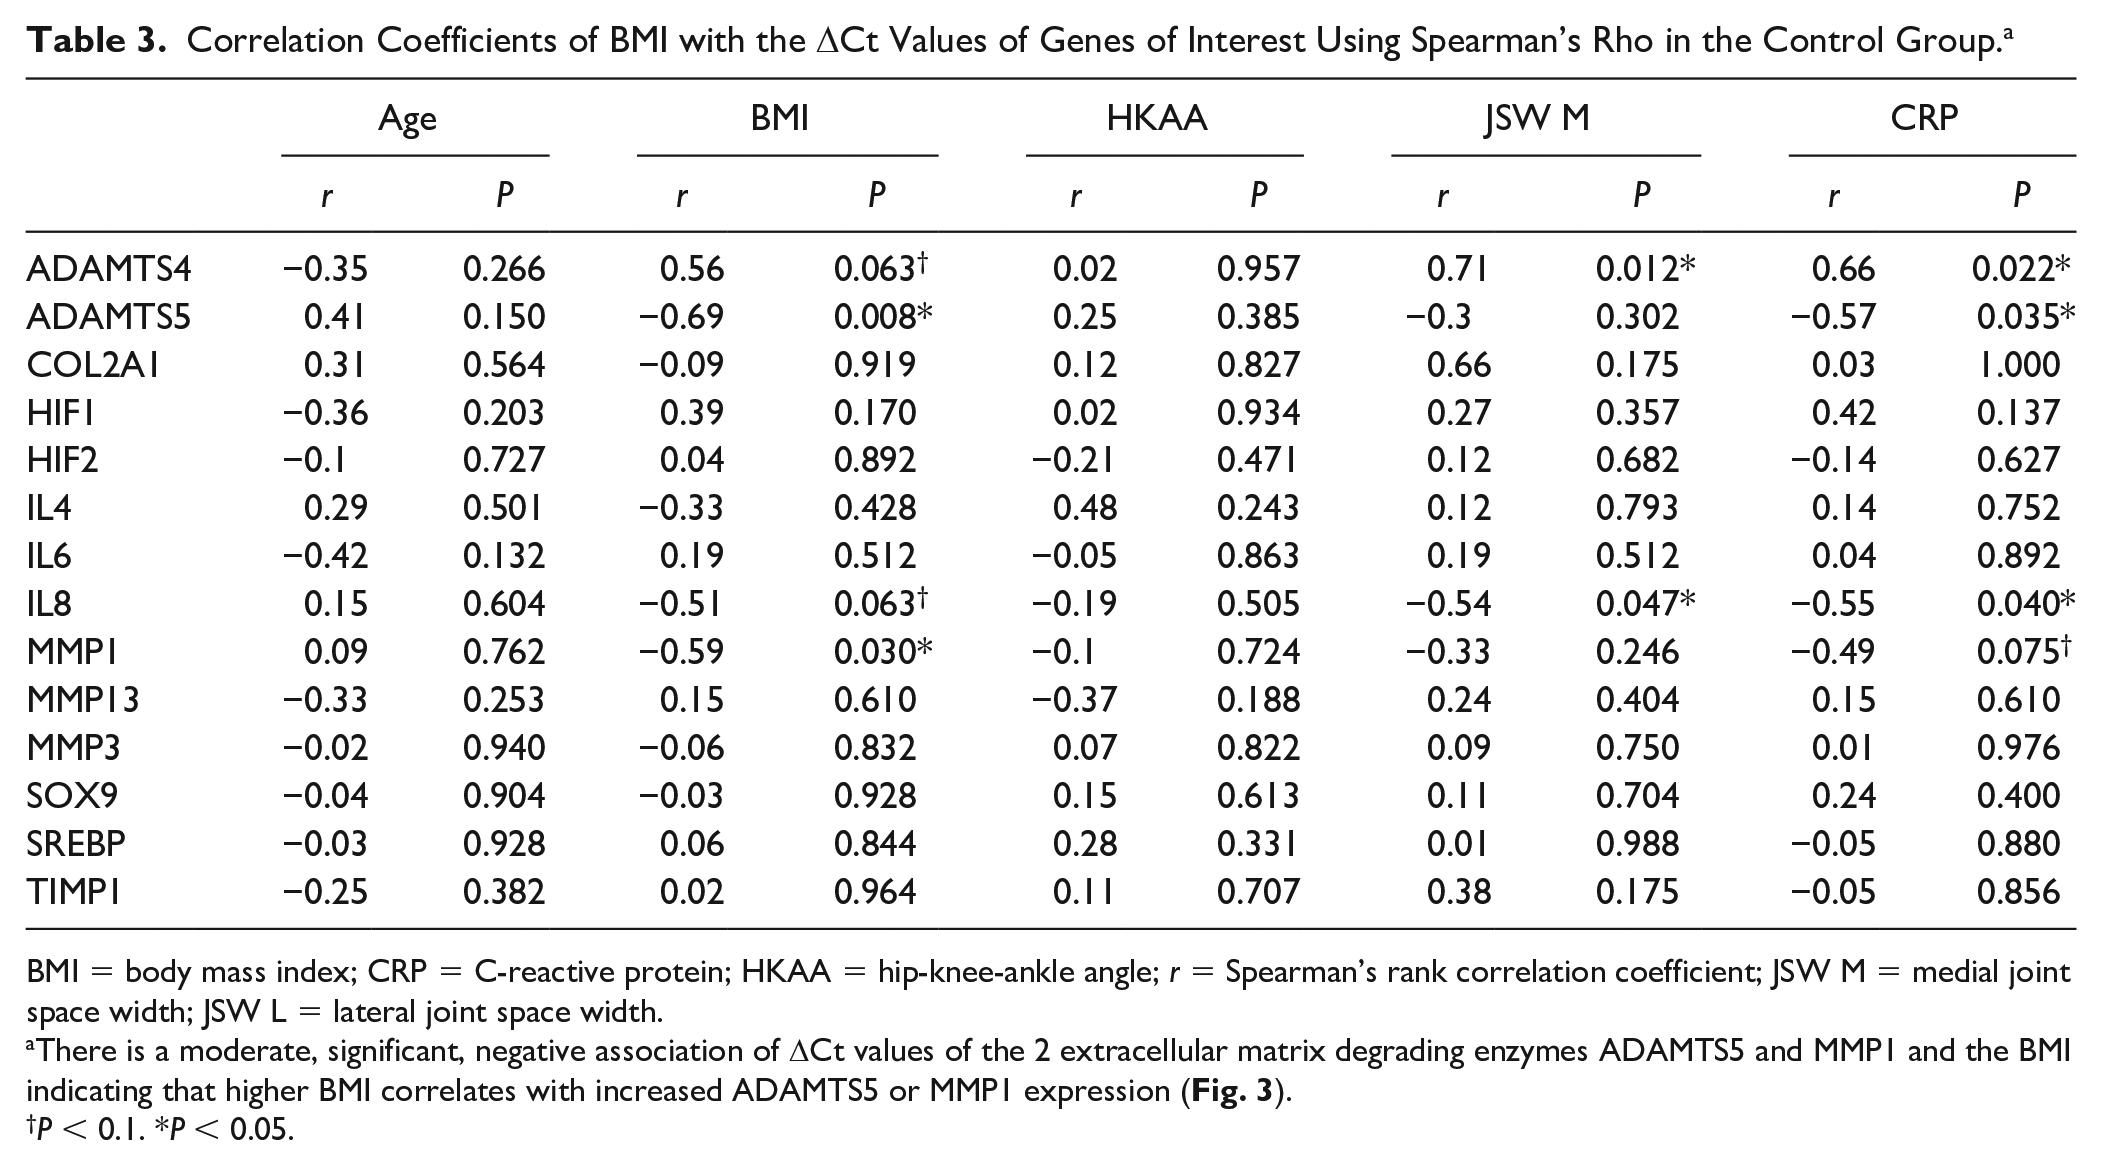
BMI = body mass index; CRP = C-reactive protein; HKAA = hip-knee-ankle angle; r = Spearman’s rank correlation coefficient; JSW M = medial joint space width; JSW L = lateral joint space width.
There is a moderate, significant, negative association of ΔCt values of the 2 extracellular matrix degrading enzymes ADAMTS5 and MMP1 and the BMI indicating that higher BMI correlates with increased ADAMTS5 or MMP1 expression ( Fig. 3 ).
P < 0.1. *P < 0.05.
Fixed-Effects Linear Regression Model for ADAMTS5 and MMP1. a
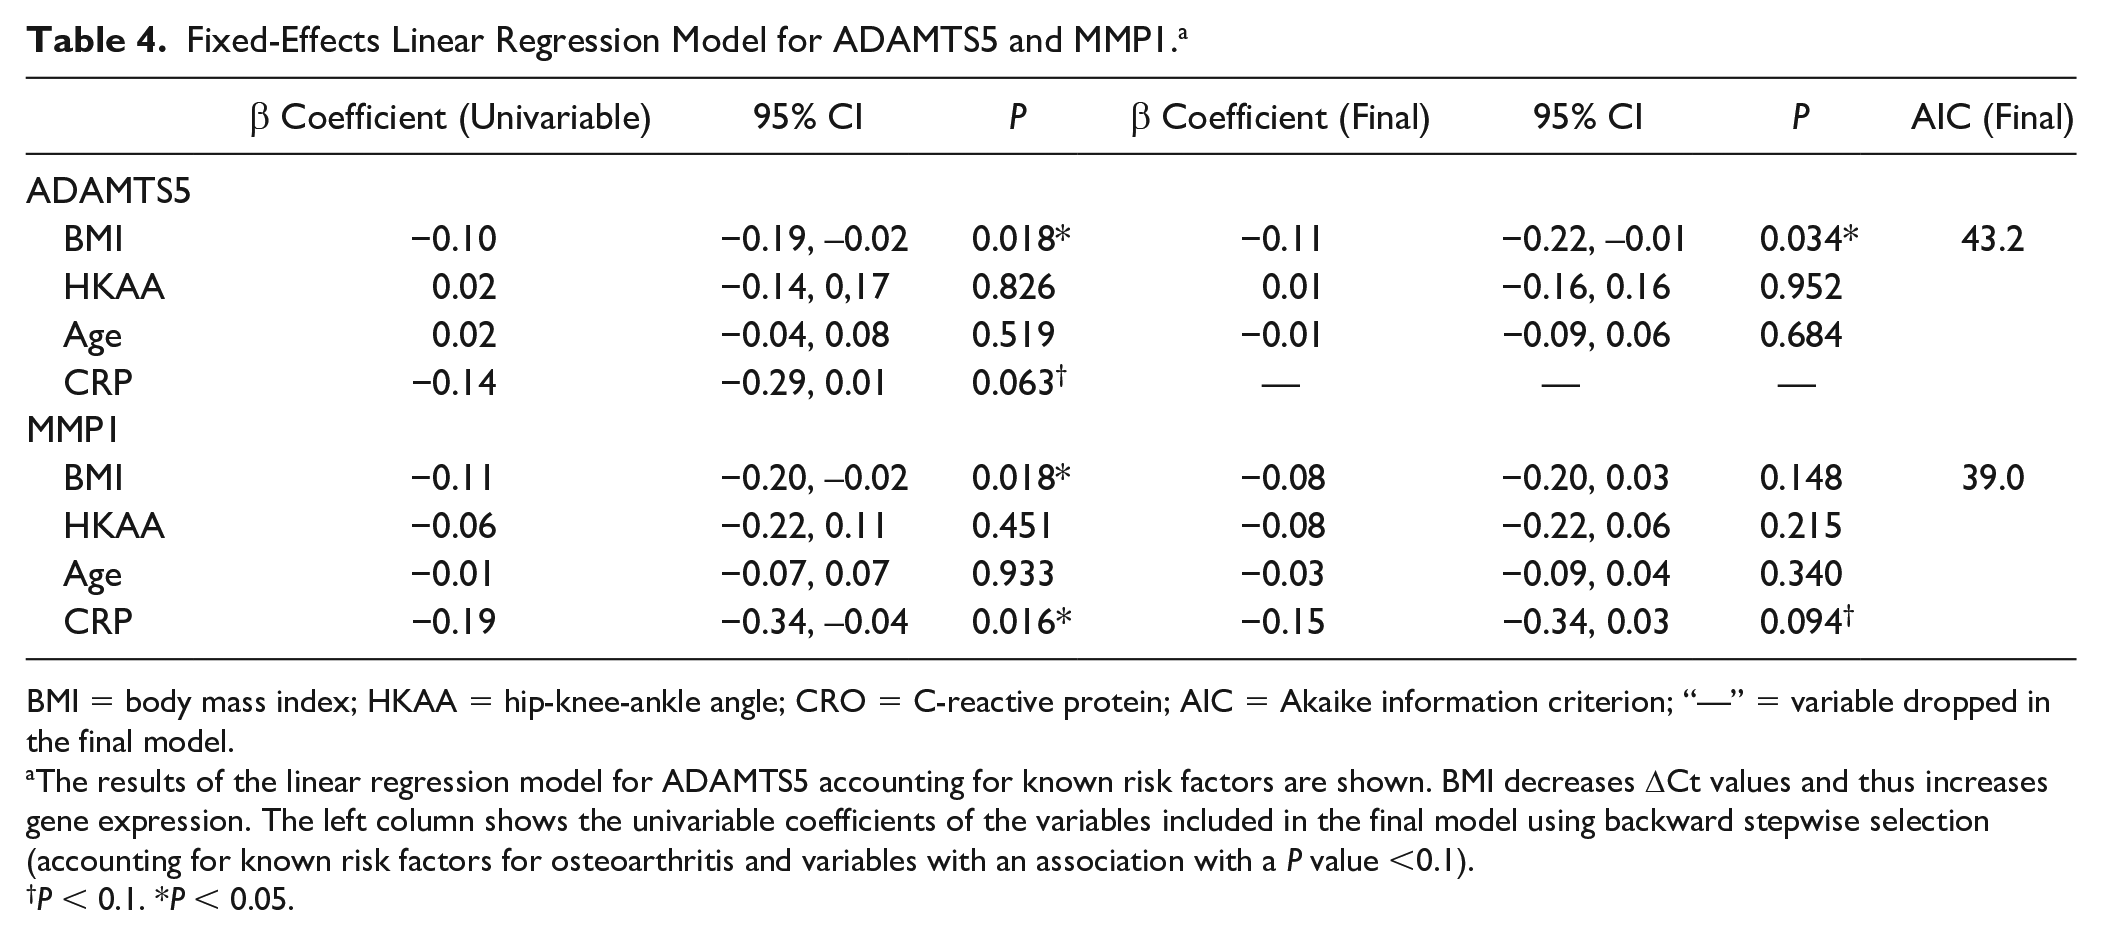
BMI = body mass index; HKAA = hip-knee-ankle angle; CRO = C-reactive protein; AIC = Akaike information criterion; “—” = variable dropped in the final model.
The results of the linear regression model for ADAMTS5 accounting for known risk factors are shown. BMI decreases ΔCt values and thus increases gene expression. The left column shows the univariable coefficients of the variables included in the final model using backward stepwise selection (accounting for known risk factors for osteoarthritis and variables with an association with a P value <0.1).
P < 0.1. *P < 0.05.
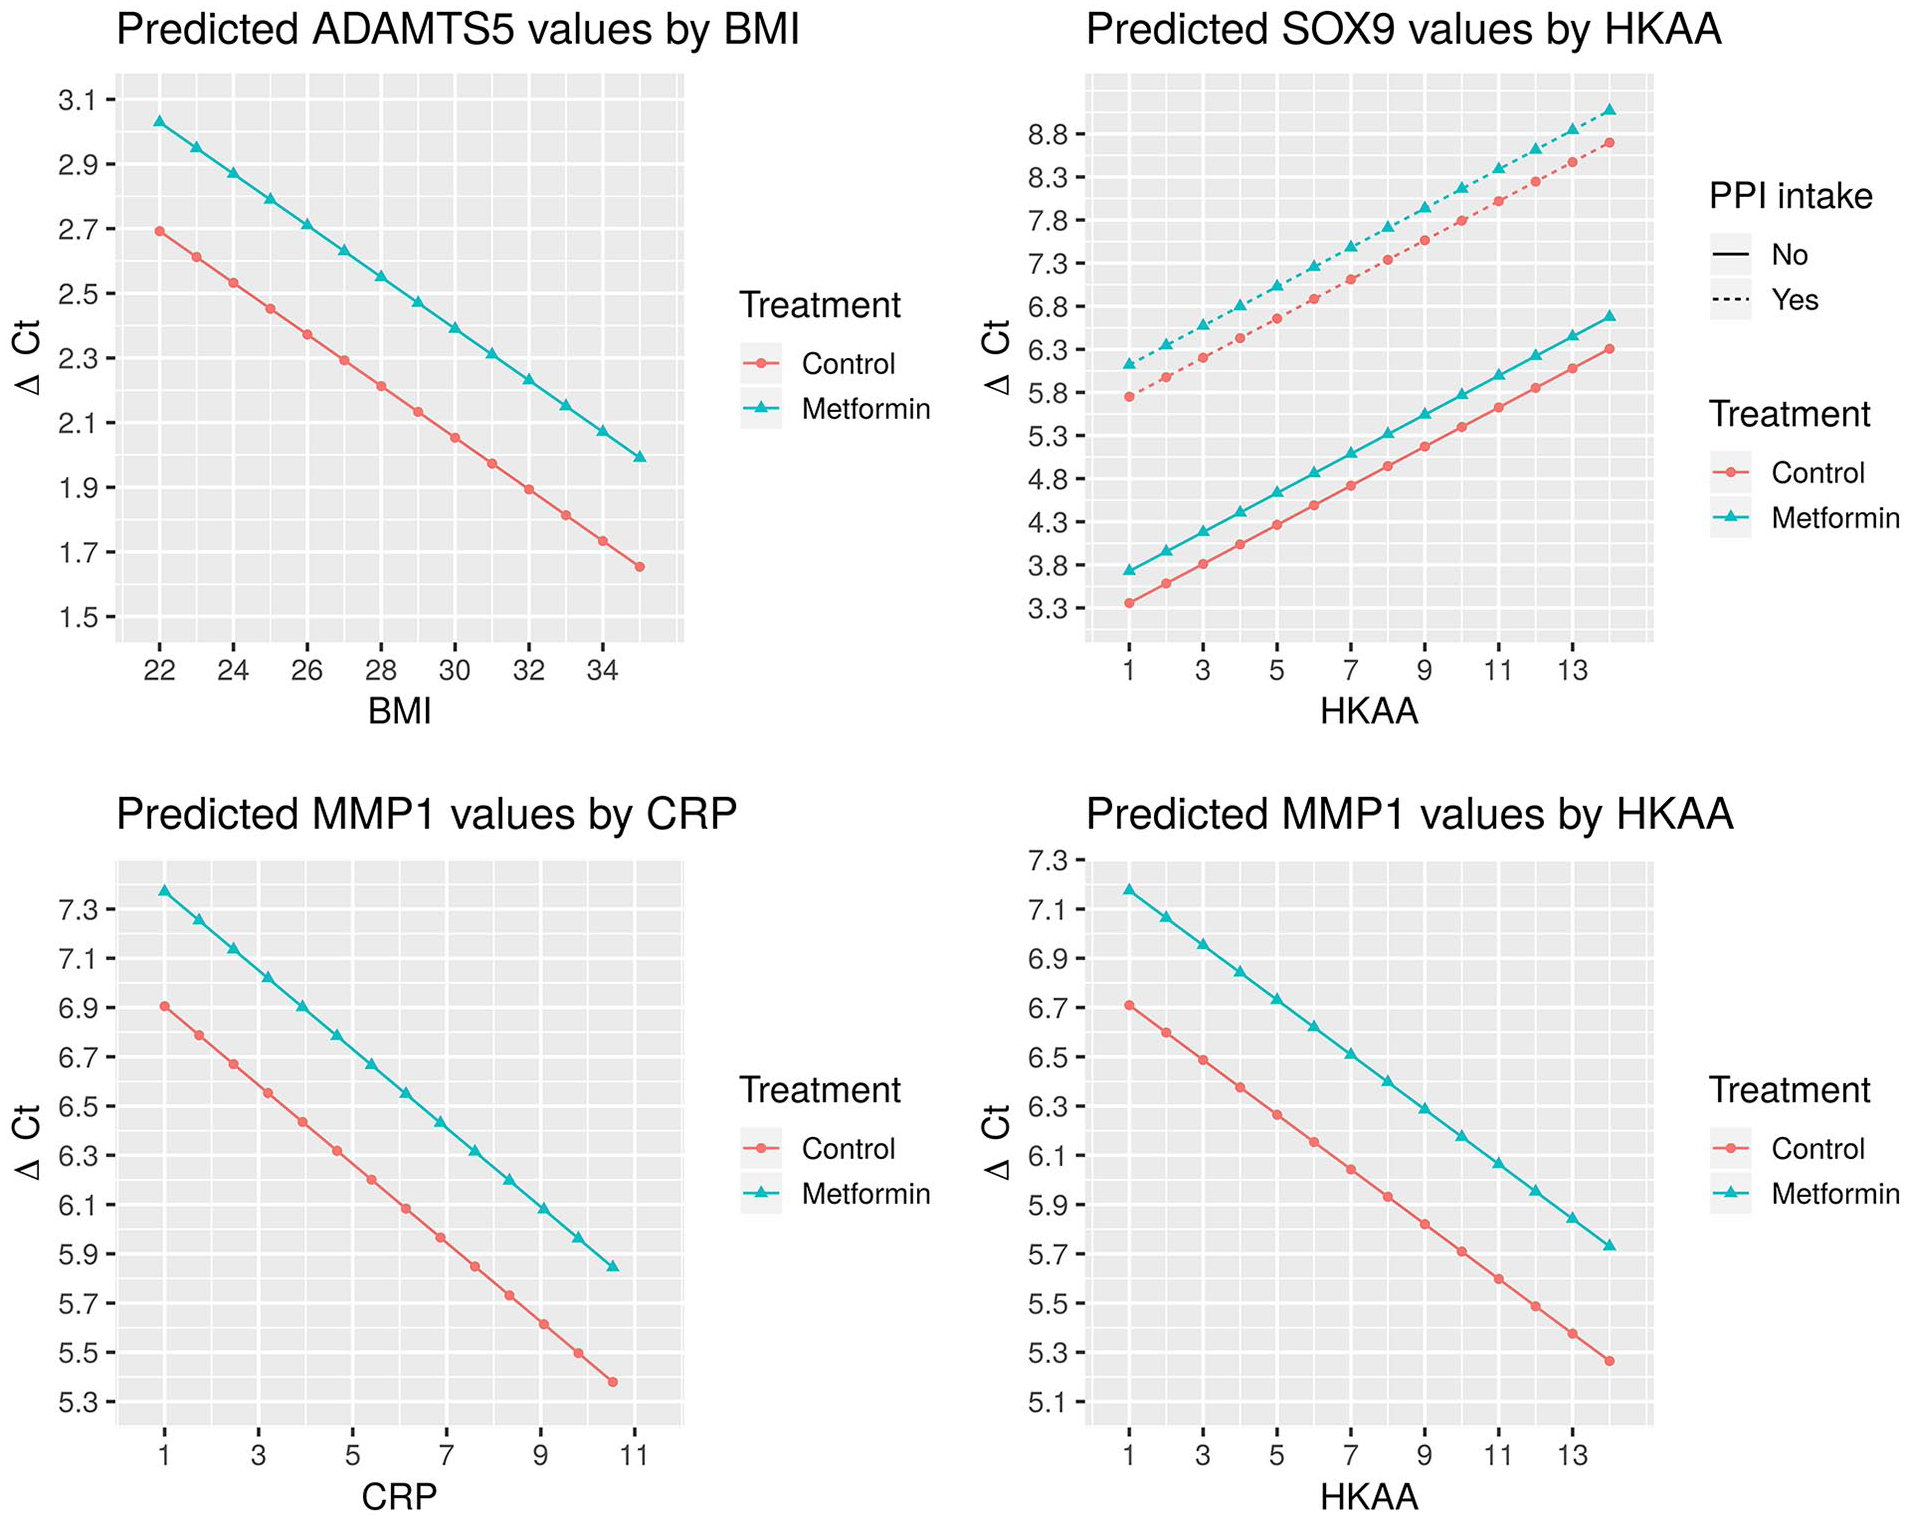
The predicted ΔCt values based on regression models for ADAMTS5 (top left), SOX9 (top right), and MMP1 (bottom left and right), holding all variables except metformin treatment, as well as body mass index (BMI) (top left), hip-knee-ankle angle (HKAA), and proton pump inhibitor (PPI) use (top right) and C-reactive protein (CRP) (bottom left) and HKAA (bottom right), constant. With higher BMI, CRP, or HKAA values, there is a decrease in the respective ΔCt values of ADAMTS5 and MMP1 (top left, bottom right and left) and thus increase in gene expression of the respective gene. Metformin leads to a small increase in ΔCt and thus a decrease in gene expression as depicted in all graphs. PPI intake is associated with a strong increase in ΔCt and thus decrease in SOX9 gene expression (top right).
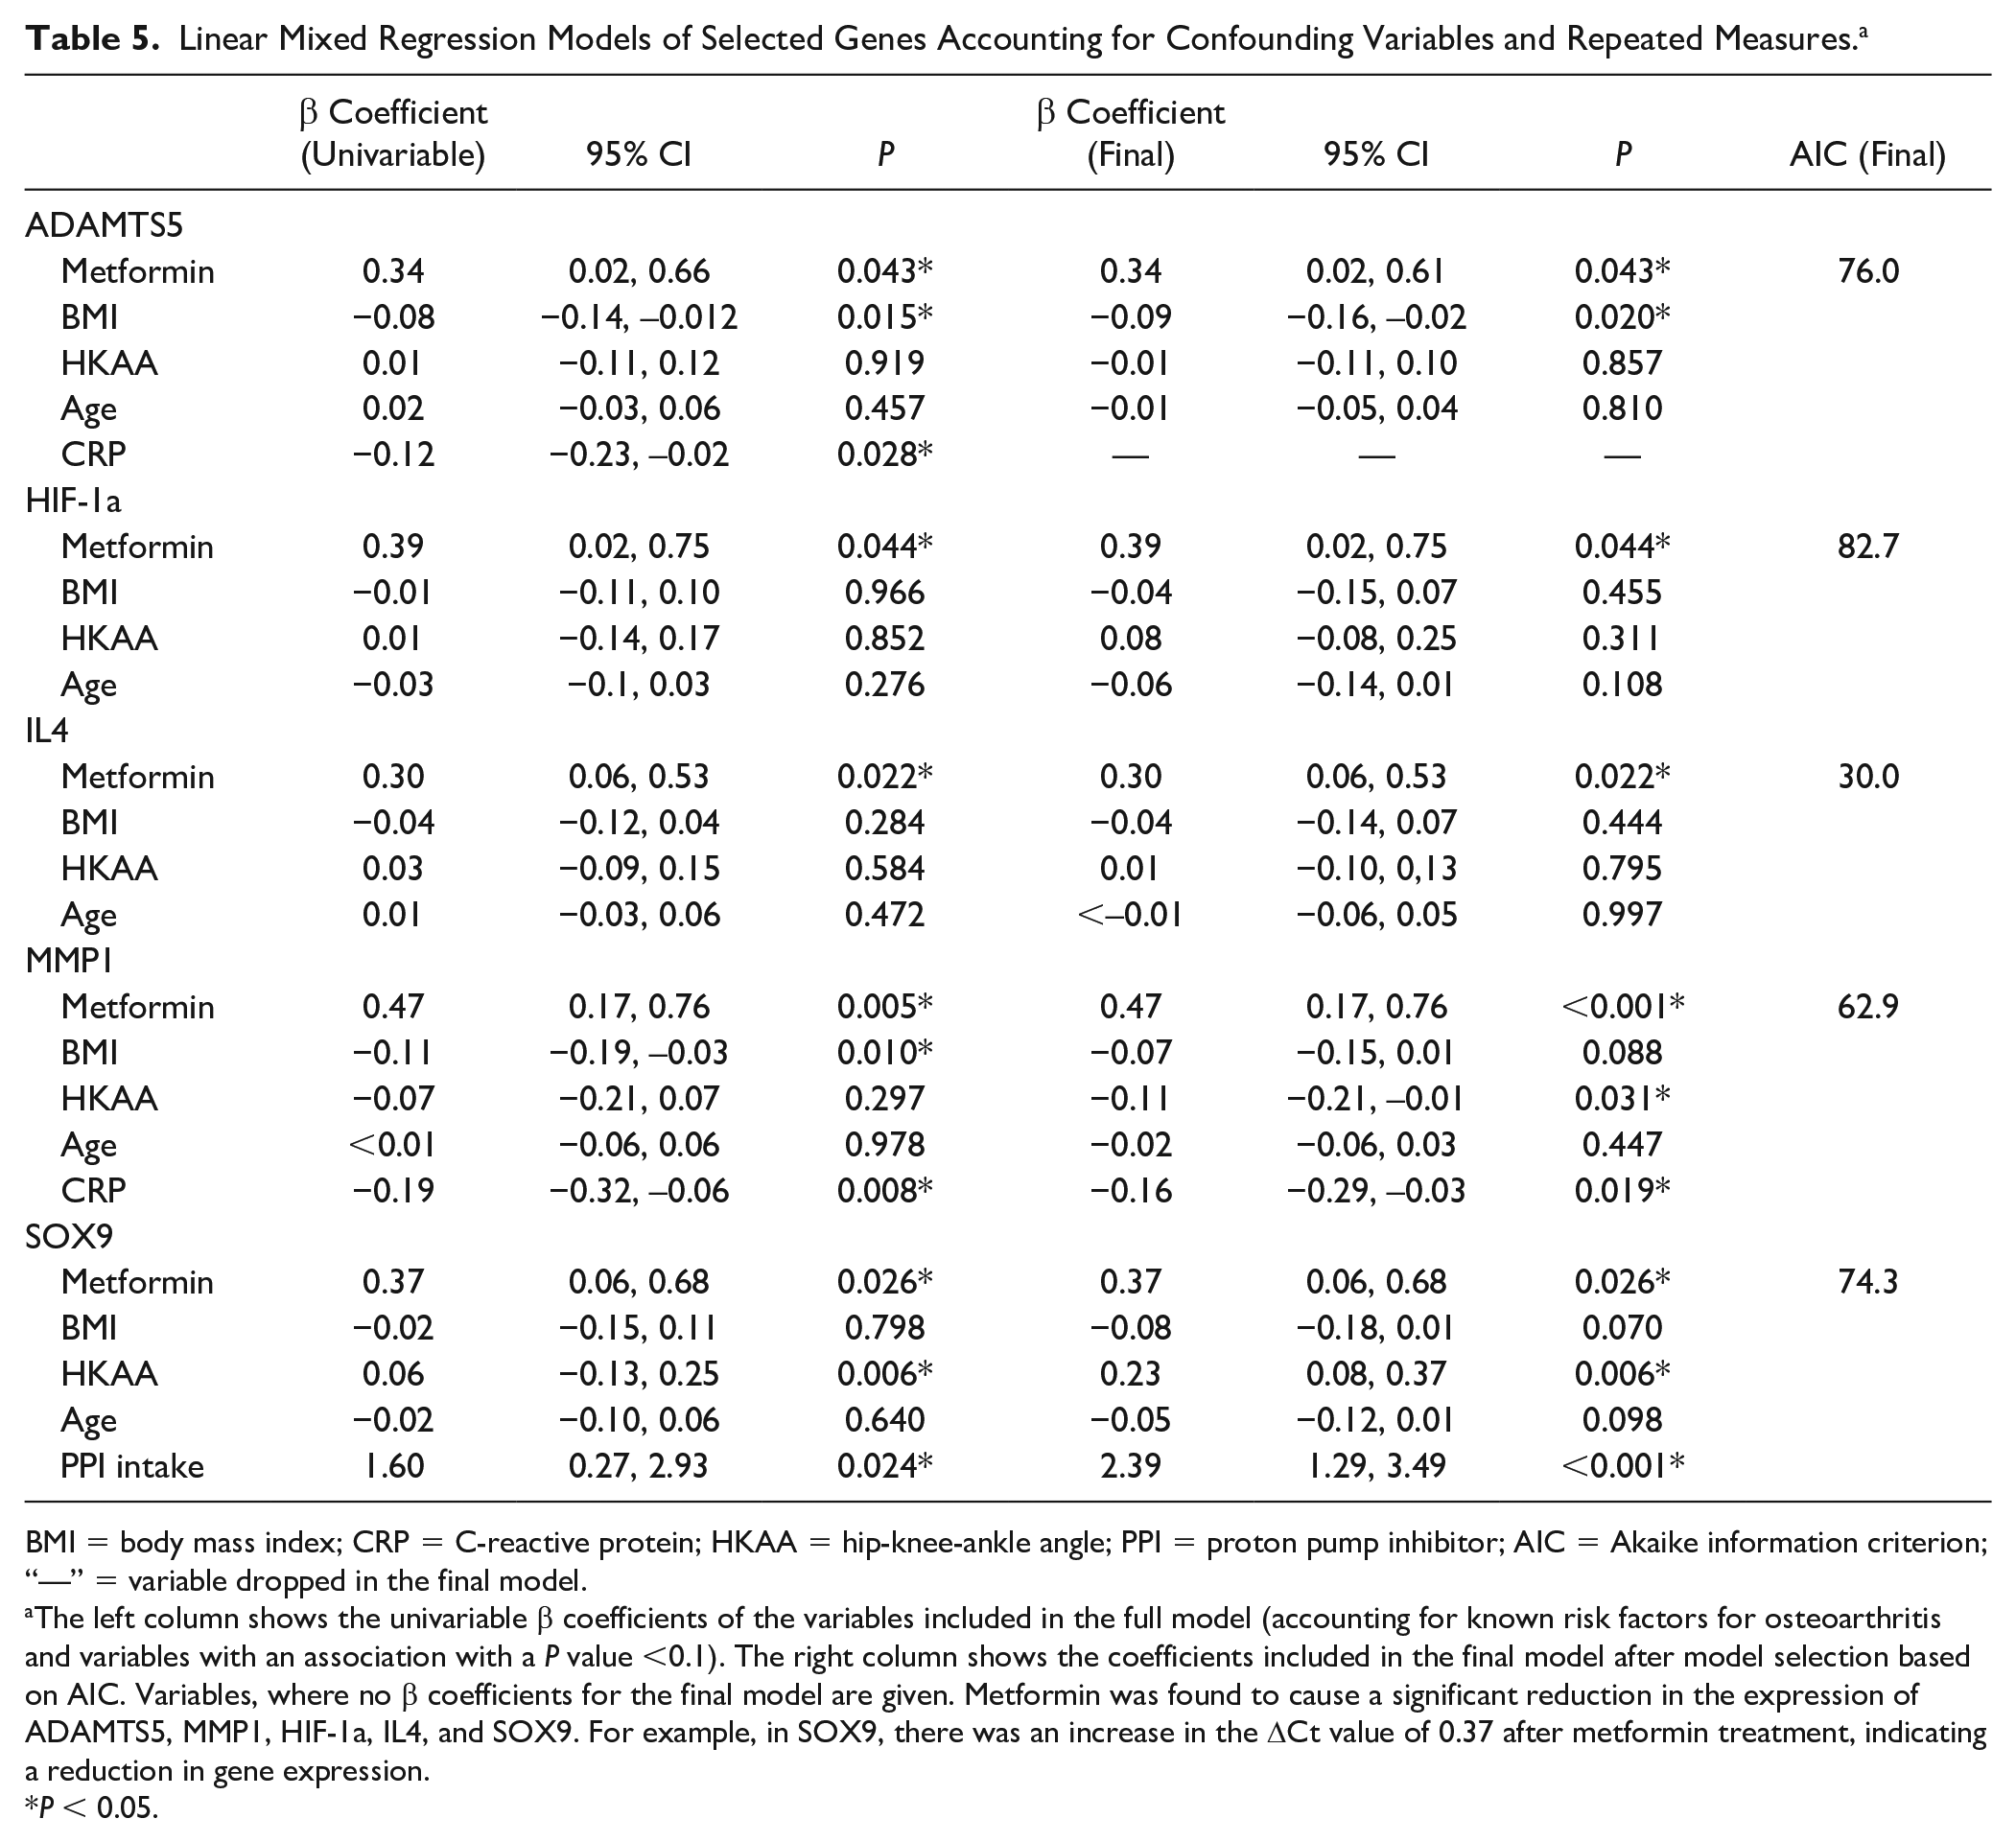
Linear Mixed Regression Models of Selected Genes Accounting for Confounding Variables and Repeated Measures. a
BMI = body mass index; CRP = C-reactive protein; HKAA = hip-knee-ankle angle; PPI = proton pump inhibitor; AIC = Akaike information criterion; “—” = variable dropped in the final model.
The left column shows the univariable β coefficients of the variables included in the full model (accounting for known risk factors for osteoarthritis and variables with an association with a P value <0.1). The right column shows the coefficients included in the final model after model selection based on AIC. Variables, where no β coefficients for the final model are given. Metformin was found to cause a significant reduction in the expression of ADAMTS5, MMP1, HIF-1a, IL4, and SOX9. For example, in SOX9, there was an increase in the ΔCt value of 0.37 after metformin treatment, indicating a reduction in gene expression.
P < 0.05.
Effect of Metformin Treatment of Chondrocytes on Gene Expression
Metformin had a significant treatment effect on ΔCt values in the following genes compared with the control group: IL4 (11.6 ± 0.6 vs. 11.3 ± 0.6, P = 0.03), MMP1 (7.2 ± 1.2 vs. 6.8 ± 1.1, P < 0.01), and SOX9 (5.1 ± 1.3 vs. 4.7±1.7, P = 0.04) ( Fig. 5 ). After controlling for confounding variables, this effect was significant in the following genes: ADAMTS5 (β = 0.34, P = 0.043, n = 14 per treatment group, 0.79-fold decrease) (controlled for BMI, HKAA, age), HIF-1a (β = 0.39, P = 0.04, n = 14 per treatment group, 0.76-fold decrease) (adjusted for BMI, HKAA, age), IL4 (β = 0.30, P = 0.02, n = 8 per treatment group, 0.81-fold decrease) (accounting for BMI, HKAA, age), MMP1 (β = 0.47, P < 0.01, n = 14 per treatment group, 0.72-fold decrease) (adjusted for BMI, HKAA, age, CRP level), SOX9 (β = 0.37, P = 0.03, n = 14 per treatment group, 0.77-fold decrease) (controlling for BMI, HKAA, age, PPI intake). Table 5 shows linear mixed models and coefficients. This indicates that stimulation with metformin causes a 21% decrease in ADAMTS5, a 24% decrease in HIF-1a, a 19% decrease in IL4, a 23% decrease in SOX9, and a 28% decrease in MMP1 gene expression. Other catabolic markers were not found to be affected by metformin stimulation. This relationship is graphically depicted in Fig. 4 , which shows predicted regression lines for MMP1 by HKAA, and for ADAMTS5 by BMI, holding all other variables constant. Fig. 6 and Table 6 show the fold change in gene expression based on regression results.
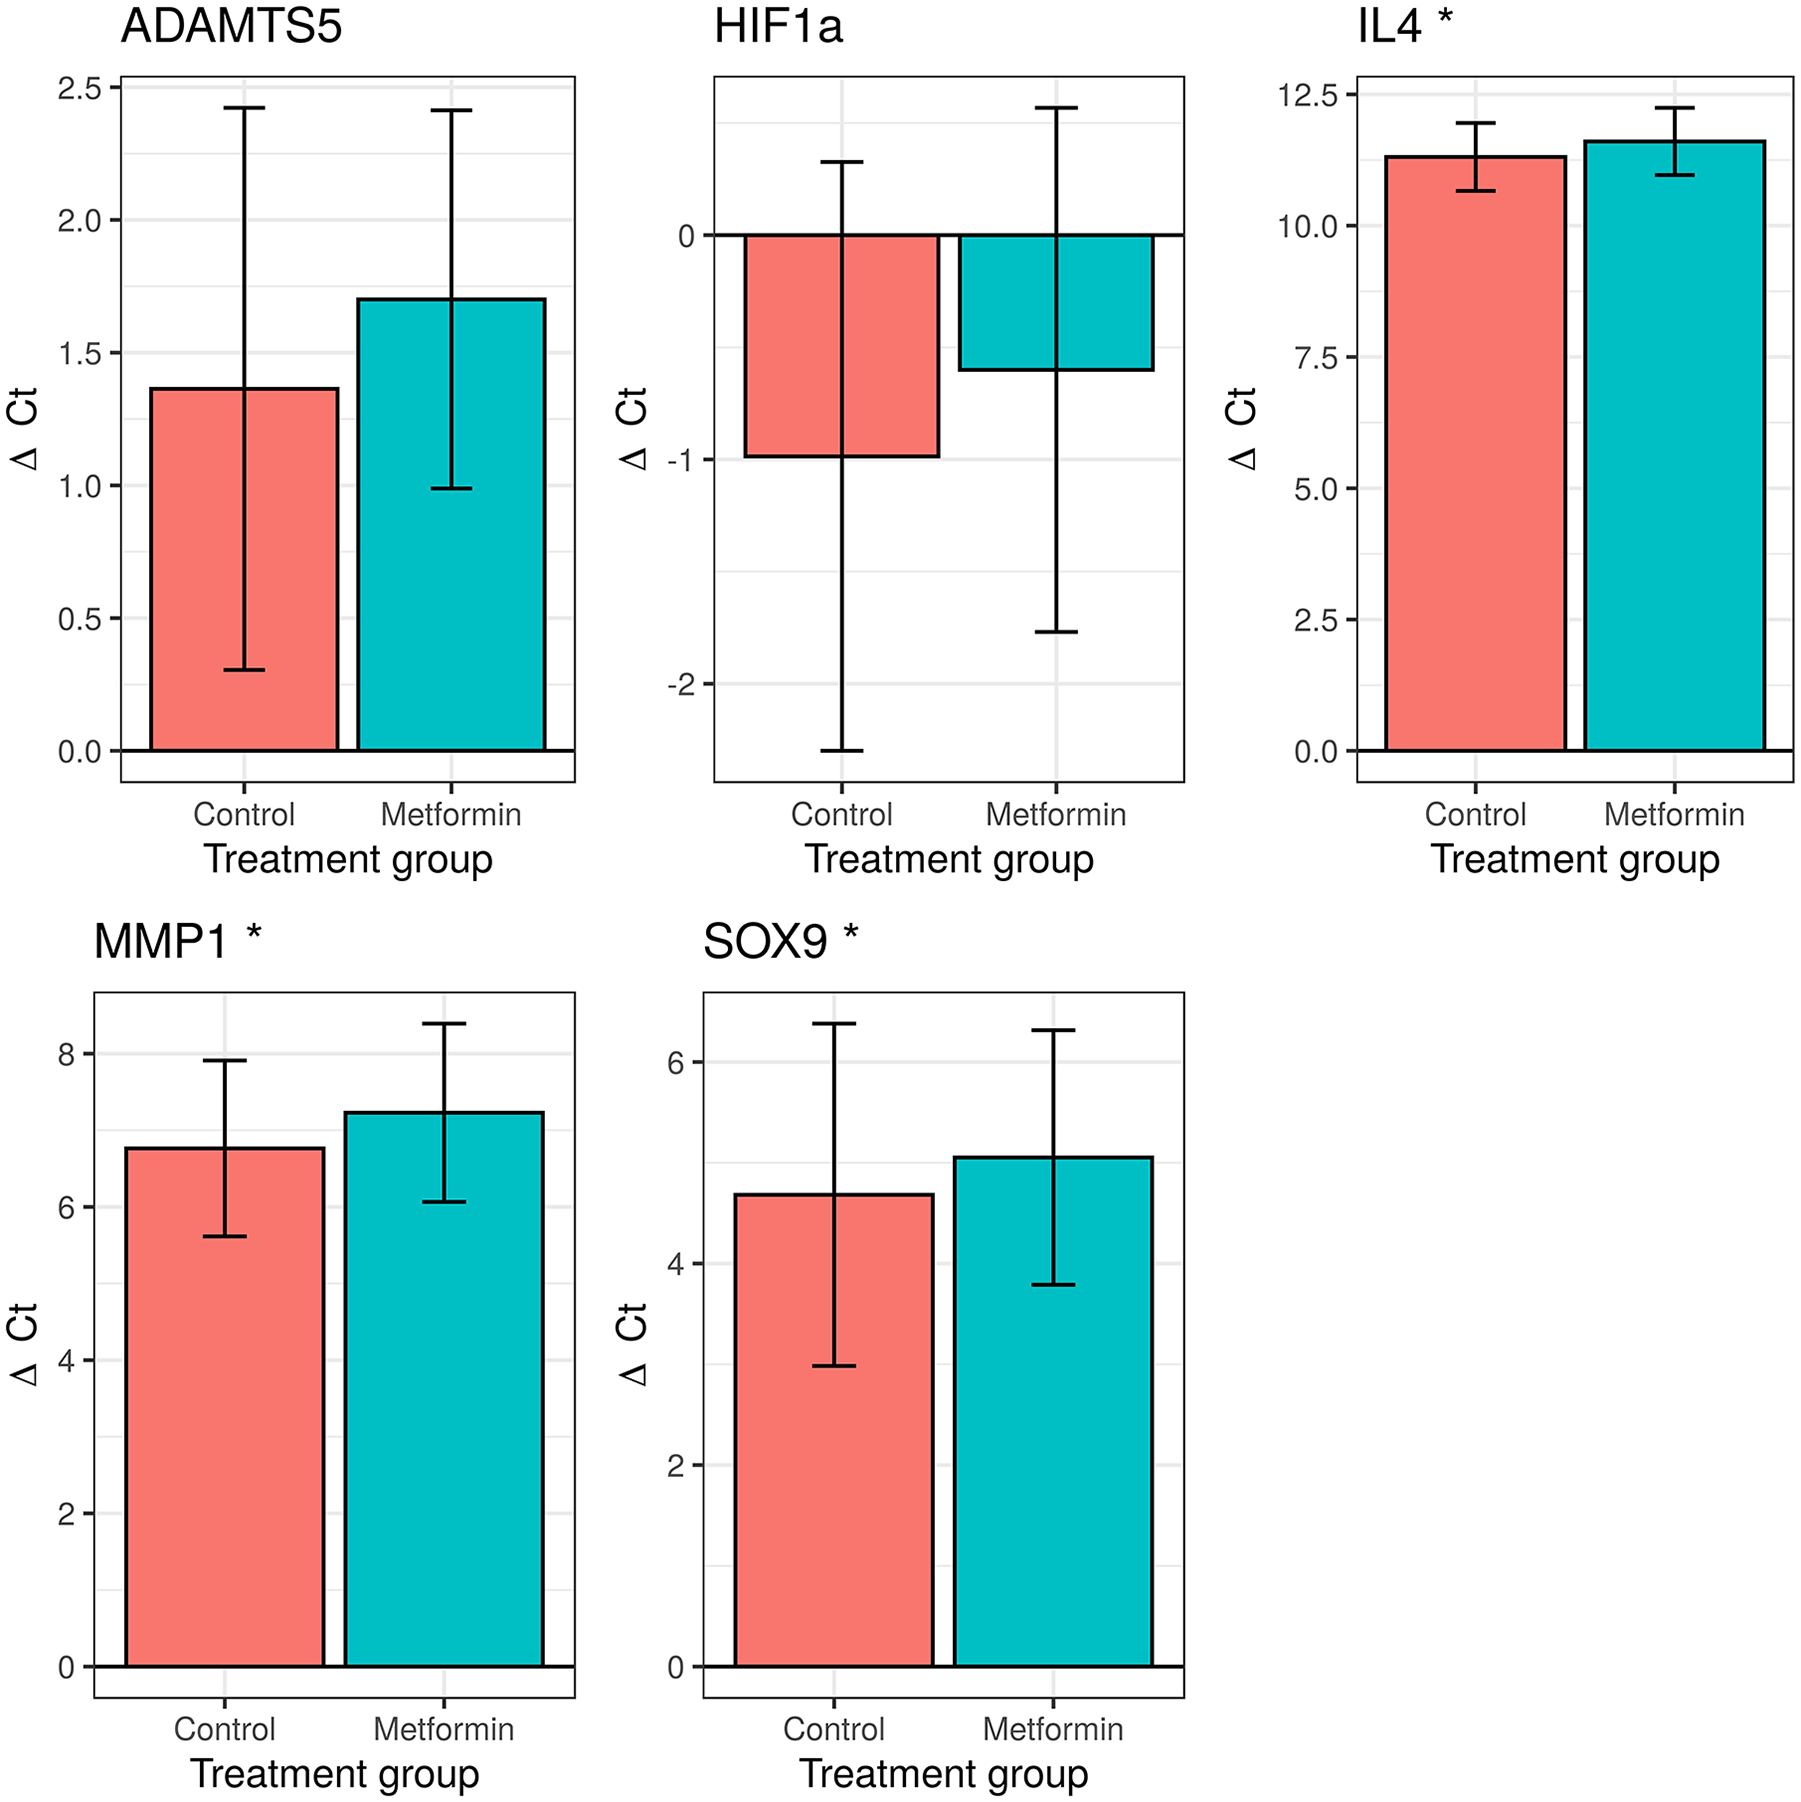
The metformin treatment effect of selected genes of interest. This figure shows the mean ΔCt values in the control versus treatment group. The error bars indicate the standard deviation. Metformin significantly decreased expression of IL4, MMP1, and SOX9 in univariable analysis. “.” P < 0.1. *P < 0.05.
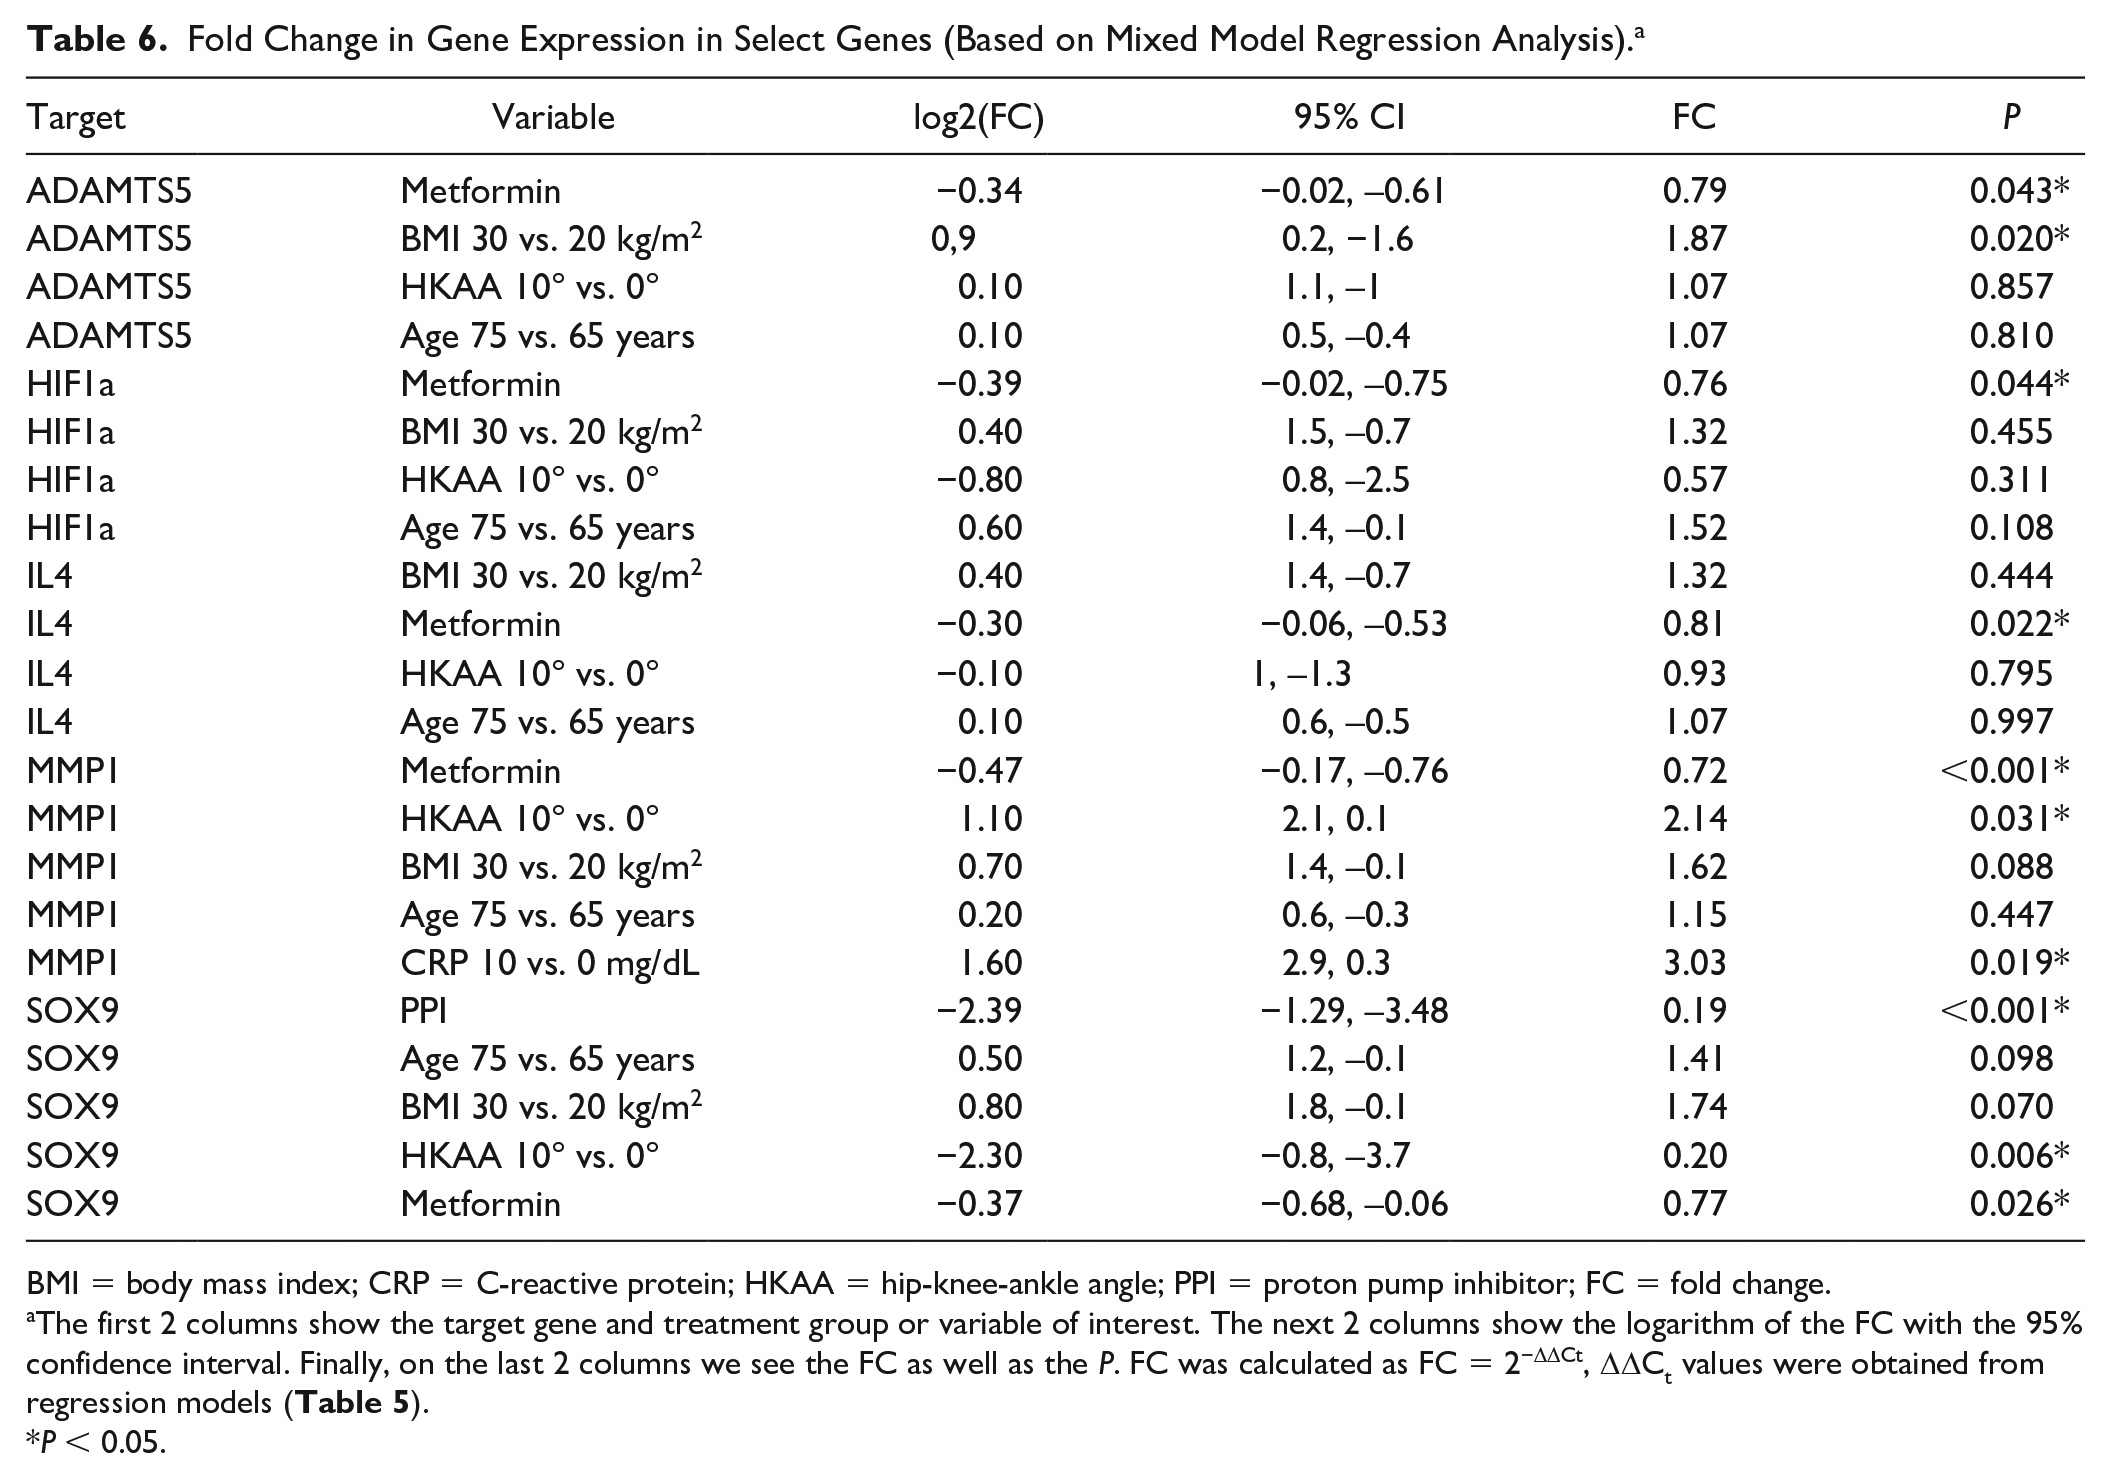
Fold Change in Gene Expression in Select Genes (Based on Mixed Model Regression Analysis). a
BMI = body mass index; CRP = C-reactive protein; HKAA = hip-knee-ankle angle; PPI = proton pump inhibitor; FC = fold change.
The first 2 columns show the target gene and treatment group or variable of interest. The next 2 columns show the logarithm of the FC with the 95% confidence interval. Finally, on the last 2 columns we see the FC as well as the P. FC was calculated as FC = 2−ΔΔCt, ΔΔCt values were obtained from regression models ( Table 5 ).
P < 0.05.
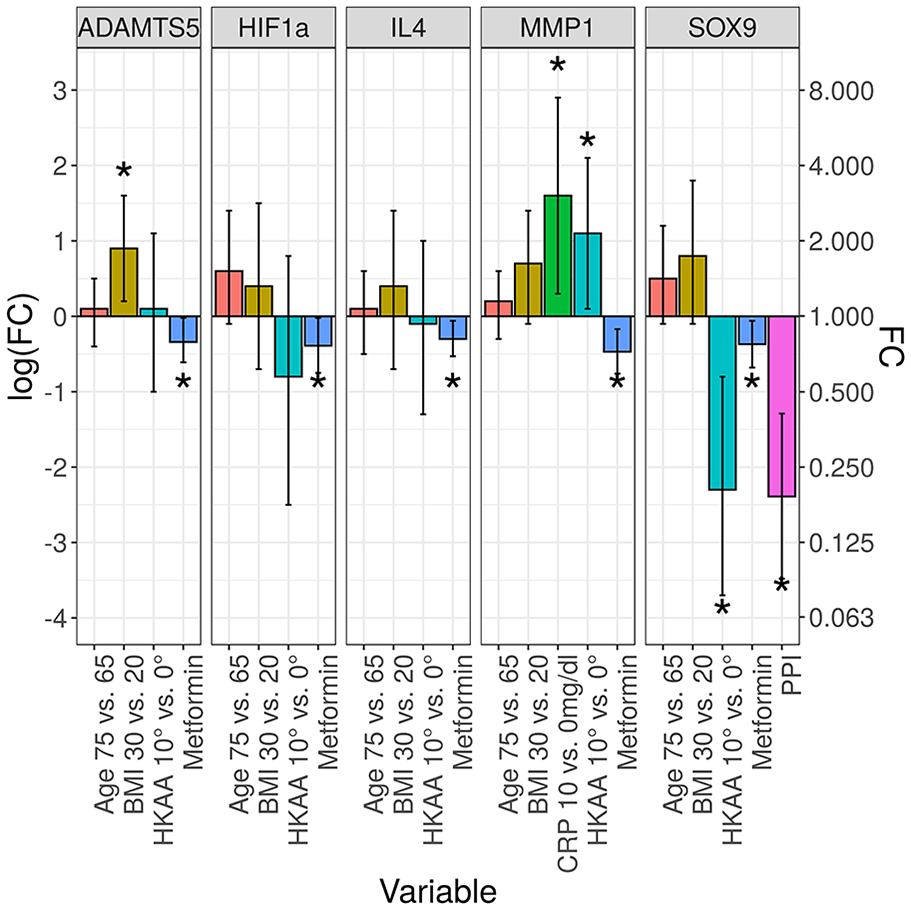
The fold change in gene expression in select genes. In this bar chart, we see the deviation from the baseline gene expression in select genes and various treatment groups or variables of interest (0 in the logarithmic scale on the left, 1 in the fold change ratio scale on the right). A bar above baseline indicates an increase in gene expression. Error bars indicate the 95% confidence intervals on the log scale. Fold change was calculated based on regression models (
Tables 5
and
Association of HKAA and JSW and Gene Expression
Medial JSW was positively correlated with ADAMTS4(r = 0.71, P = 0.012), while there was a negative correlation with IL8 (r = −0.54, P = 0.047) in the control group ( Table 3 ). This could not be confirmed by mixed model multivariable regression, however (the variable was dropped in the final model). Instead we found that HKAA was a significant predictor of SOX9 expression (β = 0.23, P < 0.01, n = 14 per treatment group, 0.85-fold decrease for 1° of malalignment) (controlled for age, BMI, and PPI intake) in multivariable mixed model regression. Patients with a deviation of 10° HKAA showed a substantially reduced expression of SOX9 (0.2-fold) ( Tables 5 and 6 , Fig. 6 ).
Association of Inflammation Markers and Gene Expression
CRP showed a significant correlation with ADAMTS4(r = 0.7, P = 0.02), ADAMTS5 (r = −0.6, P = 0.04), and IL8 (r = −0.6, P = 0.04) in the control group ( Table 3 ). In the multivariable mixed model regression, CRP was a significant predictor of MMP1 gene expression (β = −0.16, P = 0.02, n = 14 per treatment group, 1.12-fold increase for 1-point increase in CRP level) (adjusted for BMI, HKAA, and age) ( Tables 5 and 6 , Fig. 6 ). Patients with a CRP level of 10 mg/dL had a 3-fold increase in MMP1 expression compared to patients with a level of 0 mg/dl. CRP was not a significant predictor of ADAMTS4, ADAMTS5, and IL8, however (the variable was dropped in the respective final model).
Association of Comedication
Oral use of PPIs was a significant predictor of reduced SOX9 expression in regression models (β = 2.39, P < 0.01, n = 14 per group, 0.19-fold decrease in PPI intake) (controlled for age, BMI, and HKAA) ( Tables 5 and 6 , Fig. 6 ).
Discussion
The purpose of this study was to assess the effect of BMI and metformin on the expression of important matrix genes in human chondrocytes using RT-qPCR. The hypothesis was that BMI and metformin have significant effects on these matrix genes and thus on the pathogenesis of OA of the knee joint. We found that an increase in BMI influences the expression of matrix degrading gene ADAMTS5, while metformin treatment at the cellular level causes a reduction of the catabolic genes ADAMTS5 and MMP1. Furthermore, we found a reduction of anabolic SOX9 gene expression in chondrocytes in patients with increased HKAA, and patients on PPIs. Finally, higher CRP levels were associated with increased MMP1 expression.
BMI is a known risk factor for knee OA. In addition, BMI is also associated with OA of the hand which indicates that other effects such as systemic inflammation might play a role in pathogenesis.8,9 In our study, BMI was a significant predictor of the expression of ADAMTS5: Higher BMI values led to a small, exponential increase in gene expression. ADAMTS5, a member of aggrecanases, causes cartilage destruction. In contrast to our findings, a study applying ex vivo physiologic mechanical compression on human cartilage found a change of collagen type II and aggrecan, but no effect on ADAMTS4. 26 Another study found a positive association of BMI and TGFβ, aggrecan, MMP-13, IGF1, and TIMP2. As in our study, no effect on type 2 collagen could be found. 7 Our results show that baseline expression of matrix genes is affected by BMI.
Metformin is the first-line treatment in type 2 diabetes mellitus, a risk factor for OA. The effects of metformin on human cartilage gene expression have not been investigated extensively. The mechanism of action of metformin is complex and not fully understood. It acts via both AMPK-dependent and AMPK-independent mechanisms. 27 Findings from clinical studies on metformin treatment in OA are equivocal. In one study using prospective data, metformin was found to reduce cartilage loss. 12 Another study showed that patients with knee OA treated with a combination of meloxicam and metformin had a higher improvement in several clinical scores. 28 Another study on patients prescribed metformin, however, could not find an association with the risk of OA. 29
In mouse chondrocytes, metformin was able to mitigate cytotoxic effects of IL-1β. Furthermore, metformin also reduced production of reactive oxygen species in that study. 14 In another study, AMPK activation by metformin improved mitochondrial function and reduced oxidative stress. 30 In OA mouse model metformin reduced cartilage degradation. 31
In agreement with these studies, our results showed that expression of catabolic genes can be suppressed after 48 hours of exposure to metformin. We found that metformin slightly decreased expression of catabolic genes ADAMTS5, MMP1. On the other hand, expression of anabolic genes HIF-1a, IL4, and SOX9 was slightly reduced as well.
Our findings are supported by another study that found a reduction of MMP3 and MMP13 in OA mouse knee model after metformin treatment. 15 Also, metformin reduced MMP3 and ADAMTS5 expression in rat nucleus pulposus cell culture. 16 Our results indicate that metformin might reduce expression of these genes and exert a protective effect on cartilage.
SOX9 is a transcription factor and plays an important role as regulator of cartilage formation and chondrocyte differentiation. 32 In late-stage OA, SOX9 expression is reduced and its upregulation inhibits IL-1β induced inflammatory response.33,34 Supporting our findings, metformin reduced SOX9 expression in esophageal cancer cells. 35 Contrary to this, metformin was found to increase levels of SOX9 expression in mouse cartilage. 15 How this affects cartilage metabolism and clinical results in humans remains unclear.
HIF-1a is expressed at higher levels in degenerating cartilage than in intact cartilage. Under normal conditions, HIF-1a protein undergoes rapid degradation in proteasomes. 36 In hypoxemic conditions, HIF-1a expression is increased and acts cartilage protective. 37 We found that metformin caused a decrease in HIF-1a expression under normoxic conditions. This might be an indirect sign of lower inflammation and ROS levels and less oxygen consumption. However, it remains unclear how metformin affects HIF-1a expression under hypoxia when HIF-1a does not undergo rapid degradation. This is in agreement with studies that found reduced HIF-1a levels in various cancer types after treatment with metformin.38-40
Finally, IL4 exerts anti-inflammatory effects via reduction of inflammatory cytokines and cytokines. 41 In our study, metformin reduced IL4 expression. This confirms studies showing that metformin can reduce IL4 expression in cancer cells. 42 Likewise, in nondiabetic heart failure patients treated with metformin, IL4 plasma levels were significantly reduced. 43 This might be another indirect sign of lower inflammation level and thus lower IL4 expression caused by metformin.
Our results showed a significant negative correlation of CRP levels and ΔCt values of MMP1 in multivariable regression analysis, indicating increased MMP1 expression in patients with higher CRP values. This is supported by a study showing increased MMP1 expression in endothelial cells after incubation with CRP. 44 At the same time, a systematic review found significantly increased CRP levels in patients with OA. 45 This again highlights the role of inflammation in OA.
Looking at the association of limb alignment on matrix gene expression, we found that patients with a varus or valgus malalignment had significantly reduced SOX9 gene expression. In animal models of induced OA, there was an increase in subchondral bone thickness, decrease in aggrecan content and increase in MMP3 expression.46-48 SOX9 plays an important role in cartilage formation and chondrocyte hypertrophy and a study showed a reduction of SOX9 expression in arthritic chondrocytes.32,49 The authors of that study concluded that the reason for this reduction can only be speculated upon and might be caused by an imbalance in SOX9 signaling pathways. As SOX9 is a potent inhibitor of hypertrophic differentiation, this might eventually lead to increased subchondral bone. We found that patients with a strong varus or valgus malalignment had a reduced SOX9 expression compared to patients with no or little malalignment in this end-stage OA population. It is possible that this observed association is at least partly due to a more severely damaged cartilage in patients with a high HKAA.
We also found that patients taking proton pump inhibitors had a reduced expression of SOX9. A similar effect was found in esophageal cells where PPIs downregulated SOX9 expression and thereby slowed progression of Barrett’s esophagus. 50 It is known that proton pump inhibitors change bone metabolism, especially in the elderly. 51 The effect of proton pump inhibitors on cartilage, however, remains unclear. Our results are suggestive of a potentially negative effect. However, we cannot exclude confounding effects.
This study has several limitations: First, it was conducted using an exploratory study design, no sample size calculation was performed and only a small sample size was analyzed. This is at least partly counterbalanced by the significant findings. Significant results in underpowered studies overestimate the effect size, however. 52 While further research is necessary to confirm our findings, we hope that this study can serve to generate new hypotheses and facilitate future research, considering the potential role of metformin in disease prevention. Similarly, the results of the cell viability assay have to be interpreted with caution due to the small sample size. Second, only female patients were included and results might be different in male patients. Third, the concentration of metformin used in our experiments was 20 to 30 times higher than physiologic steady-state plasma concentrations after oral intake. Thus, the findings in this study cannot be applied readily in clinical practice. Fourth, cells were stimulated for 48 hours only and thus long-term effects were not assessed. Fifth, cells were harvested for RNA extraction only after 2 cell passages. While prolonged cell culture of chondrocytes certainly induces cell dedifferentiation, this is a cumulative and linear process from hyaline cartilage toward fibrocartilage.53,54 In clinical studies, passage 2 chondrocytes haven been used successfully to treat osteochondritis dissecans. 54 In order to stimulate cells with metformin and obtain enough cell material for further analysis, it was necessary to use chondrocytes of passage 2. Sixth, 3 patients included in this study suffered from diabetes. High glucose levels are known to alter gene expression. 55 These 3 patients were managed optimally with regard to diabetes, however, and thus any altered effects of diabetes on gene expression seem minimal or very unlikely. Finally, cartilage was collected from random sites intraoperatively, and there might be a site specific gene expression pattern in cartilage.
To summarize, this study is the first to investigate the effects of BMI and metformin on certain important cartilage matrix genes in primary human chondrocytes. We found that BMI is associated with a destructive effect linked to an increased expression of ADAMTS5. On the other hand, metformin stimulation can reduce expression of catabolic genes ADAMTS5 and MMP1. Thus, it might play a role in prevention of OA in obese patients. Limb malalignment was also linked to a reduction in the expression of SOX9. Likewise, intake of proton pump inhibitors was associated with a reduced SOX9 expression. This might be suggestive of destructive process. Higher CRP levels were associated with increased MMP1 expression, highlighting the role of systemic inflammation.
Footnotes
Author Contributions
Conception and design: BL, BSF, PSc, NS, MS, PSa. Analysis and interpretation of the data: PSc, NS, BL, MS, BSF, DG. Drafting of the article: PSc. Critical review of the article: BL, NS, BSF, AL, PSa. Provision of study materials or patients: AL, PSa. Statistical expertise: PSc. Collection and assembly of data: PSc, BL, NS, MS, DG, BSF. Administrative, technical, or logistic support: BL, NS, DG, BSF.
Acknowledgments and Funding
We would like to thank Mag. Gerold Schwantzer, Institute for Medical Informatics, Statistics and Documentation, Medical University of Graz, for his competent and dedicated consultations. The author(s) received no financial support for the research, authorship, and/or publication of this article.
Declaration of Conflicting Interests
The author(s) declared the following potential conflicts of interest with respect to the research, authorship, and/or publication of this article: AL reported grants by Johnson & Johnson, Alphamed, Globus, and Implantec. MS reported financial support by Eli Lilly, Pfizer, Bristol Mayer Squibb, Takeda, AbbVie, Novartis, Roche, MSD, CSL Behring, UCB. BL, BSF, DG, NS, PSa, and PSc reported no conflict of interest.
Ethical Approval
The procedures followed were in accordance with the ethical standards of the responsible committee (Ethics Committee of the Medical University of Graz, Austria, IRB #31-133) on human experimentation (institutional and national) and with the Helsinki Declaration of 1975, as revised in 2000.
Informed Consent
Written informed consent was obtained from all patients before the study.
Trial Registration
Not applicable.