
Abstract
Objective
The primary aim of this study was to evaluate the exact location distribution in patients with osteochondral lesions of the talus (OLTs) using a 9-grid scheme. The secondary aim is to match lesion location to lesion size, arthroscopic or open operation, and trauma occurrence.
Methods
A systematic review was performed in the databases PubMed, EMBASE, and Cochrane. Search terms consisted of “talus” and “osteochondral lesion.” Two independent reviewers evaluated search results and conducted the quality assessment using the Methodological Index for Non-Randomized Studies (MINORS). Primary outcome measure was OLT location in the 9 zone-grid. Secondary outcome measures were OLT size in 9-zones, preoperative radiological modality use, demographic lesion size variables as well as open or arthroscopic treatment.
Results
Fifty-one articles with 2,087 OLTs were included. Heterogeneity concerning methodological nature was observed and methodological quality was low. The posteromedial (28%) and centromedial (31%) zones combined as one location was the location with the highest incidence of OLTs with a rate of 59%. Individual OLT size was reported for only 153 lesions (7%). Preoperative combination of X-ray and magnetic resonance imaging (MRI), and/or computed tomography (CT) was reported in 20 studies (43%). Trauma was reported in 78% of patients. Furthermore, 67% was treated arthroscopically and 76% received primary OLT treatment.
Conclusion
The majority of OLTs are located in the posteromedial and centromedial zone, while the largest OLTs were reported in the centrocentral zone. Further research is required to identify the prognostic impact of location occurrence on the outcomes following OLT treatment.
Introduction
Osteochondral lesions of the talus (OLTs) are lesions involving the articular cartilage of the talus and associated subchondral bone. Until 2007, location distribution was mainly reported in a medial, central, or lateral manner. Berndt and Harty 1 reported the location of 201 OLTs of which 56% were medial and 44% were lateral. 1 In 2007, Raikin et al. 2 developed a 9-zone grid to systematically report OLT-location more precisely ( Fig. 1 ). Since then, multiple studies have reported conflicting results with regard to the location of OLTs according to this 9-zone grid.2,3 However, the majority of the most recent studies that reported OLTs according to the 9-zone grid had relatively small retrospective patient populations. Since then, a small number of studies have been carried out on the location of OLTs according to this 9-zone grid. The literature suggests that there may be a correlation between location and clinical outcomes.4,5 Despite the possible prognostic significance of location distribution on this topic, no extensive systematic review has been carried out to provide a clear overview of a pooled location distribution of OLTs in a 9-zone grid for a large number of patients. Moreover, until now no study has shown a relationship between OLT-size and the 9-zone grid. Therefore, the research question of the present systematic review is to report OLT the location and size in the 9-zone grid.
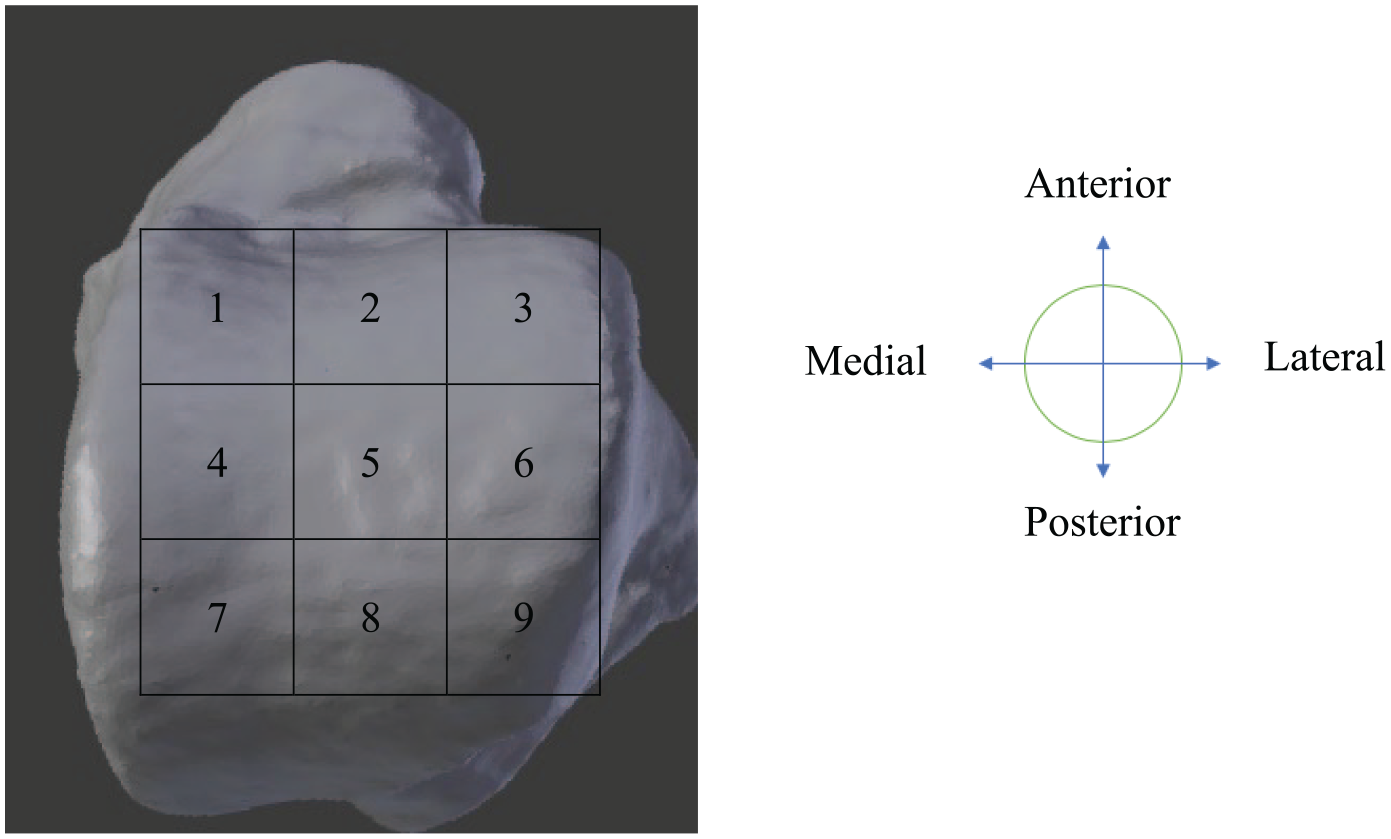
Nine-zone grid.
The primary aim of the present systematic review is to provide an overview of the location distribution of OLTs according to the 9-zone grid. The secondary aim is to match lesion location to lesion size, arthroscopic or open operation, and trauma occurrence.
Materials and Methods
The systematic review was prospectively registered at the PROSPERO register with number CRD42018081120. 6 The methodology of the Preferred Reporting Items for Systematic Reviews and Meta-Analyses (PRISMA) was followed. 7
Search Strategy
Articles were identified by computerized searches in PubMed, EMBASE, and Cochrane Library databases from inception up to April 2020. The full search strategy is outlined in Appendix 1 in the Supplementary Material.
Study Selection and Eligibility Criteria
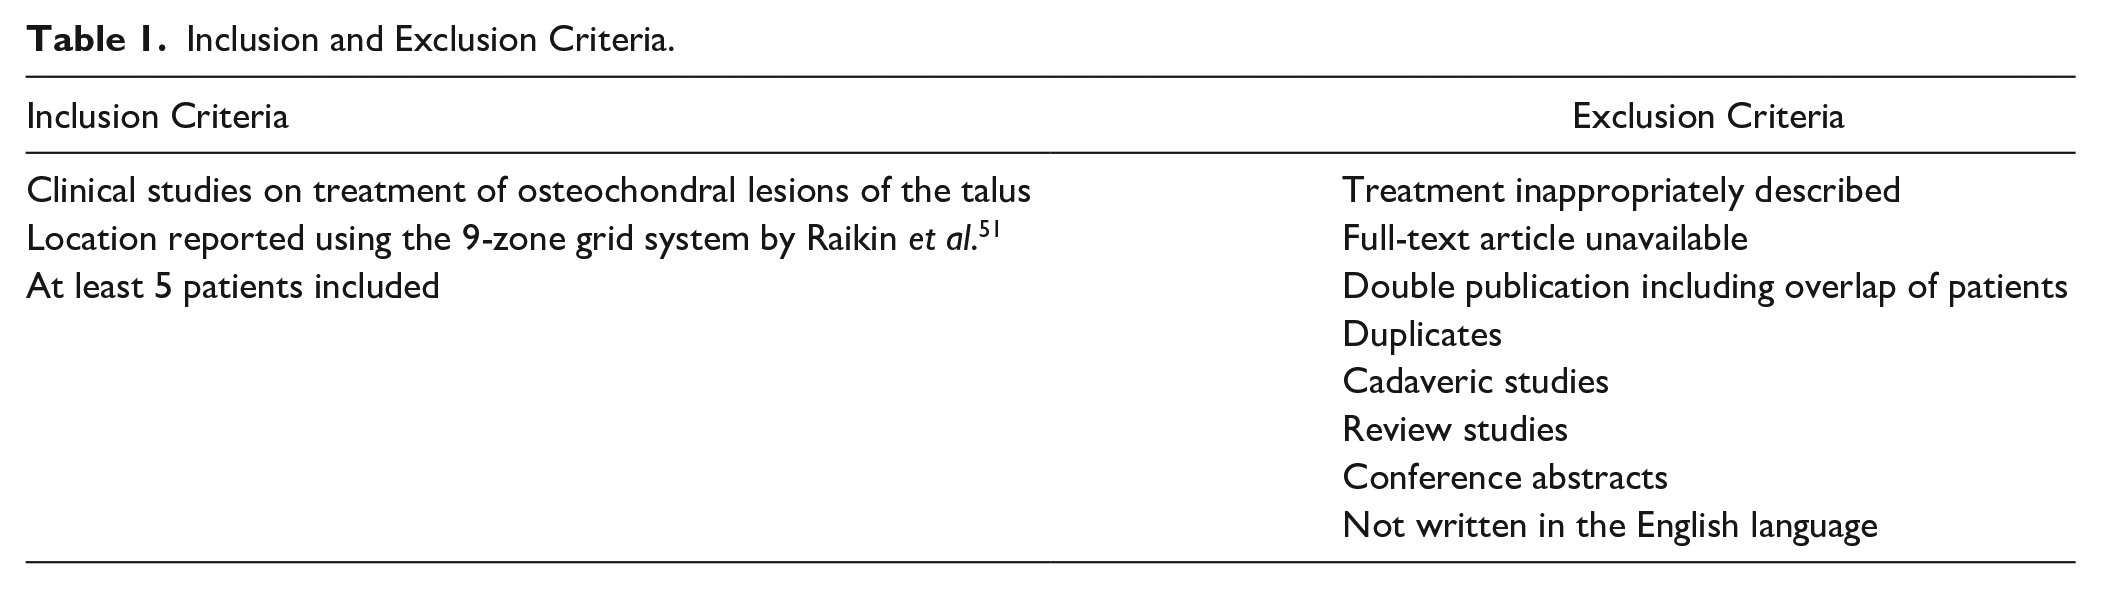
Two independent reviewers (PD and JD) independently screened all the identified articles that were obtained through the electronic search on title and abstract using Rayyan. 8 Hereafter, the full texts of all of the potentially relevant articles were assessed. Agreement between the 2 reviewers was required for inclusion. When agreement was unable to be achieved through discussion, a third independent reviewer (GK) was consulted and was decisive. Inclusion and exclusion criteria are outlined in Table 1 . In the case of double publications including an overlap of patients, the article with the largest number of patients was included.
Inclusion and Exclusion Criteria.
Data Extraction
Data of the included studies were extracted using Microsoft Excel (version 2020, macOS CATALINA). Standard study baseline characteristics were retrieved as well as the following patient characteristics: number of patients, sex, number of lesions, number of ankles, and average age at the time of operation. The location of the OLT was the primary outcome measure which was defined as the percentage of lesions per location of the 9-zone grid described by Raikin et al. 2 (Appendix 2 in the Supplementary Material). The following secondary outcome measures were collected: number of lesions for primary or secondary treatment, arthroscopic or open operation, reporting of trauma versus not reporting trauma, and the type of pre-operative radiological modality that was used to evaluate the OLTs. The OLT size was extracted if it was specified to at least a single zone in the 9-zone grid and was collected in area of the lesion (mm2). If the lesion was located in more than one zone in the 9-zone grid system, it was proportionately divided between the zones.
Methodological Quality Assessment
The methodological quality of studies was measured using the Methodological Index for Non-Randomized Studies (MINORS) tool and scored by 2 independent reviewers (PD and JD). 9 The MINORS tool consists of 8 or 12 items for noncomparative or comparative nonrandomized studies, respectively. Maximum scores are 16 for noncomparative nonrandomized studies and 24 for comparative nonrandomized studies. Each item was given a score in the scale of 0 to 2. An item was scored with a “0” if the item was not reported, a “1” if the item was inadequately reported, and a “2” if the item was adequately reported. After independent evaluation, all disagreements were solved through discussion between the 2 independent reviewers. When agreement was unable to be achieved through discussion, a third independent reviewer (GK) was consulted and was decisive.
Data Analysis
The extracted data was systematically analysed in a Microsoft Excel sheet (version 2020, macOS CATALINA). In the first phase, baseline study characteristics, the total number of included articles, number of patients, sex, the number of lesions, and number of ankles were counted. In the case of categorical data, frequencies and percentages were calculated. In the case of continuous data, weighted averages were calculated with the associated ranges of these averages. In the case of sufficient data, figures with a proportionally colored scheme were made of the primary and secondary outcome measures in order to visualize the incidence of the lesion to a specific zone ( Fig. 1 ). For the primary outcome, a confidence interval for a proportion per location was determined according to Newcombe et al. 10 When individual patient data for OLT size was reported for more than 10% of the included lesions, a statistical Student t test was performed.
Results
Search Results, Screening, and Selection of Studies
The literature search yielded 2,002 articles. After title and abstract screening, 1,339 articles were excluded based on the in- and exclusion criteria ( Fig. 2 ). A total of 663 studies remained for full text screening of which 612 articles were excluded. Reasons for exclusion are summarized in Table 2 . After full-text screening, 51 studies were included.2,11-60 There was an overall consensus in all cases of article selection between the first 2 authors.
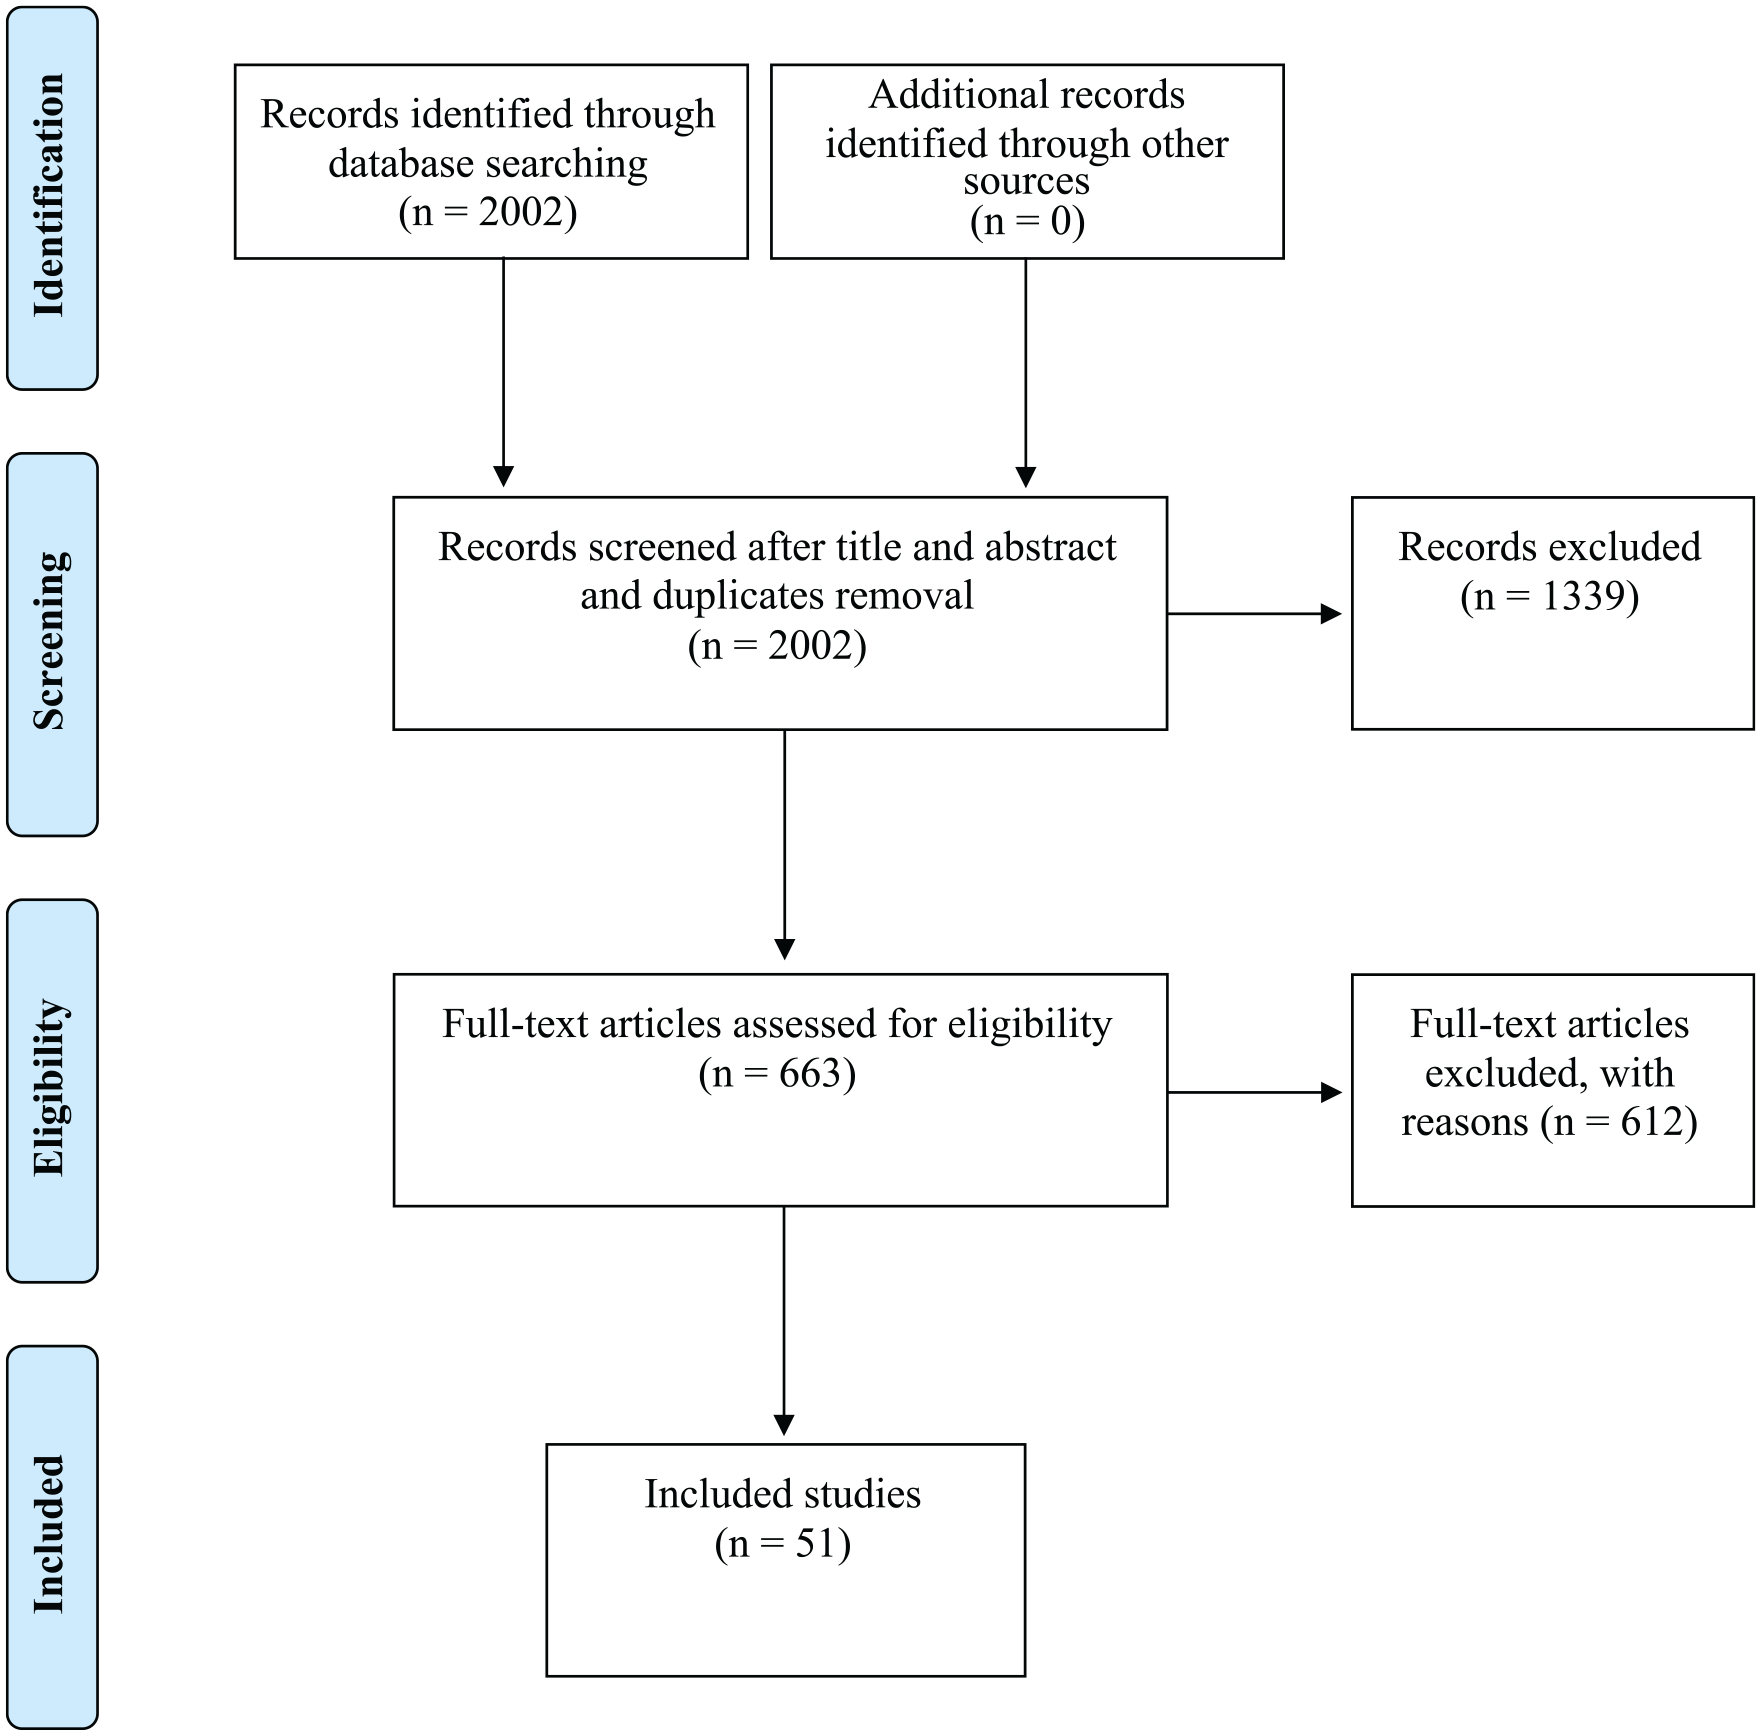
Selection of studies.
Reasons for Exclusion of Full-Text Articles.
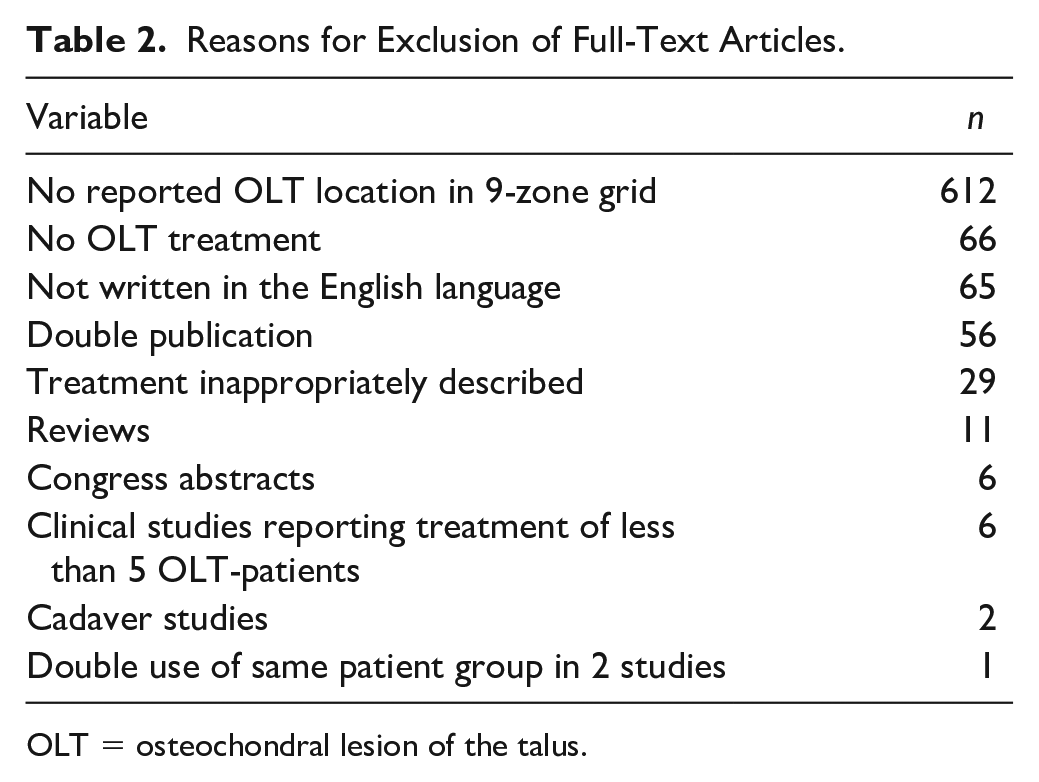
OLT = osteochondral lesion of the talus.
Evaluation of characteristics of included studies
The 51 included studies reported a total of 2,087 lesions in 2,054 patients in 2066 ankles. The average age of the included patients was 37 (range, 13-55) years. Furthermore, there were 1,212 (59%) male patients and 842 (41%) female patients. The average preoperative lesion size was 86 (range, 44-250) mm2. Preoperative modality use was reported in 47 studies and consisted of either a combination of X-ray and magnetic resonance imaging (MRI) or computed tomography (CT) in 20 studies (43%). Other combinations included X-ray, MRI, scintigraphy, and arthroscopy in 1 study (2%) as well as the combination of MRI and arthroscopy in 2 studies (4%). Detailed patient demographics and preoperative modality use are reported in Table 3 .
Patient Demographics and Preoperative Modality Use.
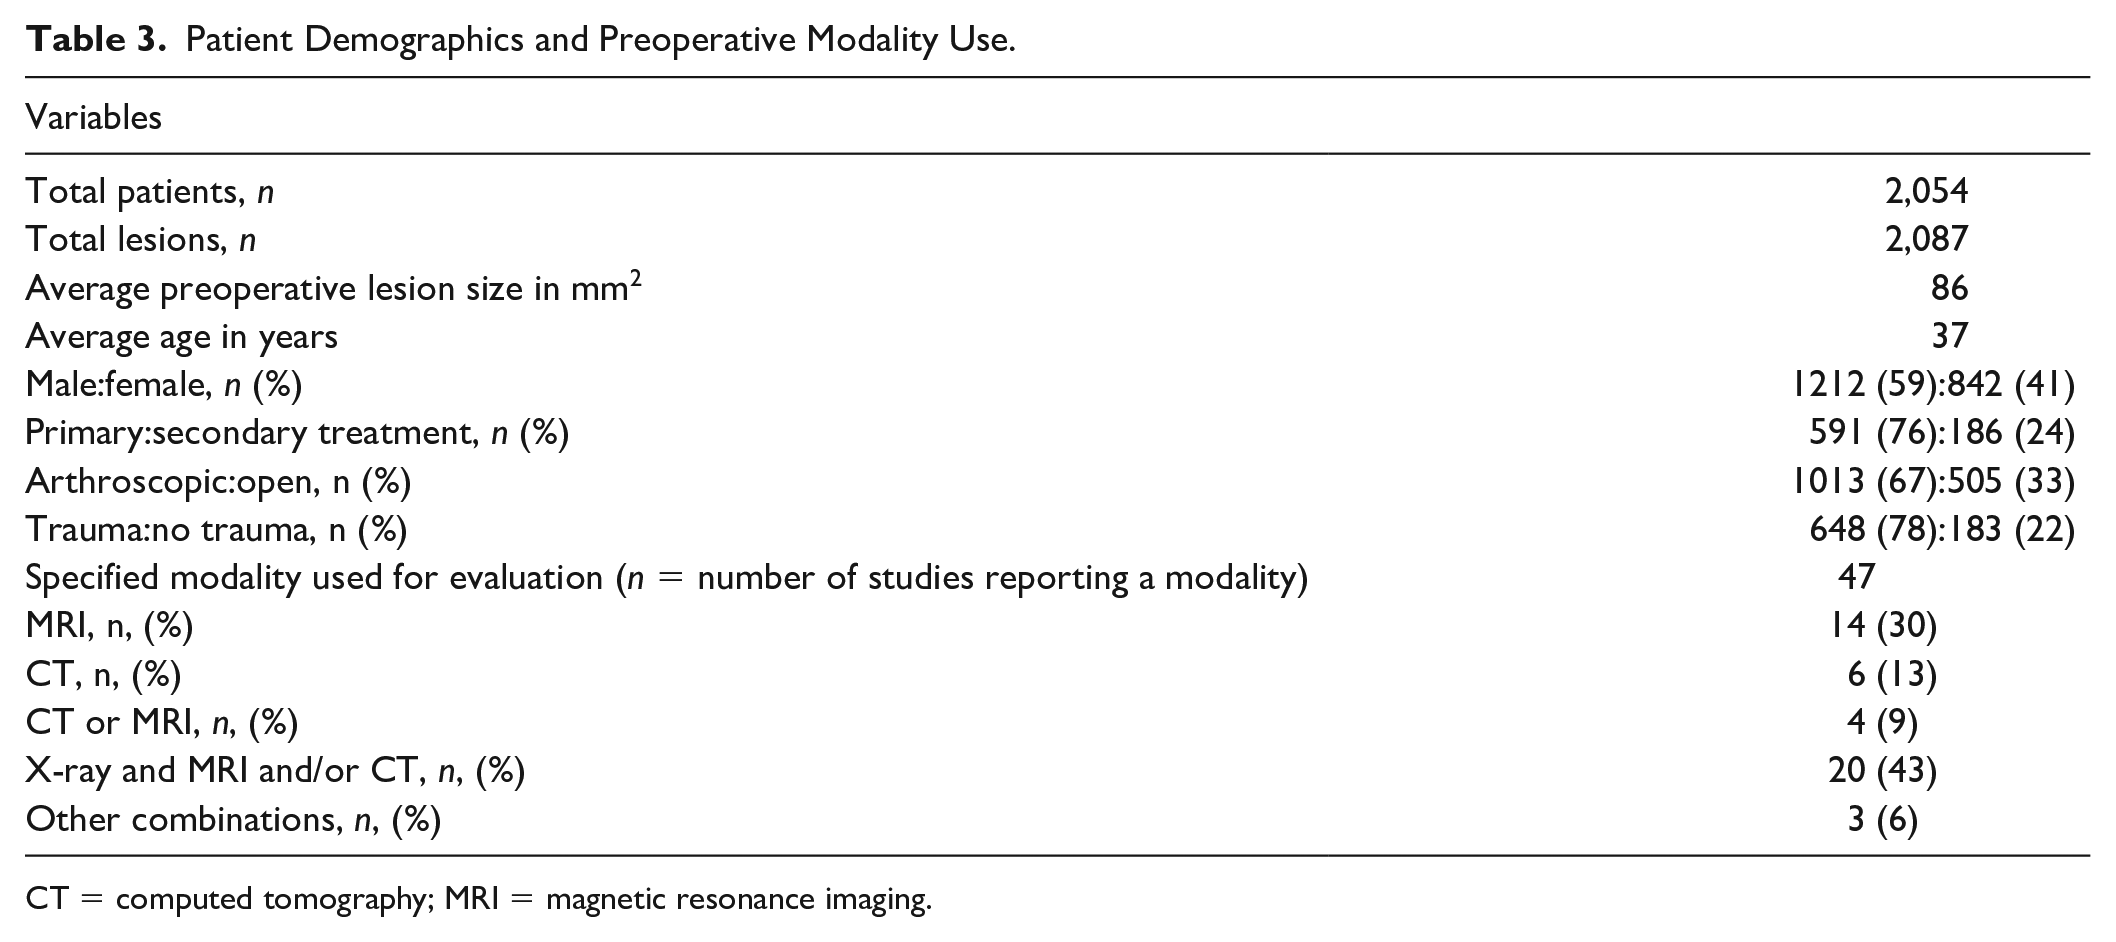
CT = computed tomography; MRI = magnetic resonance imaging.
Methodological Quality
The MINORS tool was used for the included studies, and full consensus was reached between the reviewers regarding the grading of methodological quality. Eight comparative studies and 43 non-comparative studies were scored. Comparative studies had an average score of 19.6 points (range, 16-22) with a maximum score of 24 points. The 43 noncomparative studies scored an average score of 12.6 points (range 9-14) with a maximum of 16 points. Detailed MINORS scores are reported in Appendix 3 in the Supplementary Material.
Location and Size Reporting
Seventy-three percent of the lesions were located on the medial part of the talus. Twenty-eight percent of the lesions were located in the posteromedial and 31% in centromedial zone. Individual patient data of the size per 9-grid location was reported for 153 lesions (7% of total). The before-mentioned information was retrieved from 10 (20%) of the included studies. For the primary outcome (location) a confidence interval was determined per location and is visualised in Figure 3 . Lesions were significantly more present in location 4 (centromedial, 31.2%, 95% CI 29.3-33.3) and location 7 (posteromedial, 28.2%, 95% CI 26.3-30.2) in comparison with the other locations in the grid. For the secondary outcome (size) a Student t test was not performed due to the fact that individual patient OLT size data were insufficiently reported (7%-10%). A detailed distribution of location and size is shown in Table 4 and visually clarified in Figures 4 and 5 .
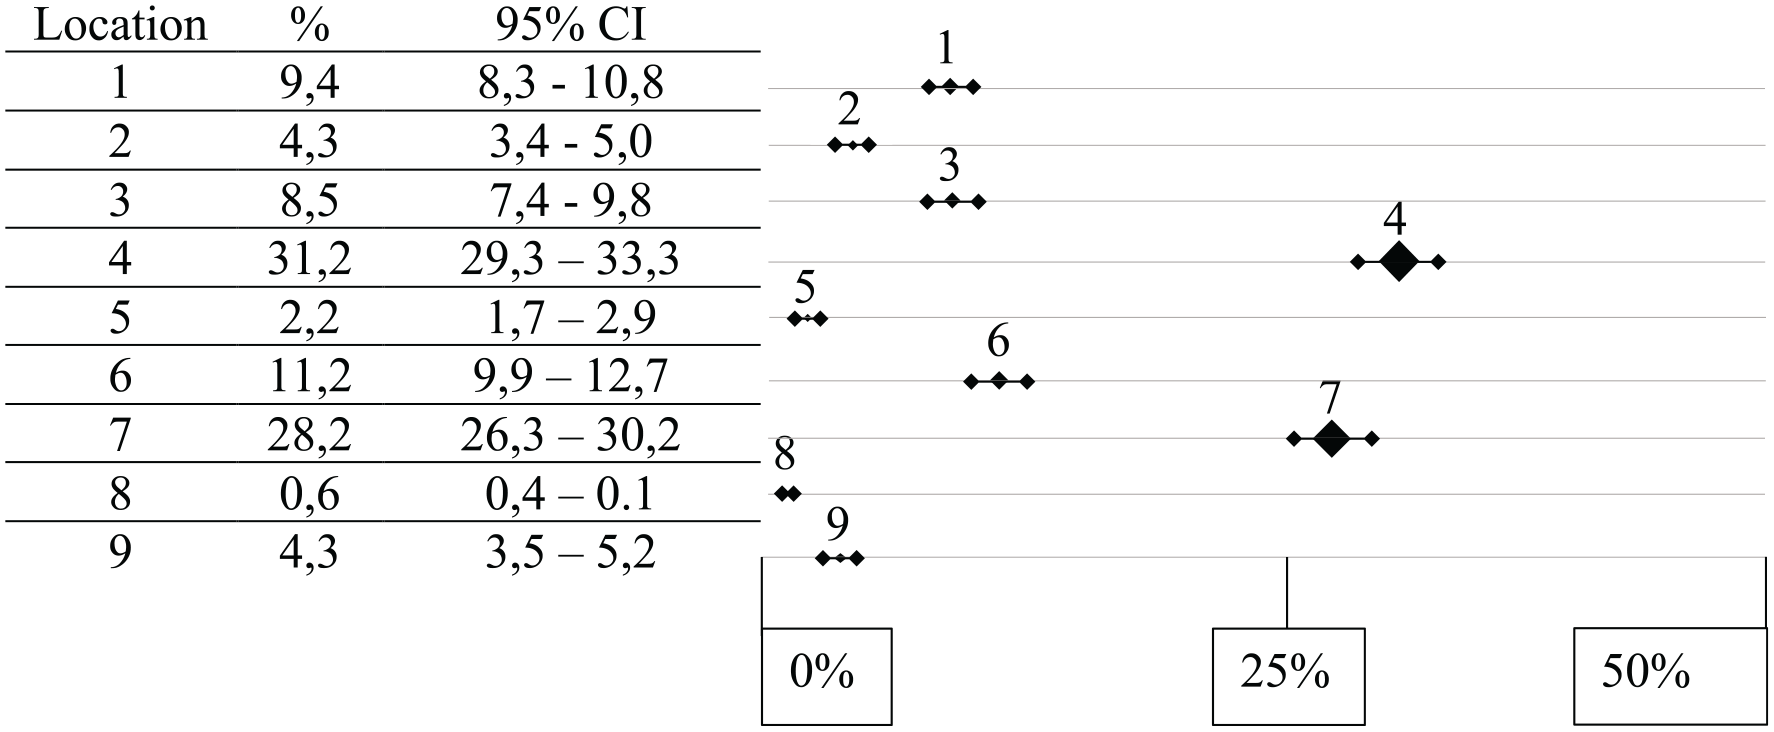
Ninety-five percent confidence interval per location.
Incidence of Location and Size.
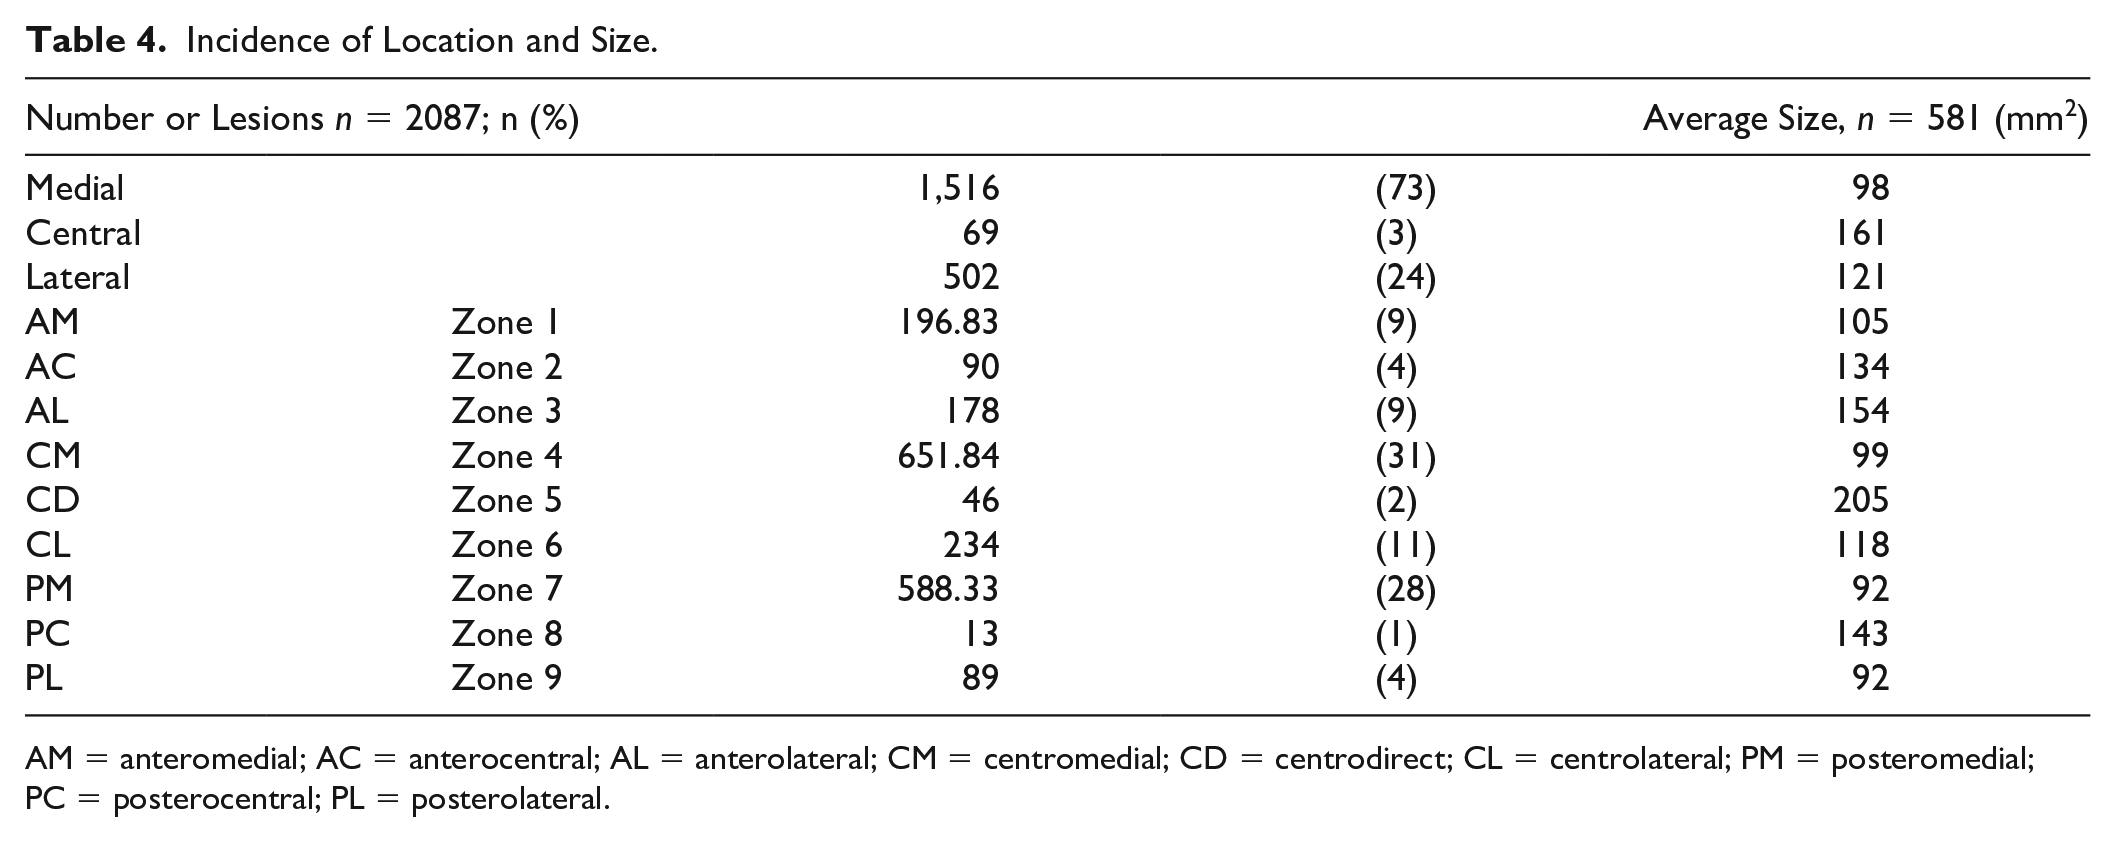
AM = anteromedial; AC = anterocentral; AL = anterolateral; CM = centromedial; CD = centrodirect; CL = centrolateral; PM = posteromedial; PC = posterocentral; PL = posterolateral.
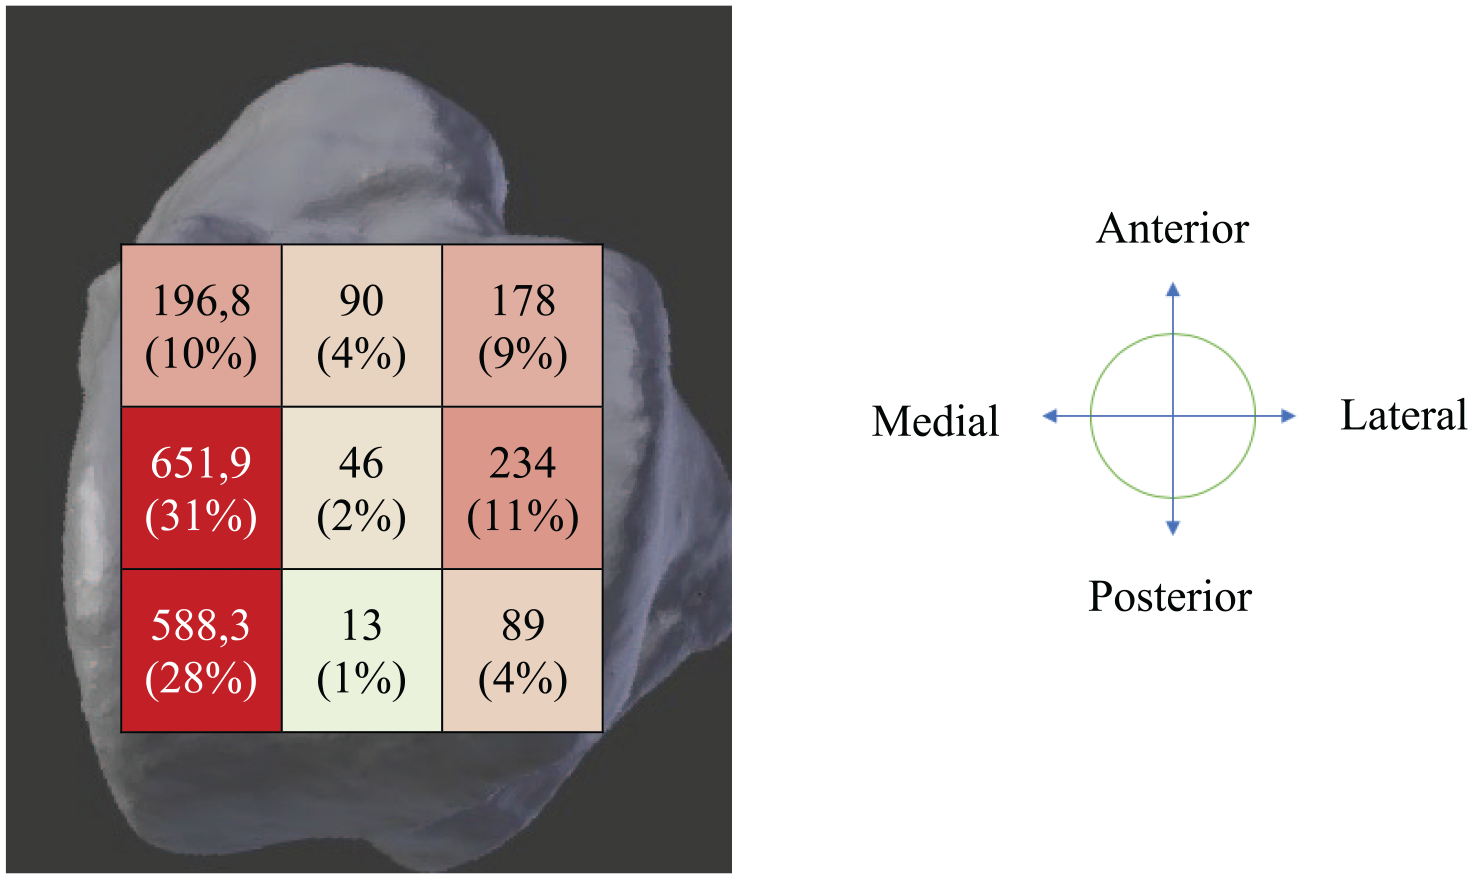
Location of lesion reported (n = 2087).
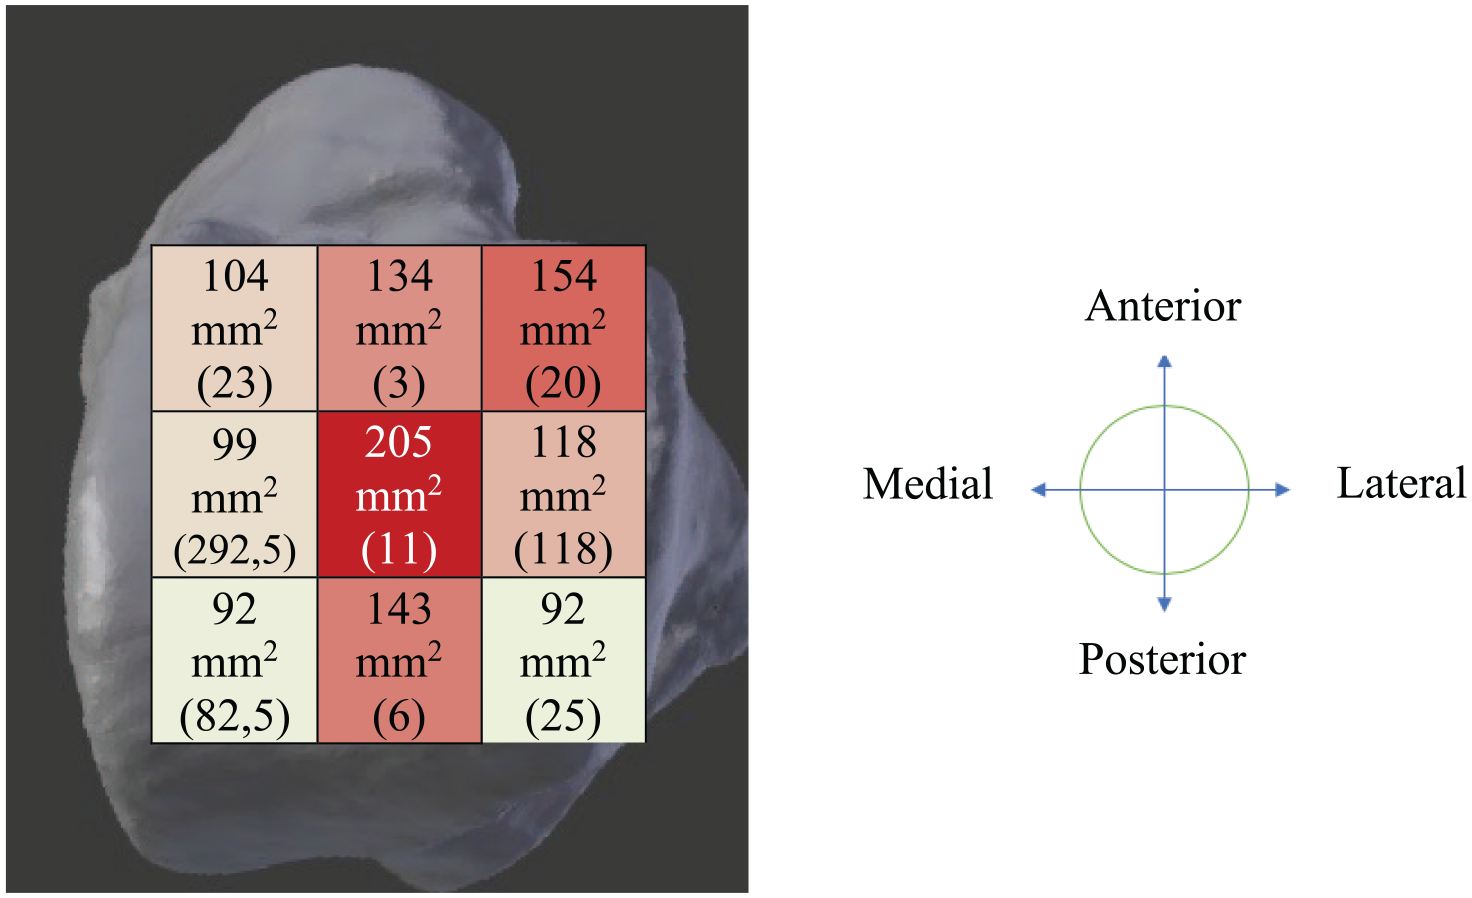
Average size per location reported (n = 581).
Discussion
The most important finding of the present systematic review was that the posteromedial and centromedial zones were the most frequently affected location zones with the highest occurrence of OLTs, with an incidence rate of 28% and 31%, respectively. This review is the first to report OLT locations in a large number of patients in a systematic and standardized manner. The primary aim of the present systematic review was to analyse lesion location distribution of osteochondral lesions in the talus making use of the 9-grid scheme developed by Raikin et al. 2 The secondary aim was to match lesion location to lesion size, arthroscopic or open operation, and trauma occurrence.
In 2007, the author group led by Raikin 2 was the first to introduce the 9-zone grid as a novel way of reporting the location of OLTs. In this study, 428 OLTs were described and Raikin et al. 2 reported the OLTs to be dispersed over the talus with the following distribution pattern: 62.9% medial lesions, 3.7% central lesions, and 33.4% lateral lesions. A similar incidence distribution pattern was found by Dahmen et al. 61 who reported that 77%, 2%, and 21% of the lesions were medially, centrally, and laterally located, respectively. The aforementioned findings are in line with the present review, which found that 73%, 3%, and 24% of the lesions were located medially, centrally, and laterally, respectively. Despite the similarities in reporting incidence concerning the medial, central, and lateral talar dome, the incidence of the location distribution of OLTs had not yet been studied in a systematic manner in 9 zones in other studies. Raikin et al. 2 reported the highest incidence in the centromedial (53%) and centrolateral (26%) zone within 428 OLTs. This is partially in line with the findings of this review in which a relatively high OLT incidence was found in centromedial zone (31%). When combining the incidence rates of the centromedial and posteromedial zone in the study by Raikin et al., 2 it becomes clear that 60% of the patients have an osteochondral lesion in either one of these zones. Again, this finding is very similar to that of the present study in which the large majority of the OLTs were found in the combined posteromedial and centromedial zones (59%). Therefore, it can be concluded that the centro-posteromedial zone may be regarded as one of the most frequently affected locations of osteochondral lesions on the talar dome.
This finding is of clinical importance when clarifying the etiological process of OLTs due to the fact that anatomical risk factors may play a role in their development. Nakasa et al. 62 reported that the deep layer of the deltoid ligament could be a risk factor for (postero-)medial OLTs. In this study the attachment of the deltoid ligament was measured using MRI and compared between 40 normal ankles and 40 ankles with a medial OLT. In the OLT group, the attachment of the deltoid ligament was significantly broader and more proximally located in comparison with the normal ankle control group. Certain anatomical differences like the deltoid ligament in OLT-patients could, therefore, be a risk factor for OLT development in the (postero-)medial zone and could subsequently be an explanation of the higher incidence of posteromedial OLTs relative to the other locations.
Besides anatomical risk factors, other theories for the emergence of OLTs have been indicated, namely, trauma, symptomatic microtraumas and ischemia. 63 Previously, Dahmen et al. 61 showed that 71% of the patients with an OLT reported a history of ankle trauma. This finding is in agreement with the present review, as 78% of patients reported a history of trauma and 73% of these lesions were located in the medial zones of the talar dome. It is widely accepted that an ankle trauma is the major causative reason for the development of an osteochondral lesion of the ankle. Traumatic events are regarded as the predominant cause of these lesions, as previous research has shown that osteochondral lesions occur in up to 70% of ankle sprains and acute fractures. 64 Therefore, an ankle trauma followed by frequent and structural high load of the ankle joint is believed to be the culprit of the cartilage damage that can potentially result in a cascade of events ranging from an OLT, to posttraumatic ankle osteo-arthritis (PTOA) and, lastly, to end-stage osteo-arthritis of the ankle.63,65 Blom et al. 66 showed that after a single high-load axial impact biomechanical joint changes were observed without any visible cartilaginous damage on a contrast-enhanced micro-CT in a caprine tibiotalar model joint. This implies that with the knowledge of the present research on location occurrence of OLTs, one should aim towards both the prevention of OLTs in patients at risk of undergoing cartilage damage as well as the detection of cartilaginous damage at an early stage. 62 Novel concepts of imaging strategies in the form of an innovative in-office needle arthroscopy may aid in this process as it could improve the visualization of early cartilage damage whilst simultaneously, as well as instantly, performing a preventative treatment.67,68 Our research, therefore, functions as a stepping stone to the more accurate estimation of prognosis as well as towards the development of a novel preventive treatment option, hereby clearly demonstrating the clinical relevance of our research outcomes.
The present systematic review has elucidated underreporting of OLT-size in the 9-zone grid. Of the retrieved 663 full-text articles, 612 studies (92%) had to be excluded due to inadequate location reporting in the 9-zone grid. Consequently, in only 581 (28%) of the included 2087 OLTs size was able to be linked to a location in the 9-zone grid. It must be stated that this is a peculiar finding, as over the past decades multiple studies have indicated that OLT size is one of the major prognostic factors in cartilage repair of the ankle.5,57,69-71 The finding that is presented in this review stating that the lesions were largest in the centrocentral zone must be interpreted with caution as, firstly, it is based on a low power and, secondly, it is not based on formal statistical comparisons that analyse OLT size within the different zones. Therefore, prospective studies including a larger number of patients and more treatment options are of utmost clinical importance in order to determine a more accurate and precise effect of size on clinical, radiological, and sports outcomes.
This review has several strengths and limitations. A limitation of our study was that for solely 581 (28%) of the included OLTs size could be correlated to a location in the 9-zone grid and for only 153 (7%) of these lesions individual patient OLT-size data were reported. Due to this underreporting, we were unable to compare individual location sizes within the 9-zone grid with the Student t test.13,16,21,35,36,43,45,52,58,72 This can be considered a limitation of the review. Future research must focus on including the individual patient OLT-size, in order for a powerful statistical analysis on OLT-size per location to be possible. A second limitation of this study is that the included studies were of low methodological quality as the majority of the studies were of retrospective nature. Therefore, larger clinical prospective studies with longer follow-up times are essential in order to draw firm conclusions on the prognostic value of the location of an OLT with regards to clinical, radiological and sports outcomes. A major strength of this review is the large group of patients that were included with associated OLTs (2,087) with a reported location in the 9-zone grid. Another strength is that this review was executed in a systematic manner, adhering to the PRISMA guidelines. 7 Lastly, the reference selection and quality assessment of the included studies was carried out in an extensive and thorough manner.
Conclusion
The majority of OLTs are located in the posteromedial and centromedial zone, whilst the largest OLTs were reported in the centrocentral zone. Further research is required to identify the prognostic impact of location occurrence on the outcomes following OLT treatment.
Supplemental Material
Appendix_1 – Supplemental material for Location Distribution of 2,087 Osteochondral Lesions of the Talus
Supplemental material, Appendix_1 for Location Distribution of 2,087 Osteochondral Lesions of the Talus by Pascal R. van Diepen, Jari Dahmen, J. Nienke Altink, Sjoerd A.S. Stufkens and Gino M.M.J. Kerkhoffs in CARTILAGE
Supplemental Material
Appendix_2 – Supplemental material for Location Distribution of 2,087 Osteochondral Lesions of the Talus
Supplemental material, Appendix_2 for Location Distribution of 2,087 Osteochondral Lesions of the Talus by Pascal R. van Diepen, Jari Dahmen, J. Nienke Altink, Sjoerd A.S. Stufkens and Gino M.M.J. Kerkhoffs in CARTILAGE
Supplemental Material
Appendix_3 – Supplemental material for Location Distribution of 2,087 Osteochondral Lesions of the Talus
Supplemental material, Appendix_3 for Location Distribution of 2,087 Osteochondral Lesions of the Talus by Pascal R. van Diepen, Jari Dahmen, J. Nienke Altink, Sjoerd A.S. Stufkens and Gino M.M.J. Kerkhoffs in CARTILAGE
Footnotes
Author Contributions
The conception and design of the study: PD, JD
Acquisition of data: PD, JD, GK
Analysis and interpretation of data: PD, JD, JA, SS, GK
Drafting the article: PD, JD
revising it critically for important intellectual content: PD, JD, JA, SS, GK
Final approval of the version submitted: PD, JD, JA, SS, GK
Acknowledgments and Funding
We thank F.S. van Etten for additional help with the search. The authors would like to thank J.P.M. van Oosterhout for proofreading and correction of the manuscript. The author(s) received no financial support for the research, authorship, and/or publication of this article.
Declaration of Conflicting Interests
The author(s) declared no potential conflicts of interest with respect to the research, authorship, and/or publication of this article.
References
Supplementary Material
Please find the following supplemental material available below.
For Open Access articles published under a Creative Commons License, all supplemental material carries the same license as the article it is associated with.
For non-Open Access articles published, all supplemental material carries a non-exclusive license, and permission requests for re-use of supplemental material or any part of supplemental material shall be sent directly to the copyright owner as specified in the copyright notice associated with the article.