
Abstract
This study addressed difficulties in evaluating osteoarthritis (OA) progression in species with thin cartilage. Feasibility of using short, nonequilibrium contrast-enhanced micro–computed tomography (CE-μCT) to evaluate the physical and biochemical properties of cartilage was investigated. A preliminary in vitro study using CE-μCT study was performed using bovine osteochondral blocks with intact, mildly damaged (fibrillated), or severely damaged (delaminated) cartilage. Delamination of the superficial zone resulted in elevated apparent density compared with intact cartilage after 10 minutes of anionic contrast exposure (P < 0.01). OA was induced by unilateral meniscal destabilization in n = 20 sheep divided into: early phase OA (n = 9) and late phase OA (n = 11), while n = 4 remained as naive controls. In vivo anionic nonequilibrium contrast CT of the operated stifle was conducted in the early phase sheep 13 weeks postoperatively using clinical resolution CT. Cartilage visibility in the contrasted leg was significantly improved compared with the noncontrasted contralateral stifle (P < 0.05). Animals were sacrificed at 3 months (early phase) or 12 months (late phase) for additional ex vivo CE-μCT, and correlative tests with biochemical and histological measures. Concentration of sulfated glycosaminoglycan (sGAG) significantly varied between control, early, and late phase OA (P < 0.005) and showed a negative (r = −0.56) relationship with apparent density in the medial tibial plateau (R2 = 0.28, P < 0.001). Histologically, parameters in proteoglycan and cartilage surface structure correlated with increasing attenuation. While previous studies have shown that CE-CT increases the apparent density of proteoglycan-depleted cartilage, we concluded that superficial zone disruption also contributes to this phenomenon.
Keywords
Introduction
Establishing validated imaging techniques for staging osteoarthritis (OA) is a pressing issue. Quantitative magnetic resonance imaging has been the focus of large multicenter human OA studies, 1 but simpler, more cost-effective methods would be useful in preclinical studies and veterinary medicine. Both human and veterinary clinical trials of disease modifying treatments need to stratify incoming patients or animals, and accurately follow their disease progression or improvement. Contrast-enhanced computed tomography (CE-CT) imaging is fast, inexpensive, and feasible in most human and veterinary hospitals but has the disadvantage of exposing patients to ionizing radiation, and contrast media to a lesser degree. In many animal species, thin cartilage makes quantitative magnetic resonance imaging techniques, such as T2-mapping and T1rho, challenging. A practical CE-CT method for identifying cartilage fibrillation and thinning would be welcomed.
The physiological basis for equilibrium partitioning of iodinated contrast CT (EPIC-CT) was initially developed in rodents.2-4 Cartilage matrix proteoglycan concentration increases in a depth-dependent manner. Electrostatic interaction between anionic contrast agents and negatively charged
Delayed-gadolinium enhanced magnetic resonance imaging (dGEMRIC) uses a similar principle as anionic CE media; however, it instead uses gadopentetate-diethylenetriamine penta-acetic acid (Gd-DTPA2−). After IV or IA administration, Gd-DTPA accumulates in areas of depleted sGAG and reduces T1-relaxation time as a result. 13 Studies investigating the practicality of dGEMRIC and CE-CT suggest that both techniques are sensitive to morphological change such as volume and thickness, and have been shown to agree with Osteoarthritis Research Society International (OARSI) histological and arthroscopic scores.14-17 Morphological measurements obtained using CT arthrography of canine elbows are sensitive enough to detect regional differences in thickness and surface area of cartilage and provide a useful diagnostic. 14
In the present study, an in vitro feasibility experiment was conducted to investigate the change in apparent density (HU [Hounsfield units]) of cartilage in intact and abraded osteochondral blocks after short minutes of exposure to anionic contrast media. It was hypothesized that destruction to the physical barrier of the superficial zone would facilitate contrast media uptake in nonequilibrium CE-CT. This was followed with an ex vivo correlative study in normal and osteoarthritis sheep using anionic CE-μCT, biochemical measurement of sGAG, and histology. We hypothesized that nonequilibrium exposure times would sufficiently alter apparent density of cartilage and would correlate with biochemical and physical changes between mild and advanced OA.
Materials and Methods
In Vitro CE-µCT of Osteochondral Blocks
Forty-one bovine osteochondral blocks were harvested from the patella, femoral condyles, and tibial plateau of 3- to 6-month old calves. Eleven blocks were left intact, a second group of 11 had the superficial cartilage zone removed with a vibratome, mimicking erosion or delamination. The third group of 11 blocks underwent multiple cuts orthogonal to the cartilage surface at 100-µm intervals through the superficial and middle zone simulating fibrillation. The sidewalls of the osteochondral blocks were coated in thin a layer of molding wax to allow the cartilage surface but not subchondral bone to be exposed to 60% iothalamate meglumine (Cysto-conray, Mallinckrodt Inc.) contrast medium for 10 minutes. A group of control blocks (n = 8) were immersed in lactated Ringer’s solution (LRS). All specimens were thoroughly rinsed with LRS to remove residual contrast and CE-μCT imaged in air to maximize image contrast. All imaging was performed on a GE Medical Systems Locus Explore μCT at 45-µm isotropic pixel resolution using an 18-minute protocol (80 kV, 450 mA, 2000 ms integration time).
In Vivo CE-CT of Osteoarthritic Cartilage
All procedures were approved by an institutional animal care committee operating under the guidelines of the National Council on Animal Care. A total of 24 adult (2- to 5-year old) female Texel cross sheep were used. Sheep were weighed and underwent a general physical examination and a more specific musculoskeletal health examination on arrival and were housed in large pens (6 × 10 m).
Sheep were allocated to groups based on equivalent distribution of body weights to control this variable. Twenty (n = 20) were divided into the groups representing early-phase OA (n = 9) and late-phase OA (n = 11), which then underwent unilateral arthroscopic medial meniscal release (MMR) 18 to induce OA. An additional 4 ewes remained as unoperated normal controls. After 13 weeks of meniscal insufficiency, the early-phase OA sheep were used to assess feasibility of CE-CT in visualizing cartilage at clinical resolution using short-term exposure to contrast media before image acquisition. Sheep were sedated using diazepam (0.3 mg/kg) and ketamine (5.0 mg/kg) and approximately 0.5 mL of synovial fluid was withdrawn from the both stifles for use in a separate osteoarthritis study. A syringe containing 6 mL of 60% iothalamate meglumine was injected intra-articularly into the right stifle only and the joint was flexed and extended 10 times. Ten minutes postinjection, animals were positioned in dorsal recumbency for CT imaging of both stifles. CT scans were performed using a 16-slice detector (GE Brightspeed, General Electric Healthcare, Milwaukee, WI), with the raw data acquired with a standardized protocol in helical mode, 1.0-second rotation time, 0.562:1 pitch, 120 kV and 250 mA, 25-cm collimation, 512 × 512 matrix size, 0.625 mm slice thickness. The datasets underwent reconstructions using both Bone Plus and Standard algorithms. Analysis of CT images was conducted using a 3D image and analysis software (GE Medical Systems MicroView software, Parallax Innovations, version 2.5.0). DICOM datasets were imported and analysis of apparent density (HU) of the cartilage was performed using a standardized volume region of interest (ROI; 20.0 mm3) placed in the central third of the medial tibial plateau (MTP). The ROI was positioned above the subchondral bone plate in the sagittal plane, The first 2D ROI was placed adjacent to the medial intercondylar eminence in the valley of the MTP. A total of three 2D ROIs (height = 1.00 mm and width = 10.00 mm) were imported at 5 slice intervals, and then the raw data were interpolated to construct at 3D rectangular ROI across the articular surface ( Fig. 1 ).
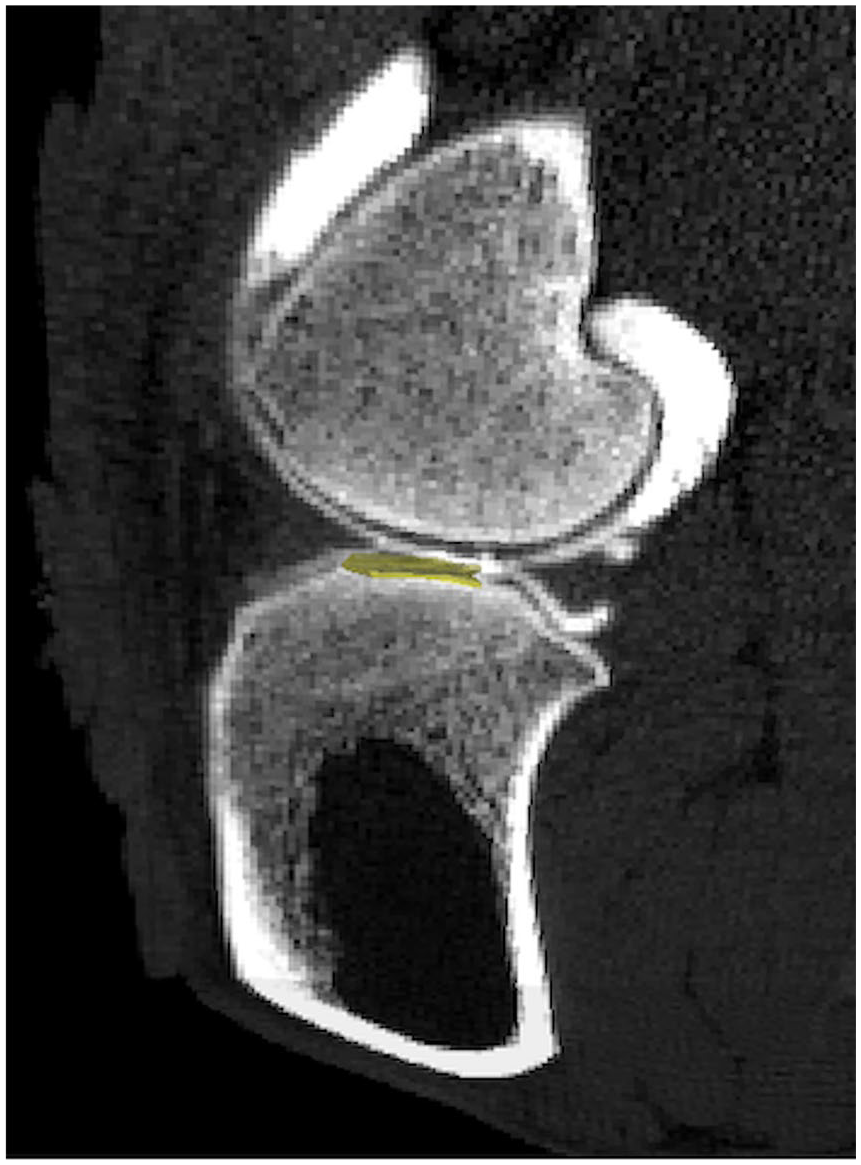
Computed tomography (CT) images of contrast-enhanced sheep stifle joint in vivo. Clinical resolution CT images after a 10-minute delay following intra-articular injection of 60% anionic contrast media. Three-dimensional region of interest (ROI: 20.0mm3) (yellow) positioned within the medial tibial plateau (MTP) for apparent density analysis in cartilage in sagittal view.
Ex Vivo CE-µCT of Osteoarthritic Stifle Joints
Sheep were sacrificed and evaluated at 3 months (n = 9) or 12 months (n = 11) to represent early-stage and late-stage OA, respectively. A third group of unoperated, control sheep (n = 4) were also evaluated at the 12-month time point.
Terminal evaluations of the operated (right stifle) and contralateral (left stifle) stifle joints included confirmation of meniscal release, scoring of cartilage degeneration and osteophytes as well as Outerbridge 19 classification of the lateral and medial articular surfaces. Photographs of specimens were taken prior to excising the entire proximal tibial plateau for CE-μCT ( Fig. 2A and B ). Excess periarticular tissues were removed with a scalpel and the cartilage was kept moist with LRS until it was immersed in a beaker containing an iodinated contrast medium solution (60% iothalamate meglumine, CystoConray, Mallinckrodt Inc.). After 10 minutes, samples were removed from the media and rinsed thoroughly with LRS to remove residual contrast medium from the surface. Samples were then placed in a sealed container with wet sponge designed to keep the cartilage surface hydrated during μCT imaging.
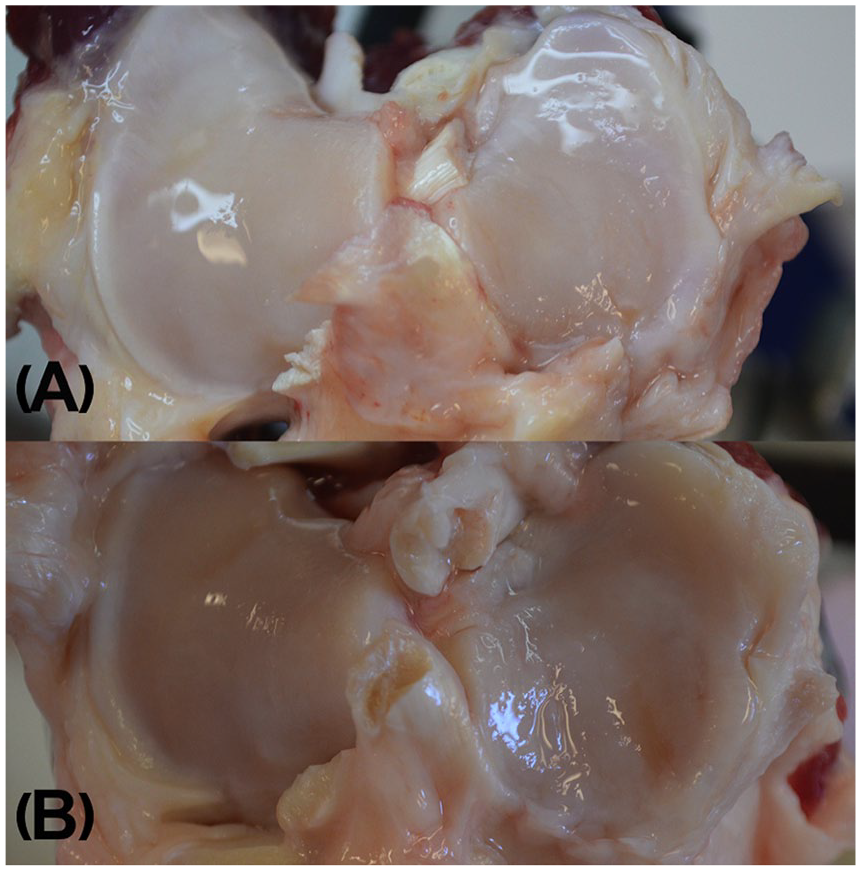
Photographs taken during macroscopic assessment of gross articular damage in the tibial plateau after release of medial meniscus at
Image slices were reconstructed into 3D images after calibration using a hydroxyapatite phantom. Analysis of apparent density (HU) in virtual biopsies was done using the bone analysis tool in the 3D image viewer and analysis software (GE Medical Systems MicroView software, Parallax Innovations, version 2.5.0). Three 4-mm cylindrical ROIs were created using fiducial markers and a coordinate system that normalized the location to the size of the articular surface ( Fig. 3 ).
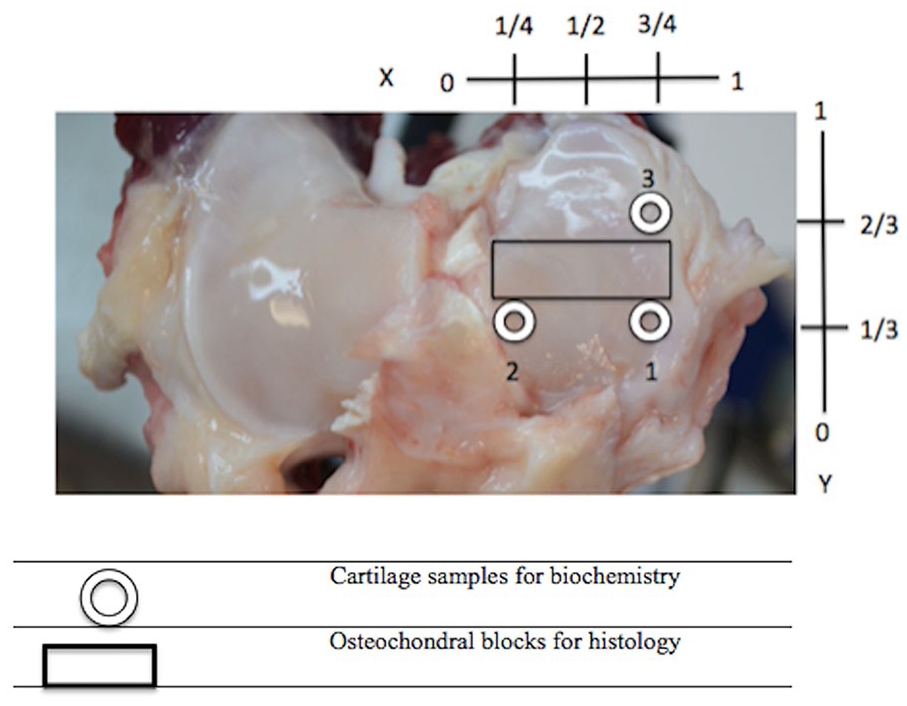
Positioning of 4.0 mm biopsies (circle) and histological sections (rectangle) on the articular surface of the right medial tibial plateau. Medial meniscus was removed prior to harvesting.
Biochemical Analysis of sGAG
Using a skin biopsy punch, 4-mm diameter cartilage biopsies were taken from the MTP of the osteoarthritic stifles using the aforementioned coordinate system ( Fig. 2 ). Cartilage biopsies were excised, weighed, and frozen (−80°C) until digested in 100 times their volume of 1 µg/mL papain (MilliporeSigma Canada Co.) solution in a 65°C water bath for 24 hours. 20 A standard curve was constructed from dilutions of a chondroitin sulfate-C (CSC) standard solution (MilliporeSigma Canada Co.) mixed with papain in digest buffer. Afterward, 200 µL of dimethyl methylene blue (DMMB) dye (MilliporeSigma Canada Co.) was added to each well. The well plate was placed into the spectrometer and samples were read in triplicate at 525 nm using an ELx800 plate reader (Fischer Scientific) yielding absorbance that was used to calculate cartilage sGAG concentration.
Histology
MTP osteochondral segments (5-mm wide by 4-mm thick, Fig. 3 ) were fixed in formalin for 48 hours and then decalcified prior to being processed and stained using safranin-O and hematoxylin and eosin (H&E). Microphotographs were made from the MTP histology slides using image analysis software (Northern Eclipse morphometric software, version 8.0) at 20×, 100×, and 200× magnification. Scoring of histological changes of OA was done using the guidelines outlined by the OARSI histopathological initiative, a semiquantitative scoring system described by Cook et al. 21 that was initially used in dogs and recently sheep to assess local and global severity of multiple OA parameters. 22 For the purpose of this study, focus was given to intensity of safranin-O staining as an estimate of proteoglycan content (scored 0 to 12), scoring of collagen pathology (0 to 9), and cartilage structure (0 to 12). An additional 10.00 mm3 rectangular ROI was constructed in the μCT images using MicroView software positioned the medial region of the MTP positioned to align with the regions assessed by histology ( Fig. 2 ).
Statistical Methods
Analysis of all parameters was carried out using statistical software (RStudio, version 1.1.383, RStudio, Inc.). All tests were conducted using a 95% confidence level and 5% chance of type II error. A group difference in the variance of apparent density (HU) in the bovine osteochondral samples was analyzed using one-way analysis of variance. Between-group differences were done using Tukey’s honest significant difference, and a 95% confidence level. Differences in mean apparent density between right stifles (contrasted) and left stifles (noncontrasted) were analyzed using Welch’s 2-sample test.
Both between-site and between-group variance were examined to investigate how location of the ROI and time influence variance in the uptake of anionic contrast in the MTP. Also, unoperated controls (n = 4) were utilized for direct comparison to osteoarthritic sheep. Given that sGAG is known to vary with regard to different locations across the joint surface due to differences in the biomechanical microenvironment, 2 one-way analyses of variance were conducted to ensure that differences in site would not confound results on differences between groups. 23 Analysis of variance in sGAG concentration was conducted to examine differences among the levels both between and within groups. OARSI histological scoring parameters were analyzed using a simple 2-sided Student’s unpaired t test with a 95% confidence level and 80% power. Differences in scoring were tested between early- and late-phase OA for the right MTP.
Associations between the biochemical and μCT measures were analyzed using a Pearson product-moment correlation test with a 95% confidence level. Significant associations were investigated more robustly using a linear regression analysis, as the literature emphasizes an inverse, linear relationship between sGAG and HU. Correlations between histological scores of proteoglycan, collagen pathology or cartilage structure and HU were examined using Spearman rank-order coefficients to look at agreement between apparent density obtained from the 10.00 mm3 ROI and the semiquantitative histological assessment of OA.
Results
In Vitro CE-μCT of Osteochondral Blocks
Analysis of variance in HU between the 4 groups of osteochondral samples revealed a significant group-wise difference in HU ( Table 1 ). Pairwise comparisons confirmed that all blocks exposed to contrast media had significantly higher values (P < 0.05) than the noncontrasted controls after just 10 minutes of exposure ( Table 2 ). Moreover, the delaminated group exhibited significantly higher mean apparent density (X = 1265.9, SD = 285.9) than the intact contrasted group (P = 0.044) but not the fibrillated contrasted group ( Fig. 4 ). Removal and fibrillation of superficial layer was confirmed histologically ( Fig. 5 ).
Average Apparent Density of 6.00 mm3 ROI Measured Using HU in Bovine Cartilage Samples after 10 Minutes of Exposure to 60% Cystoconray.
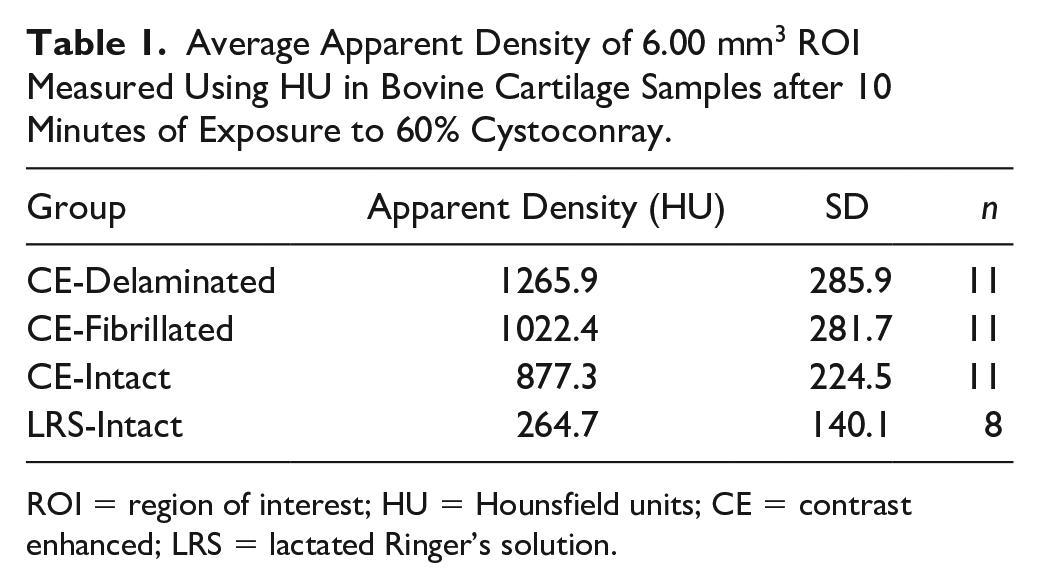
ROI = region of interest; HU = Hounsfield units; CE = contrast enhanced; LRS = lactated Ringer’s solution.
Adjusted P Values for Difference in Mean Apparent Density (HU) between Groups Using Tukey’s Honest Significant Difference and a 95% Confidence Level.
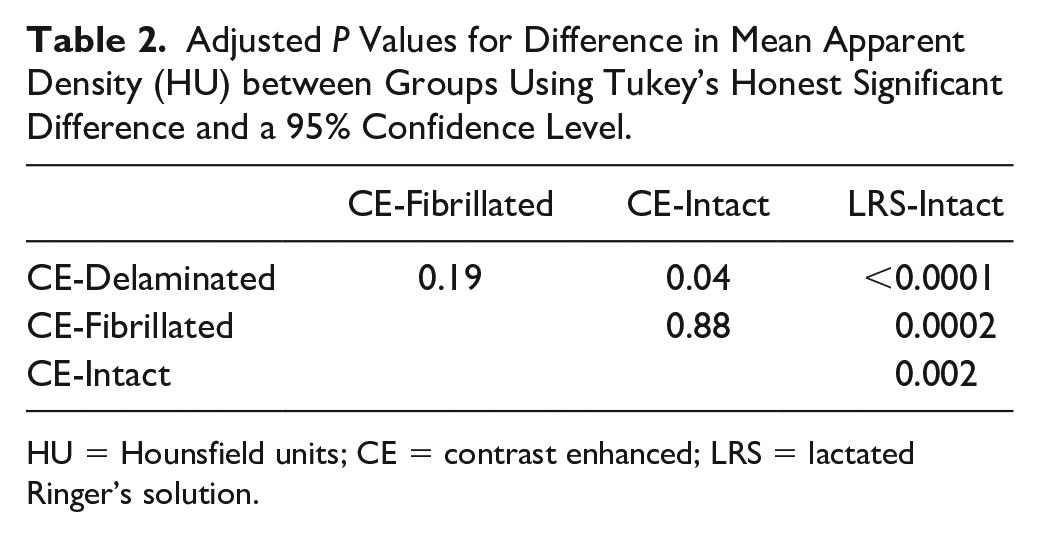
HU = Hounsfield units; CE = contrast enhanced; LRS = lactated Ringer’s solution.
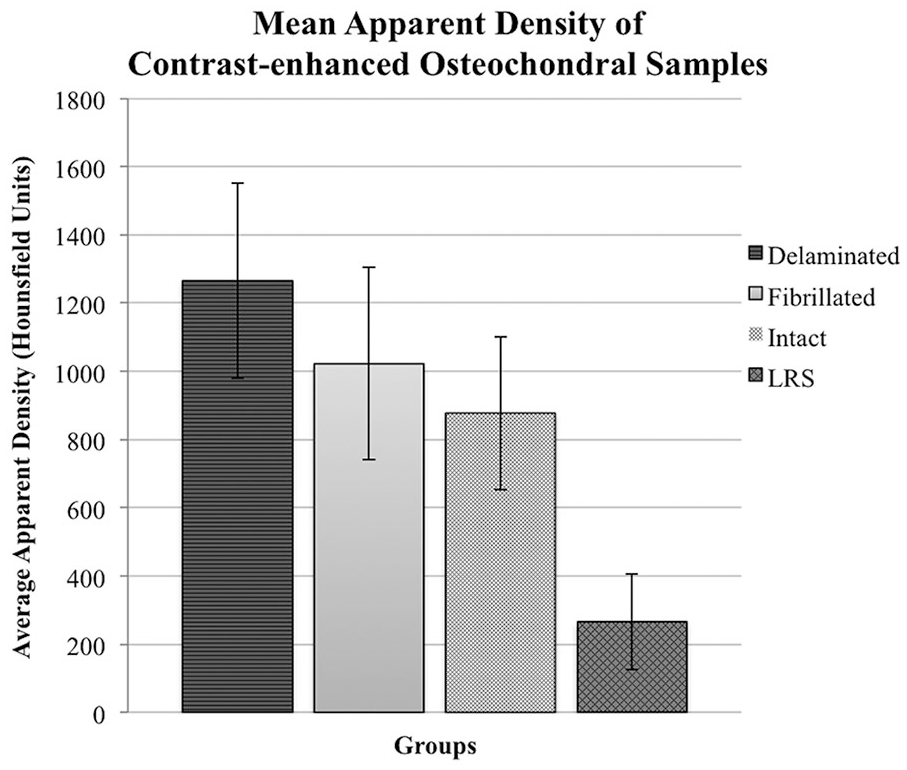
Mean apparent density (HU) of bovine cartilage after contrast-enhanced µ-computed tomography (CE-µCT). Blocks were imaged in Conray60 (C60) and the superficial layer was either removed (delaminated [n = 11]; fibrillated [n = 11], or left intact [n = 11]). Controls (n = 8) were intact and instead exposed to lactated Ringer’s solution (LRS) prior to μCT.
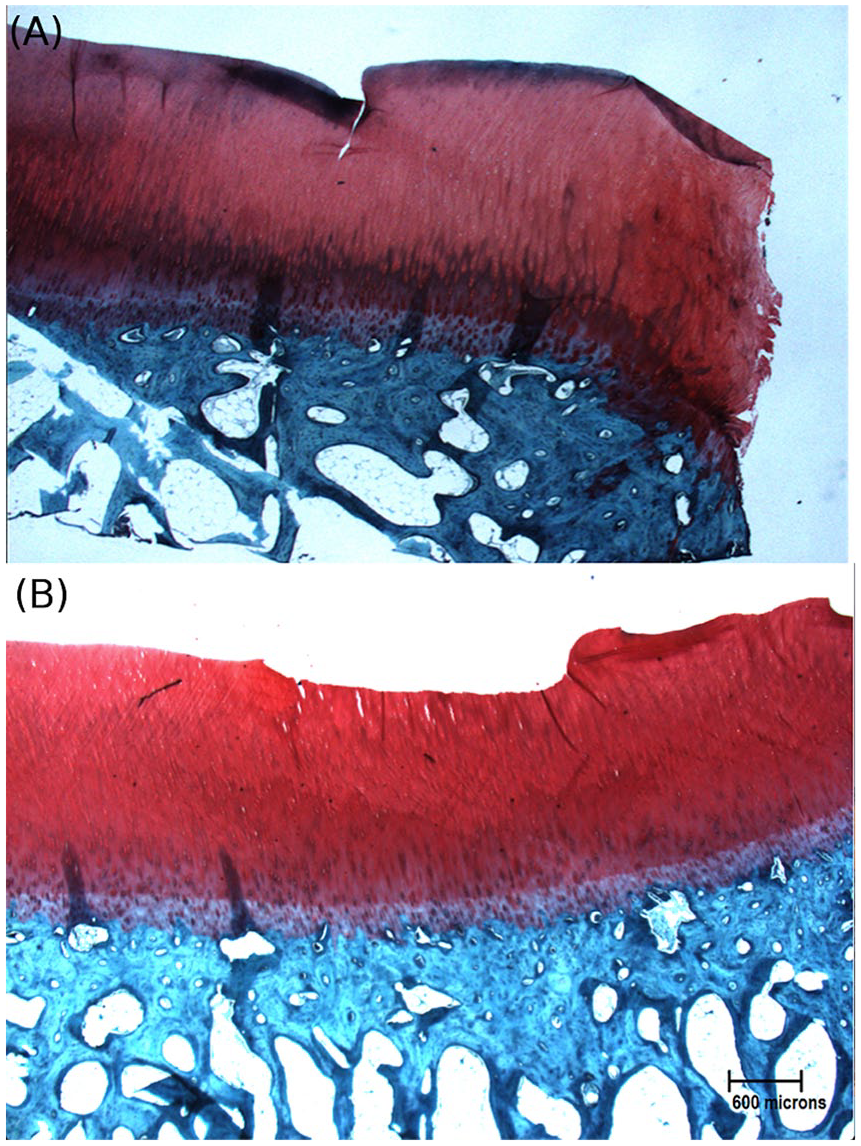
Bovine osteochondral sections stained using safranin-O to demonstrate 2 conditions of superficial damage: (
In Vivo CE-CT of Osteoarthritic Cartilage
Cartilage in stifles of early phase OA sheep that were exposed to contrast media 10 minutes prior to clinical-resolution CT imaging exhibited an average gain of 601 HU. This was significantly greater than cartilage in the unoperated, noncontrasted contralateral stifles (P < 0.001).
Ex Vivo CE-μCT of Osteoarthritic Stifle Joints
The mean radiographic densities for each of the three MTP ROIs at the early and late phase OA time points are shown in Table 3 . Sites 1 and 3 had greater mean HU in the early-phase OA sheep compared with the same relative location of the late-phase OA sheep ( Table 3 ). In late-phase OA sheep, site location was the main effect responsible for variance in HU (F = 5.835, P < 0.01) while early phase OA sheep did not have the same effect of site (F = 2.601, P = 0.09) ( Table 4 ).
Means (Standard Deviation) of Apparent Density in Hounsfield Units (HU), and sGAG Concentration of All 3 Sites for the Early-Phase OA Group (n = 9), Late-Phase OA Group (n = 11), and Control Sheep.
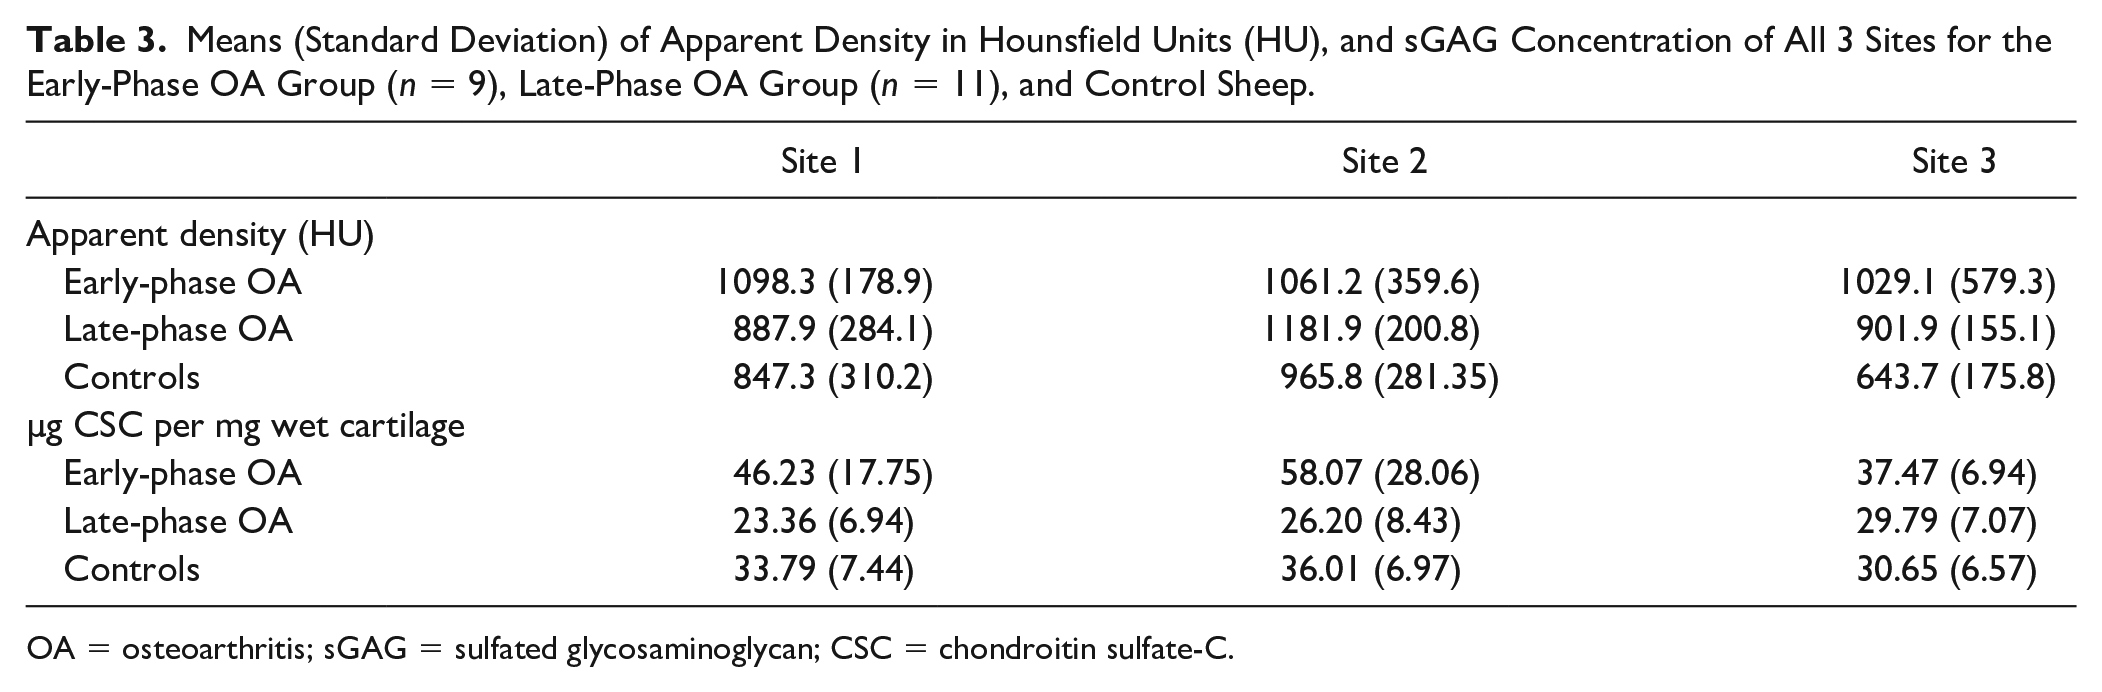
OA = osteoarthritis; sGAG = sulfated glycosaminoglycan; CSC = chondroitin sulfate-C.
Summary of Results of Between-Site and Between-Group Analysis of Variance in Apparent Density of Cartilage and Concentration of sGAG.
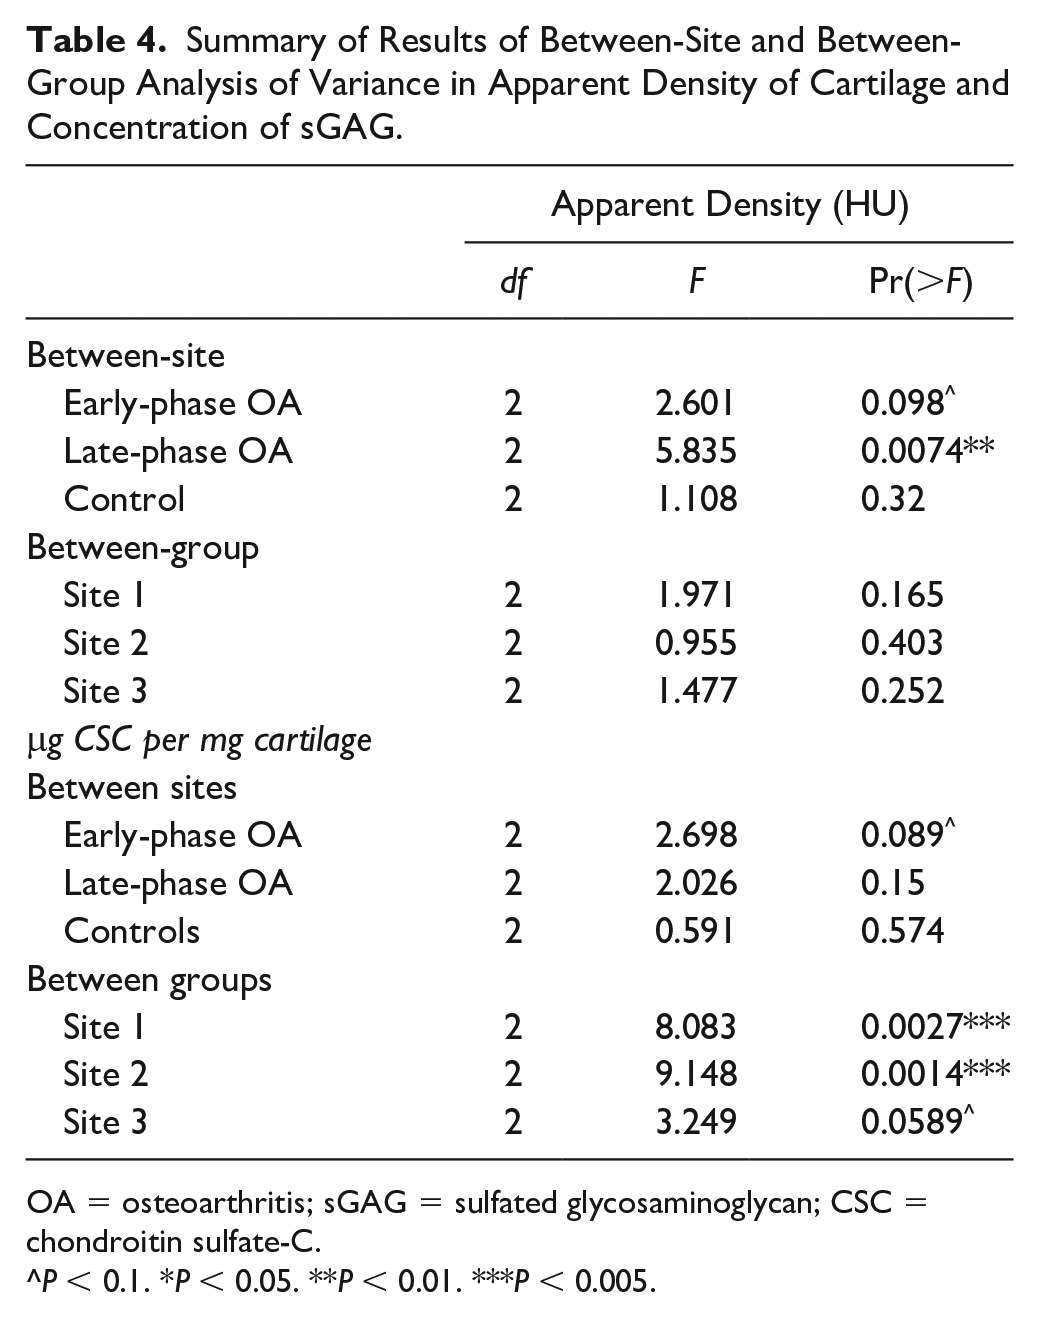
OA = osteoarthritis; sGAG = sulfated glycosaminoglycan; CSC = chondroitin sulfate-C.
^P < 0.1. *P < 0.05. **P < 0.01. ***P < 0.005.
Biochemical Analysis of sGAG
Statistical evaluation of mean MTP sGAG content in the early-phase OA sheep showed elevated levels of sGAG compared with late-phase OA sheep and control groups ( Table 3 , Fig. 6 ). Variance in sGAG for each site was appreciably larger in the early-phase OA sheep compared with the OA-naive controls. Late-phase OA sheep were similar to the early-phase OA sheep and did not reveal any significant effect of site location ( Table 4 ).
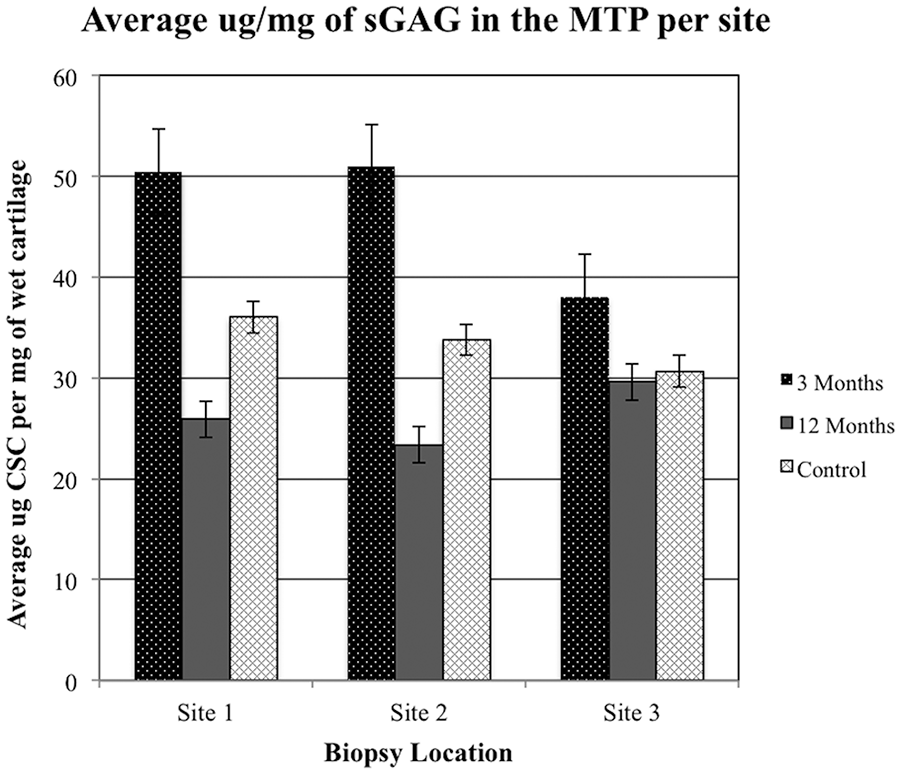
Average concentration of sulfated glycosaminoglycan (sGAG) determined from each site in controls as well as early- and late-phase osteoarthritis (OA) sheep. MTP, medial tibial plateau; CSC, chondroitin sulfate-C.
Analysis demonstrated that meniscal release produced a significant change in the concentration of sGAG ( Table 4 ). Time since meniscal release influenced sGAG resulting in an effect size at site 1 (F = 8.01, P < 0.01) and site 2 (F = 9.14, P < 0.005). Additionally, site 3 had a statistical trend consistent with this pattern (F = 3.24, P = 0.059).
Histology
Both late- and early-phase OA sheep had similar average scores for proteoglycan staining (X = 5.1, SD = 2.6; X = 5.00, SD = 1.1, respectively) ( Table 5 , Fig. 7 ). Scoring of collagen pathology was significantly different between the groups (P = 0.025) with late-phase sheep exhibiting a scored average of 5.4 compared with the early-phase score of 4.5. Moreover, cartilage structure was observed to differ between early-phase (X = 4.0, SD = 1.5) and late-phase (X = 5.7, SD = 1.5) (P = 0.031).
Mean (Standard Deviation) of OARSI Scores for Proteoglycan Staining, Collagen Pathology, and Cartilage Structure for All 3 Groups.
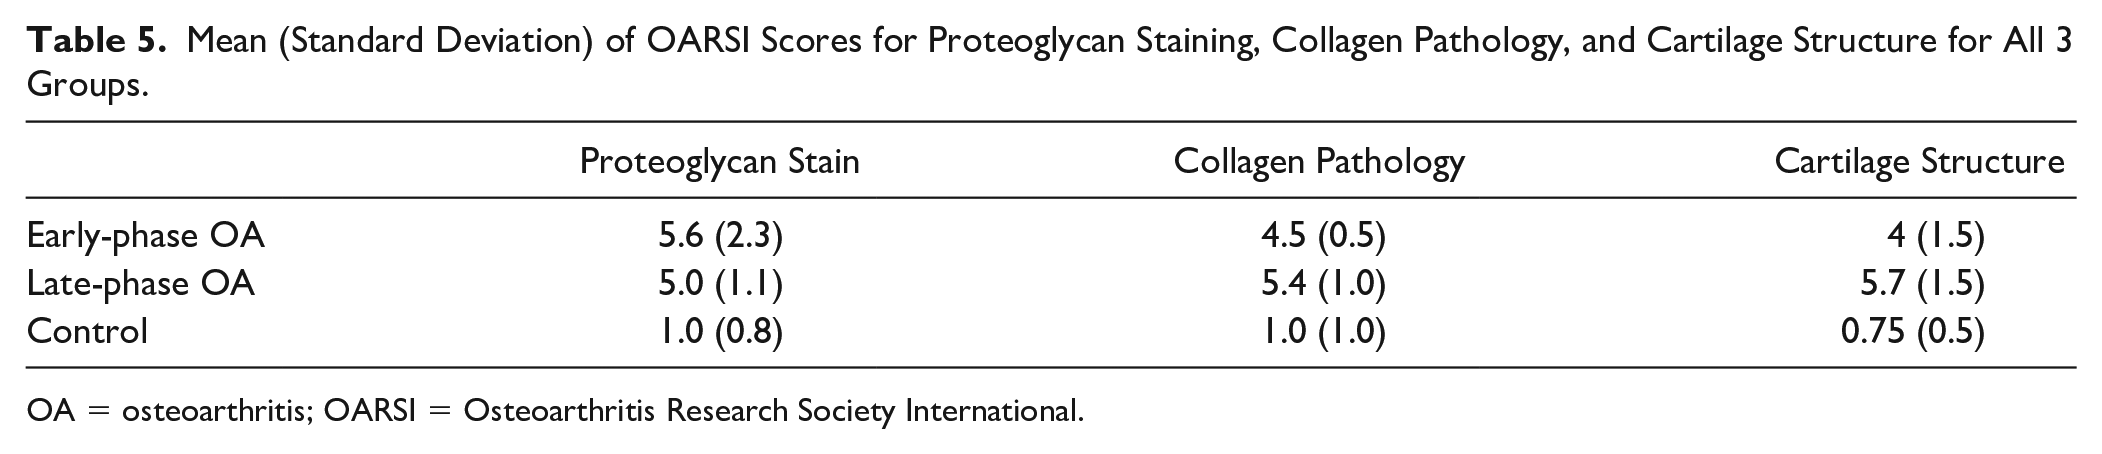
OA = osteoarthritis; OARSI = Osteoarthritis Research Society International.
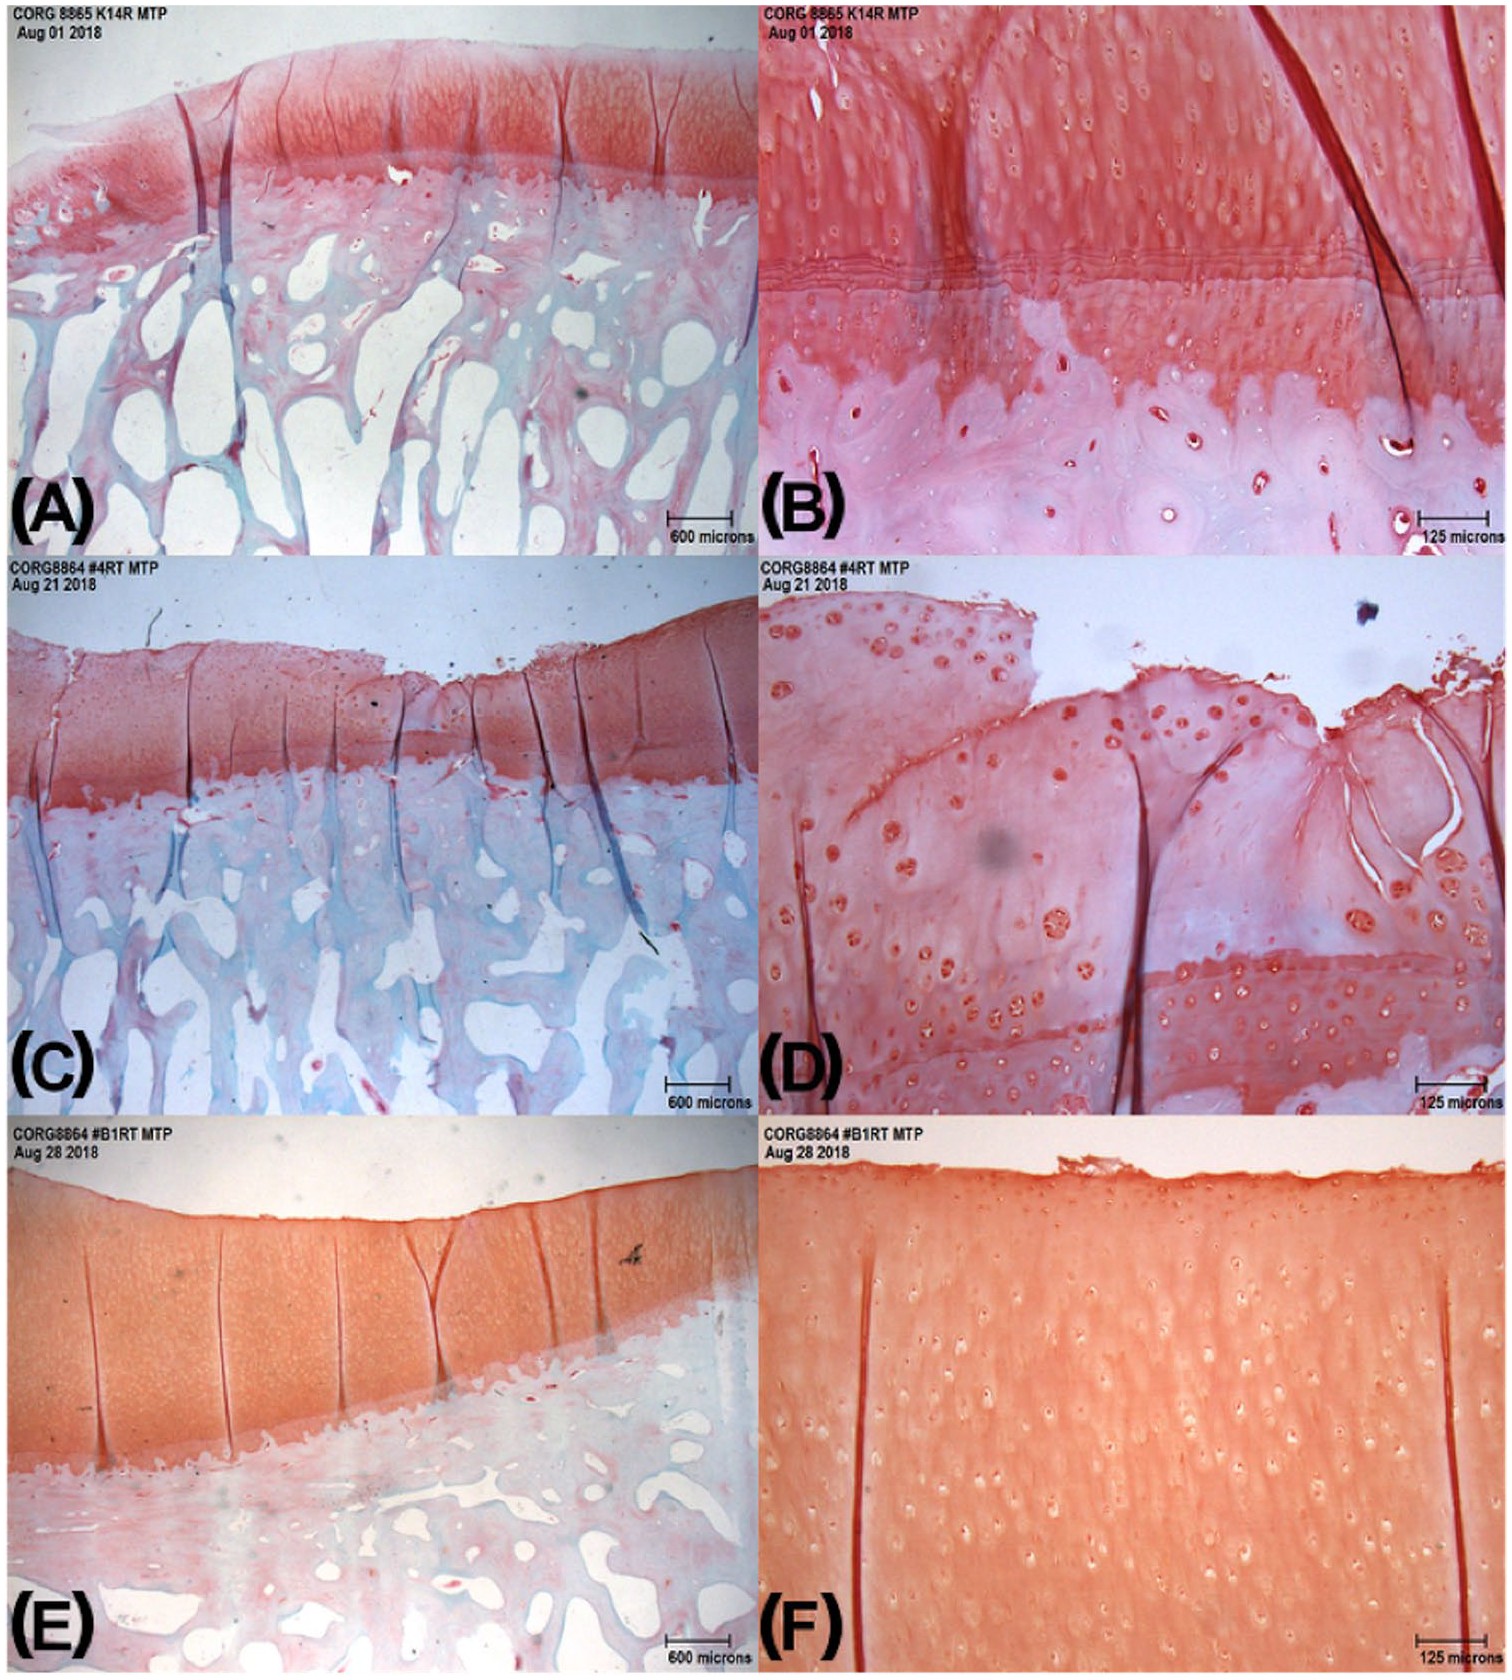
Ovine osteochondral histology sections at different time points of osteoarthritis (OA) development: (
Correlating HU, sGAG, and Histological Scores in Articular Cartilage
Evidence of a significant negative correlation between sGAG and HU was observed within site 2 across the 2 groups between early- and late-phase OA (r = −0.56, P = 0.014) ( Table 6 ). Further analysis of the relationship between sGAG and HU in site 2 using linear regression analysis revealed that change in HU significantly predicted changes in concentration of sGAG where 28% of HU data are explained by variance in sGAG. A reduction of sGAG by 0.05 µg CSC per mg of wet cartilage resulted in a single unit increase in the apparent density (R2 = 0.28, P = 0.014) ( Fig. 8 ).
Coefficients from Pearson and Spearman Rank-Order Tests Examining the Association between Apparent Density Taken from Pooled Groups for Comparison with sGAG Concentration (Biopsy Site 2) and OARSI Histological Parameters.
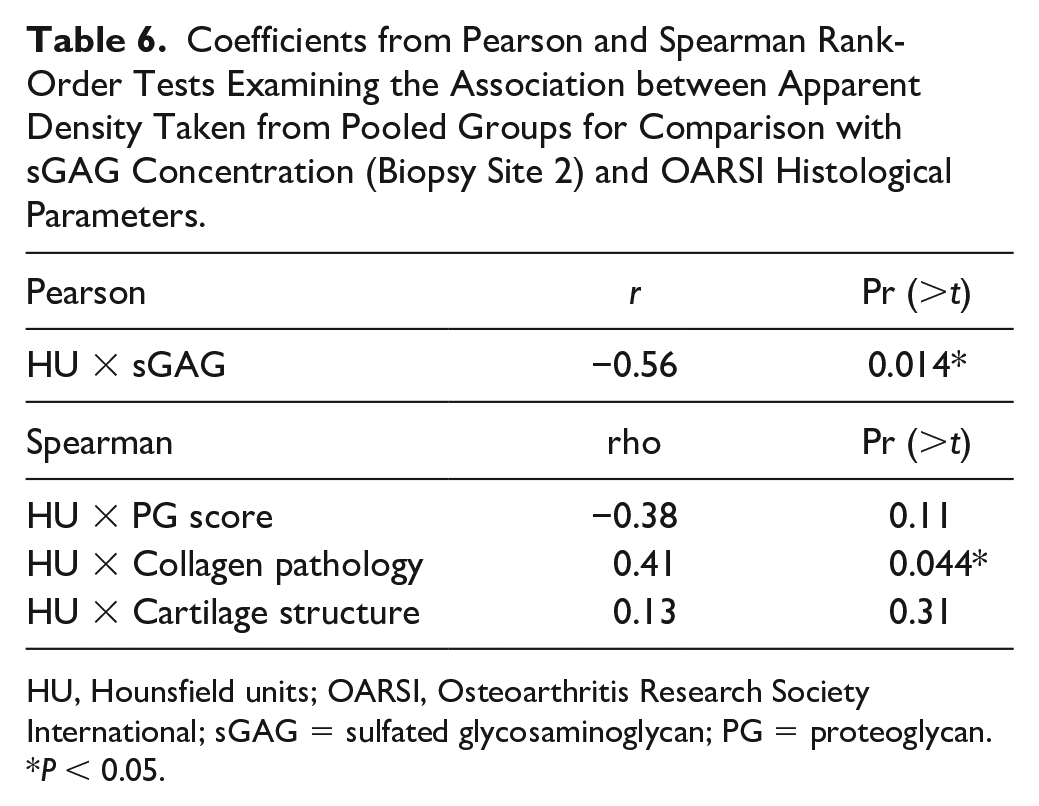
HU, Hounsfield units; OARSI, Osteoarthritis Research Society International; sGAG = sulfated glycosaminoglycan; PG = proteoglycan.
P < 0.05.
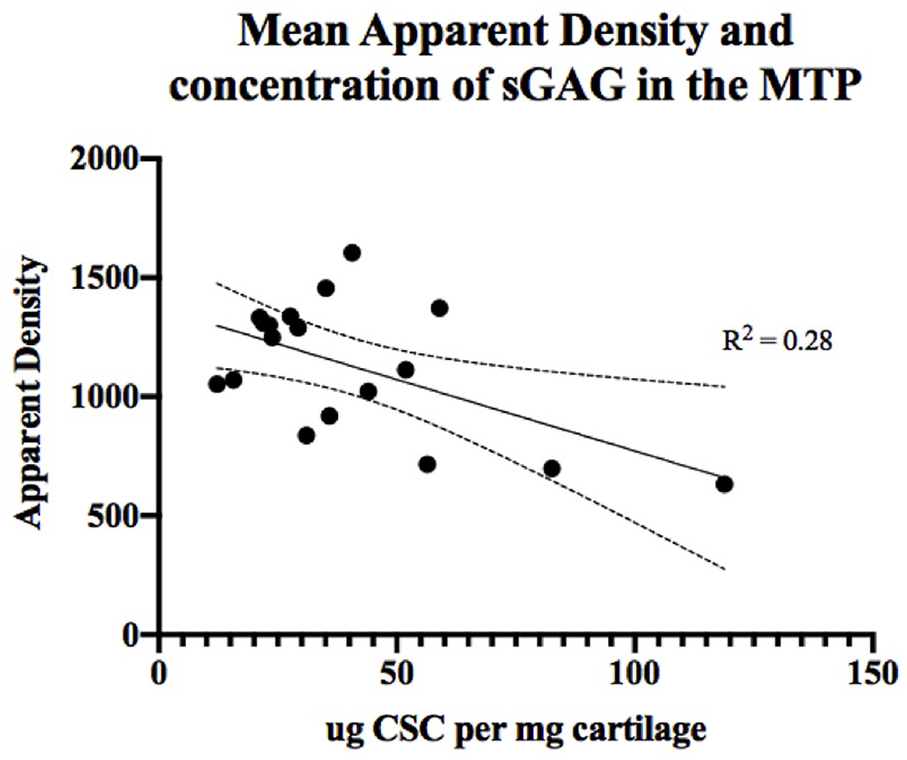
Relationship between the apparent density (HU) and concentration of sulfated glycosaminoglycan (sGAG) sampled from site 2 taken from the region below the meniscus of the medial tibial plateau (MTP). CSC, chondroitin sulfate-C.
Spearman rank-order coefficients describing the correlations between semiquantitative histological scores revealed apparent density correlated significantly only with collagen pathology (rho = 0.41, P = 0.044) ( Table 6 ).
Discussion and Conclusion
While it was found that nonequilibrium anionic CE-CT is a feasible approach to improving cartilage visibility in clinical resolution CT, the in-depth assessment of biochemical and physical properties in clinical CT images was not attainable due to inadequate spatial resolution of the image. Higher resolution CT would facilitate this technique as demonstrated in a study by Siebelt et al. 23 where CT arthrography (CTa) was accomplished using a dual source multidetector spiral CT scanner to image human cadaveric knees exposed to 30% ioxoglate 10 minutes after injection. X-ray attenuation in CTa correlated strongly with values in EPIC-CT, especially when corrected for structural compositions of the extracellular matrix (ECM) that are independent of sGAG. 23 Nonequilibrium CECT results are influenced by tissue drag, which is higher in regions with an intact collagen network, particularly in the superficial zone where collagen fibers are oriented parallel to the surface, serving as a restrictive barrier during the passive diffusion of ions. 23 This coincides with findings from our in vitro pilot study, where there was a significant increase in apparent density of cartilage after exposure to anionic contrast medium for merely 10 minutes, suggesting that similar effects could be obtained in larger complete joint surfaces. While contrast enhancement makes it easier to observe and measure the cartilage layer in CT imaging, focal areas of increased apparent density may be due to superficial cartilage loss, particularly when the superficial zone is fully delaminated. Cartilage fibrillation will also increase apparent density to a lesser extent. Location also markedly affects both sGAG concentration and apparent density in CECT, making it necessary to compare experimental and normal joints on a site-by-site basis. 24 However, the proteoglycan content of the bovine cartilage was not analyzed and hence the concentration of sGAG could not be factored in as an additional influence on apparent density.
We also showed that OA stage has a bimodal pattern, where sGAG increases in the early phase and decreases in late-stage OA. Granted, sites within the joint surfaces may be progressing at different rates, so peripheral areas distant from regions of maximal biomechanical stress could be in the early hypertrophic phase while central fully weightbearing areas could be in the late degenerative phase of OA. Hence, we observed significant variability in sGAG between the early- and late-phase OA sheep within sites 1 and 2 but not site 3. Interestingly, despite the substantial variability in sGAG between the groups at site 2, apparent density did not vary significantly by group at that same location, suggesting additional factors could drive the uptake of contrast media under short, nonequilibrium exposure conditions. We speculate that because site 2 was centrally located on the articular surface it was susceptible to greater biomechanical stress, and thus likely to exhibit more advanced OA features of cartilage, including disruption to the superficial collagen barrier.
Perhaps our most compelling finding is the negative linear relationship that was observed between sGAG concentration and HU within site 2 across the 2 OA groups. Site 2 was selected because this area on the MTP is affected early by meniscal deficiency and subsequent point loading from the femoral condyles. 25 While 28% of variance in HU was explained by changes in sGAG, alternative factors, like the effect of superficial cartilage layer disruption shown in the preceding in vitro study, may be contributing to increased anionic contrast penetration. A similar effect was observed by threose-induced collagen cross-linking on the cartilage surface, thereby reducing diffusion of contrast media into the tissue and thus HU. 26 The integrity of the superficial cartilage layer might therefore play a larger role than previously thought in the uptake of anionic media during shorter exposure times.
The severity of physical damage to the superficial zone of cartilage could be contributing to variance in the relationship between sGAG and apparent density. Previous anionic contrast studies in bovine19,26 and rabbit27,28 have demonstrated that the increased permeability of damaged cartilage causes an increase in the rate of contrast diffusion.
Depending on the time since meniscal release, disruption of the collagen network and articular surface progressed from multifocal superficial loss to more severe fissures and erosion reaching the middle and deep zones of the cartilage. An increase in histological collagen network disruption was associated with an increase in the apparent density of the cartilage suggesting disruption or loss of the superficial layer facilitates uptake of contrast media, even in a short-term contrast exposure protocol.
Differences in superficial zone damage to osteochondral blocks resulted in facilitated uptake of anionic media after 10 minutes. We can conclude that while changes in sGAG concentration may explain some changes in apparent density, there are multiple pathways contributing to degradation of the joint over time. Changes in sGAG correlated with HU at site 2, which was situated within the load-bearing region of the medial tibial plateau. Future prospects could compare diffusion between sGAG-binding and collagen-binding media such as phosphotungstic acid with biochemical and histological samples obtained from different phases of OA. 29 There is growing evidence for the potential of CECT in aiding the evaluation of biochemical and morphological properties of arthritic cartilage. Applicability of these techniques in monitoring OA clinically would maintain the sensitivity for changes in bone morphology already associated with CT, as well as have an economic advantage compared to other imaging modalities.
Footnotes
Author Contributions
Acknowledgments and Funding
The author(s) received no financial support for the research, authorship, and/or publication of this article.
Declaration of Conflicting Interests
The author(s) declared no potential conflicts of interest with respect to the research, authorship, and/or publication of this article.
Ethical Approval
All procedures were approved by an institutional animal care committee operating under the guidelines of the National Council on Animal Care.
Animal Welfare
The present study followed international, national, and/or institutional guidelines for humane animal treatment and complied with relevant legislation.