
Abstract
The gene encoding EWS (EWSR1) is involved in various chromosomal translocations that cause the production of oncoproteins responsible for multiple cancers including Ewing sarcoma, myxoid liposarcoma, soft tissue clear cell sarcoma, and desmoplastic small round cell sarcoma. It is well known that EWS fuses to FLI to create EWS/FLI, which is the abnormal transcription factor that drives tumor development in Ewing sarcoma. However, the role of wild-type EWS in Ewing sarcoma pathogenesis remains unclear. In the current study, we identified EWS-regulated genes and cellular processes through RNA interference combined with RNA sequencing and functional annotation analyses. Interestingly, we found that EWS and EWS/FLI co-regulate a significant cluster of genes, indicating an interplay between the 2 proteins in regulating cellular functions. We found that among the EWS–down-regulated genes are a subset of neuronal genes that contain binding sites for the RE1-silencing transcription factor (REST or neuron-restrictive silencer factor [NRSF]), neuron-restrictive silencer element (NRSE), suggesting a cooperative interaction between REST and EWS in gene regulation. Co-immunoprecipitation analysis demonstrated that EWS interacts directly with REST. Genome-wide binding analysis showed that EWS binds chromatin at or near NRSE. Furthermore, functional studies revealed that both EWS and REST inhibit neuronal phenotype development and oncogenic transformation in Ewing sarcoma cells. Our data implicate an important role of EWS in the development of Ewing sarcoma phenotype and highlight a potential value in modulating EWS function in the treatment of Ewing sarcoma and other EWS translocation–based cancers.
Introduction
Ewing sarcoma is a translocation-based pediatric bone and soft tissue tumor. In most Ewing sarcoma cases, translocation causes a fusion between the EWSR1 gene (encoding EWS) and the FLI1 gene (encoding FLI) and gives rise to the fusion protein EWS/FLI. It is well known that EWS/FLI functions as an aberrant transcription factor to deregulate the expression of target genes and promote tumor development.1 -3 In addition to the gain of function of EWS/FLI, translocation also results in the loss of 1 EWSR1 allele. In fact, a case of Ewing sarcoma with both copies of EWSR1 translocated, and therefore no wild-type EWS expression, has been reported, 4 suggesting that EWS is dispensable for tumor growth. However, EWS function is disrupted or insufficient in several EWS translocation–based cancers, indicating that EWS may contribute to the suppression of cancer-related phenotypes. So far, little is known about the role of EWS, if any, in regulating cancer-related phenotypes.
In general, EWS is an RNA-binding protein and has been implicated in transcription regulation and RNA processing. 5 EWS interacts with RNA polymerase II and the TFIID transcription preinitiation complex. EWS co-transcriptionally binds to its target mRNA and regulates the alternative splicing or exon skipping of genes involved in DNA repair and related signaling upon cellular stress.6,7 In addition, EWS binds to noncoding RNA and inhibits the histone acetyltransferase (HAT) activity of CBP/p300 on a repressed gene target, CCND1, upon radiation. 8 Recently, EWS was found to be associated with RNA granules under genotoxic stress.9,10 Most of the above known EWS functions are characterized under conditions of cellular stress in non–Ewing sarcoma settings. Notably in Ewing sarcoma, EWS co-exists with EWS/FLI, which has been shown to bind EWS and interfere with EWS-mediated transcription regulation and splicing in a dominant-negative manner.11 -13 However, neither the function of EWS nor the relationship between EWS and EWS/FLI in Ewing sarcoma is well defined.
Interesting neuronal features have been identified in Ewing sarcoma cells and tumors, such as the presence of Homer-Wright rosettes, neural processes, neurosecretory granules, and neural immunohistochemical markers.14,15 It has been suggested that the neural phenotype of Ewing sarcoma may be a consequence of the translocation and resultant expression of EWS/FLI because the introduction of EWS/FLI into NIH3T3 or rhabdomyosarcoma RD cells induces the features of neural differentiation.16,17 However, Ewing sarcoma and peripheral primitive neuroectodermal tumor (pPNET), which contain the same t(11;22)(q24;q12) translocation18 -20 and represent the same disease, exhibit varying levels of neural differentiation. This suggests that other modulators may exist to regulate the neuronal phenotype in Ewing sarcoma.
RE1-silencing transcription factor (REST or neuron-restrictive silencer factor [NRSF]) is a transcription repressor that has diverse functions in a context-dependent manner through interactions with distinct co-factors.21 -23 REST was originally found to repress neuronal gene expression in nonneuronal cells. 21 It is now widely recognized that REST also plays a role in tumorigenesis.24 -27 REST was identified as a tumor suppressor in an RNA interference (RNAi)–based genetic screen in epithelial cells using an in vitro breast cancer precursor model. 24 Later studies revealed that REST is frequently deleted in colon and small cell lung cancers,24,25 supporting a role for this transcription repressor as a tumor suppressor. In breast cancer, a nonfunctional, truncated splice variant of REST was identified in some tumor subtypes, and expression of this truncated variant of REST was shown to correlate with poor prognosis. 28 Interestingly, these REST-deficient tumors acquire certain neuronal phenotypes such as the expression of neuronal genes that are normally not expressed outside the nervous system.24,25
In this article, we sought to characterize the function of EWS in Ewing sarcoma and found that EWS contributes to cancer phenotypes in that EWS cooperates with REST to repress neuronal phenotype development and EWS and REST inhibit oncogenic transformation in Ewing sarcoma cells.
Results
Identification of EWS-regulated genes and cellular processes in Ewing sarcoma
To characterize the function of EWS in Ewing sarcoma, we silenced EWS in A673 Ewing sarcoma cells (Fig. 1A) and performed high-throughput sequencing of RNA (RNA-seq) from control (luciferase) or EWS knockdown cells to identify EWS-regulated genes. Sequencing reads were mapped to Ensembl annotations (www.ensembl.org), and expression levels of genes based on the Ensembl annotation are shown in Supplementary File S1. Genes were ranked by the mean ± standard deviation of log-transformed FPKM (fragments per kilobase per million mapped reads) and shown as a heat map in Figure 1B. To gain insight into the functional significance of the differentially expressed genes, we performed DAVID functional annotation analysis (david.abcc.ncifcrf.gov) of 99 genes that pass the filter of a 5% false discovery rate (FDR) and log2 ratio >1 or <–1. We found that these genes are associated with diverse functions, including those that have previously been indicated for EWS in non–Ewing sarcoma cells, such as a response to various cellular stresses, as well as previously unidentified functions including cell signaling, secretion, blood vessel development, and neuronal-related processes (Fig. 1C and Suppl. File S2). A subset of EWS–up-regulated and –down-regulated genes was randomly selected and validated by qRT-PCR) (Fig. 1D and 1E).
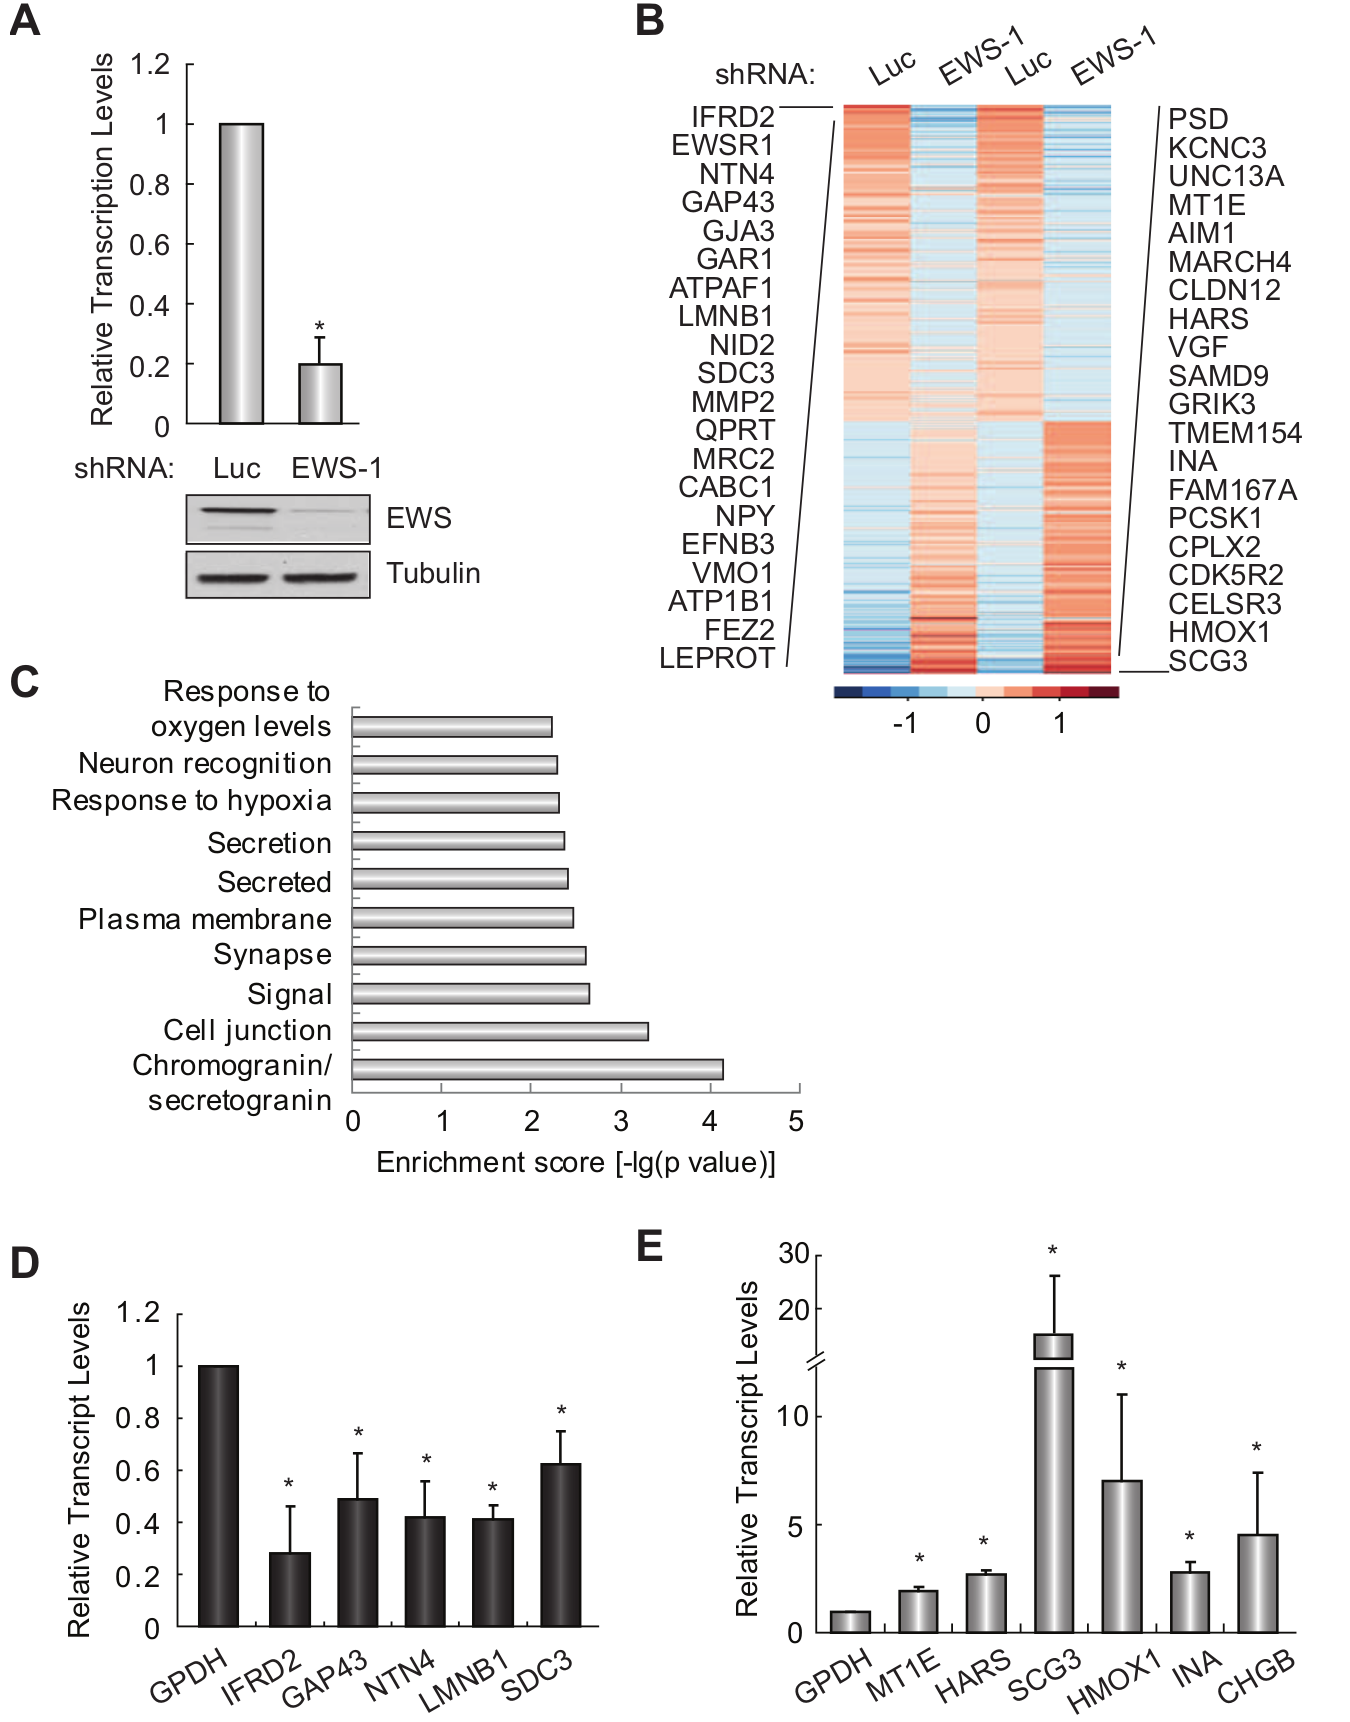
Identification of EWS-regulated genes and functions in Ewing sarcoma. (
EWS-regulated genes are differentially regulated by EWS/FLI
Because EWS/FLI has previously been shown to interfere with EWS functions,12,13 we next sought to determine the relationship between EWS and EWS/FLI in regulating cellular processes in Ewing sarcoma. We performed RNA-seq following EWS/FLI silencing and compared the EWS/FLI-regulated transcriptional profile (Suppl. File S3) with that of EWS. We used VennMaster analysis (informatik.uni-ulm.de/ni/staff/HKestler/vennm) to identify genes commonly regulated by EWS and EWS/FLI. Fifty-three of the 99 EWS-regulated genes were found to also be regulated by EWS/FLI (P = 3.86345E-30) (Fig. 2A). Of these 53 EWS and EWS/FLI commonly regulated genes, 14 genes were up-regulated by EWS and down-regulated by EWS/FLI (P = 4.30758E-9), and 13 genes were down-regulated by EWS and up-regulated by EWS/FLI (P = 4.62419E-8), suggesting that the 2 proteins inversely regulate a significant subset of target genes (Fig. 2B). Interestingly, we also identified 7 genes that were up-regulated (P = 0.00897) and 19 genes that were down-regulated (P = 4.19203E-14) by both EWS and EWS/FLI (Fig. 2B), indicating that the 2 proteins also regulate a significant subset of genes in the same manner. We next performed Gene Set Enrichment Analysis (GSEA) using the EWS/FLI-regulated genes as the ranked list and the EWS–up-regulated or –down-regulated targets as the gene sets and applied a χ2 test 29 to establish enrichment of the EWS-regulated genes for both the EWS/FLI–up-regulated and –down-regulated genes. We found that the EWS–up-regulated genes cluster significantly (P ≤ 0.001) with both the EWS/FLI–up-regulated and –down-regulated genes and vice versa (Fig. 2C), suggesting a correlated regulation of genes by EWS and EWS/FLI in either the same or opposite directions. Notably, the correlation seemed to be stronger for the EWS–down-regulated genes as compared to the EWS–up-regulated genes. These results suggest that EWS and EWS/FLI differentially regulate genes and cellular processes in Ewing sarcoma.
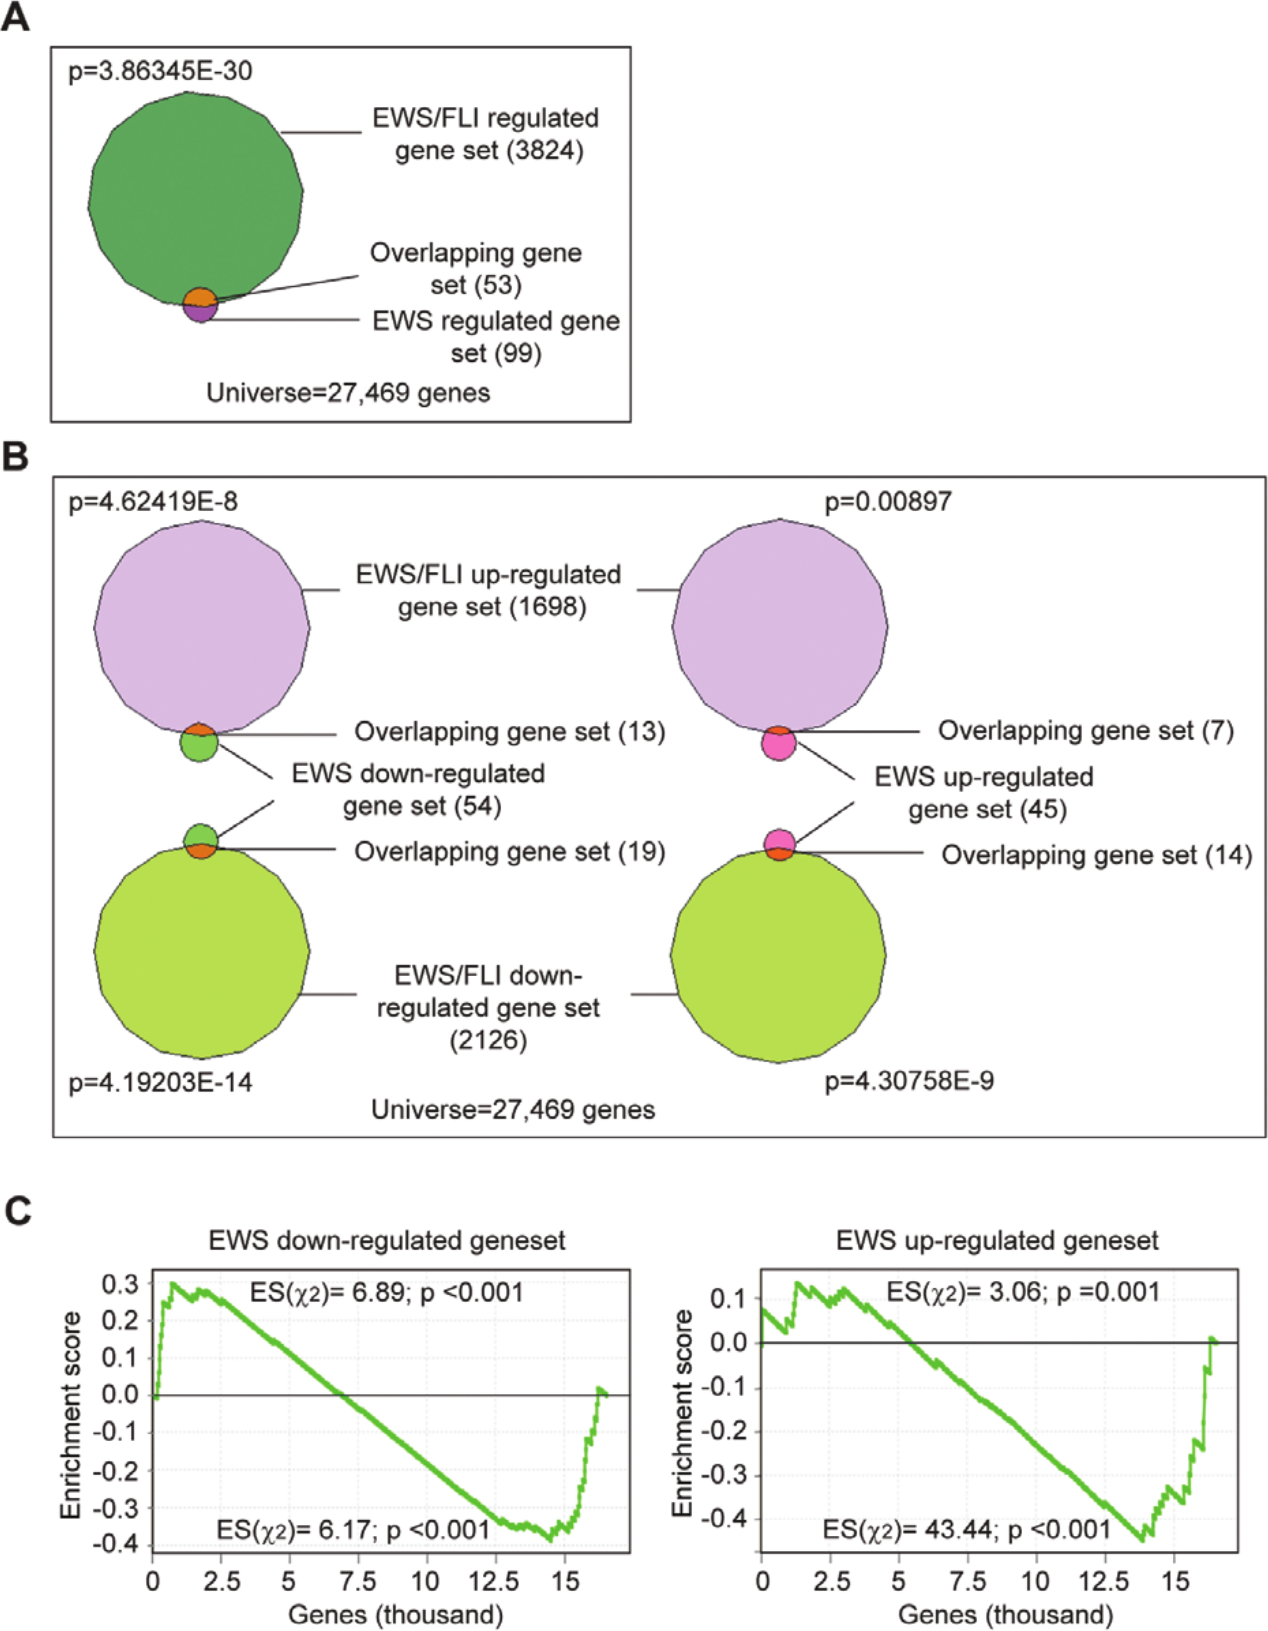
EWS/FLI differentially regulates EWS-regulated genes. (
EWS inhibits a subset of REST target neuronal genes in Ewing sarcoma cells
Because Ewing sarcoma was found to display some neuronal features, we focused our study on the EWS-regulated genes in the category of neuronal-related processes. We noted a set of neuronal genes including chromogranin A (CHGA), cholinergic receptor nicotinic beta 2 (CHRNB2), pleckstrin and Sec7 domain containing (PSD), secretogranin III (SCG3), synaptotagmin IV (SYT4), and VGF nerve growth factor inducible (VGF). These 6 genes are involved in different aspects of neuronal functions30 -35 and are all down-regulated by EWS. Interestingly, elevated CHGA is an indicator for pancreas and prostate cancers. 36 Detection of SCG3 and VGF transcripts is a prognostic biomarker for small cell lung cancer and large cell neuroendocrine carcinoma,37,38 respectively. More importantly, a putative REST response element (neuron-restrictive silencer element [NRSE]) is found in the regulatory regions such as the promoter or 5′ untranslated region (5′-UTR) of each of these genes (Suppl. File S4). Most of these genes are known to be repressed by REST as well.39 -41
To test if REST is involved in the repression of these neuronal genes in Ewing sarcoma, and to validate the RNA-seq data that EWS down-regulates the same subset of neuronal genes, we performed shRNA- and siRNA-mediated silencing of EWS or REST and analyzed the expression of these genes by qRT-PCR (Fig. 3A and Suppl. Fig. S1). Stable knockdown of EWS or REST by shRNA significantly increased the expression of each of these neuronal genes in both A673 and TC71 cells (Fig. 3A and Suppl. Fig. S1A). Transient knockdown of EWS or REST using siRNA (Suppl. Fig. S1B) generated the same pattern of increased expression for each of these neuronal genes (Suppl. Fig. S1C). These findings demonstrate the repression of a subset of neuronal genes by REST in Ewing sarcoma, confirm the EWS RNA-seq results, and suggest a direct connection between EWS and REST in the regulation of neuronal gene expression.
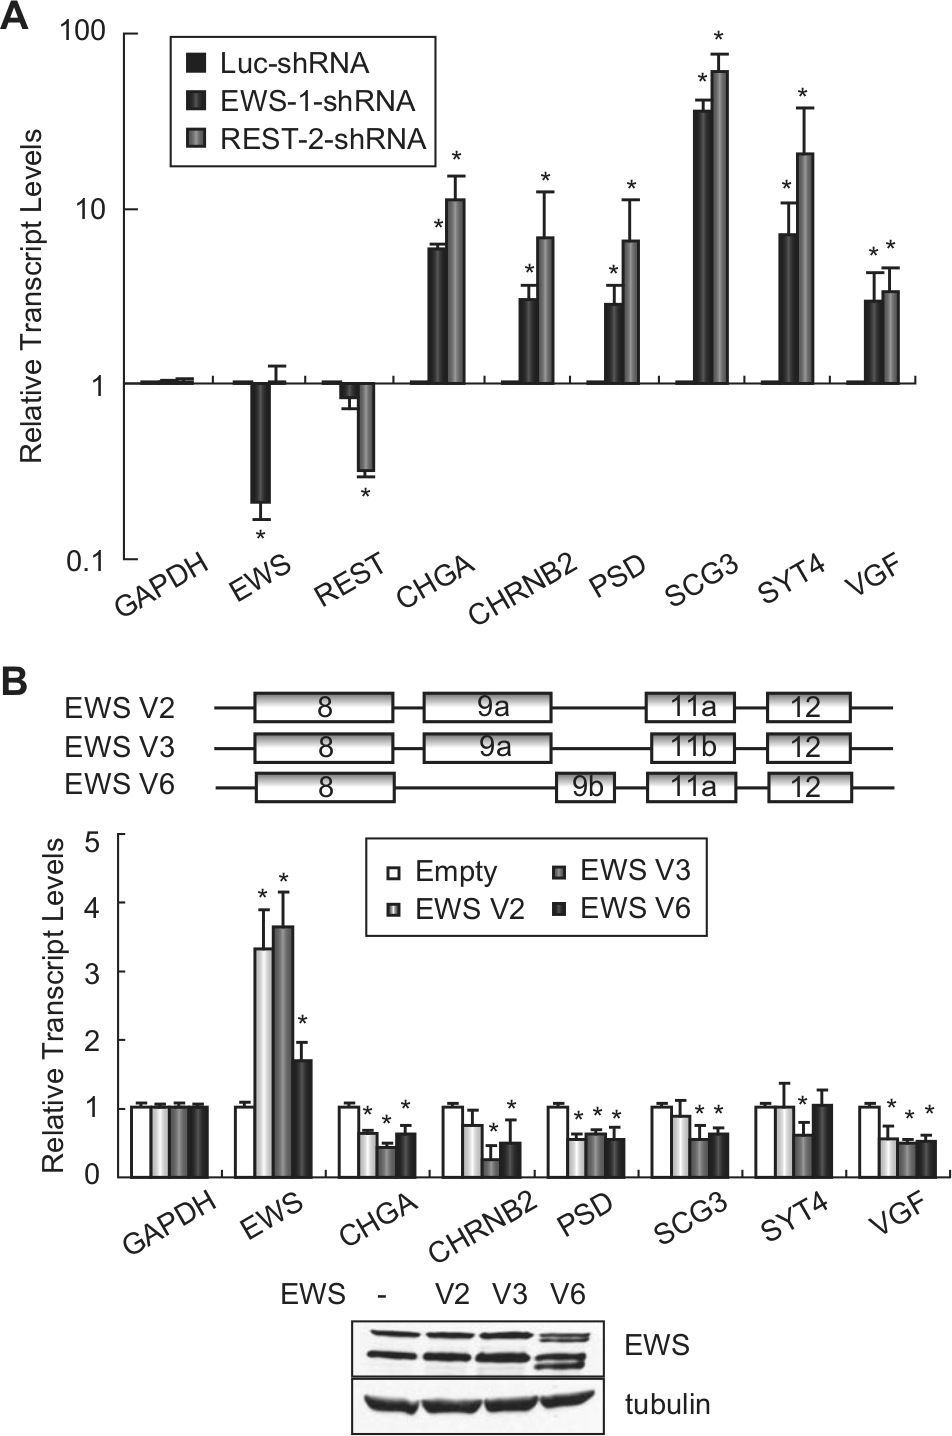
EWS and REST repress neural gene expression in Ewing sarcoma cells. (
Since knockdown of EWS increased the expression of the neuronal genes of interest, we next asked whether the overexpression of EWS would decrease the expression of these genes. There are 5 known alternative splice variants for EWS. We identified at least 3 variants during the process of cloning the EWS cDNA from A673 cells. Two variants, V2 and V3 (NM_005243.3 and NM_001163285.1), have previously been reported, and they differ only by 3 nucleotides in exon 11. The third variant, V6 (BankIt1574452 EWS JX977847), has not been identified previously. Variant V6 contains an alternative exon 9 (9b), which is 105 bases shorter than exon 9 (9a) that is found in V2 and V3 (Fig. 3B, upper panel). Following the enforced expression of each EWS isoform in A673 cells, we observed an overall repression of the neuronal genes tested to various extents (Fig. 3B, lower panel). It should be noted that the shRNA used to knock down EWS targets all 3 EWS variants and that EWS knockdown consistently increased the expression of the neuronal genes of interest (Fig. 3A). Taken together, these findings demonstrate that EWS indeed represses the set of neuronal genes tested in Ewing sarcoma cells.
EWS physically interacts with REST and binds to NRSE sites in the genome
Next, we examined the mechanism by which EWS and REST co-regulate these neuronal genes. One possibility is that EWS and REST regulate one another. However, knockdown of REST failed to change EWS levels and vice versa (Fig. 3A). EWS has previouisly been shown to regulate transcription by binding to proteins in the transcriptional machinery or to other transcription factors.42,43 REST has also been shown to require co-factor interactions to mediate the repression of its target genes.8,44 Therefore, we hypothesized that EWS and REST interact with each other to regulate the subset of neuronal genes. To test this hypothesis, we first asked whether EWS and REST physically interact in Ewing sarcoma cells. We immunoprecipitated endogenous EWS proteins from A673 cell lysates and tested for the presence of REST in the immunoprecipitates and vice versa. We found that EWS and REST co-immunoprecipitate in the reciprocal pull-downs (Fig. 4A). Domain mapping was then carried out by overexpressing flag-tagged full-length EWS, full-length EWS/FLI, which contains only the N-terminal portion of EWS, or Δ22 (a deletion mutant of EWS/FLI in which almost the entire EWS portion is deleted) (Fig. 4B) in HEK293 cells. After performing co-immunoprecipitation (co-IP), we found that full-length EWS and EWS/FLI, but not Δ22, were able to interact with REST (Fig. 4B). This indicates that the N-terminal domain of EWS is required for REST binding.
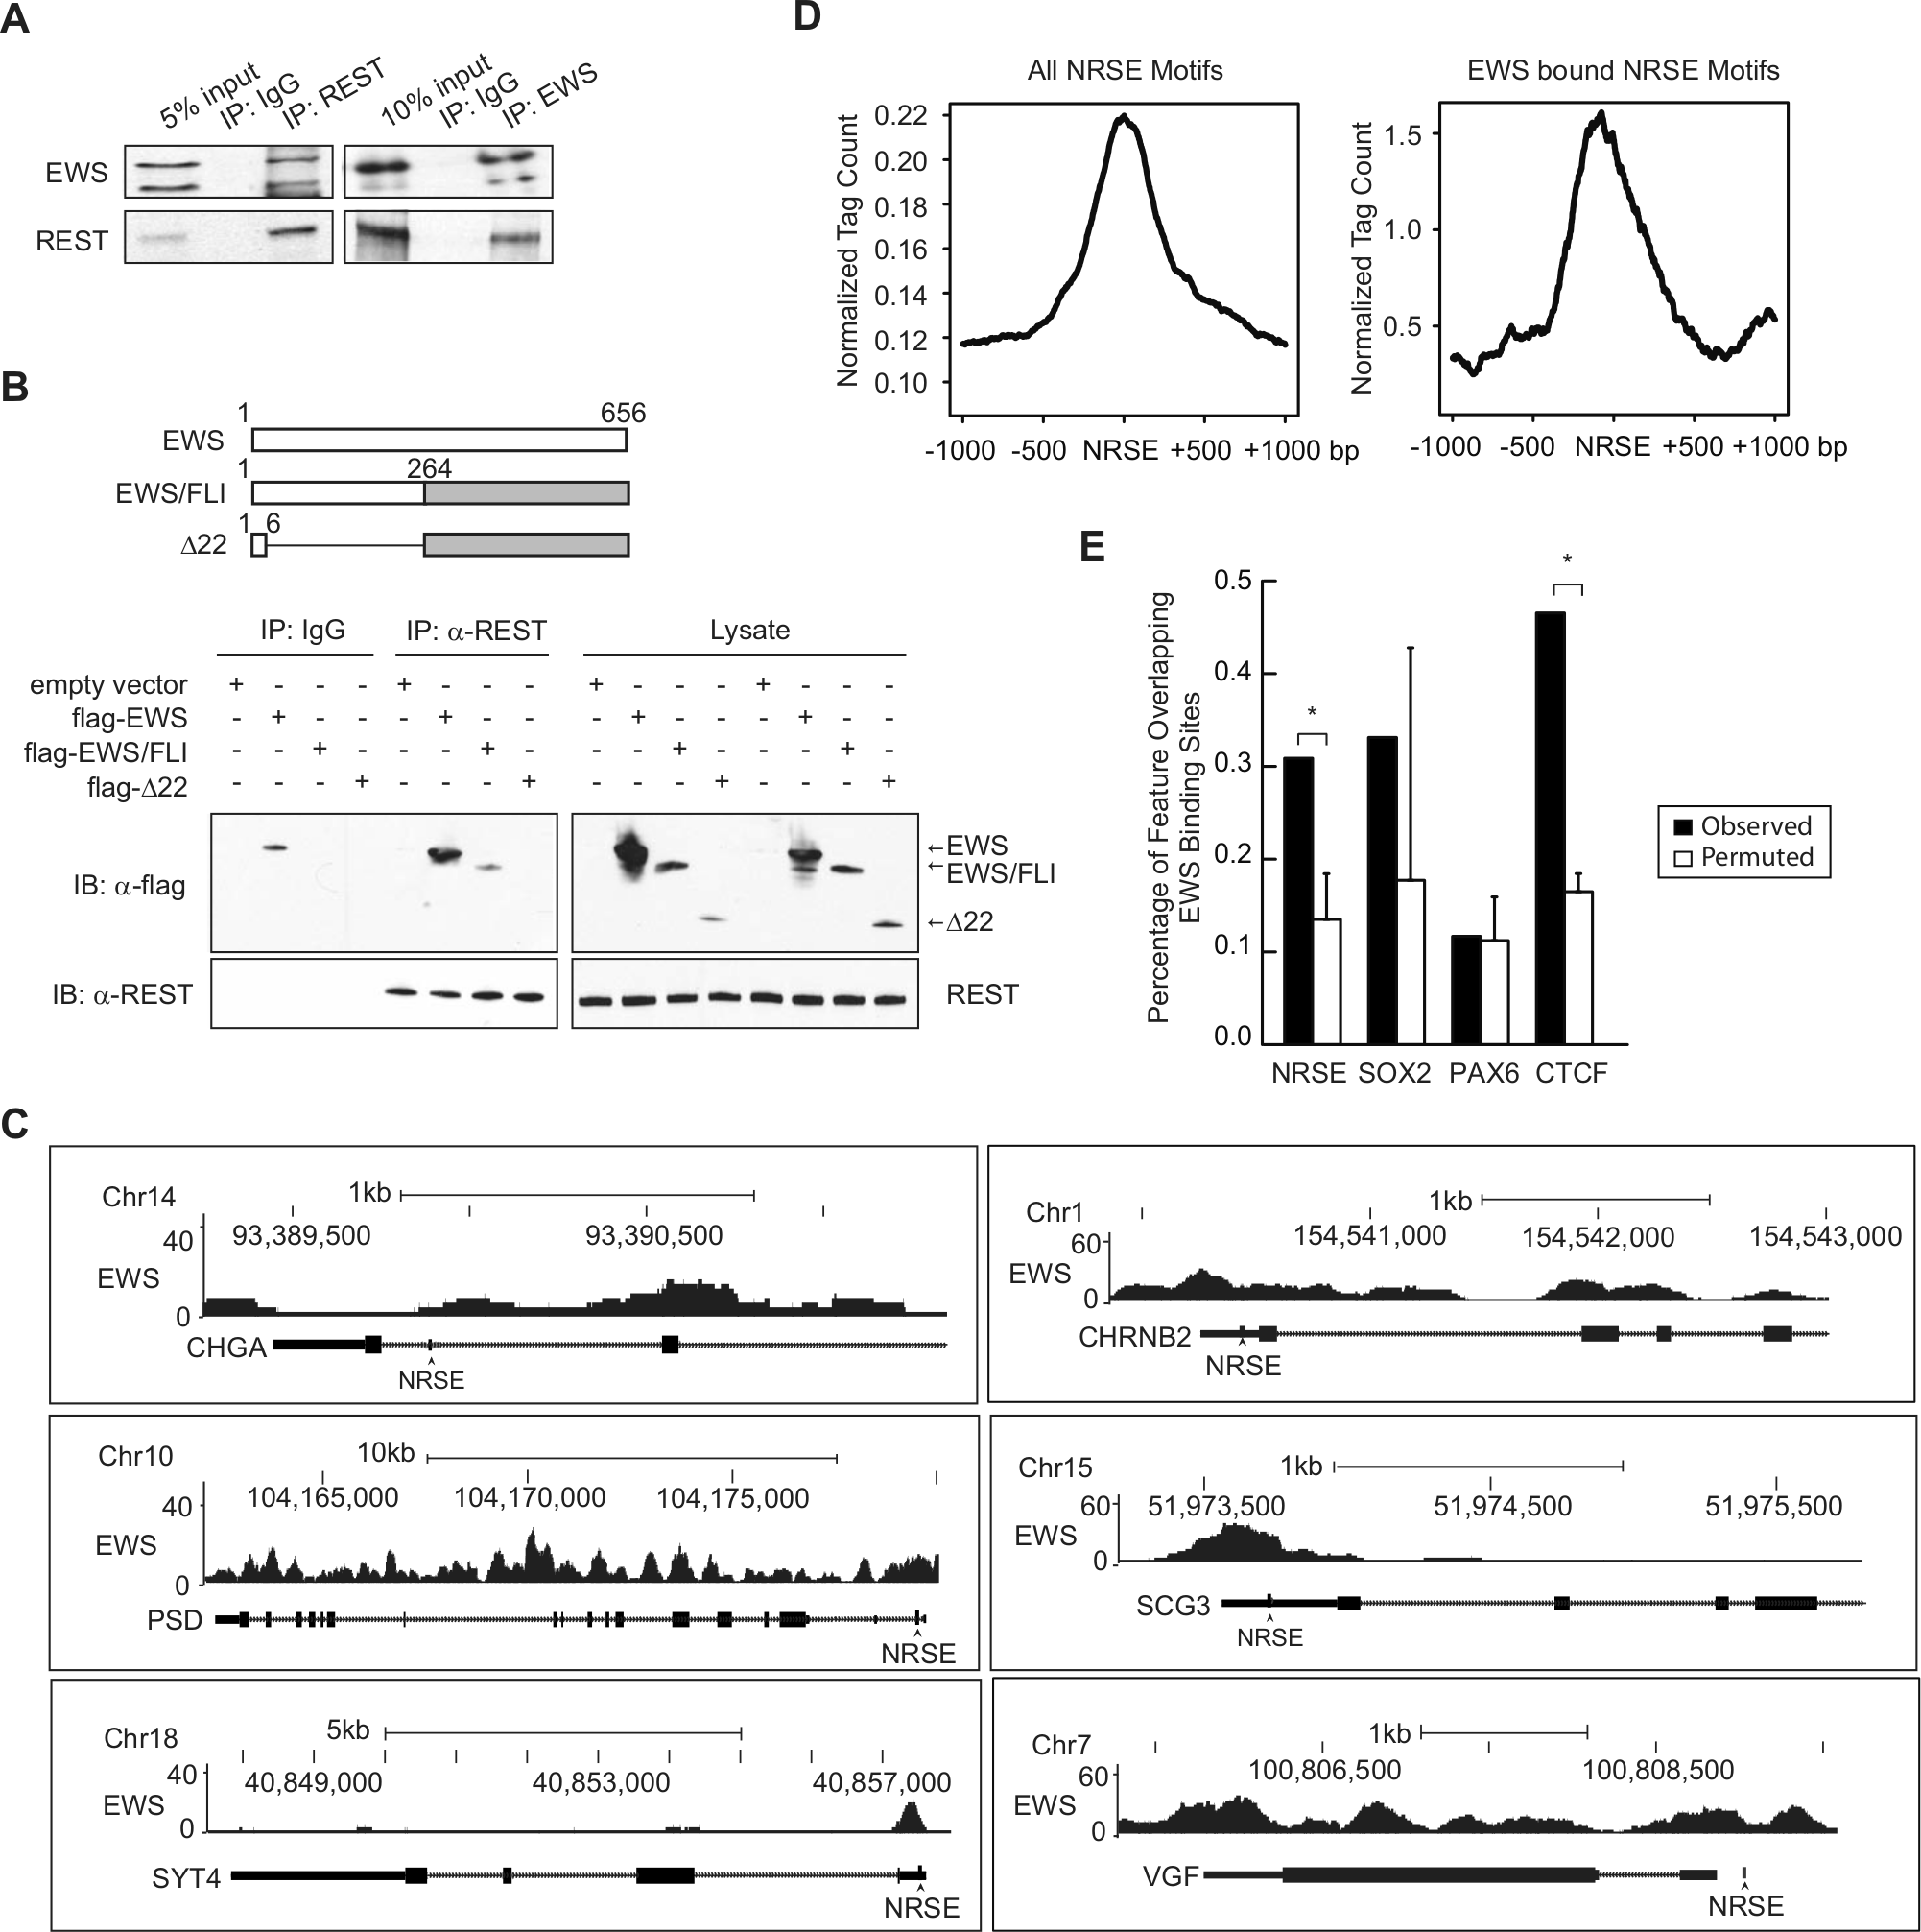
EWS physically interacts with REST and binds to chromatin regions at or near NRSE sites. (
We next reasoned that if EWS and REST regulate these neuronal genes by mutual interaction, they would closely bind to chromatin at the set of neuronal genes. To examine whether EWS contacts chromatin at the NRSE sites present in the set of neuronal genes or at NRSE sites in the genome in general, we expressed epitope-tagged EWS in Ewing sarcoma EWS502 cells in which endogenous EWS/FLI had been silenced. We performed ChIP-seq analysis 45 and observed EWS signals at regions 100 to 200 bp from the predicted NRSE sites at the neuronal genes of interest (Fig. 4C). We also observed EWS signals at other regions of some genes, which is consistent with previous findings that EWS regulates transcription and RNA splicing. We then examined EWS signals at computationally predicted NRSE sites (TTCAGCACCA/T/GC/ANGGACAGC /AG/AC/GC, N = 3-9). 40 We found that the EWS signal was enriched and centered around NRSE sites (Fig. 4D, left panel) and that the signal intensity was even greater (Fig. 4D, right panel) when the analysis was limited to algorithmically selected EWS peaks (Zero-Inflated Negative Binomial Algorithm [ZINBA] 46 ). As a validation of the signal-based enrichment of EWS at NRSE, we performed a permutation analysis of EWS binding at NRSE sites (Fig. 4E) and observed a significant association between EWS and NRSE. We also observed this relationship with the highly conserved insulator element CTCF but not the binding sites of 2 neuronal transcription factors SOX2 or PAX6 (Fig. 4E). These results suggest that EWS preferentially binds chromatin at or near NRSE sites in Ewing sarcoma cells. Taken together, our data indicate that EWS and REST interact with each other and bind chromatin at or near NRSE sites to repress the expression of the target neuronal genes.
EWS and REST inhibit the neuronal phenotype and tumorigenesis in Ewing sarcoma cells
Next, we sought to determine the biological function of the co-regulation of neuronal genes by EWS and REST. Because the depletion of EWS increases expression of the neuronal genes, we reasoned that EWS knockdown may induce a neuronal phenotype in Ewing sarcoma cells. We therefore examined the protein levels of 3 neuronal markers, β-III tubulin (TUBB3), neurofilament heavy polypeptide (NEFH), and microtubule- associated protein 2 (MAP2), following the knockdown of EWS. These 3 proteins have been previously used to assess neural differentiation in Ewing sarcoma cells.17,47 We found that silencing of EWS in both A673 and TC71 cells resulted in an increased expression level of all 3 neuronal markers (Fig. 5A). REST knockdown also caused an increase in expression of the 3 neuronal markers, which is consistent with its role in inhibiting neural differentiation. Furthermore, we observed a significant morphological change of EWS or REST knockdown cells, as demonstrated by the increase in neurite outgrowth when the cells were exposed to low-serum medium and/or nerve growth factor (20 ng/mL) (Fig. 5B). In contrast, the control knockdown cells displayed only minor morphological changes when maintained under the same conditions of neuronal differentiation. These results suggest that both EWS and REST mediate repression of the neuronal phenotype in Ewing sarcoma.
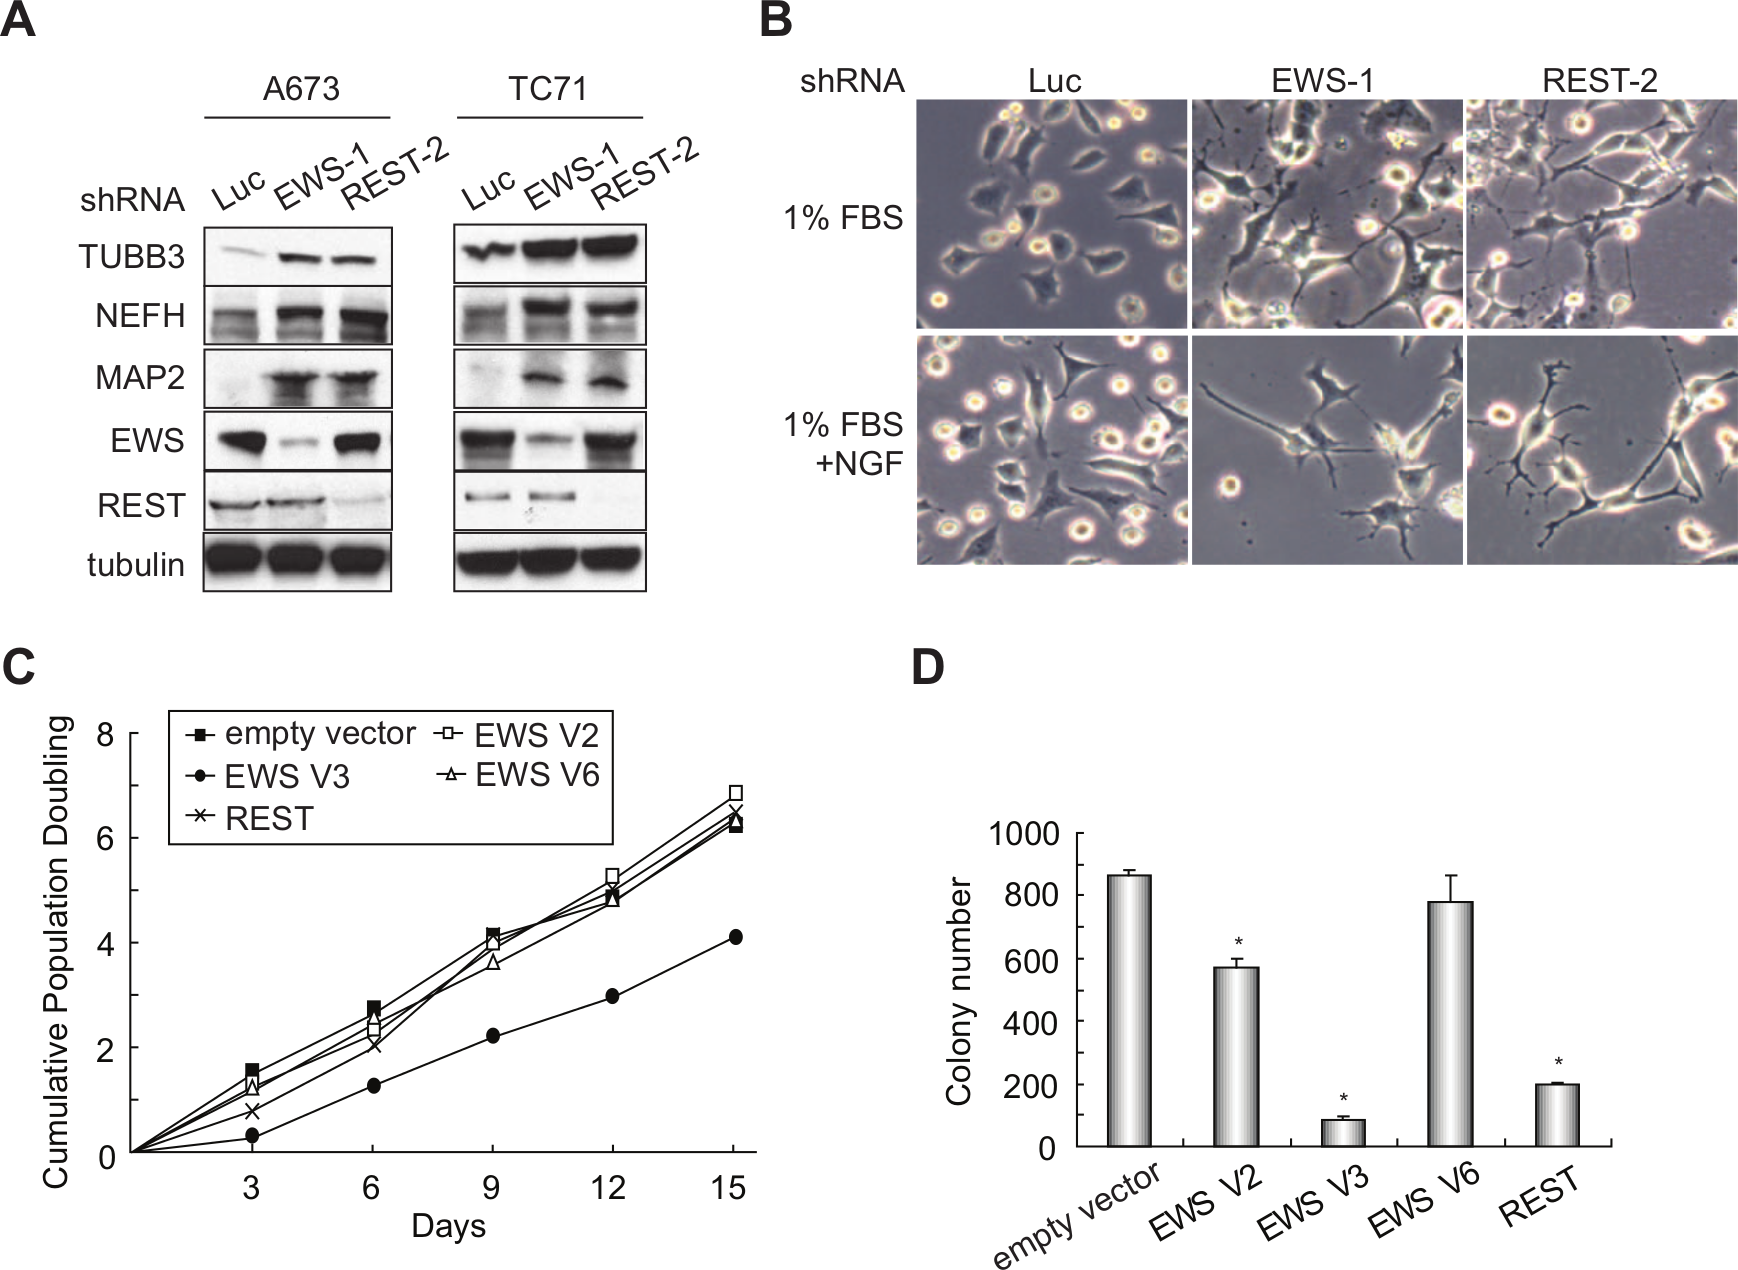
EWS and REST repress the neuronal phenotype and oncogenic transformation in Ewing sarcoma cells. (
Given that EWS is translocated in multiple cancers, and that REST has been implicated as a tumor suppressor in lung, breast, and colon cancers, we next tested whether EWS and REST inhibit tumorigenesis in Ewing sarcoma. We silenced EWS or REST by shRNA in A673 and TC71 cells and found that the cells grew similar in tissue culture and formed a similar number of colonies in soft agar as the control knockdown cells (Suppl. Fig. S2A-D). Because Ewing sarcoma cells are highly transformed at baseline, we reasoned that a decrease of the EWS or REST expression level may not result in a significant increase in colony formation. Therefore, we next enforced the expression of each of the 3 EWS isoforms or REST in A673 and TC71 cells. We also observed a similar growth rate of these cells in tissue culture compared to control cells (Fig. 5C and Suppl. Fig. S2E). However, expression of EWS V2 or V3 isoforms or REST resulted in a significant reduction in oncogenic transformation, as shown by diminished anchorage-independent growth in soft agar (Fig. 5D and Suppl. Fig. S2F). Interestingly, EWS V6 overexpression failed to inhibit colony formation in soft agar, suggesting that exon 9 in the V2 and V3 isoforms is necessary for EWS-mediated inhibition of anchorage-independent growth. These results indicate that EWS and REST inhibit the maintanence of oncogenic transformation in Ewing sarcoma.
Discussion
In the current study, we identified EWS-regulated genes and cellular processes in Ewing sarcoma by combining RNAi with RNA-seq and DAVID functional annotation analysis (Fig. 1). Interestingly, we found that the wild-type EWS and the fusion oncoprotein EWS/FLI have significantly overlapping profiles of transcriptional regulation and that they have opposite effects on some genes and similar effects on others (Fig. 2). Several previous reports have shown that EWS/FLI interferes with EWS functions in splicing, transcription, and maintanence of genomic stability12,48 via its interaction with EWS. However, functional regulation in the same manner by EWS and EWS/FLI has not previously been reported. Given the domain structure of the 2 proteins (Fig. 4B), it is tempting to speculate that the similar regulation of genes by EWS and EWS/FLI may be mediated by their identical N-terminal domains, which has been shown to display transcriptional activation as well as repression activity 49 and is able to bind to proteins in the transcriptional initiation complex. 5
We focused on a subset of EWS-regulated neuronal genes in this report and found that EWS cooperates with REST to repress the neuronal phenotype (Figs. 3 -5). Interestingly, in addition to Ewing sarcoma, 2 other EWS translocation–based tumors, desmoplastic small round cell tumor and extraskeletal myxoid chondrosarcoma, also show neuronal features such as the expression of neuron-specific enolase.50,51 This supports the notion that EWS represses the neuronal phenotype, and therefore, loss of EWS leads to acquiring neuronal features in these cancers. Further studies are required to fully understand the mechanism by which EWS and REST cooperatively regulate these neuronal genes. One candidate mechanism is epigenetic regulation of these genes by EWS and REST. EWS has previously been shown to inhibit the HAT activity of CBP/p300 via its interaction with noncoding RNA. 8 Interestingly, REST/coREST/LSD1 and the PRC2 complex (Polycomb Repressive Complex 2), 2 histone-modifying complexes, were found to simultaneously tether to the long, noncoding RNA, HOTAIR, to mediate coupled histone H3K27 methylation and K4 demethylation. 52
In addition to EWS and REST, EWS/FLI was also found to regulate the neuronal phenotype development in Ewing sarcoma. A previous report suggested that EWS/FLI induces neuronal features by up-regulation of an array of genes important for neural crest development, such as EGR2, MSX1, CITED2, c-Myc, ID2, Cadherin 11, RUNX3, and Rho family members. 17 Although EWS and EWS/FLI may regulate the neuronal phenotype via different pathways, their opposite effects may explain how Ewing sarcoma family tumors exhibit varying levels of neural differentiation. Increased relative EWS/FLI levels would result in tumors with a more neuronal phenotype such as pPNET, whereas higher EWS expression would cause a reduced neuronal phenotype as observed for Ewing sarcoma.
Another important finding of this article is that both EWS and REST inhibit oncogenic transformation in Ewing sarcoma. EWS has not previously been implicated in tumor suppression except that it has been shown to control cell proliferation via posttranscriptional regulation of the Akt substrate PRAS40. 53 Dysfunction of REST is evident in several cancers and is achieved through diverse mechanisms. In prostate cancer, loss of REST results in the derepression of IB1/JIP1 (Islet-Brain1/c-Jun amino-terminal kinase interacting protein 1) to prevent JNK activation and apoptosis. 54 Impaired REST function in the breast cancer model stimulates the phosphorylation of Akt and leads to increased PI3-kinase signaling. 24 REST activity has also been shown to be affected by the changes in the availability of REST/co-factor complexes. 55 Based on our data, it is possible that the haploinsufficency of EWS in Ewing sarcoma decreases the abundance of the REST/EWS complex and abolishes REST activity on downstream effectors, leading eventually to tumorigenesis. Since EWS and EWS/FLI have been shown to interact, it is possible that EWS exerts a dominant-negative effect on EWS/FLI and therefore decreases colony formation in soft agar. The underlying mechanism of EWS- and/or REST-mediated inhibition of oncogenic transformation is under investigation.
Our findings that EWS and REST play roles in both repressing neuronal differentiation and inhibiting oncogenic transformation raise an interesting question of whether it is rational to see a neuronal phenotype in rapidly proliferating cancer cells. Indeed, both colon and breast cancers with REST deletion can display some neuroendocrine features. 26 Also, it is well documented that many neuroendocrine genes are aberrantly expressed in small cell lung cancer. 25 It has been postulated that when REST activity is lost in the precursor cells of these tumors, some neuronal genes are expressed outside their normal context. If the loss of REST activity is incomplete, such as the decrease in REST/co-factor abundance due to the haploinsufficiency of the co-factor, cancer cells may more closely resemble poised neural progenitor cells than mature neurons, remaining in the cell cycle but allowing the expression of some REST target genes. This transdifferentiation phase is very close to what we observe in Ewing sarcoma in which a highly undifferentiated phenotype coexists with neuronal features.
As indicated in our functional annotation analysis, EWS is also involved in the regulation of genes in other aspects of tumor development, such as angiogenesis and invasion. This suggests a more complex and broader impact of EWS on cancer development. A thorough study on EWS and its downstream effectors will benefit patients with Ewing sarcoma and other EWS translocation–based cancers.
Materials and Methods
Cell lines
Ewing sarcoma cell lines A673, TC71, and EWS502 were purchased from American Type Culture Collection (ATCC, Manassas, VA) and grown as previously described. 56 Growth curve and soft agar colony formation assays were performed as previously described. 2
Constructs
To clone the 3xFlag EWS construct, full-length EWS was amplified by PCR using the cDNA library from A673 cells. EWS was then fused in-frame with the 3xFlag tag and cloned into the pQCXIN vector. Constructs for the 3 EWS isoforms were generated by the amplification of individual EWS cDNA for each isoform, followed by ligation into the pMSCV-neo vector. The pMSCV-hygro 3xFlag EWS/FLI and mutant Δ22 have been previously described. 57
RNAi
A human EWS-specific 19-mer oligonucleotide, 5′-gactctgacaacagtgcaa-3′, that maps to nucleotides 1083 to 1102 of the EWS gene was inserted into the pMKO.1-puro vector for stable knockdown of EWS. The nucleotide for REST knockdown is 5′-gaaactttgaacaaggttt-3′. Vectors for control (Luc-RNAi) knockdown and production of retrovirus-expressing shRNA have previously been described. 1 siRNA for transient knockdown of EWS or REST was purchased from Dharmacon (Thermo Scientific, Rockford, IL).
RT-PCR
RT-PCR was performed using the iScript SYBR green RT-PCR kit (Bio-Rad, Hercules, CA) according to the manufacturer’s instructions. Primer sequences are available in Supplementary File S5.
RNA-seq and data analysis
Total RNA was extracted from Ewing sarcoma cells and treated with DNase using the Qiagen RNeasy kit (Germantown, MD). mRNA was enriched by oligo-dT magnetic beads and was used to construct Illumina (San Diego, CA) sequencing libraries. The libraries were single-end sequenced on Illumina Genome Analyzer IIx for 36 cycles (EWS) or HiSeq 2000 for 50 cycles (EWS/FLI). Reads were mapped to the hg19 genome build with Casava (Illumina) for EWS or Novoalign (Novocraft, Petaling Jaya, Malaysia) for EWS/FLI. The RNA-seq analysis was carried out using USeq (useq.sourceforge.net) versions 8.1.5 for EWS and 8.3.9 for EWS/FLI. Sorted, mapped files were converted to PointData representation with the USeq Eland Parser application for EWS and SAM Parser for EWS/FLI (useq.sourceforge.net). The knockdowns were compared with control using either Defined Region Scan Seqs (EWS) or Overdispersed Region Scan Seqs (EWS/FLI) applications with default parameters and a gene reference file derived from a merger of Ensembl and RefSeq (using a USeq Merge UCSC Gene table). Differential expression was defined as EWS: FDR ≤ 0.05 and |log2 fold change| ≥ 1.3 and EWS/FLI: FDR ≤ 1e-20 and |log2 fold change| ≥ 2.
GSEA and χ2 testing
EWS gene sets, both the up- regulated and down-regulated, were divided according to their corresponding log fold change in the EWS/FLI RNA-seq experiment. Gene set enrichment was determined using GSEA. 58 To quantitatively establish enrichment of the EWS-regulated genes in the EWS/FLI–up-regulated and –down-regulated genes, we applied a χ2 test as described previously 29 and calculated the enrichment score separately for EWS/FLI–up-regulated and –down-regulated genes.
ChIP-seq and data analysis
ChIP-seq analysis was performed as described previously. 45 NRSE, SOX2, PAX6, and CTCF motif locations were derived from MotifMap (motifmap.ics.uci.edu). 59 EWS peaks were permuted 1,000 times over the mappable genome (hg19) and assayed for overlap with the NRSE, SOX2, PAX6, and CTCF sites.
Immunoprecipitation and immunoblotting
Immunoprecipitation and immunoblotting were carried out as described previously. 2 Anti-TUBB3 (MAB1195) and anti-NEFH (AF3108) were from R&D Systems (Minneapolis, MN), anti-MAP2 (Ab32454) was from Abcam (Cambridge, MA), and anti-REST (sc-374611), anti-EWS (sc-48404), and normal mouse IgG (sc-2025) were from Santa Cruz Biotechnology (Santa Cruz, CA).
Footnotes
Acknowledgements
The authors thank Brian Dalley and the microarray core facility for help in performing the RNA-seq, Brett Milash for suggestions in data presentation, Ken Boucher for help in statistical analysis, Lessnick laboratory members for helpful discussions, and Drs. Michael Engel and Michael Monument for critical reading of the article and helpful suggestions.
Declaration of Conflicting Interests
The author(s) declared no potential conflicts of interest with respect to the research, authorship, and/or publication of this article.
Funding
The author(s) received the following financial support for the research, authorship, and/or publication of this article: This work was supported by NIH/NCI grants R01 CA140394 (to S.L.L.) and P30 CA042014 (to Huntsman Cancer Institute). S.S. acknowledges support from the Howard Hughes Medical Institute’s Med into Grad program at the University of Utah (U2M2G). I.J.D. gratefully acknowledges support from the NCI/NIH (K08CA100400), the V Foundation for Cancer Research, the Rita Allen Foundation, and the Corn-Hammond Fund for Pediatric Oncology.
Notes
References
Supplementary Material
Please find the following supplemental material available below.
For Open Access articles published under a Creative Commons License, all supplemental material carries the same license as the article it is associated with.
For non-Open Access articles published, all supplemental material carries a non-exclusive license, and permission requests for re-use of supplemental material or any part of supplemental material shall be sent directly to the copyright owner as specified in the copyright notice associated with the article.