
Abstract
The c-Myb transcription factor is an important regulator of hematopoietic cell development. c-Myb is expressed in immature hematopoietic cells and plays a direct role in lineage fate selection, cell cycle progression, and differentiation of myeloid as well as B- and T-lymphoid progenitor cells. As a DNA-binding transcription factor, c-Myb regulates specific gene programs through activation of target genes. Still, our understanding of these programs is incomplete. Here, we report a set of novel c-Myb target genes, identified using a combined approach: specific c-Myb knockdown by 2 different siRNAs and subsequent global expression profiling, combined with the confirmation of direct binding of c-Myb to the target promoters by ChIP assays. The combination of these 2 approaches, as well as additional validation such as cloning and testing the promoters in reporter assays, confirmed that MYADM, LMO2, GATA2, STAT5A, and IKZF1 are target genes of c-Myb. Additional studies, using chromosome conformation capture, demonstrated that c-Myb target genes may directly interact with each other, indicating that these genes may be coordinately regulated. Of the 5 novel target genes identified, 3 are transcription factors, and one is a transcriptional co-regulator, supporting a role of c-Myb as a master regulator controlling the expression of other transcriptional regulators in the hematopoietic system.
Introduction
The transcription factor c-Myb, initially identified as the cellular homolog of the avian oncogene v-Myb, is a key regulator of stem and progenitor cells in bone marrow, colonic crypts, and a neurogenic region in the adult brain.1,2 Despite its involvement in diverse developing systems, the requirement for c-Myb is most evident in the hematopoietic system.2,3 In this system, expression of c-Myb is essential for proper development, as demonstrated by the embryonic lethality of c-myb−/− mice, caused by a failure of fetal liver hematopoiesis. 4 Subsequent studies using animals expressing hypomorphic mutants of c-myb or chimeric animals with c-myb−/− ES cells acting as donors indicated that c-Myb is involved at multiple stages of hematopoiesis, being required for the development of hematopoietic precursors rather than for their generation.5-7 Development of both myeloid and lymphoid (B and T) progenitor cells depends on c-Myb.8-11 c-Myb levels must be down-regulated for terminal differentiation to occur. The maintenance of high levels of c-Myb, or its exogenous overexpression, suppresses normal differentiation and can promote leukemic transformation.2,3 As expected, due to the importance of adequate levels of c-Myb during the different stages of hematopoiesis, its expression and activity are finely tuned by protein-protein interactions,12-17 posttranslational modifications,14,18-20 and, as has been recently shown, miRNA-mediated down-regulation.21,22
The identification of genes targeted by c-Myb is essential for our understanding of the wide action of this transcription factor during development. The efforts of many laboratories have during the years accumulated a reasonable catalog of target genes. Recently, several global studies have appeared, contributing massively to the list of target candidates. In the FANTOM4 study, the human monocytic cell line THP-1 was analyzed in detail during PMA-induced differentiation. 23 Using deep sequencing, transcription start site usage was measured and combined with computational analysis of promoter regions. Systematic siRNA knockdown of 52 transcription factors, including c-Myb, confirmed the roles of individual factors in the regulatory networks. Predicted c-Myb targets were found associated with cell cycle–related functions and also enriched specifically for microtubule-cytoskeleton–associated genes. 23 In a search for target genes, Bianchi et al. silenced c-Myb in human CD34+ hematopoietic stem/progenitor cells and analyzed the effects by gene expression profiling and computational analysis of promoter regions. 24 Two transcription factors, Kruppel-like factor 1 (KLF1) and LIM domain only 2 (LMO2), were identified as putative targets and further validated. Quintana et al. used chromatin immunoprecipitation (ChIP) and promoter tiling arrays as an approach to identify endogenous c-Myb target genes in human MCF-7 breast cancer cells. 25 The c-Myb protein was found associated with over 10,000 promoters. One target gene, CXCR4, was studied in detail. Zhao et al. also used ChIP, followed by massively parallel sequencing (ChIP-Seq) in an engineered ERMYB myeloid progenitor cell line expressing a truncated c-Myb–ER fusion protein. 26 Myb bound directly near or within 793 regulated genes. The authors also found Myb to repress approximately half of its direct targets. 26 The overall picture is that these studies have identified different catalogs of genes, where there is some but variable overlap between the individual studies. Despite significant progress, a convincing consensus list is still lacking, and additional, robust datasets are needed to fully uncover the gene programs controlled by c-Myb.
The objective of the present study was to search for relevant new targets of c-Myb in the hematopoietic system by combining changes in gene expression as a result of specific knockdown of c-Myb by RNAi, with the demonstration of c-Myb occupancy on the promoters by ChIP. As a model system, we use the erythroleukemic cell line K562, a pluripotent precursor that can differentiate towards different lineages (erythrocytes, megakaryocytes, and macrophages), processes in which c-Myb has been described to have an important role.22,27 Here, we describe a set of genes that are significantly down-regulated after c-Myb ablation and show that c-Myb binds to and induce the activation of their promoters, demonstrating that these genes are bona fide c-Myb target genes. Among the identified genes, we found some encoding important hematopoiesis-related transcription factors (STAT5A, GATA2, and IKZF1) and genes crucial for myeloid differentiation (LMO2 and MYADM). Analysis of the LMO2 gene long-distance interactions carried out using chromosome conformation capture techniques suggests that there is a spatial communication between certain c-Myb target genes. Moreover, the importance of these c-Myb target genes during hematopoiesis suggests a role of c-Myb as a master regulator, controlling different steps during lineage commitment in hematopoiesis.
Results
Specific knockdown of c-Myb
With the aim of expanding our catalog of bona fide c-Myb targets in the hematopoietic system, we analyzed global changes in gene expression after c-Myb–specific knockdown. We reasoned that because c-Myb expression is down-regulated during the differentiation of hematopoietic cells, using a knockdown approach would be close to physiological conditions. The cell line selected for this analysis was the erythropoietic cell line K562. The expression of c-Myb in this cell line is relatively high, 28 and has been shown to be essential for cell proliferation. 29 c-Myb knockdown was performed by transfection with 2 different siRNAs: si323 and si2992 (the numbers refer to their position relative to the start codon of human MYB mRNA). The si323 RNA binds to a region included in the ORF of the MYB mRNA, while the si2992 RNA binds to the 3′UTR (sequence and relative position of the siRNAs are indicated in Fig. 1A). As shown in Figure 1B, both siRNAs have a similar efficiency in c-Myb knockdown, causing a decrease of c-Myb protein levels of approximately 90%. The lower effect observed at mRNA level, only approximately 50% decrease (Fig. 1C), might be due to an incomplete degradation of the mRNA. Because the amplicon size for quantitative RT-PCR is relatively small, approximately 100 nt, a partial degradation of the mRNA might still give some RT-PCR signal. Nevertheless, because we were looking for c-Myb target genes, the strong decrease in protein level (~90%) should result in significant alterations in c-Myb–dependent gene expression.
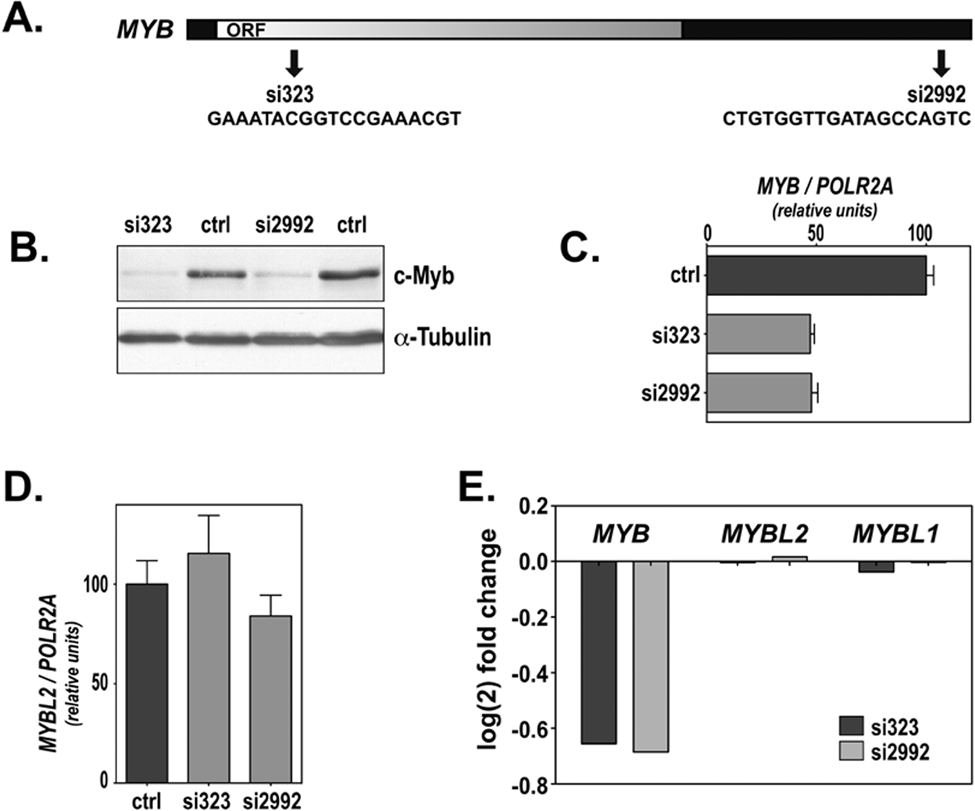
Description of the siRNAs. (A) Graphic representation of the localization and sequence of the c-Myb siRNAs used in this study. (B) Western analysis of protein levels 24 hours after siRNA-mediated knockdown of c-Myb. Protein extracts (50 µg) were subjected to Western analysis with H141 (anti–c-Myb antibody). The blot was also probed with α-tubulin antiserum for loading control. (C) MYB mRNA expression in K562 cells 24 hours after transfection with si323 and si2992. The mRNA expression was measured by qRT-PCR, as described in Materials and Methods, and represented as percentage of expression in control K562 cells (transfected with siLuc). (D) MYBL2 mRNA expression was not affected by the transfection of K562 cells with c-Myb siRNAs si323 and si2992. The expression of MYBL2 was measured by qRT-PCR 24 hours after transfection of K562 cells and represented relative to the levels of expression in K562 cells transfected with siLuc (C). (E) Log2 of the fold change in the expression of the 3 members of the MYB family in the microarray analysis.
To ensure the specificity of knockdown, we analyzed the expression levels of 2 closely related genes, the other 2 members of the Myb family, A-Myb (MYBL1) and B-Myb (MYBL2) in K562 cells, after transfection with the siRNAs used in this study. Analysis by qRT-PCR indicated that among the 3 members of the Myb family, MYB mRNA is the most abundant in K562 cells; MYBL2 mRNA exhibits an approximately 4-fold lower expression level, and the MYBL1 expression is in the order of 800 to 900 times lower than MYB mRNA (data not shown). The low level of expression of A-Myb in K562 cells excluded the likelihood of its interference with our study. However, because MYBL2 mRNA was relatively abundant, we analyzed whether our siRNAs had any effect on MYBL2 mRNA expression. None of the siRNAs used in this study (si323 and si2992) caused any significant alteration on MYBL2 mRNA levels (Fig. 1D), demonstrating their specificity towards MYB mRNA. Supporting this, no effect was observed for MYBL1 or MYBL2 mRNA levels in the microarray datasets (Fig. 1E). Therefore, the global changes in gene expression after si323 or si2992 RNA transfection would be the response of specific c-Myb knockdown, excluding effects derived from alterations of the other 2 family members.
Effect of c-Myb knockdown on global gene expression: defining the group of most regulated genes
Having validated the efficiency and specificity of the 2 siRNAs, we analyzed the global effects of c-Myb knockdown using microarray expression profiling by comparing genome-wide patterns of gene expression between control and c-Myb-siRNA–transfected K562 cells. The control K562 cells were transfected with a nonspecific siRNA (siLuc; targeting the firefly luciferase gene). Given the fact that various c-Myb target genes might differ in their c-Myb dose dependency and the fact that c-Myb was not completely knocked out, we expected some of the real target genes to show only moderate levels of regulation. In order to detect also small but significant variations in gene expression, we performed a first profiling experiment using a high number of biological replicates. Figure 2A shows an MA plot of the microarray expression data obtained after si323 RNA-mediated knockdown. The MA plot is generated on normalized data from 8 biological replicates and demonstrates that most genes in the microarray experiments are unaffected by the c-Myb knockdown, as would be expected. A second expression profiling study with the si2992 RNA-mediated knockdown and 4 biological replicates was used to validate the regulated genes detected in the first dataset. After statistical analysis of the results from each of the experiments using permutation F2 tests, in which residuals were shuffled 5,000 times, and family-wise error correction, significantly regulated genes (P < 0.05) were selected.
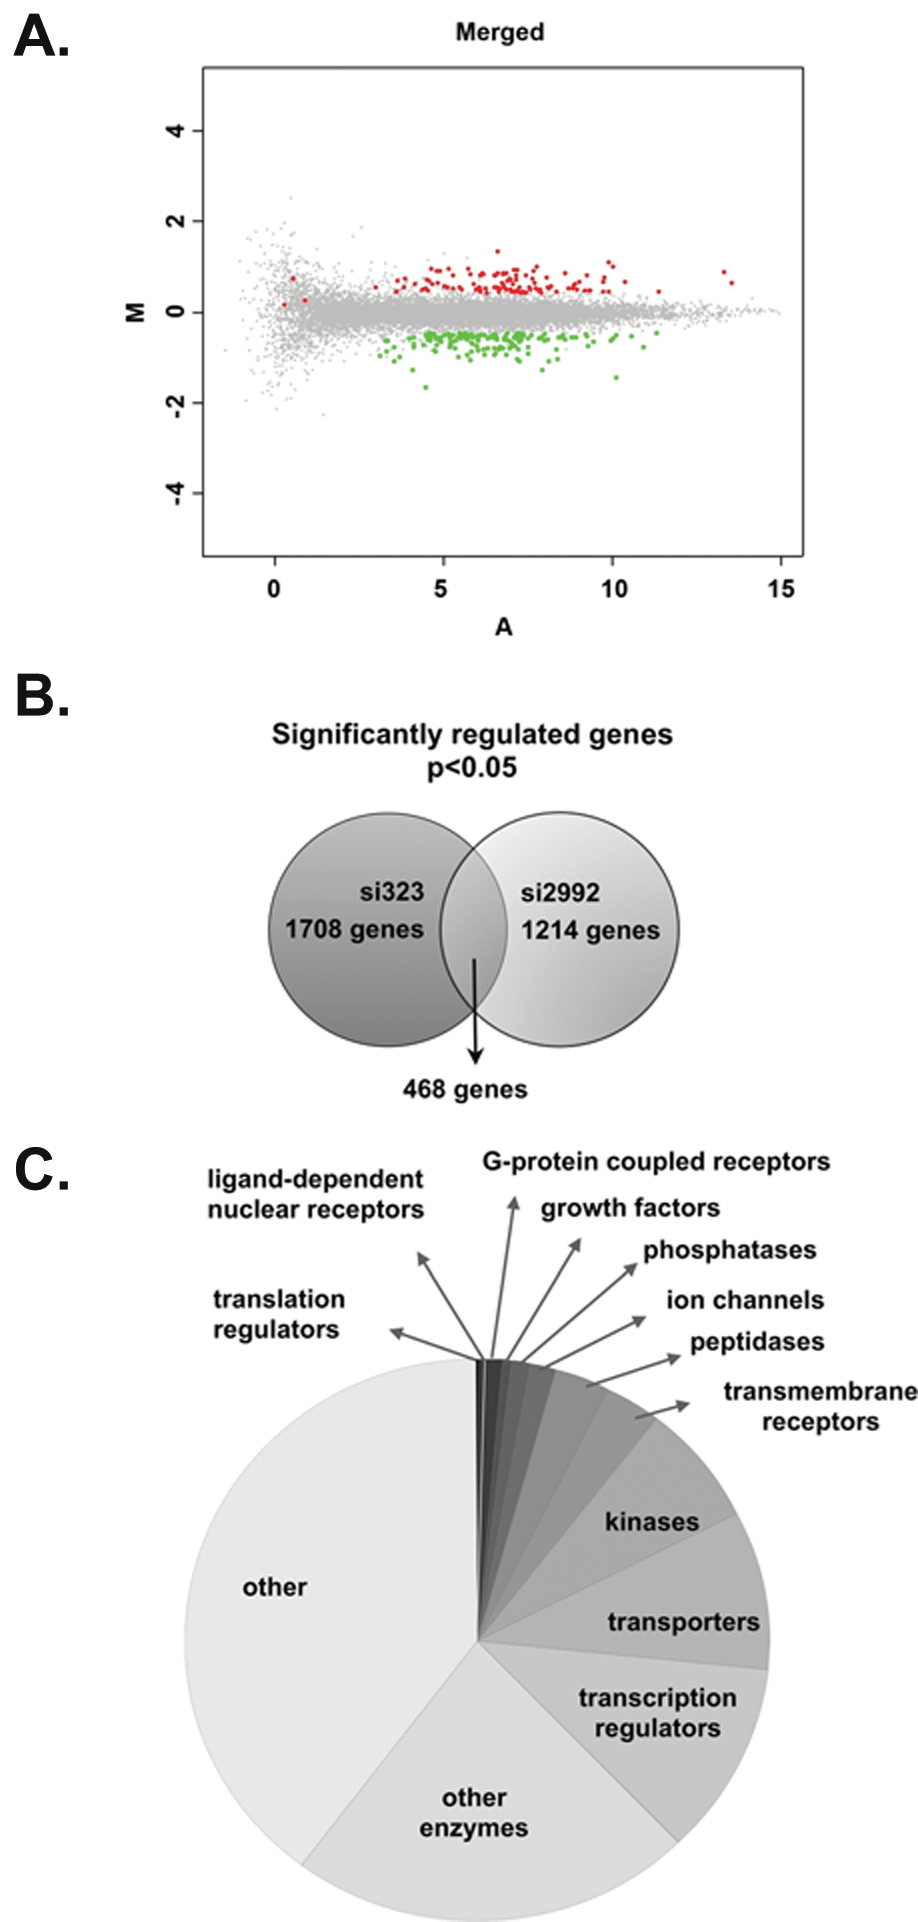
Classification of the regulated genes. (A) MA plots 52 generated from 8 biological samples were M = log2R − log2G and A = 1/2 × (log2R + log2G). (B) Venn diagram indicating the number of genes significantly regulated in each microarray study (knockdown with si323 and si2992) and the overlap between the 2 sets of regulated genes after c-Myb knockdown in K562 cells. (C) Pie chart representing major functional protein groups found among the encoding genes regulated by c-Myb knockdown.
When comparing the 2 datasets (si323 and si2992), 468 genes turned out to be significantly regulated in both experiments (Fig. 2B). The number of common genes between the datasets was approximately 30%. A more detailed analysis of the significantly regulated, nonoverlapping genes from the first profiling experiment (si323) indicated that despite showing the same pattern of regulation in the second experiment (si2992), 525 genes passed the stringent statistical analysis only in the first profiling experiment. It is noteworthy that previously validated c-Myb target genes, such as MYC and ADA, were found within this group. This reinforces the idea that the genes found significantly regulated in both datasets are indeed regulated by c-Myb. Nevertheless, 40% of the genes (715 genes) that were regulated in the first profiling experiment using si323 were not confirmed by the second one. This discrepancy is likely due to “off-target” effects of the si-RNAs, a phenomenon that has been described in several studies on RNA interference.30-33 However, the combination of 2 independent profiling experiments, using 2 different siRNAs targeting different regions of MYB, and subsequent selection of genes that are regulated by both siRNAs only, is expected to significantly reduce the incidence of false positives derived from such “off-target” effects.
Among the 468 genes significantly regulated after c-Myb knockdown by both siRNAs, 228 genes were down-regulated, and 240 were up-regulated. The 50 most regulated genes from each group are given in Supplementary Table S1. Because transcriptional activation traditionally is regarded as the central biological function of c-Myb, we chose to focus on the genes that were down-regulated after c-Myb knockdown. The 20 most regulated genes in this group are presented in Table 1. This list contains crucial genes, such as LMO2 (LIM domain only 2) and MYADM (myeloid-associated differentiation marker), both described to have an important role during the differentiation of hematopoietic cells.34,35 For this reason, we decided to study these 2 genes further as representatives of highly regulated Myb targets. First, we verified their response to c-Myb knockdown by qRT-PCR. As shown in Figure 3A, both MYADM and LMO2 mRNA levels decreased after c-Myb knockdown in K562 cells. Analysis of the 5′ flanking promoter regions of both genes revealed the presence of several putative MREs (Fig. 3B). To determine if these response elements were functional, we studied the effect of c-Myb on the activity of these regulatory regions in reporter assays. The MYADM and LMO2 promoter regions (approx. −1500 to +500 bp relative to TSS) were subcloned into the luciferase reporter plasmid pGL3 basic (Fig. 3B). The reporter constructs were co-transfected together with increasing concentrations of a c-Myb expression plasmid in CV-1 cells. For this, we used a sumoylation-deficient c-Myb mutant, c-Myb-2KR, resembling active c-Myb.18,20 Under these conditions, we observed a clear dose-dependent stimulation of both the MYADM promoter– and the LMO2 promoter–driven reporters. Linear regression analysis of the reporter assay data (Suppl. Fig. S1) showed that LMO2 and MYADM displayed a slope of activation of 33.3 and 19.9 RLU/ng, respectively (Fig. 3C), equal to or higher than the 3×MRE positive control. The responsiveness of these promoters to c-Myb supports the profiling experiments, suggesting that MYADM and LMO2 may be c-Myb target genes.
20 Most Down-Regulated Genes
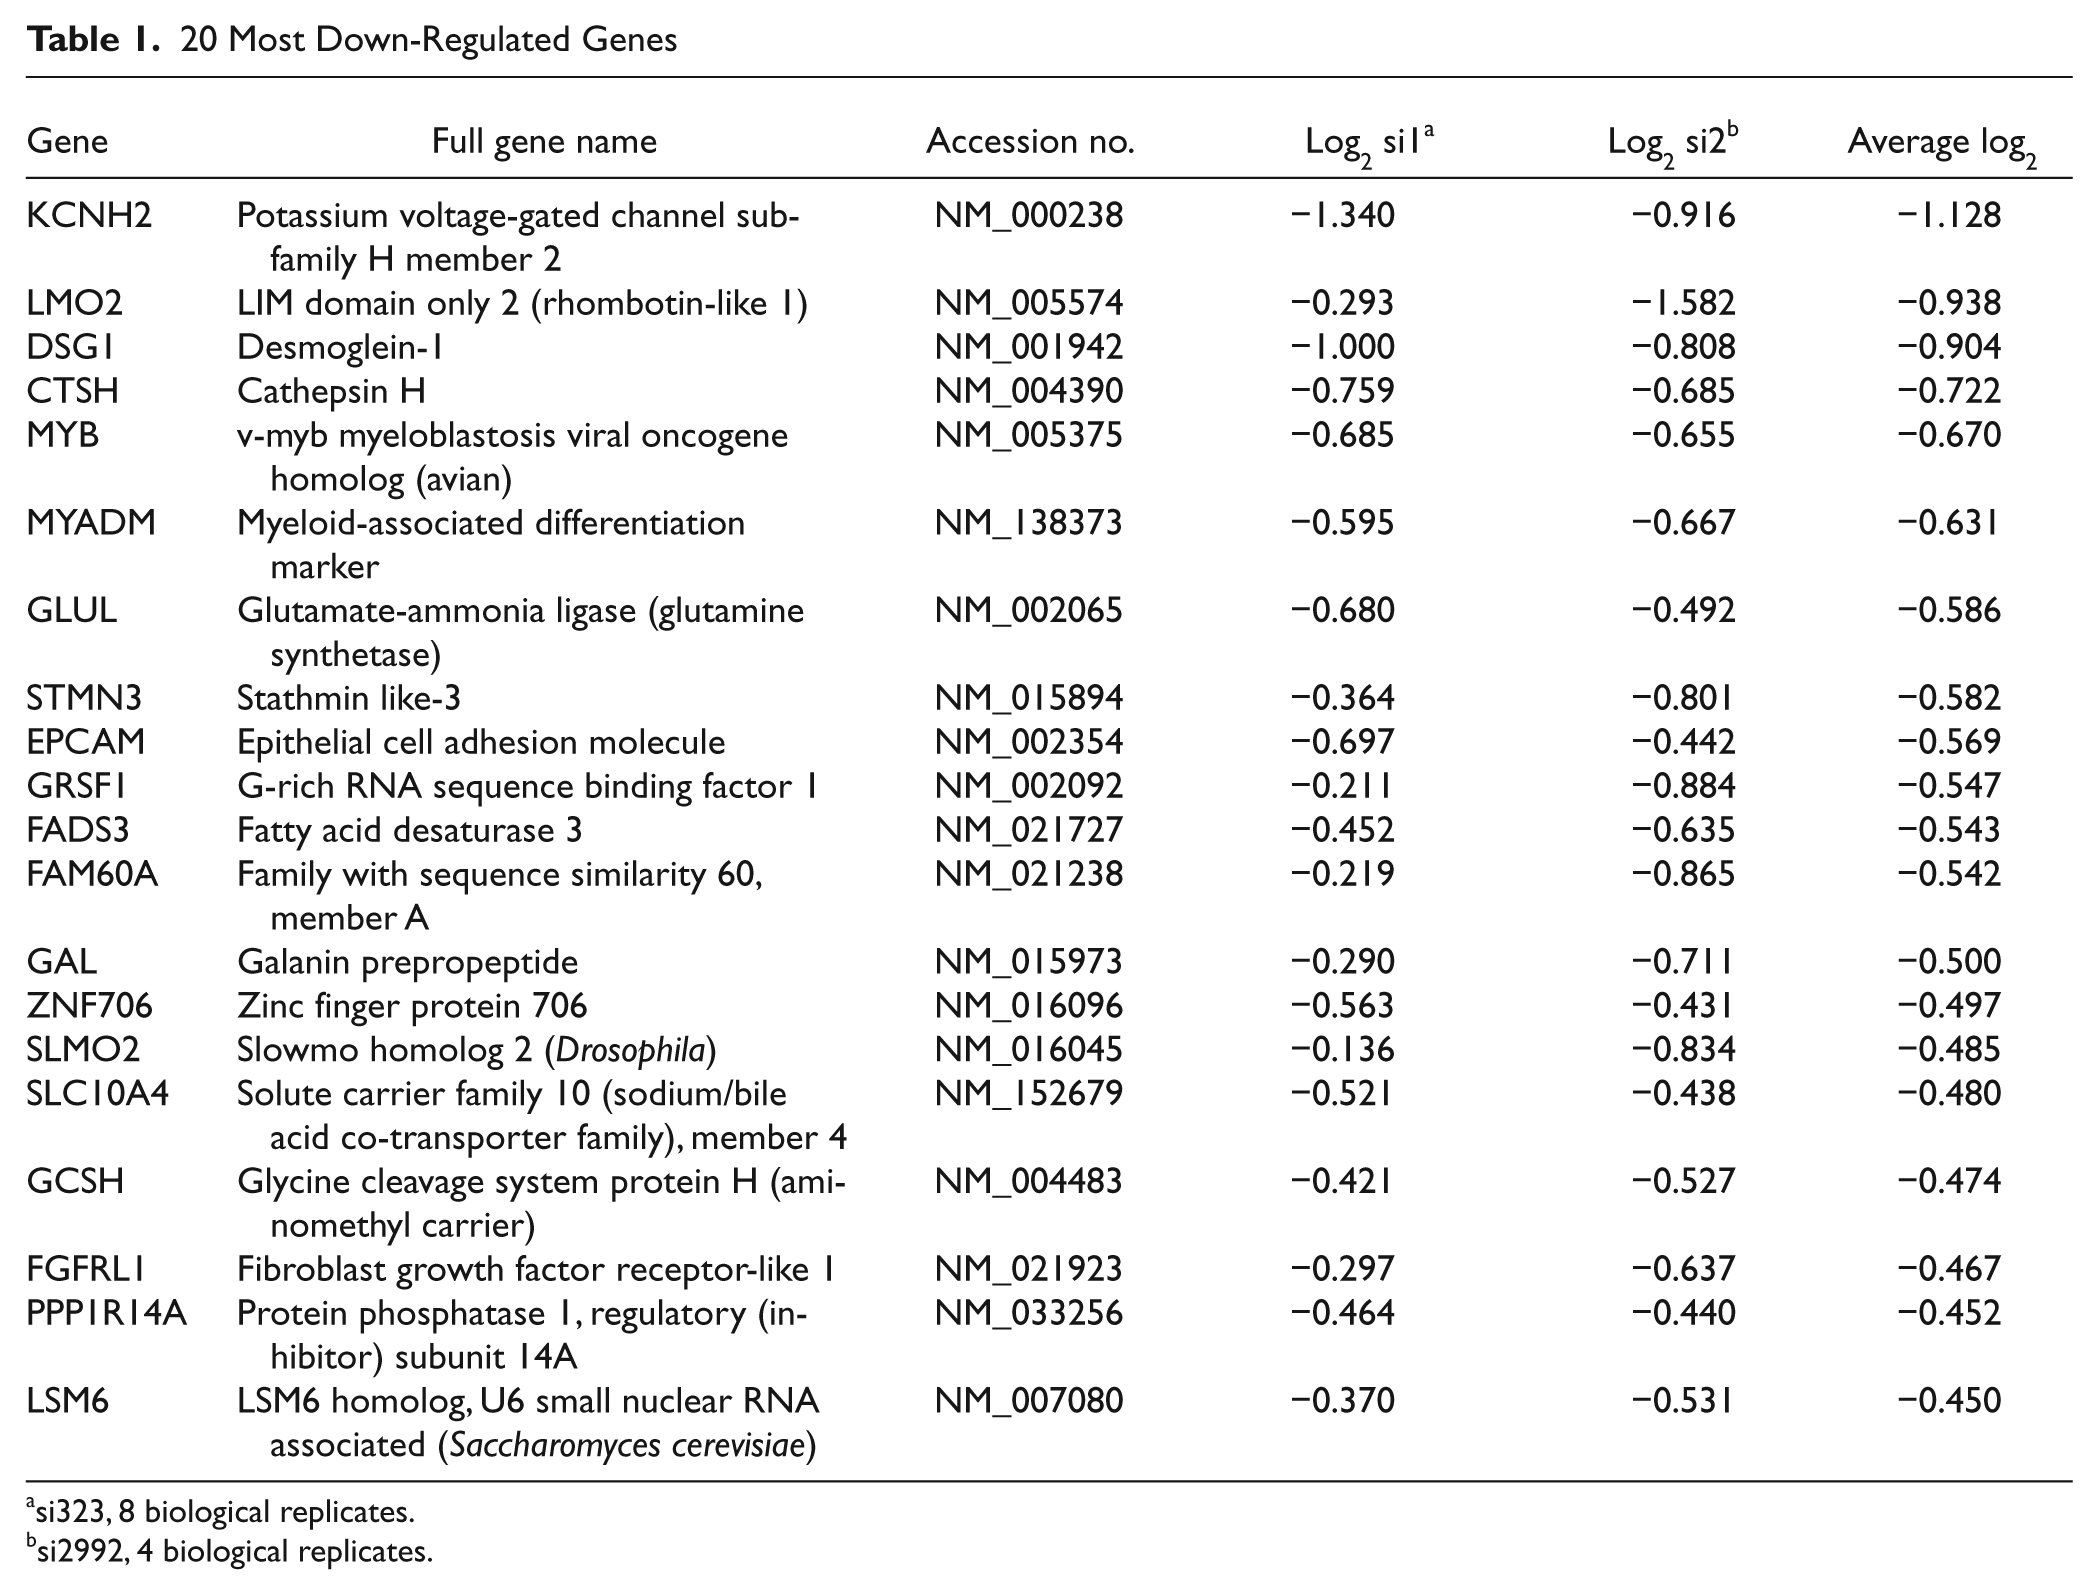
si323, 8 biological replicates.
si2992, 4 biological replicates.
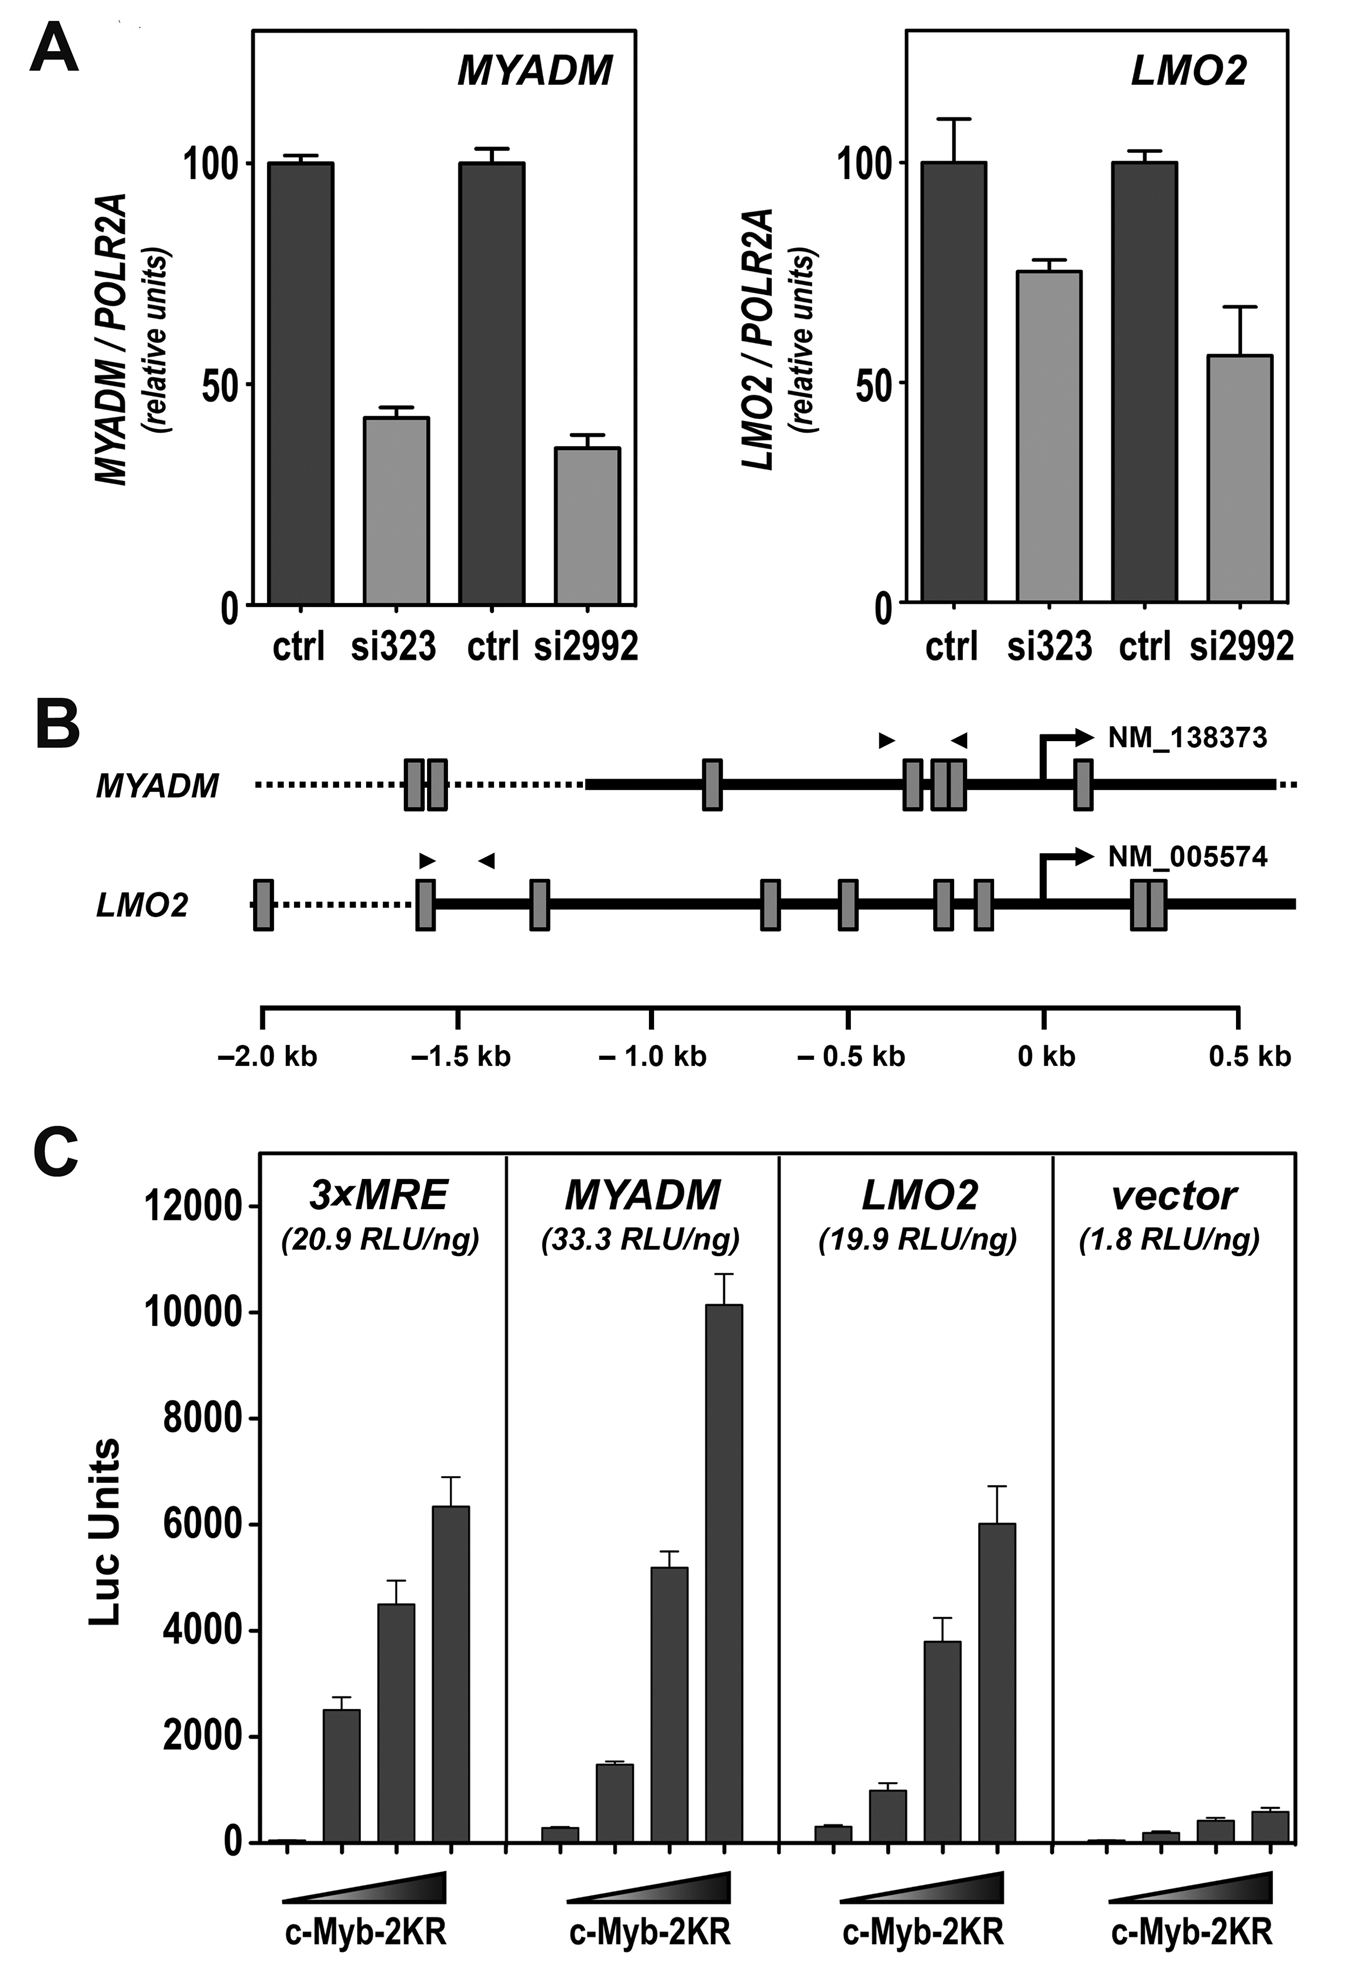
Validation of the most regulated genes. (A) qRT-PCR–mediated validation of the microarray indicated down-regulation of MYADM and LMO2 after c-Myb knockdown. mRNA expression was measured 24 hours after transfection of K562 cells with si323 or si2992. Total RNA was extracted and cDNA synthesized, as described in Materials and Methods. Two different dilutions for each cDNA were analyzed by qPCR. The expression levels were normalized versus the expression levels of the housekeeping gene POLR2A and represented as percentage of expression in siLuc-transfected K562 cells (ctrl). The bar graph represented the average of expression from at least 3 independent transfections ± standard deviation. (B) Promoter maps. Schematic presentation of the promoter area (−2,000 to +700) of MYADM and LMO2, aligned relative to their transcription start site (TSS) (position +1) depicted by an arrow. The GenBank accession numbers are given to the right of the TSS. Putative MREs following the consensus YAAC[NG/GN] 53 are shown as gray boxes. The solid black lines specify the promoter regions that were amplified and cloned into the luciferase reporter plasmid pGL3 basic. Arrowheads indicate the position of the primers used in the ChIP. (C) Reporter assay–based study of the responsiveness of MYADM and LMO2 promoter regions to c-Myb–2KR. CV-1 cells were transfected with a reporter construct, where the luciferase gene expression was driven by either the MYADM or LMO2 promoter, and increasing concentration of c-Myb expression plasmid (0-300 ng). A reporter plasmid containing 3 MYB recognition elements (MREs) upstream of a core promoter from human MYC driving the luciferase reporter was used as a positive control (3×MRE). The empty reporter vector was used as negative control. Results are represented as average luciferase units from 3 independent transfections ± standard error. The values in brackets refer to the slope of activation (RLU/ng), based on a linear regression analysis of the reporter assay data (Suppl. Fig. S1).
Effect of c-Myb knockdown on global gene expression: functional classification of regulated genes
In order to obtain a more global view of the effect of c-Myb knockdown, we analyzed the profiling data further, using the IPA program from Ingenuity (http://www.ingenuity.com). Clustering of the regulated genes based on the function of their respective products indicated an enrichment of “transcription regulators” (Fig. 2C). The concept of c-Myb acting as a “master regulator” controlling the expression of other important transcription factors is an attractive possibility. The implication is that even small, and therefore more difficult to detect, alterations in the expression of key transcriptional regulators could have critical downstream consequences. This would help to explain the wide effects observed when c-Myb expression is deregulated. More detailed analysis of this group revealed that 14 of the genes were down-regulated and 17 were up-regulated after c-Myb knockdown (Table 2). Focusing on the down-regulated ones, 3 genes were chosen for further studies due to their known importance in hematopoiesis: IKZF1 (IKAROS family zinc finger 1), STAT5A (signal transducer and activator of transcription 5A), and GATA2 (GATA binding protein 2). Analysis of their expression levels by qRT-PCR verified their down-regulation after c-Myb knockdown (Fig. 4A). For further validation of their target gene status, we analyzed the responsiveness of their promoter regions (approx. −1500 to +500 bp relative to TSS) to c-Myb–2KR (Fig. 4B). In all 3 cases, a dose-dependent increase in the luciferase activity was observed (Fig. 4C). The strongest activation was observed with GATA2 (114.1 RLU/ng) and the weakest one with IKZF1 (11.6 RLU/ng). Still, IKZF1 displayed a slope of activation more than 10-fold higher than the negative control (pGL3 basic) (Fig. 4C). These results indicate that the expression of the 3 transcription factors, IKAROS, STAT5A, and GATA2, is regulated by c-Myb.
Transcription Regulators
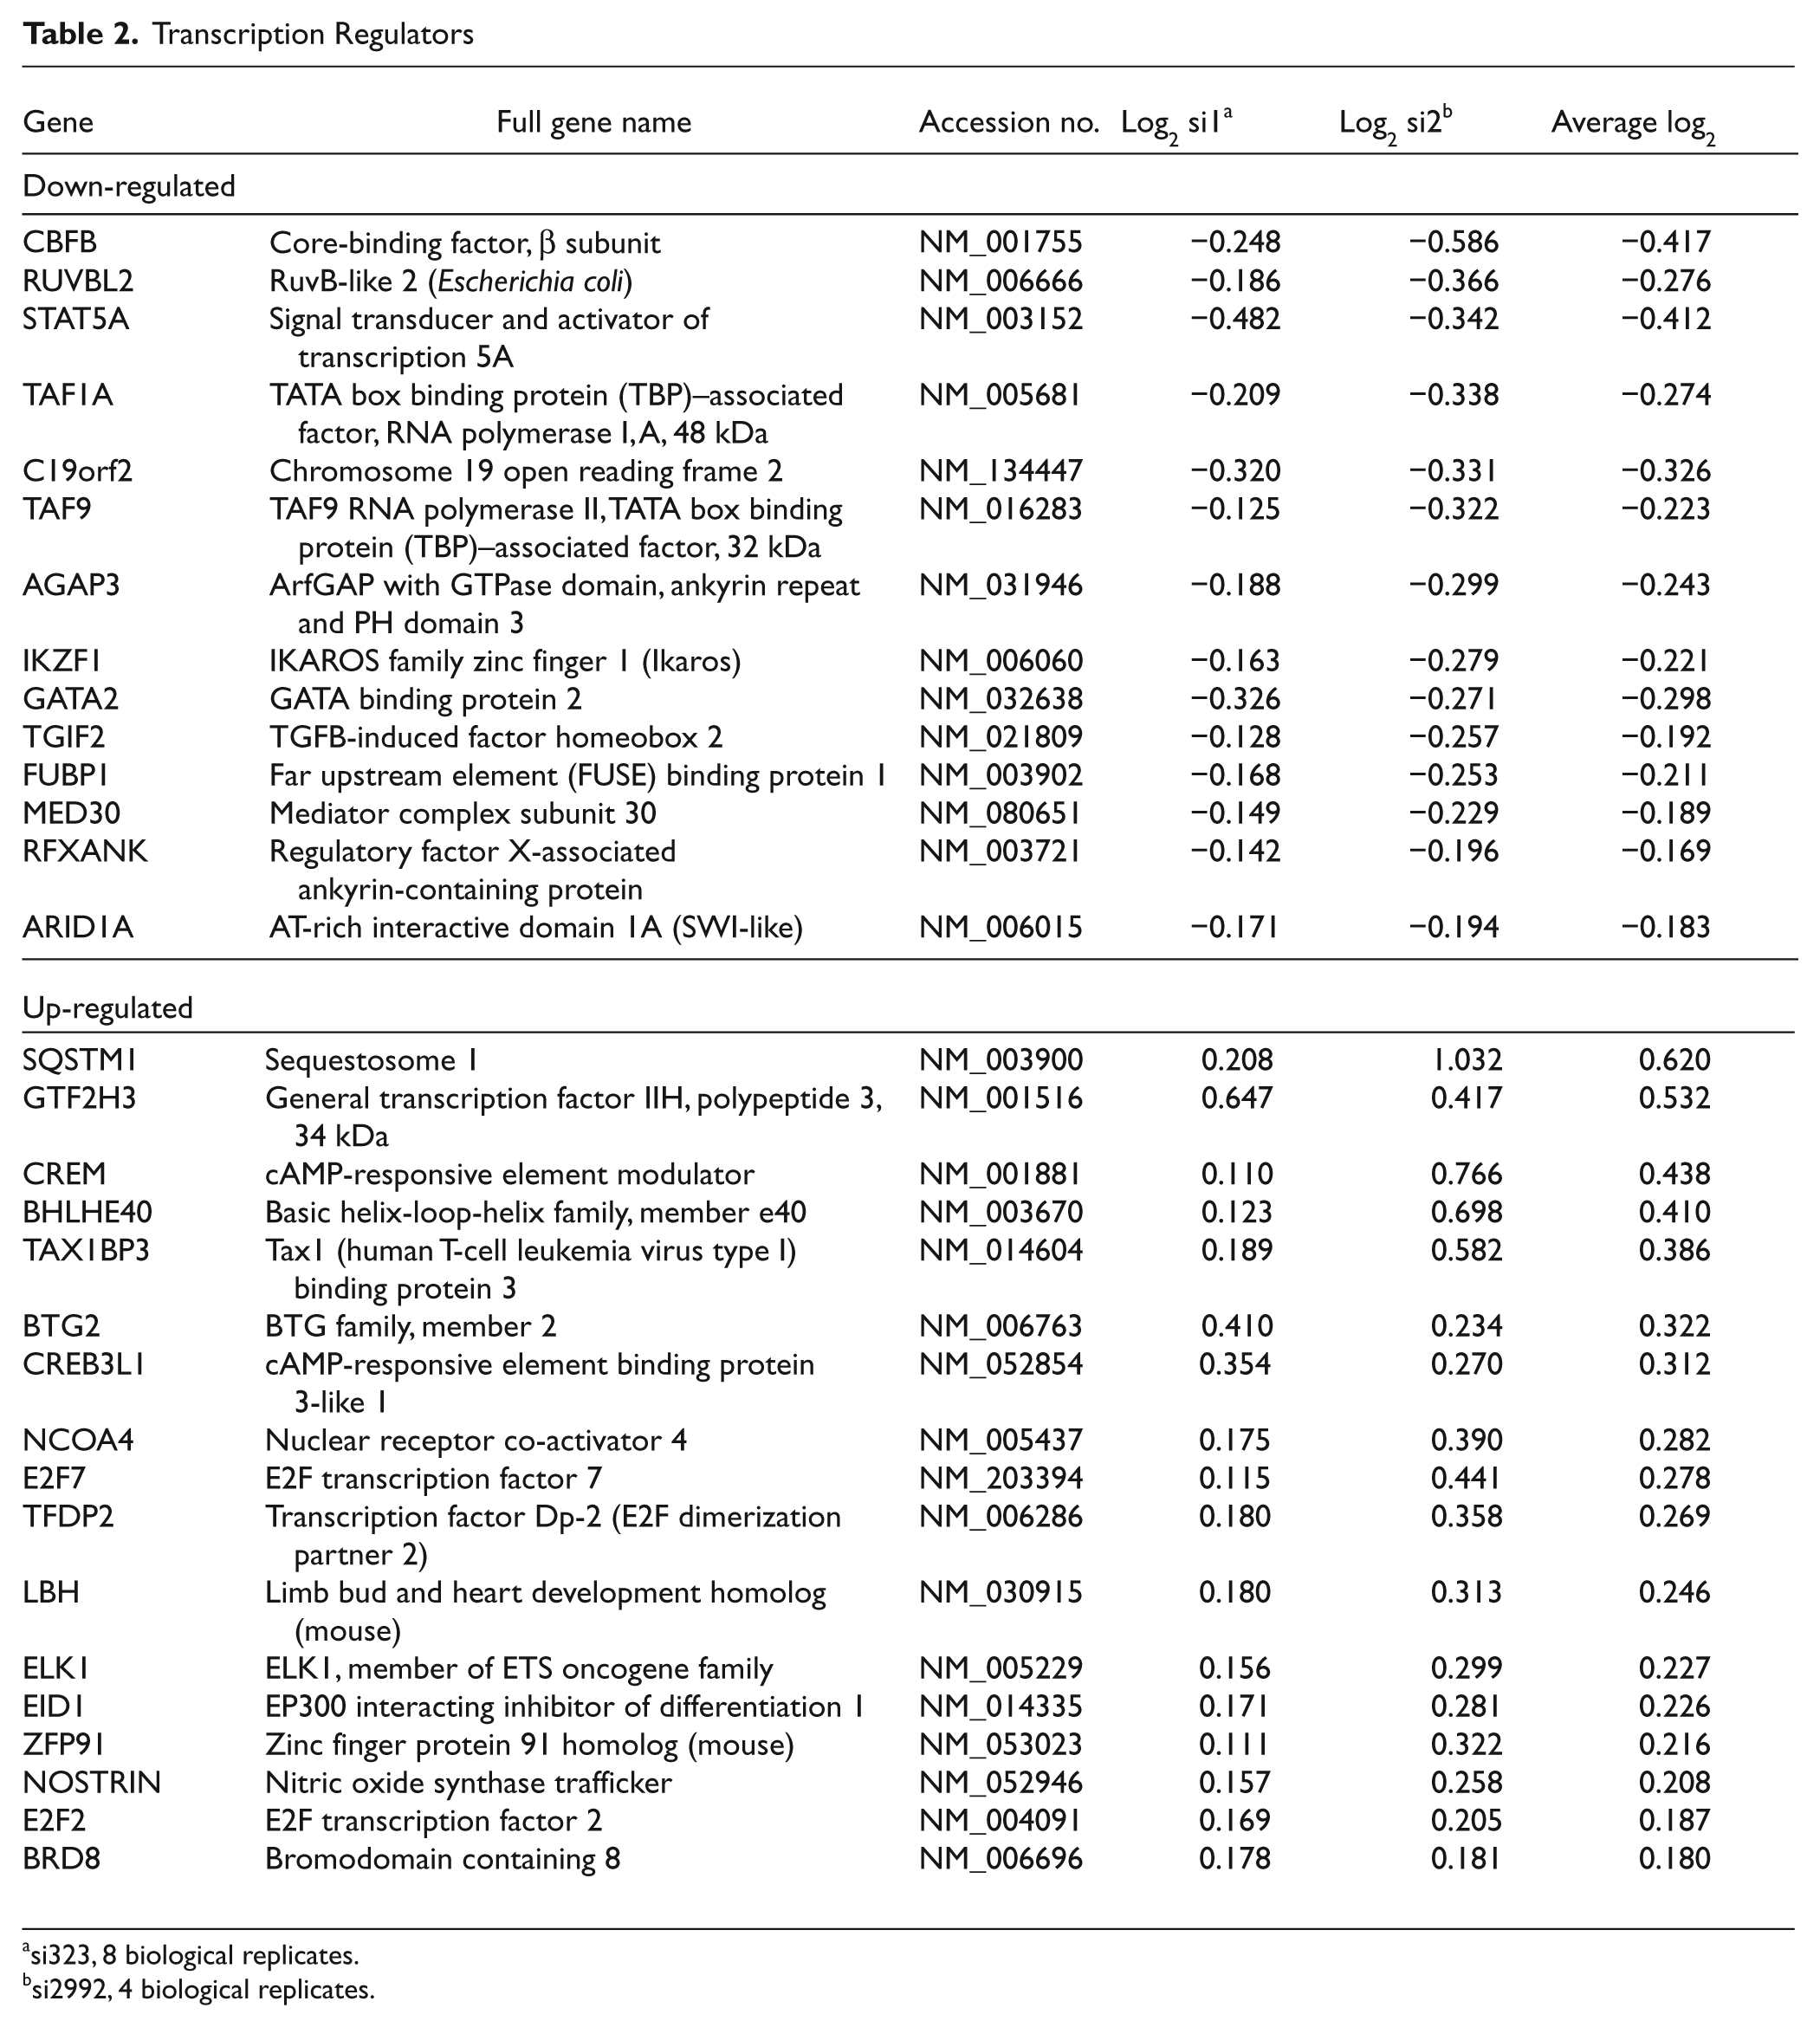
si323, 8 biological replicates.
si2992, 4 biological replicates.
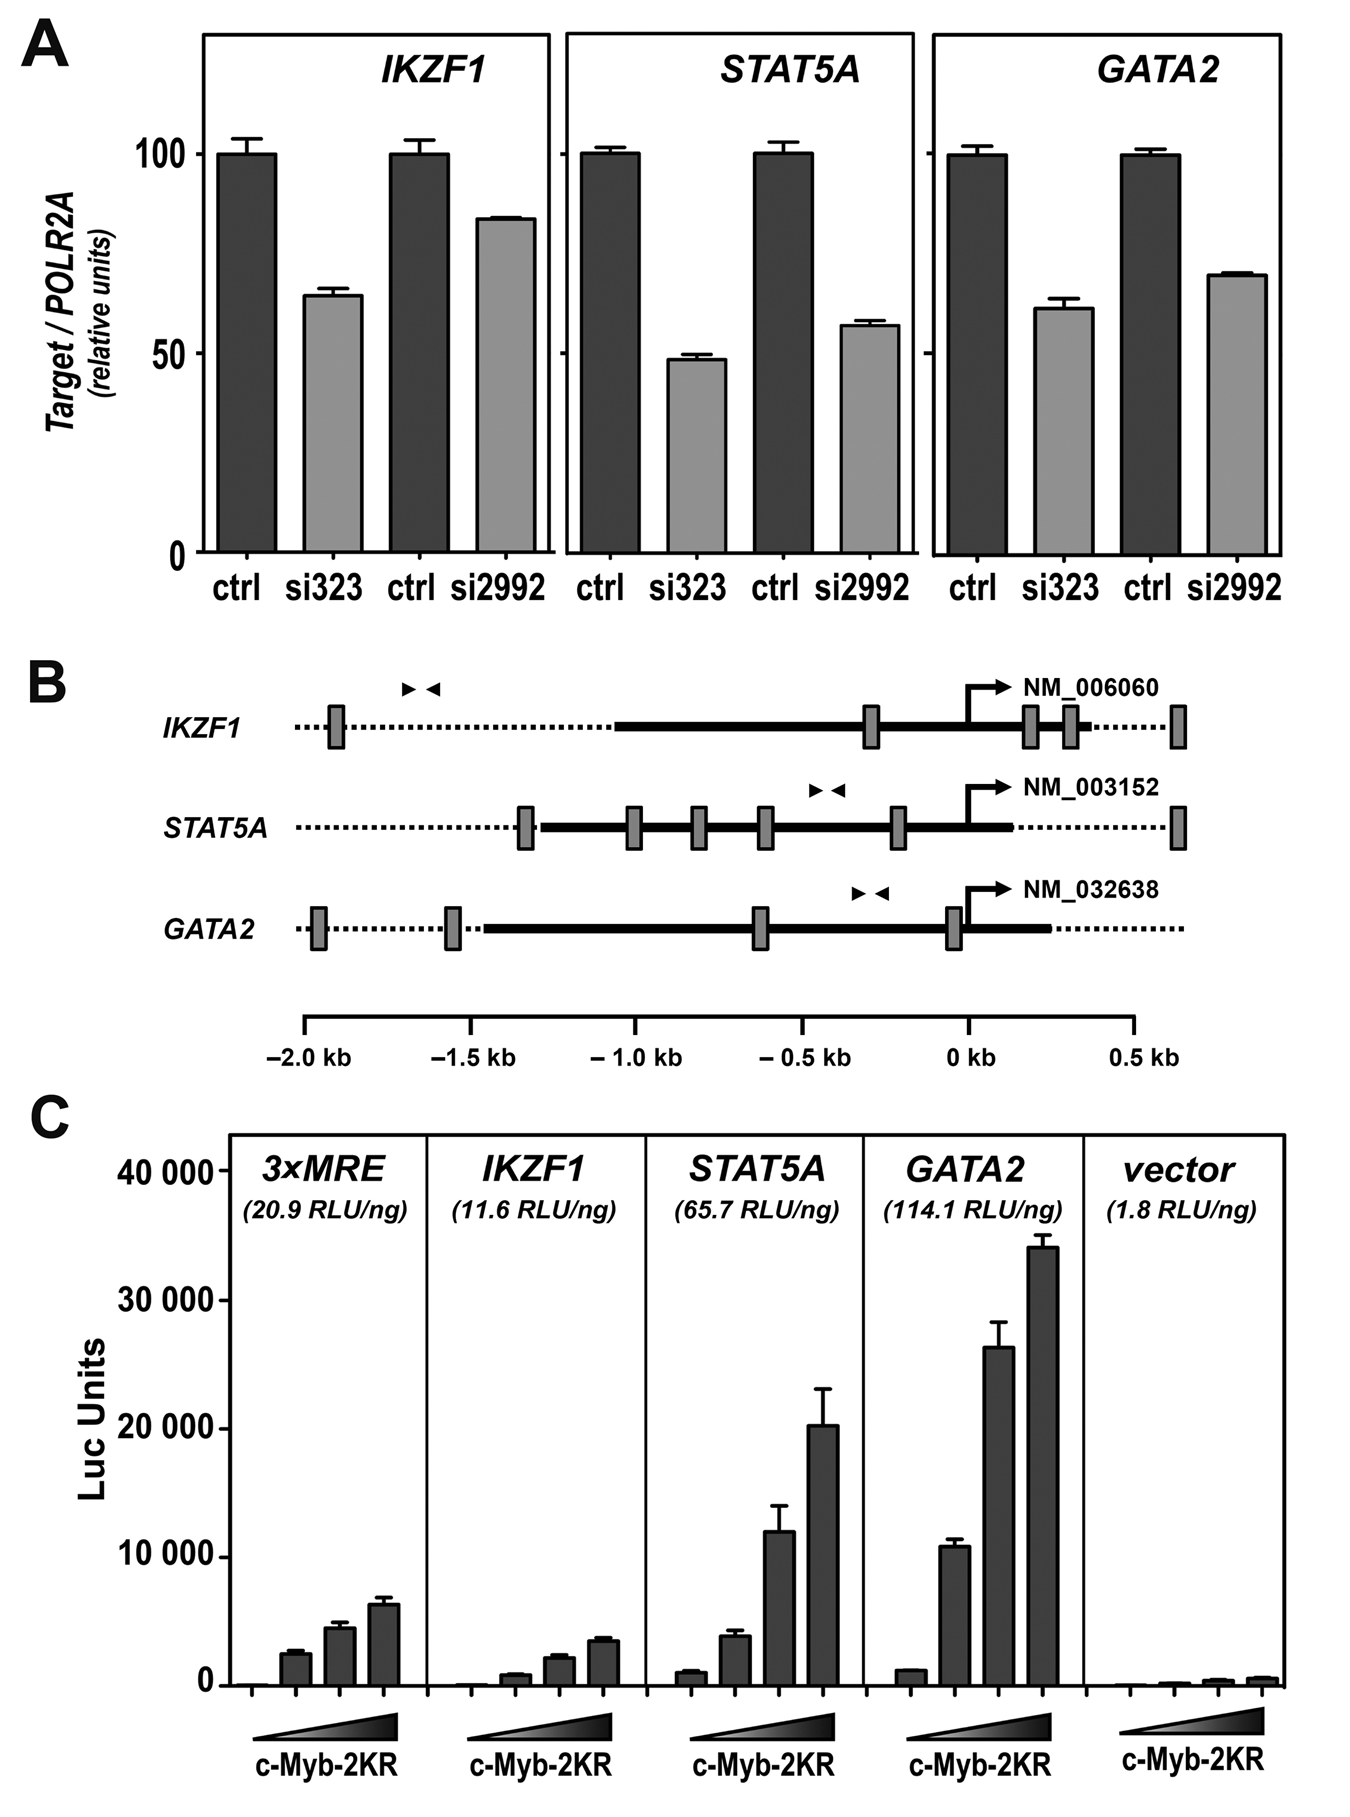
Validation of the regulation of transcriptional regulators. (A) qRT-PCR–mediated validation of the microarray indicated down-regulation of IKZF1, STAT5A, and GATA2 after c-Myb knockdown. The mRNA expression of the 3 genes was measured 24 hours after transfection of K562 cells with si323 or si2992. Total RNA was extracted and cDNA synthesized, as described in Materials and Methods. Two different dilutions for each cDNA were analyzed by qPCR. The expression levels were normalized versus the expression levels of the housekeeping gene POLR2A and represented as percentage of expression in siLuc-transfected K562 cells (ctrl). The bar graph represented the average of expression from at least 3 independent transfections ± standard deviation. (B) Promoter maps. Schematic presentation of the promoter area (−2,000 to +700) of IKZF1, STAT5A, and GATA2, aligned relative to their transcription start site (TSS) (position +1) depicted by an arrow. The GenBank accession numbers are given to the right of the TSS. Putative MREs following the consensus YAAC[NG/GN]53 are shown as gray boxes. The solid black lines specify the promoter regions that were amplified and cloned into the luciferase reporter plasmid pGL3 basic. Arrowheads indicate the position of the primers used in the ChIP. (C) Reporter assay–based study of the responsiveness of respective promoter regions to c-Myb–2KR. CV-1 cells were transfected with a reporter construct, where the luciferase gene expression was driven by either the IKZF1, the STAT5A, or the GATA2 promoter, and increasing concentration of c-Myb expressing plasmid (0-300 ng). A reporter plasmid containing 3 MYB recognition elements (MREs) upstream of a core promoter from human MYC driving the luciferase reporter was used as positive control (3×MRE). The empty reporter vector was used as negative control. Results are represented as average luciferase units from 3 independent transfections ± standard error. The values in brackets refer to the slope of activation (RLU/ng), based on a linear regression analysis of the reporter assay data (Suppl. Fig. S1).
Additional functional analysis of the microarray data of regulated genes using the above-mentioned IPA program showed a significant alteration of several functional networks after c-Myb knockdown (Table 3). Besides the expected functions of cancer and cell cycle, RNA posttranscriptional modification appeared as one of the most regulated functions. The fact that some of the genes in this functional group have been shown to be essential for cell division, 36 and furthermore, that c-Myb has a role in alternative splicing of pre-mRNA, 37 points to a potential role for mRNA modification in c-Myb–mediated control of proliferation.
Most Regulated Function
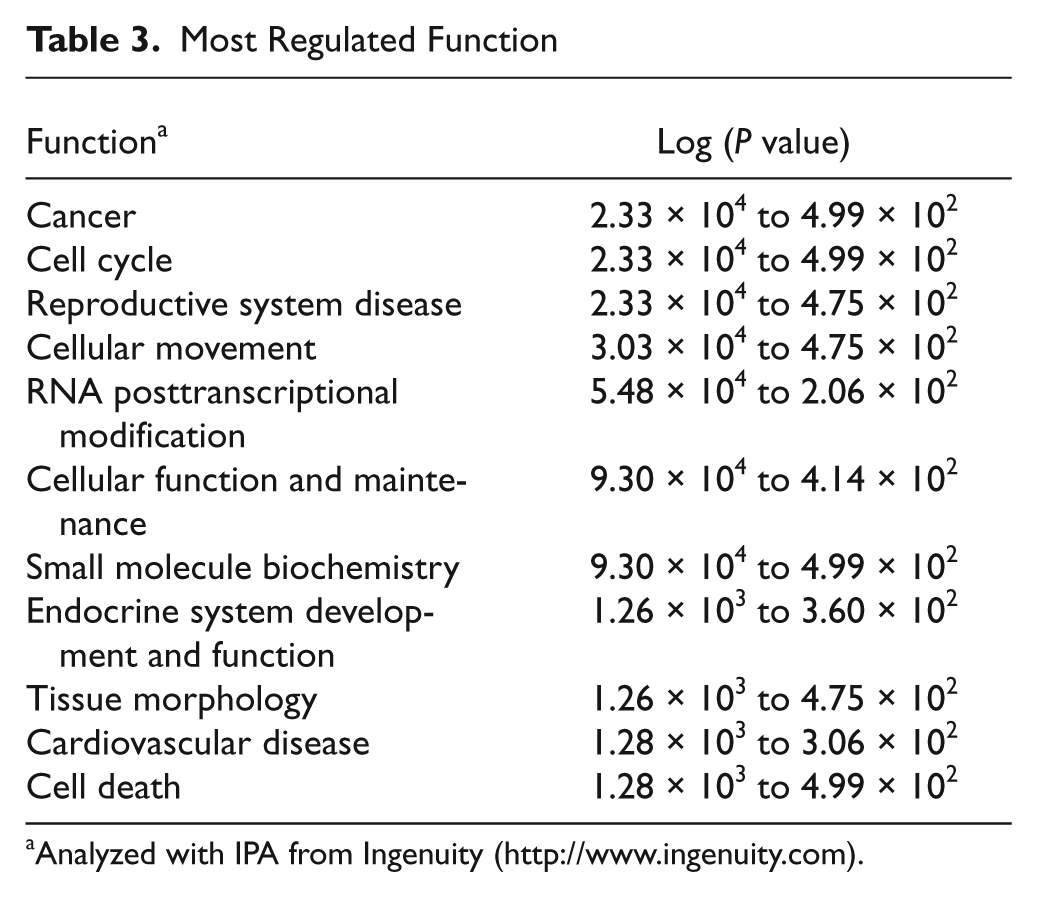
Analyzed with IPA from Ingenuity (http://www.ingenuity.com).
c-Myb binding to the promoters
The down-regulation of MYADM, LMO2, STAT5A, GATA2, and IKZF1 expression after c-Myb knockdown, together with the observed dose-dependent c-Myb response of their promoters, indicates that these genes are regulated by c-Myb. However, for their definitive validation as direct c-Myb target genes, demonstration of c-Myb binding to their promoters when embedded in chromatin is required. Due to the lack of good-quality antibodies for ChIP of endogenous c-Myb, we generated a K562-derived cell line (K562-hcM), which stably expresses a double-tagged c-Myb construct (HA and 3×FLAG). The Western panel in Figure 6A shows that the level of expression of exogenous c-Myb in K562-hcM cells is similar to the expression level of endogenous c-Myb in the K562 parental cells. Using this cell line, we performed ChIP analysis of c-Myb occupancy on the 5 selected target genes LMO2, MYADM, STAT5A, GATA2, and IKZF1 (Fig. 5). All 5 genes showed enrichment of c-Myb compared to the isotype IgG control, although with variations in the strength of the ChIP signals. Interestingly, the strongest signals were measured for the 2 top-tier targets LMO2 and MYADM. Quite good signals were also obtained for GATA2 and STAT5A, while IKZF1, which displayed the weakest c-Myb response of the cloned promoters, also gave the weakest ChIP signal. Finally, we analyzed mouse c-Myb ChIP-seq dataset from MEL cells, a K562 analog, made publicly available by the ENCODE consortium (Mouse NCBI37/mm9, http://genome.ucsc.edu). 38 The c-Myb signals (−5 to +10 kb from TSS) on Myadm, Lmo2, Ikzf1, Stat5a, and Gata2 showed that c-Myb is enriched at or near TSS on all our candidate target genes but not on the negative control Gata6 (Suppl. Fig. S2). Together, these data demonstrate the binding of c-Myb to the endogenous promoters of LMO2, MYADM, STAT5A, GATA2, and IKZF1, and thus combined with their responsiveness described above, confirms their direct regulation by c-Myb.
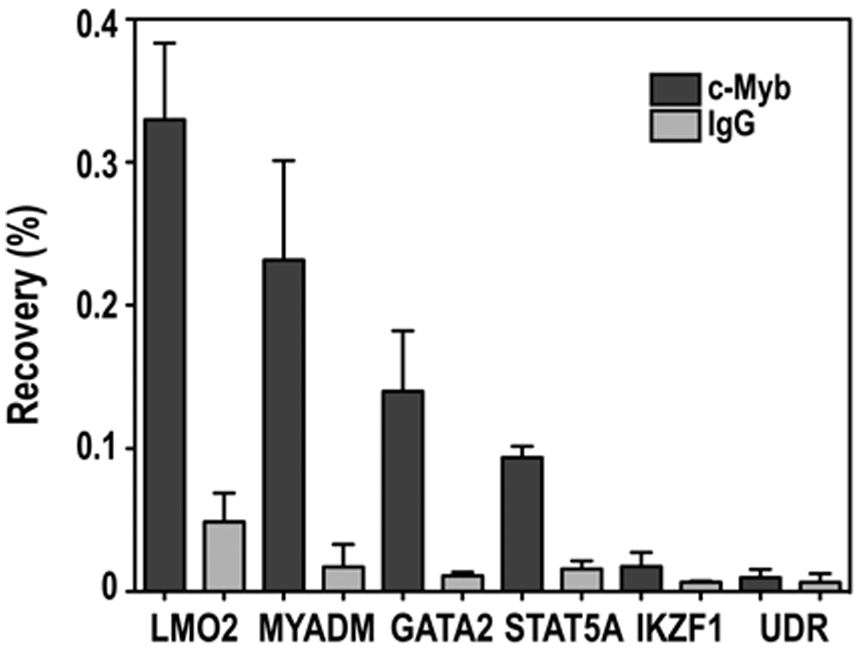
Chromatin immunoprecipitation (ChIP) assays. The K562-hcM cell line, which stably expresses HA- and FLAG-tagged c-Myb, was used to detect direct binding of c-Myb to the promoters of LMO2, MYADM, GATA2, STAT5A, and IKZF1. An unrelated DNA region (UDR) was used as negative control. Anti-FLAG antibody was used to immunoprecipitate tagged cMyb, while IgG control antibody was used as negative control.18 qPCR reactions were run in triplicates. The results are given as percentage recovery ± standard deviation compared to input material and are representative of 3 independent experiments. ChIP primer positions and sequences are given in Figures 3B and 4B and Supplementary Table S2, respectively.
Analysis of target genes using the K562-hcM cell line
The engineered cell line K562-hcM developed for improved ChIP analysis was also exploited for further validation of the selected target genes. Two analyses were performed, one in which a modest increase in c-Myb protein level was utilized and a second in which specific knockdown of endogenous c-Myb was induced, without alteration of the exogenous c-Myb expression. Because the K562-hcM cell line expresses both endogenous and exogenous c-Myb, the total level of the transcription factor is higher in this cell line than in the K562 parental cells. This increase observed at protein level (Fig. 6A, right panel) was also noticeable at mRNA level. MYB mRNA expression was approximately 2-fold higher in K562-hcM cells when compared to parental cells (Fig. 6A, first 2 columns). Because this represents a very modest overexpression situation, probably within a physiological range, we reasoned that real target genes of c-Myb should respond to these conditions. We therefore analyzed whether this difference in c-Myb expression correlates with changes in the levels of MYADM, LMO2, STAT5A, GATA2, and IKZF1 mRNAs. This was indeed the case, the increase in c-Myb expression observed in K562-hcM cells, correlated with a significant increase in the mRNA levels of MYADM, LMO2, STAT5A, GATA2, and IKZF1, further supporting the conclusions that these genes are real c-Myb targets (Fig. 6A).
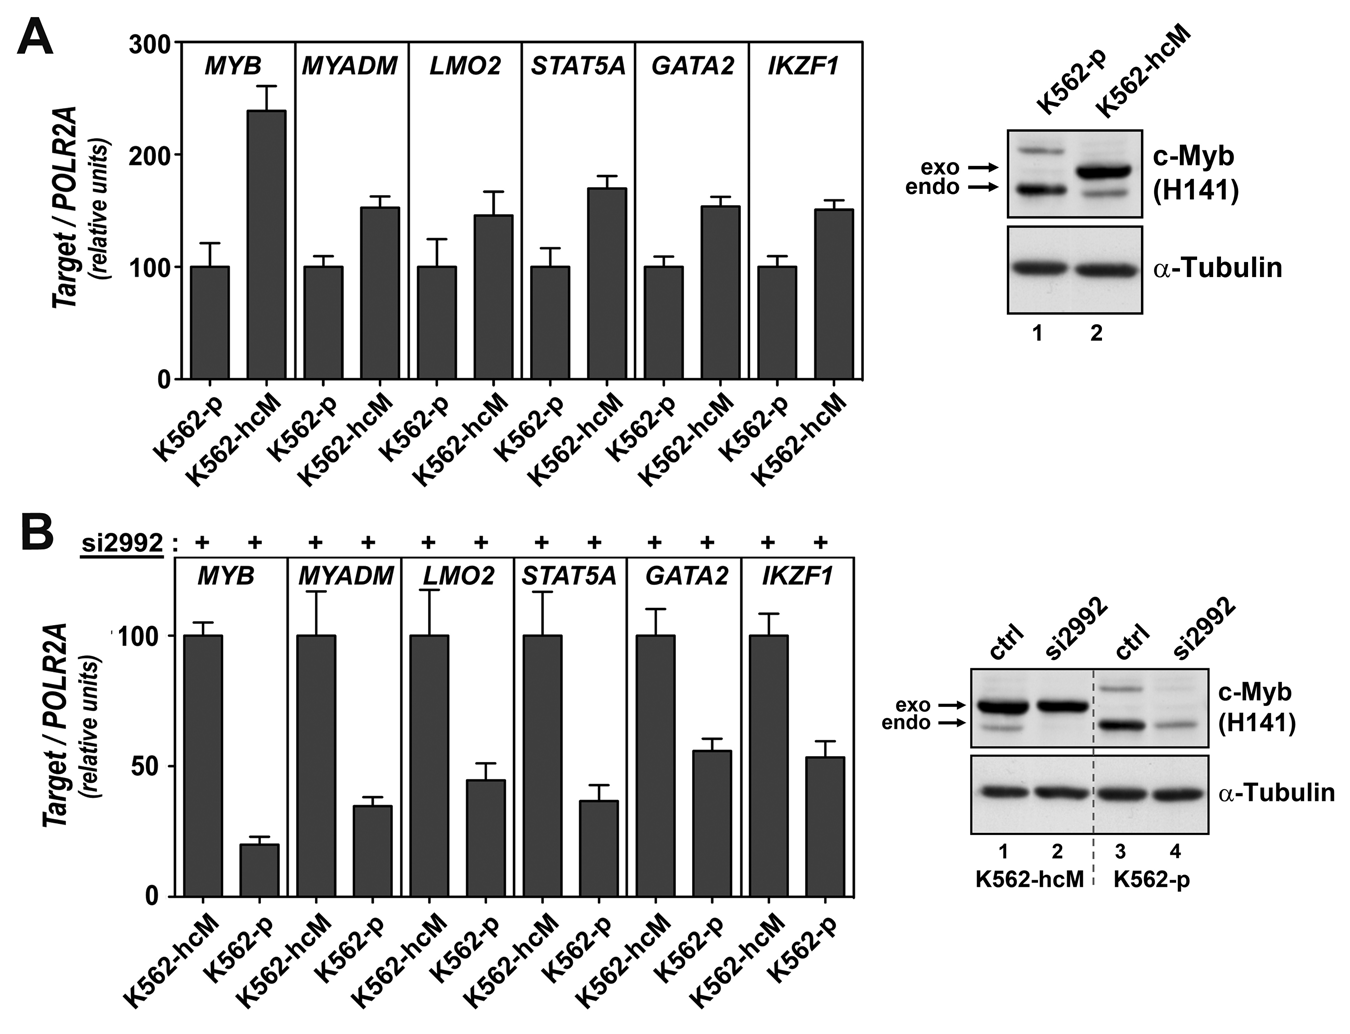
Analysis of target genes using the K562-hcM cell line. (A) Left panel: qRT-PCR–mediated relative quantification of the mRNA levels for the indicated genes in parental K562 cells (K562-p) or in the K562 cell line that stably expresses exogenous c-Myb (K562-hcM). Total RNA was extracted and cDNA synthesized, as described in Materials and Methods. Four independent experiments were performed, and at least 2 different dilutions for each cDNA were analyzed by qPCR. The expression levels were normalized versus the expression levels of the housekeeping gene POLR2A and represented as percentage of expression in untransfected parental K562 cells (K562-p). The bar graph represented the average of expression from at least 3 independent transfections ± standard error. Right panel: Corresponding Western analysis of the expression levels of exogenous (exo) and endogenous (endo) c-Myb in K562-p and K562-hcM cells. (B) Left panel: qRT-PCR–mediated relative quantification of the mRNA levels for the indicated genes 24 hours after si2992 transfection of the K562-p and K562-hcM cell lines. Total RNA was extracted and cDNA synthesized, as described in Materials and Methods. Four independent experiments were performed, and at least 2 different dilutions for each cDNA were analyzed by qPCR. The expression levels were normalized versus the expression levels of the housekeeping gene POLR2A and represented as percentage expression relative to the K562-hcM cells. The bar graph represented the average of expression from at least 3 independent transfections ± standard error. Right panel: Corresponding Western analysis of the expression levels of exogenous (exo) and endogenous (endo) c-Myb in K562-hcM and K562-p cells 24 hours after transfection with si2992 or siLuc (ctrl).
The second type of analysis exploits the fact that the integrated c-Myb cDNA construct that is expressed in K562-hcM cells lacks the 3′UTR and hence is expected to be resistant to si2992 that binds to a region in the 3′UTR. Indeed, the transfection of K562-hcM cells with si2992 did not affect exogenous c-Myb expression, knocking down only endogenous c-Myb (Fig. 6B, right panel). This behavior allowed us to compare the K562-hcM cell line with the parental K562-p, both under conditions of added si2992 RNA, and in this way create a differential c-Myb expression while keeping the siRNA load constant (Fig. 6B, left panel, first 2 columns). By this approach, any siRNA-mediated off-target effects should be canceled out. We reasoned that if the down-regulation observed for MYADM, LMO2, STAT5A, GATA2, and IKZF1 was due to an off-target effect of the siRNA, rather than to the specific knockdown of c-Myb itself, their levels should be equal in the K562-hcM cells and the parental cell line after si2992 transfection. However, as shown in Figure 6B, after si2992 transfection, the levels of these 5 genes were significantly lower in K562-p cells when compared to the levels observed in the K562-hcM cell line. These data confirm that the down-regulation of MYADM, LMO2, STAT5A, GATA2, and IKZF1 that we observe after si2992 transfection in K562 cells is mediated by the specific knockdown of MYB expression.
3C analysis of spatial interactions between c-Myb target genes
To address whether c-Myb target genes interact through long-distance interactions, we focused on the 5 validated c-Myb target genes (LMO2, MYADM, STAT5A, GATA2, and IKZF1) and examined which of them had the largest number of chromosomal neighbors among the top 50 potential c-Myb target genes (Suppl. Table S1). Three genes, CAT (catalase), FADS3 (fatty acid desaturase 3), and GAL (galanin prepropeptide), were located on chromosome 11, which also harbors the LMO2 gene. CAT is located closest to LMO2 (0.55 Mb), whereas FADS3 and GAL are situated on the other arm of chromosome 11 (~28 Mb and ~33 Mb from LMO2, respectively). To analyze spatial interactions between LMO2 and these 3 genes, the chromosome conformation capture (3C) technique was employed in which interactions are monitored through the frequency of cross-linking of an anchor fragment (the LMO2 promoter) to candidate fragments (the promoters of CAT, FADS3, and GAL).
The results of the 3C analysis (Fig. 7, black curve) showed a direct interaction between the promoters of LMO2 and CAT. The observed interaction frequency of these 2 promoters was approximately 15% to 20% of the positive control (internal LMO2 fragment). Taking into account the large distance between the LMO2 and CAT gene promoters (0.55 Mb), this interaction frequency appears to be quite prominent. In comparison, the fragment located just upstream of the CAT gene promoter showed only half the frequency of interaction with the LMO2 anchor fragment, and the interaction frequencies observed for other fragments located in the neighborhood of the CAT gene were also clearly lower. FADS3 and GAL from the other arm of chromosome 11 did not interact with LMO2 (Fig. 7). We also performed the same type of LMO2-anchored 3C analysis for GATA2 and STAT5A from chromosomes 3 and 17. However, interaction frequencies observed for these genes did not differ from those observed for the negative control (gene desert on chromosome 2; data not shown). To substantiate CAT’s position as a direct target of c-Myb, we analyzed the ENCODE ChIP-seq dataset from MEL cells 38 and found that c-Myb is enriched at the TSS and 5′ regulatory regions of CAT (Suppl. Fig. S2). Moreover, c-Myb occupies the CAT promoter when expressed in human embryonic kidney 293 cells (data not shown). To characterize the role of c-Myb in stabilizing the contact between the LMO2 and CAT promoters, we knocked down MYB expression in K562 cells using si323 (Fig. 7, gray curve). However, the frequency of interaction between these 2 genes was the same in normal and c-Myb knockdown cells, and we therefore conclude that c-Myb is not the major stabilizing factor.
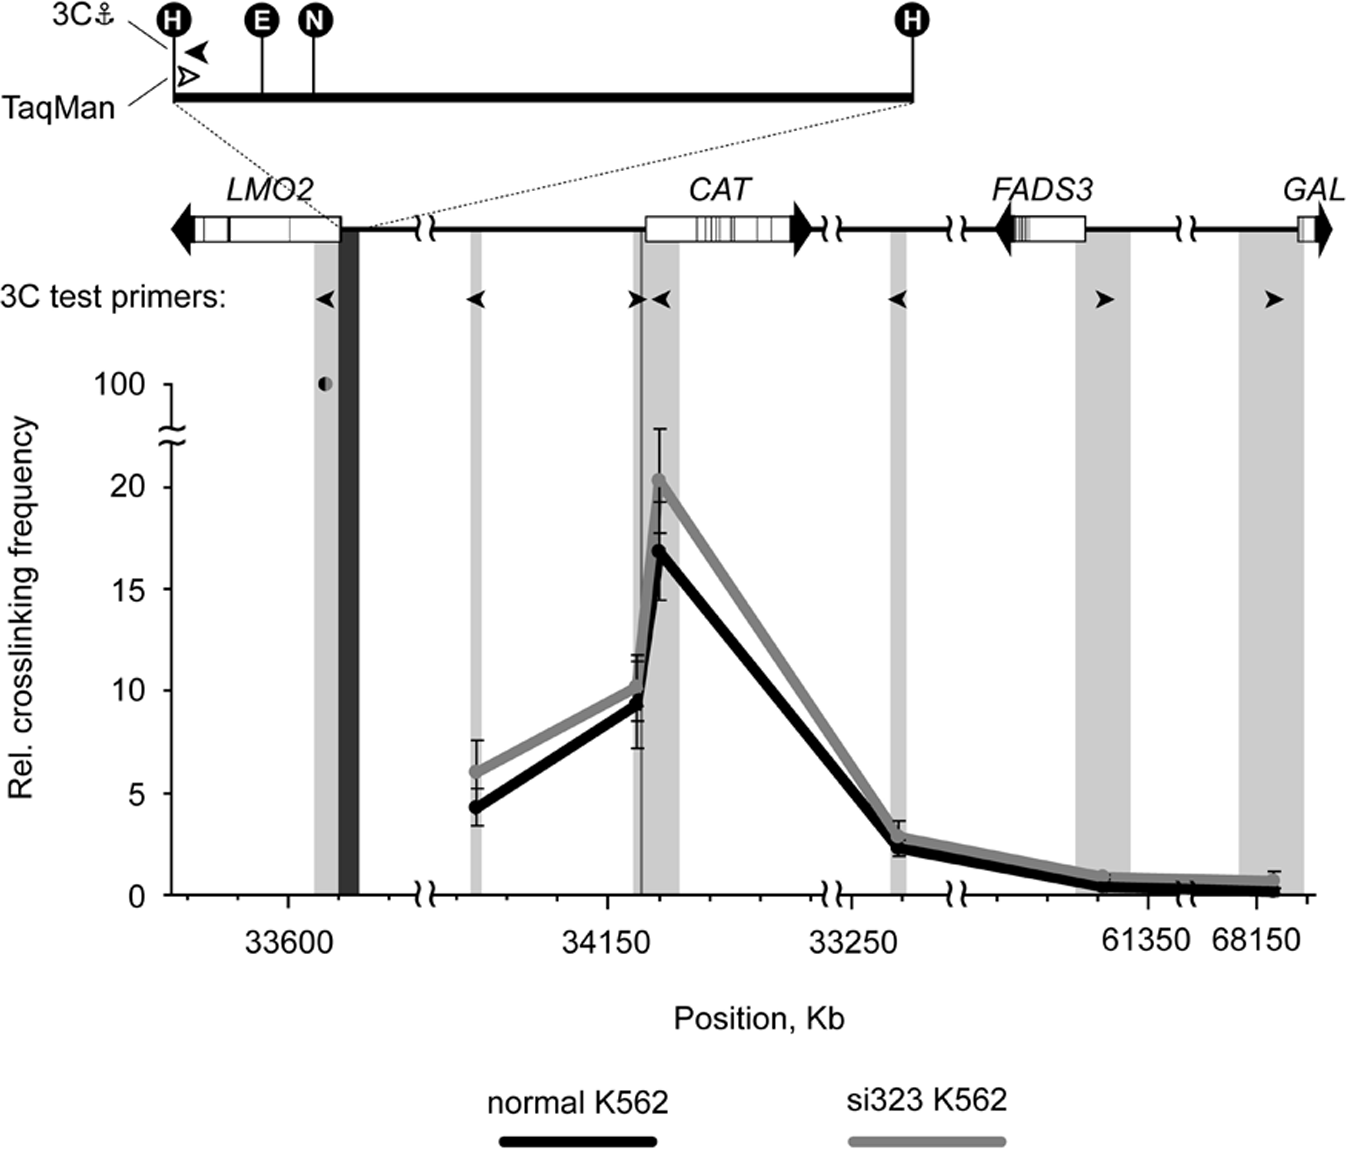
3C analysis of spatial interactions between c-Myb target genes. The upper panel of the figure shows a simplified map of the locus under study. Arrows on the map depict genes with exons given as black lines. The anchor restriction fragment harboring the LMO2 promoter is shown in more detail with the positions of unique restriction sites indicated (H = HindIII; E = EcoRI; N = NlaIII). Black arrowheads show primers used for the 3C analysis, while the white arrowheads represent the TaqMan probe (for primer sequences, see Suppl. Table S4). The graphs in the lower panel demonstrate relative cross-linking frequencies between the LMO2 anchor fragment (dark gray shadowing) and other fragments (light gray shadowing). The fragments’ relative chromosomal positions are shown on the x-axis (0 point: start of chromosome 11 genomic contig sequence NW001838022.2). The results from both parental K562 cells (black curves) and K562 cells after transfection with si323 (gray curves) are included. The interaction frequency is normalized to the cross-linking frequency observed between the anchor and the adjacent fragment, which is set to 100. Error bars represent standard error for 3 independent experiments.
Discussion
There has long been a gap between the well-documented importance of c-Myb as a regulator of hematopoietic development and our knowledge of the target genes controlled by c-Myb. Our working hypothesis has been that the difficulty of filling this gap may be related to c-Myb being high up in a regulatory hierarchy and that key target genes therefore may be other regulators, such as other transcription factors or noncoding RNAs. Recently, several studies have reported interesting links between c-Myb and specific miRNAs, in line with this concept.21,22 Here, we provide evidence that c-Myb also controls the expression of a set of specific transcriptional regulators.
Our approach to target gene identification was global expression profiling after specific MYB knockdown in the erythroleukemic cell line K562, using 2 different siRNAs and a considerable number of biological replicates. With this strategy, we identified several new putative target genes of c-Myb. qRT-PCR validation of the profiling data, direct binding of c-Myb to the promoters of the target genes, experiments with a c-Myb construct resistant to the siRNA, and analysis of the promoters’ response to c-Myb led us to define 5 genes, MYADM, LMO2, STAT5A, GATA2, and IKZF1, as novel c-Myb targets. Finally, we characterized the spatial organization of c-Myb target genes by chromosome conformation capture analysis (3C). Interestingly, the promoter of the CAT gene was found to interact with LMO2; however, c-Myb did not seem to play a major role in stabilizing this intrachromosomal interaction. Whether some of the target genes are co-localized in a Myb-dependent fashion and concomitantly transcribed in so-called transcription factories 39 is an important question for future investigations.
The combinatorial use of RNAi-mediated knockdown of endogenous c-Myb and subsequent expression profiling together with the confirmation of DNA binding by ChIP methodologically strengthen this study, as do the use of 2 different siRNAs and the high number of biological replicates (n = 8 and n = 4). Rather than using a mixture of the siRNAs, we identified target candidates in separate experiments and then in the data analysis extracted the genes in common. This circumvented the risk of summing up all effects (logic OR function) and instead selected the specific targets (logic AND function).
LMO2 and MYADM, found among the most down-regulated genes in response to c-Myb knockdown, have been described as important players in hematopoietic development. LMO2 is of particular interest because it is involved in both normal hematopoiesis and leukemic transformation. 40 LMO2, which functions as a bridge protein between transcription factors, has a central and crucial role in erythroid differentiation. 34 Abnormal expression of the LMO2 oncogene causes a subset of human T cell acute lymphoblastic leukemias (T-ALL), and recently, McCormack et al. demonstrated that the Lmo2 oncogene initiates leukemia in mice by inducing thymocyte self-renewal. 41 During the writing of this work, Bianchi et al. reported that c-Myb supports erythropoiesis through the activation of KLF1 and LMO2. 24 The finding of LMO2 as a direct target of c-Myb in 2 independent studies strengthens the validity of LMO2 as a c-Myb target. In contrast to LMO2, MYADM has been suggested as a marker of myeloid differentiation.35,42,43 It might seem contradictory that c-Myb would regulate genes of 2 mutually exclusive lineages. However, c-Myb is known to be involved in commitment/progression to both erythrocytes 7 and myeloid cells.3,44 Moreover, the K562 cell line is a progenitor-like cell line, able to differentiate to both cell types. 27 Hence, this regulation, which at first glance seems paradoxical, might be important in vivo.
The overrepresentation of genes involved in transcriptional regulation found among the significantly regulated genes after c-Myb knockdown (Fig. 2 and Table 2) suggests an attractive concept of c-Myb acting as master regulator. Given such a position, c-Myb–mediated regulation of the expression of important transcription factors might have wide-ranging secondary, downstream effects, explaining the dramatic consequences of c-Myb deregulation. Within our group of down-regulated transcription regulators, we found 3 important transcription factors involved in hematopoiesis: GATA2, STAT5A, and IKZF1. GATA2, a candidate regulator of cell fate decisions within the myeloid cell compartment, 45 has an important role in erythropoiesis and myeloid differentiation. It is noteworthy that a resemblance between the phenotype of Gata2−/− and c-Myb−/− embryos has been suggested. 5 STAT5A is a signal transducer and activator of transcription that induces erythropoiesis, and its down-regulation promotes megakaryocytic development. 46 Ikaros is known to be a critical regulator of early lymphoid differentiation and to be involved in lineage commitment early in the hematopoiesis. 47 The regulation of genes involved in early differentiation and lineage commitment events underscores the central role of c-Myb in hematopoiesis and points to c-Myb as a potential master regulator. Recent evidence supporting this concept comes from siRNA-based dissection of regulatory networks in human myeloid leukemia, 23 genome-wide chromatin occupancy and expression analysis, 26 and bioinformatics modeling. 48 Still, the emerging picture is more complex, and one possibility is that c-Myb coordinates gene activity together with other transcription factors within a network rather than functioning as the master regulator that controls the network top-down. 26
With 4 global studies focusing entirely24-26 or partly 23 on c-Myb–regulated genes, a natural question is whether our list of targets matches other published data. Focusing on the 5 target genes MYADM, LMO2, GATA2, STAT5A, and IKZF1, there is an obvious discrepancy between the studies (Suppl. Table S3). One plausible explanation to this is the different systems used: The cells used in both the study by Suzuki et al. 23 and Zhao et al. 26 are myelomonocytic, while the study by Quintana et al. used the breast cancer cell line MCF-7. 25 This can easily explain some of the inconsistency for LMO2, GATA2, and STAT5A, as these genes are mainly involved in erythropoiesis. Interestingly, there seems to be a more significant overlap with the Bianchi data. 24 Here, primary human CD34+ stem/progenitor cells and CD14− myeloblasts were used. Of the 50 most down-regulated genes in the present study, 28 turn out to be down-regulated after knockdown of MYB in the study by Bianchi et al. 24 Moreover, 14 of the genes in our top 50 list were not reported in the Bianchi study; that is, the fraction of similarly regulated (activated) genes is actually 28 of 36. This mutually adds to the value of these 2 studies and makes us confident that the present list of targets is worthy of further investigations.
Materials and Methods
Cell cultures and transfections
K562 and CV-1 cells were cultured and transfected using standard methods. See supplementary material.
Plasmid constructs
The expression plasmids pEF1neo-3FLAG-hcM-HA and pEF1neo-3FLAG-hcM-HA-2KR have been described. 18 The amplification of the different promoter regions was performed by PCR using Advantage GC 2 Polymerase Mix and PCR Kit (Clontech, Mountain View, CA), using human genomic DNA (Clontech) as a template. The primers used are given in Supplementary Table S2. The amplified fragments (1.5-2.0 kb) were cloned into the pGL3 basic vector (Promega, Madison, WI) upstream of the firefly luciferase reporter gene. The clones were verified by sequencing.
RNA extraction and qRT-PCR
Total RNA from K562 cells was extracted as outlined in the supplementary material. Analysis of mRNA levels by qRT-PCR was performed as previously described 15 and outlined in the supplementary material.
Microarray expression profiling
cRNA synthesis, labeling with fluorescent dyes, hybridization, preprocessing of expression data, and statistical analysis to define differentially expressed genes were performed at the Microarray Facility (Holstege Group, Department of Molecular Cancer Research, University Medical Center, Utrecht, the Netherlands) as described earlier. 49 Briefly, 1,000 ng DNase-treated total RNA was subjected to reverse transcription using T7 Oligo (dT) 24VN anchor primer (Ambion, Austin, TX) and Superscript II reverse transcriptase (Invitrogen, Carlsbad, CA) followed by second-strand synthesis. The double-stranded cDNA was subject to in vitro transcription using T7 Megascript Kit (Ambion) in the presence of 5-(3-aminoallyl)-UTP (Ambion) and was further subject to labeling using monofunctional NHS-ester Cy3 or Cy5 dyes (GE Healthcare, Piscataway, NJ). Fragmented Cy3-labeled cRNA (1800 ng) and fragmented Cy5-labeled cRNA (1800 ng) were combined and hybridized to customized human microarray slides. The Human Array-Ready Oligo set (version 2.0) was purchased from Qiagen (Hilden, Germany) and printed on Corning UltraGAPS slides (Corning, NY). The microarrays contained 70-mer oligonucleotides representing 21,329 genes as well as 3,871 additional features for control purposes. Slides were scanned and normalized, and P values were computed as described. 50 Genes with P < 0.05 were considered as significantly changed. MIAME-compliant data in MAGE-ML format as well as descriptions of protocols and microarrays have been submitted to the microarray database ArrayExpress at the European Bioinformatics Institute (www.ebi.ac.uk/arrayexpress) and are publicly available through the following accession number: E-MTAB-807.
Protein extraction, Western blotting, and reporter assays
Protein extraction and Western blotting, as well as reporter gene assays in transfected CV-1 cells, were all performed as previously described 15 and outlined in the supplementary material.
ChIP
ChIP was performed as previously described 18 and outlined in the supplementary material. ChIP primer positions and sequences are given in Figures 3B and 4B and Supplementary Table S2.
Chromosome conformation capture
The 3C methods were performed as described. 51 See supplementary material for details.
Footnotes
The author(s) declared no potential conflicts of interest with respect to the research, authorship, and/or publication of this article.
This work was supported by the Norwegian Research Council [FUGE grant number 175364 and 158961]; the Norwegian Cancer Society [grant number 419436-107692-PR-2007-0148]; the Presidium of the Russian Academy of Sciences [grant MCB]; and the Ministry of Science and Education of the Russian Federation [contracts 16.740.11.0353 and 16.740.11.0483].
References
Supplementary Material
Please find the following supplemental material available below.
For Open Access articles published under a Creative Commons License, all supplemental material carries the same license as the article it is associated with.
For non-Open Access articles published, all supplemental material carries a non-exclusive license, and permission requests for re-use of supplemental material or any part of supplemental material shall be sent directly to the copyright owner as specified in the copyright notice associated with the article.