
Abstract
Lysophosphatidic acid (LPA), an agonist that activates specific G protein–coupled receptors, is present at an elevated concentration in the serum and ascitic fluid of ovarian cancer patients. Although the increased levels of LPA have been linked to the genesis and progression of different cancers including ovarian carcinomas, the specific signaling conduit utilized by LPA in promoting different aspects of oncogenic growth has not been identified. Here, we show that LPA stimulates both migration and proliferation of ovarian cancer cells. Using multiple approaches, we demonstrate that the stimulation of ovarian cancer cells with LPA results in a robust and statistically significant proliferative response. Our results also indicate that Gα12, the gep proto-oncogene, which can be stimulated by LPA via specific LPA receptors, is overtly activated in a large array of ovarian cancer cells. We further establish that LPA stimulates the rapid activation of Gα12 in SKOV-3 cells and the expression of CT12, an inhibitory minigene of Gα12 that disrupts LPAR-Gα12 interaction and potently inhibits such activation. Using this inhibitory molecule as well as the shRNA approach, we show that the inhibition of Gα12 or silencing of its expression drastically and significantly attenuates LPA-mediated proliferation of ovarian cancer cell lines such as SKOV3, Hey, and OVCAR-3. Together with our findings that the silencing of Gα12 does not have any significant effect on LPA-mediated migratory response of SKOV3 cells, our results point to a critical role for LPA-LPAR-Gα12 signaling in ovarian cancer cell proliferation and not in migration. Thus, results presented here for the first time demonstrate that the gep proto-oncogene forms a specific node in LPA-LPAR–mediated mitogenic signaling in ovarian cancer cells.
Introduction
Ovarian cancer is currently the most fatal gynecological cancer with a 5-year survival rate of only 46%. 1 As compared to other better-characterized cancers such as breast, prostate, and colorectal cancers, there have been no major changes in methods of detection or treatment of ovarian cancers since the 1970s. In this context, the identification of lysophosphatidic acid (LPA) as a novel “ovarian cancer activating factor” present in ascitic samples from ovarian cancer patients was highly significant that indicated the potential role of LPA-mediated signaling events in ovarian cancer development and progression.2,3 However, the LPA-mediated aberrant signaling mechanisms that contribute to the development and progression of ovarian cancers have yet to be fully elucidated. Although a limited number of studies have identified the role of LPA in stimulating the migratory response of ovarian cancer cells,4,5 its role in mediating the proliferation of ovarian cancer cells is not fully understood. Unlike most solid tumors, there are no solid tissue structures separating the ovarian epithelium from its common sites of metastases such as the uterus, intestine, and mesentery. 6 Therefore, the acquisition of cell proliferation, rather than invasion, appears to be the crucial step in ovarian cancer progression. With this reasoning, we focused our studies on defining the role of LPA in ovarian cancer cell proliferation and establishing the identity of the critical G protein involved in transmitting such LPA-mediated proliferation signals. Our results indicate that LPA specifically stimulates the proliferation of ovarian cancer cell lines but not the nonmalignant IOSE or HOSE cell lines. Such LPA-mediated proliferation of ovarian cancer cells is inhibited by the expression of a competitively inhibitory minigene of Gα12 that is known to disrupt receptor- Gα12 interaction. Similar inhibition of LPA-stimulated proliferation of ovarian cancer cells is also demonstrated by shRNA-mediated silencing of Gα12 in these cells. Together, our results point to the critical role of Gα12, a member of the gep proto-oncogene family, 7 in transmitting LPA-mediated proliferation signals to ovarian cancer cells. Thus, our studies establish for the first time an unequivocal role for LPA and Gα12 signaling axis in ovarian cancer cell proliferation. Furthermore, the observation that inhibiting or silencing Gα12 attenuates LPA-mediated proliferation of ovarian cancer cells identifies the LPA-LPAR-Gα12 signaling nexus as a potential therapeutic target for ovarian cancer treatment and control.
Results
LPA stimulates the migration of ovarian cancer cells
LPA has been shown to stimulate mitogenic as well as migratory response in many different cell lines. However, it has been characterized more as a promigratory factor rather than as a mitogenic factor in ovarian cancer cells.4,5 Therefore, prior to analyzing the mitogenic role of LPA, we sought to confirm the functional activation of LPA-LPAR signaling in ovarian cancer cells. Two representative ovarian cancer cell lines, namely, Hey and SKOV3, were subjected to an in vitro wound-healing assay. Cells were stimulated with 20 µM LPA, essentially simulating the physiological levels of the LPA as measured in the ascites of ovarian cancer patients.8-11 After 24 hours, the closure of the wound as an index of cell migration was monitored. As shown in Figure 1, LPA-stimulated cells demonstrated greater closure of the wound as compared with unstimulated controls, confirming the previously established role of LPA4,5 as well as the functional expression of LPA-LPAR signaling in these cells.

LPA induces migration of ovarian cancer cells. (
LPA stimulates the proliferation of ovarian cancer cells
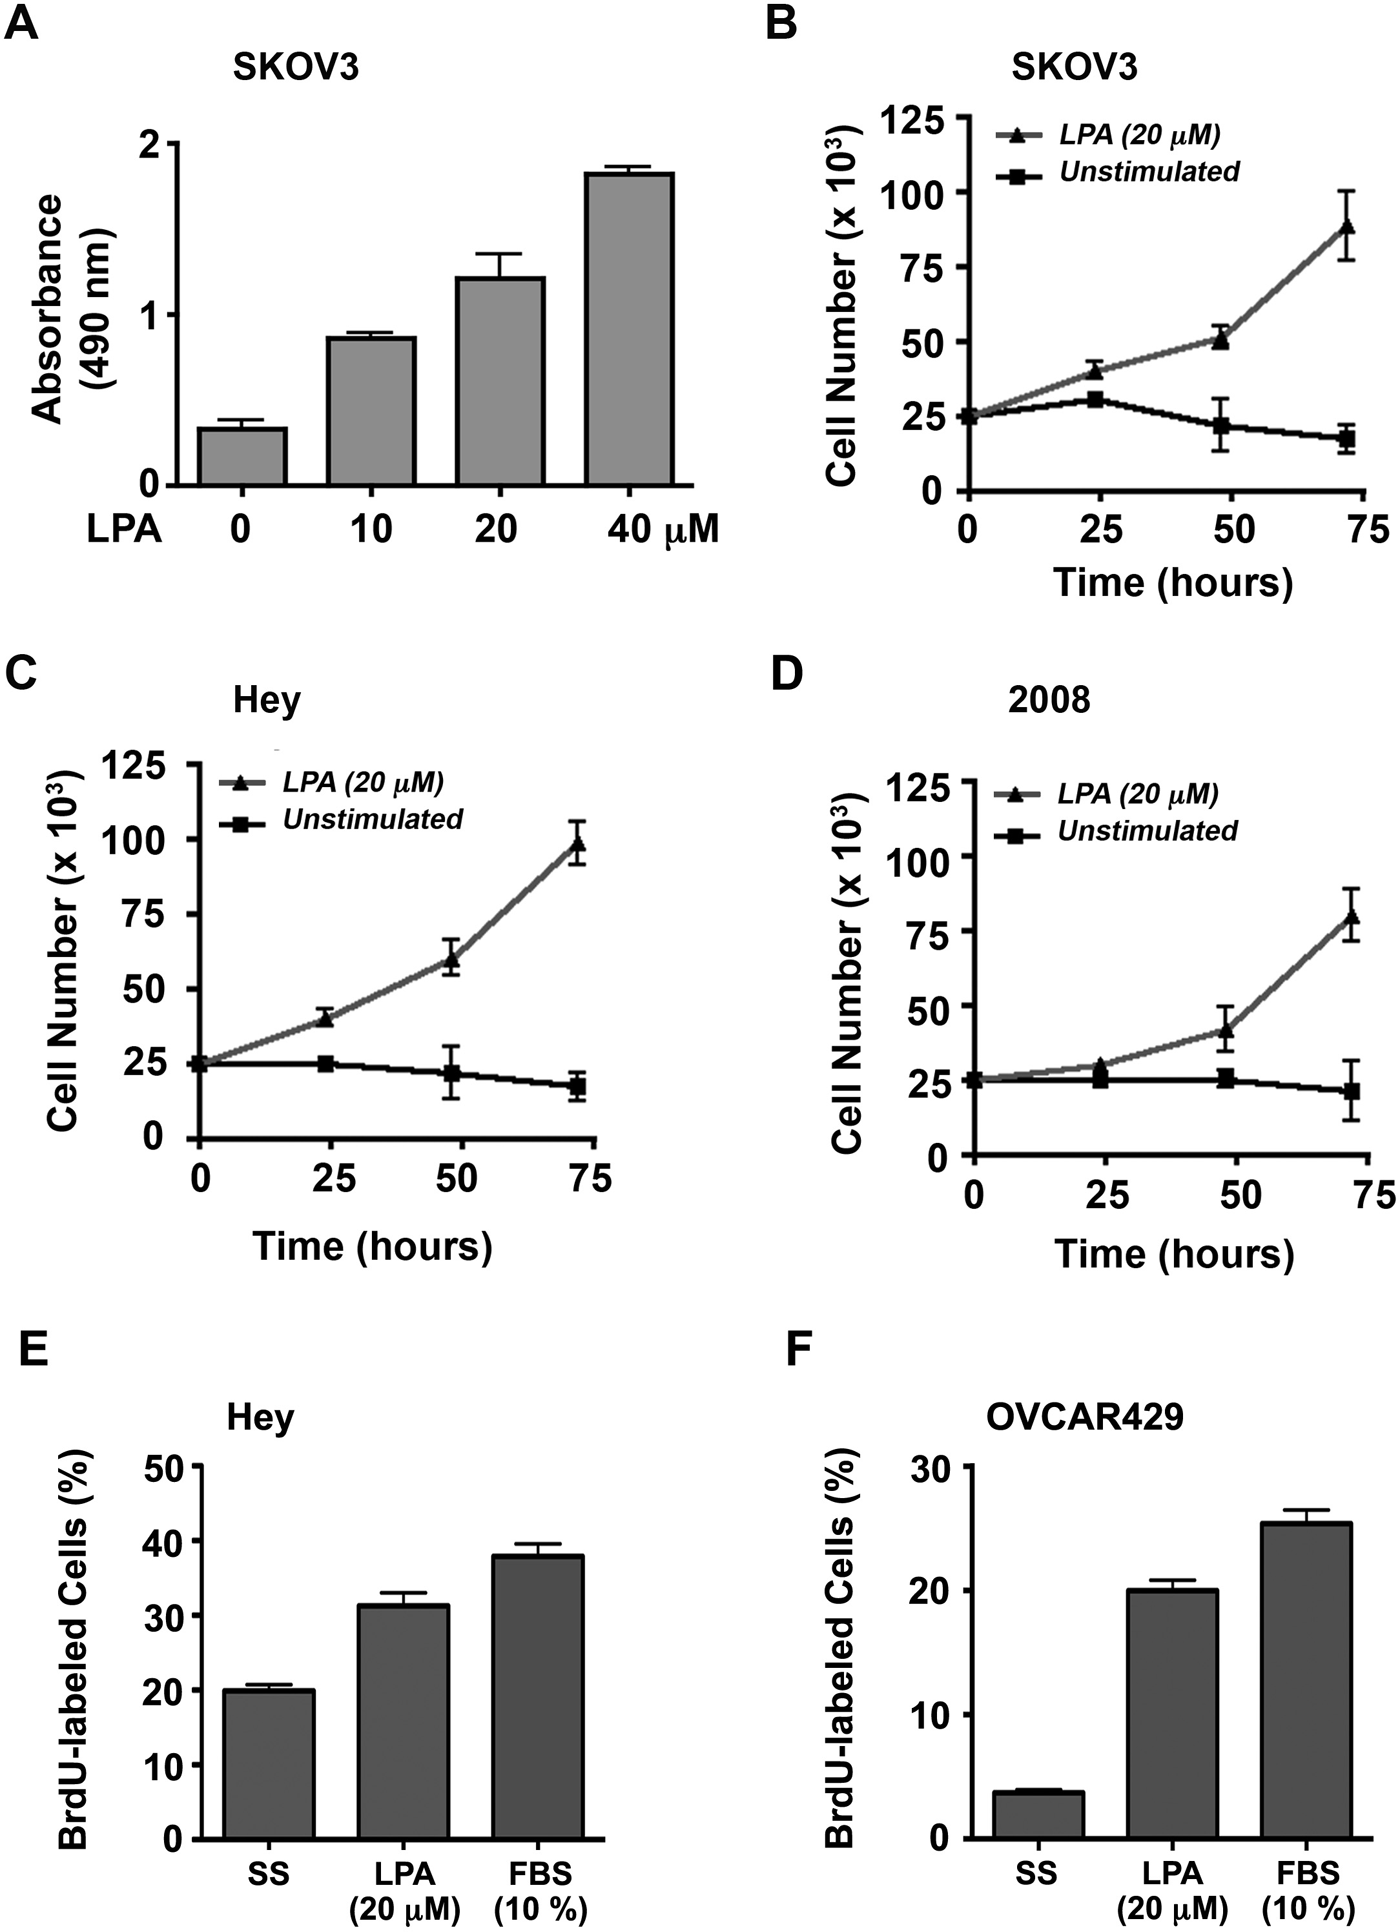
After confirming the promigratory role of LPA in ovarian cancer cells, we investigated the ability of LPA to stimulate ovarian cancer cell proliferation. To test, we analyzed the mitogenic response of SKOV3 cells in response to increasing concentrations of LPA. SKOV3 cells that were seeded in triplicate were serum starved for 24 hours and then incubated with 0, 10, 20, or 40 µM LPA for 48 hours. Proliferation of these cells in response to LPA was monitored and quantified using the CyQUANT reagent (Invitrogen, Carlsbad, CA) as described previously. 12 Results indicated an increase in cell number with LPA stimulation as compared to the unstimulated control. This response (P < 0.0001, even at 10 µM LPA) clearly demonstrated a promitogenic role for LPA in addition to establishing a dose-dependent response for LPA (Fig. 2A).
To validate further, we investigated the effect of 20 µM LPA, simulating the physiological levels of the ligand as measured in the ascites of ovarian cancer patients,9-12 on the proliferation of SKOV3 cells over a 72-hour time period. SKOV3 cells (2.5 × 10⁴/well) were seeded, serum starved, and then incubated with 20 µM LPA or unstimulated control. Triplicate aliquots of cells were collected every 24 hours for the 72-hour experiment and were counted with a hemocytometer. Results from these experiments substantiated the promitogenic role of LPA in stimulating the proliferation of SKOV3 cells (Fig. 2B). Following this, we investigated whether LPA stimulates proliferation in additional ovarian cancer cell lines. To test, we monitored the proliferation of the ovarian cancer cell line Hey, and 2008 in addition to SKOV3 cells (2.5 × 10⁴/well) were seeded, allowed to adhere overnight, serum starved for 24 hours, and then incubated with 20 µM LPA or unstimulated control. Triplicate samples were counted with a hemocytometer every 24 hours until 72 hours. The results demonstrated that in the unstimulated control, the cell number remained steady or decreased slightly over 72 hours. LPA stimulation, however, resulted in a time-dependent increase in number in each of the 3 cell lines (Fig. 2B-D). To confirm LPA-mediated DNA synthesis in ovarian cancer cells, we carried out fluorescence-based BrdU incorporation assay following a previously described procedure. Serum-starved Hey and OVCAR-429 cells that were stimulated with LPA (20 µM) for 48 hours along with appropriate control groups were pulsed with 5-promo-2-deoxyuridine for 24 hours. Cells were fixed and immunostained with anti-BrdU antibodies followed by Alexa Fluor 488–labeled (Invitrogen) secondary antibody and 4’-6-diamidino-2-phenylindole (DAPI). BrdU-positive and total (DAPI-stained) cells were analyzed by fluorescent microscopy. Quantification of the number of BrdU-labeled cells in relation to total cells indicated that LPA stimulated DNA synthesis in these cells almost to the extent of 10% fetal bovine serum (FBS) (Fig. 2E and 2F).
LPA induces cell proliferation. (
LPA stimulation of proliferation is restricted to ovarian cancer cell lines
Next, we investigated whether LPA could elicit similar proliferative response in nonmalignant ovarian cell lines. A panel of ovarian cancer cells along with 2 immortalized human ovarian epithelial cell lines derived from nonmalignant tissues, HOSE and IOSE, was tested for their mitogenic responses to LPA. SKOV3, Hey, and 2008 cells (2.5 × 10⁴/well) were seeded, serum starved, and then incubated with 20 µM LPA or unstimulated control. Proliferative response to LPA was determined using an assay based on crystal violet staining of live cells.14,15 Triplicate samples were collected every 24 hours for the 72-hour experiment, cells were stained with crystal violet, and the live dye-absorbing cells were quantified by measuring absorbance at 590 nm. Results from these experiments reconfirmed the promitogenic role of LPA in using a different assay procedure (Fig. 3A). Using this assay, we examined the proliferative response of the nonmalignant HOSE and IOSE cells to LPA. HOSE and IOSE cells stimulated with 20 µM LPA or 10% FBS (positive control) along with unstimulated controls were subjected to crystal violet–based proliferation assay at 0-, 24-, and 72-hour time points. While stimulation with FBS resulted in a highly robust response in IOSE and HOSE, the response observed in the LPA-stimulated cells was identical to unstimulated cells (Fig. 3B). These results clearly indicate that the proliferative response observed with LPA is specific to ovarian cancer cells and not elicited in the nonmalignant cell lines.
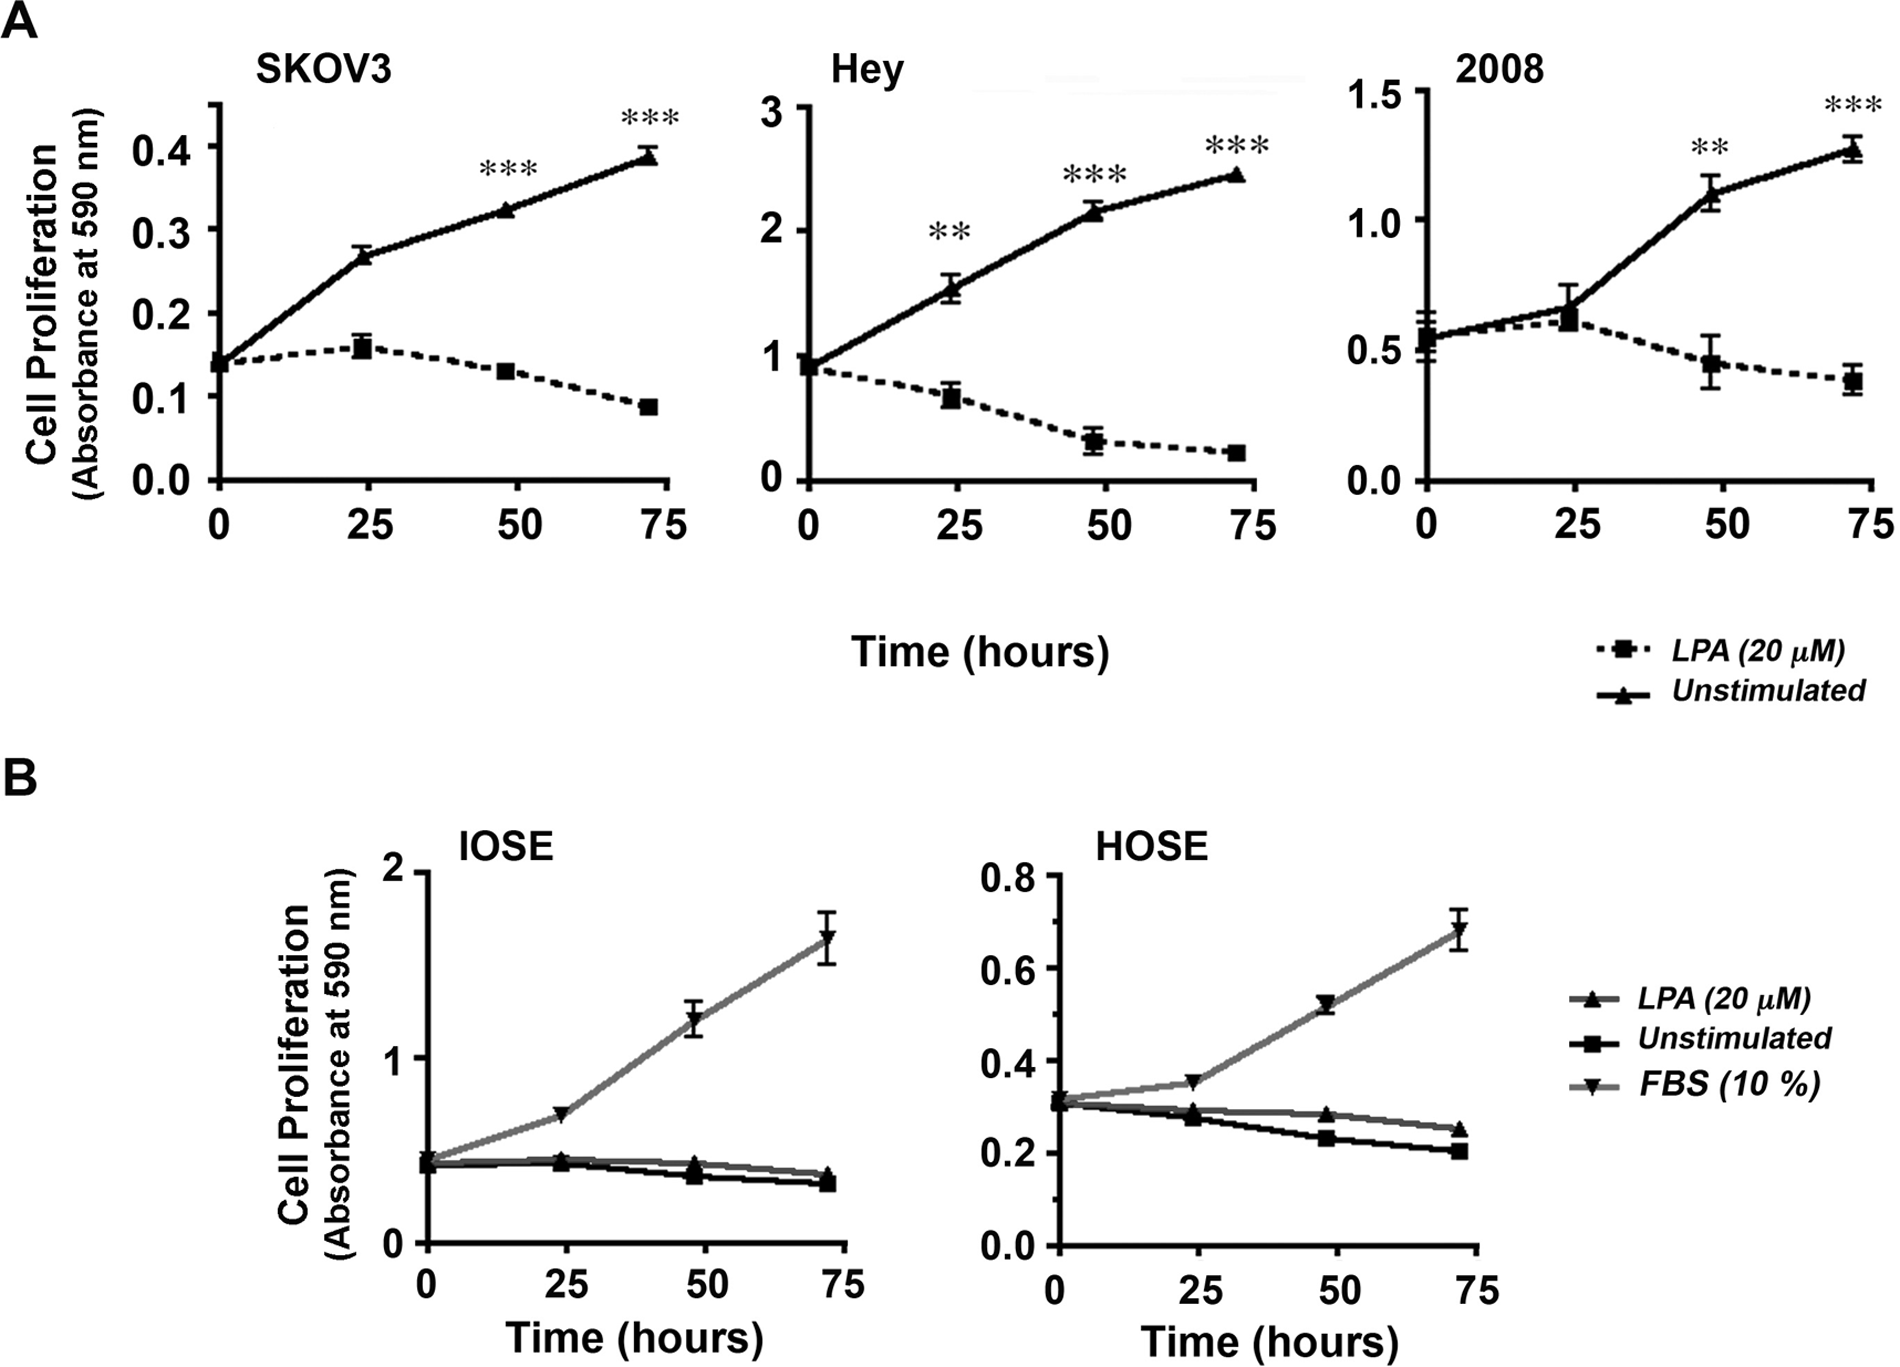
LPA-mediated proliferation is specific to ovarian cancer cells. Proliferation of SKOV3, Hey, and 2008 cells was monitored using crystal violet–based proliferation assay
13
(
LPA receptors are differentially expressed in ovarian cancer cells
It has been well characterized that LPA-stimulated LPA receptors (LPAR) transmit intracellular signals by activating specific G proteins. 16 Previous studies have shown that LPARs belonging to the Edg family (LPAR1-3) are differentially expressed in ovarian cancer cells.17-20 It has been demonstrated that ovarian cancer cells overexpress LPAR2 and LPAR3. To assess whether such differential expression accounts for the sensitivity of ovarian cancer cells to LPA as opposed to HOSE cells, first we monitored the expression profiles of LPAR1 and LPAR2 receptors in the panel of ovarian cancer cells that were used in our studies by immunoblot analysis. Our results clearly indicated that the expression of LPAR2 was generally increased in ovarian cancer cell lines compared to HOSE cells (Fig. 4, upper panel). However, we were not able to ascertain LPAR3 profiles in these cells due to the lack of fully characterized LPAR3-specific antibodies from commercial vendors. Therefore, we investigated the expression profile of mRNAs encoding LPAR1 to LPAR3 receptors by reverse transcriptase polymerase chain reaction (RT-PCR). Results from our analysis indicated that all of the ovarian cell lines expressed LPA1 receptors, whereas the expression of LPAR3 was restricted to ovarian cancer cell lines (Fig. 4, lower panel). Together with the results from immunoblot analysis, our results indicate that LPAR2 and LPAR3 levels are increased in ovarian cancer cell lines, thereby confirming a previous observation that LPAR2 and/or LPAR3 receptors play a critical role on tumorigenicity and aggressiveness of ovarian cancer cells. 21
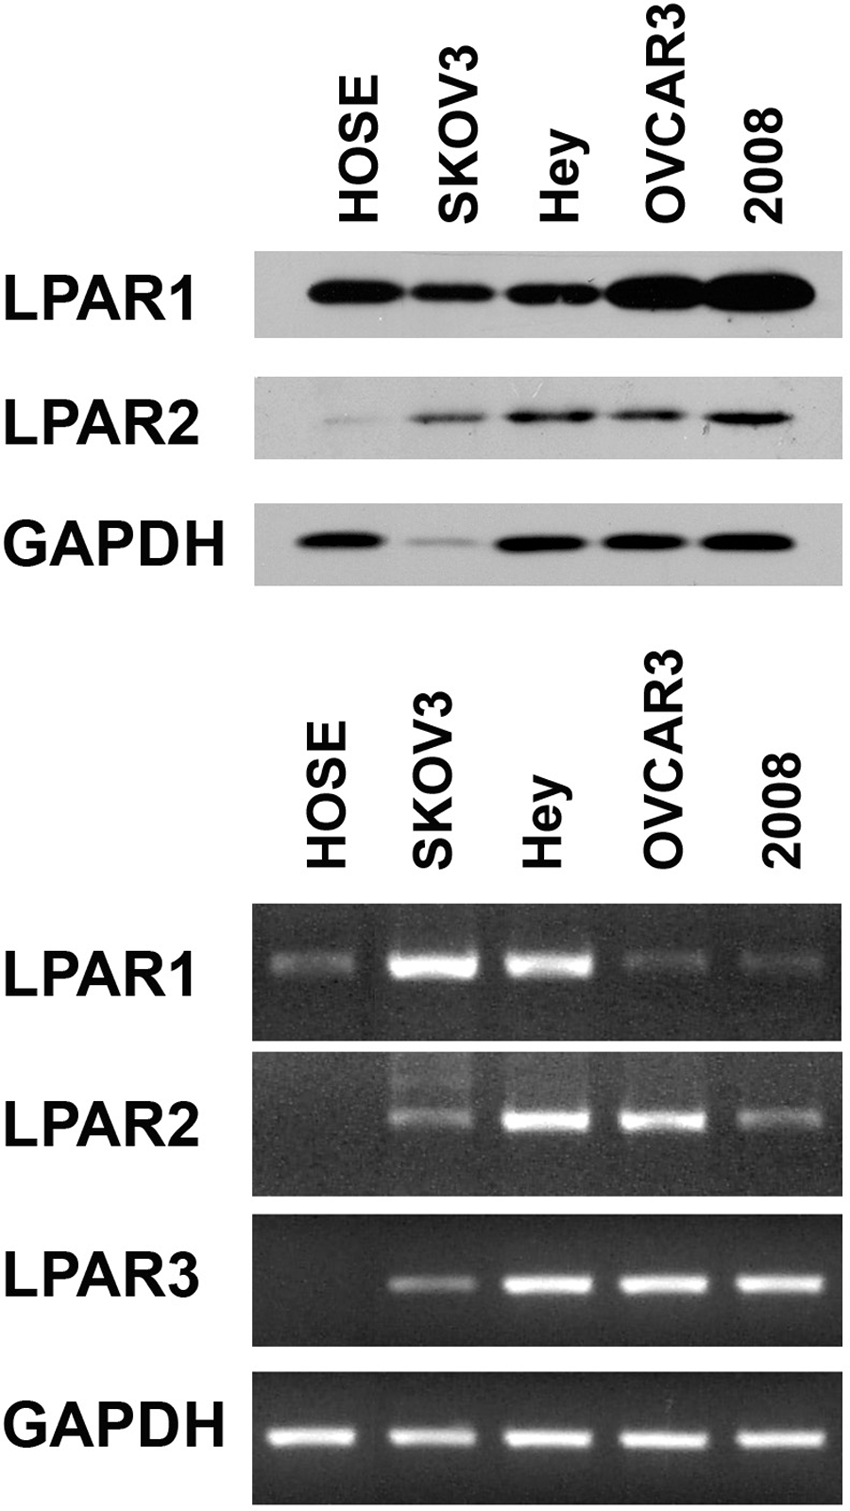
Expression of LPARs. Expression of LPAR1 and LPAR2 HOSE, SKOV3, Hey, OVCAR-3, and 2008 was monitored by immunoblot analysis (
Gα12, the gep proto-oncogene, is overexpressed and activated in ovarian cancer cell lines
Considering the emerging pathophysiological role of LPA-LPAR–stimulated proliferation of ovarian cancer cells, it is of critical interest to identify the specific G protein involved in LPA-mediated proliferative response of ovarian cancer cells. Of the different Gα subunits that can be activated by LPA-LPAR, Gα12, the gep proto-oncogene, has been identified as the most potent α subunit in promoting cell proliferation and neoplastic transformation.7,22 Therefore, hypothesizing that LPA-LPAR mitogenic signaling involves Gα12 and the increased sensitivity of cancer cells to LPA is a function of the increased activation of Gα12, we monitored the expression profile as well as activation status of Gα12 in a panel of ovarian cancer cell lines incubated with serum. While the expression profile was analyzed by immunoblot analysis, the activation status was monitored using a pull-down binding assay that makes use of the observation that the activated forms of Gα12/13 bind to the tetratricopeptide repeat (TPR) domain of the Ser/Thr-phosphatase type 5.23,24 Thus, an interaction between the glutathione S-transferase (GST)–fused TPR domain of Ser/Thr-phosphatase type 5 (GST-TPR) and activated Gα12 can be used to determine the activation status of Gα12 by monitoring the presence of Gα12 in GST-TPR precipitate. 24 Results from such an analysis indicated that many of the cell lines represented by 2008, Hey-8, OVCAR-3, OVCAR-429, OVCAR-432, and C272 showed at least a 2-fold increase in expression of Gα12 compared to the control HOSE cell line (Fig. 5, upper panel). More interestingly, these results also indicated that Gα12 is in activated configuration in all of these cell lines when incubated with serum (Fig. 5, lower panel). Considering the potent mitogenic role of Gα12 and elevated LPA levels leading to autocrine signaling loop in ovarian cancer cell lines,25-27 these results point to Gα12 as a possible mediator of LPA-mediated promitogenic signaling in ovarian cancer cells.
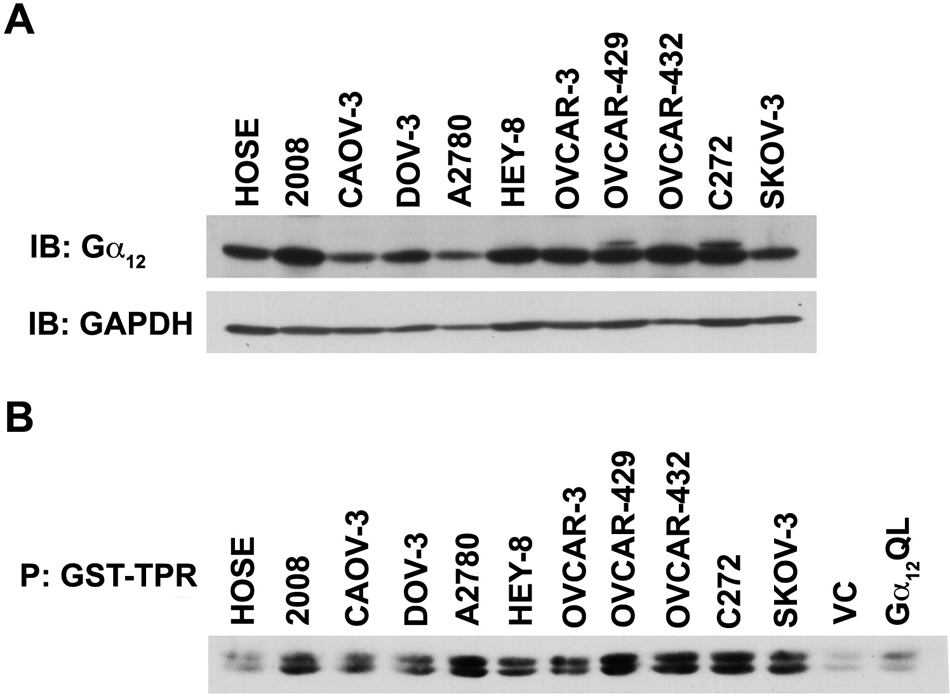
Expression and activation profiles of Gα12 in ovarian cancer cells. Lysates (50 µg) from a panel of ovarian cancer cell lines were collected, separated by 10% SDS-PAGE, and subjected to immunoblot analysis using antibodies specific to Gα12. Each blot was stripped and reprobed with the indicated antibody and with GAPDH as a loading control. The experiment was repeated 4 times, and a representative immunoblot is presented (
Gα12 minigene inhibits LPA-mediated proliferation of ovarian cancer cells
To test whether the increased expression of Gα12 relates to LPA-mediated proliferative response in ovarian cancer cells, a series of novel ovarian cancer cell lines was established that expresses a dominant-negative form of Gα12. Based on the findings that the C-terminal region of G proteins is critical for interactions with cognate receptors, 28 a minigene of Gα12 encoding the C-terminal 13–amino acid domain of Gα12 has been used as a dominant-negative mutant of Gα12 that can act as a competitive inhibitor of GPCR–G protein interaction. 29 Such a dominant-negative mutant of Gα12 was constructed (CT12), and stable cell lines expressing CT12 were used to investigate whether LPA-mediated proliferation is dependent on Gα12. After verifying the expression of CT12 (Fig. 6A, upper panel) and its ability to inhibit LPA-mediated stimulation of Gα12 in the representative SKOV3 cells using GST-TPR pull-down assay (Fig. 6A, lower panel), the proliferative response of ovarian cancer cells expressing CT12 in response to LPA was determined. To accomplish this, a series of proliferation assays was carried out to characterize the proliferative response to LPA in the SKOV3-CT12 and control cells. SKOV3-CT12 cells from 3 independent clones (clones 1, 2, and 11) were included, along with empty vector pcDNA3 and parental (WT) SKOV3 cells as controls. 2.5 × 10⁴ cells were seeded, serum deprived for 24 hours, then incubated in the presence of 20 µM LPA, and enumerated every 24 hours for the 72-hour experiment (as described in Materials and Methods). The results clearly demonstrate that inhibition of Gα12 signaling results in a significantly attenuated proliferative response to LPA (Fig. 6B). Most notably, the data clearly show that the proliferative response to LPA was significantly attenuated in each of the 3 CT12 clones. The quantification of cell numbers indicated that the expression of CT12 attenuated the growth response by 50% to 57% compared to vector control (P < 0.05) in all of the SKOV3-CT12 clones (Fig. 6B). Expression of CT12 elicited similar inhibition of LPA- mediated proliferation in Hey (Fig. 6C) and OVCAR-3 cells (Fig. 6D).
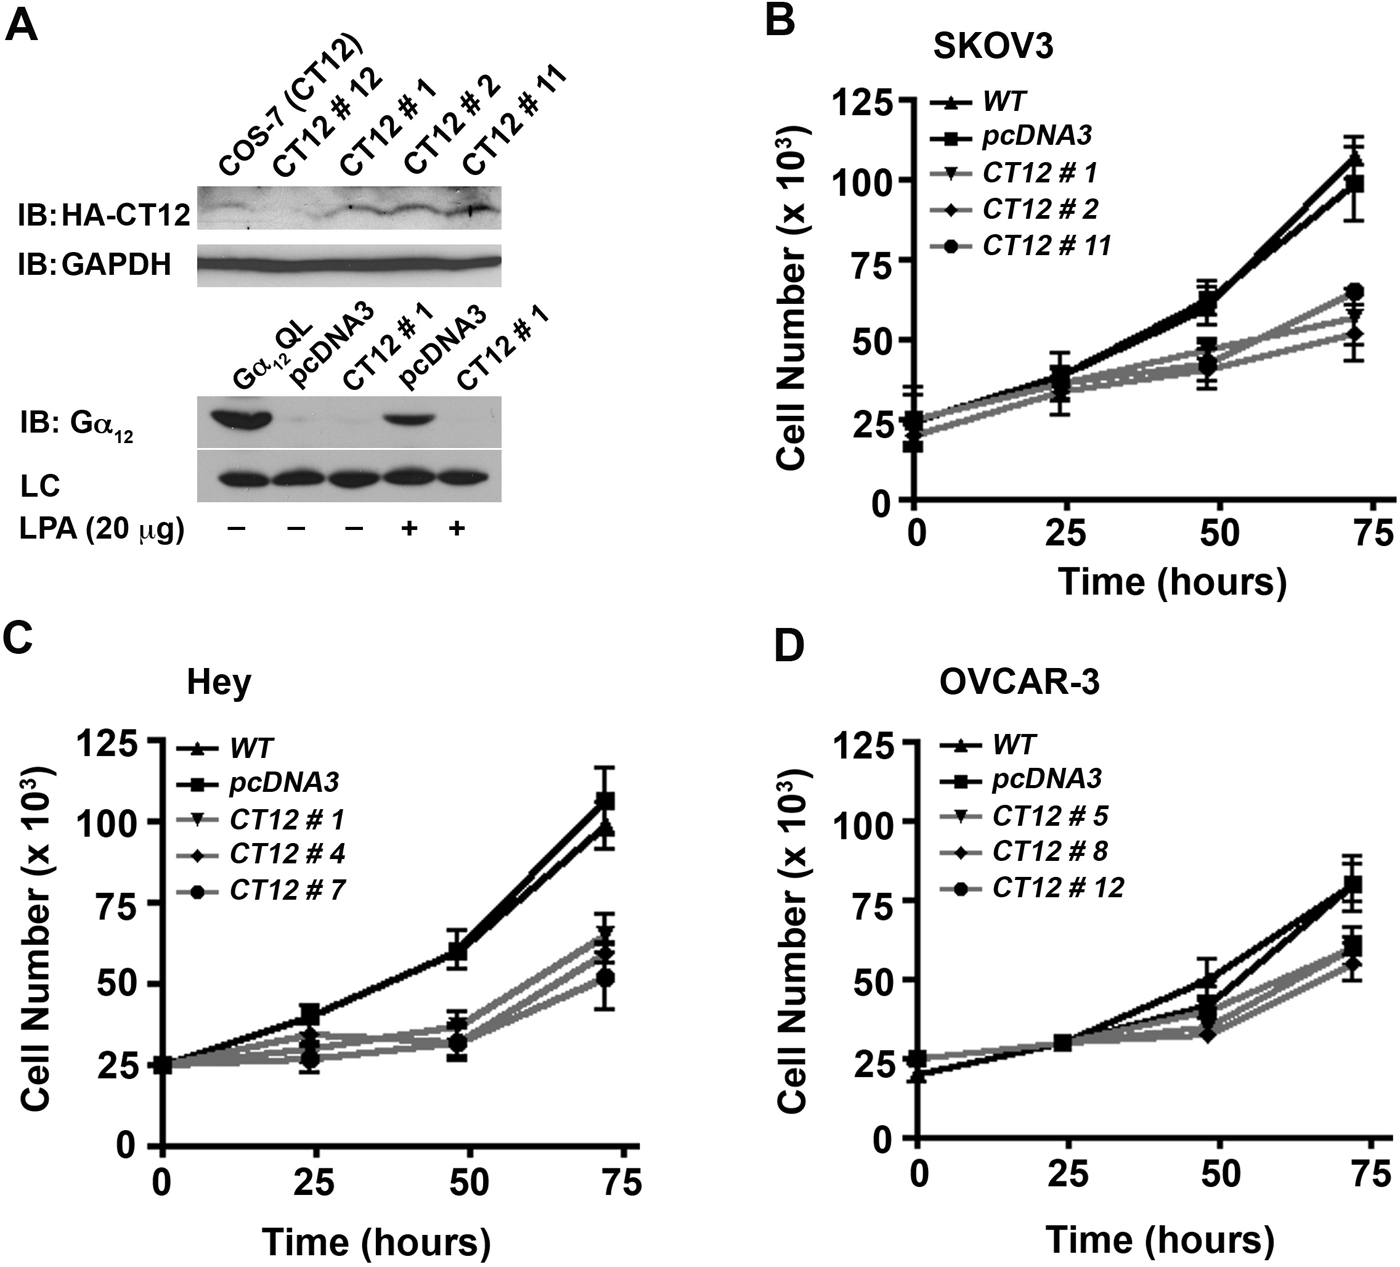
Dominant-negative inhibitory mutant of Gα12 attenuates LPA-mediated proliferation of ovarian cancer cells. Expression of CT12, the dominant-negative inhibitory mutant of Gα12, was monitored by immunoblot analysis using 250 µg of lysates obtained from representative CT12-SKOV3 clones (
Silencing Gα12 inhibits LPA-mediated proliferation and not migration of ovarian cancer cells
Gα12 minigene has been widely used as an inhibitor of receptor-Gα12 interaction and subsequent signaling pathways. Therefore, the observed effect of Gα12 minigene on LPA-mediated proliferation of ovarian cancer cell lines is highly significant. However, to further confirm the specificity of this response, first we examined whether silencing Gα12 has any effect on the migration of ovarian cancer cells stimulated by LPA. Using SKOV3 cells in which the expression of Gα12 was partially silenced by shRNA strategy, we monitored the migration of these cells. Given the rather subtle stimulation of migration observed with the wound-healing assay (Fig. 1), we elected to quantify the effect of silencing Gα12 on LPA-induced migration using a transwell migration assay. Results indicated that the silencing of Gα12 rather promoted the migratory response of these cells (Fig. 7). To determine the effect of silencing of Gα12 in LPA-mediated proliferation, these cells were seeded, serum starved, and stimulated with 20 µM LPA along with appropriate control groups. Proliferation of these cells was monitored over a 72-hour period by determining their proliferative response of these cells at every 24-hour time point using the crystal violet–based proliferation assay. Results indicated that the silencing of Gα12 attenuated the proliferative response of these cells by more than 50% in all of these cell lines (Fig. 8), thus confirming the results obtained with the expression of the inhibitory CT12. Together with the results presented in Figure 6, our data indicate that Gα12 is specifically involved in LPA-mediated proliferative response and not migratory response of ovarian cancer cells.
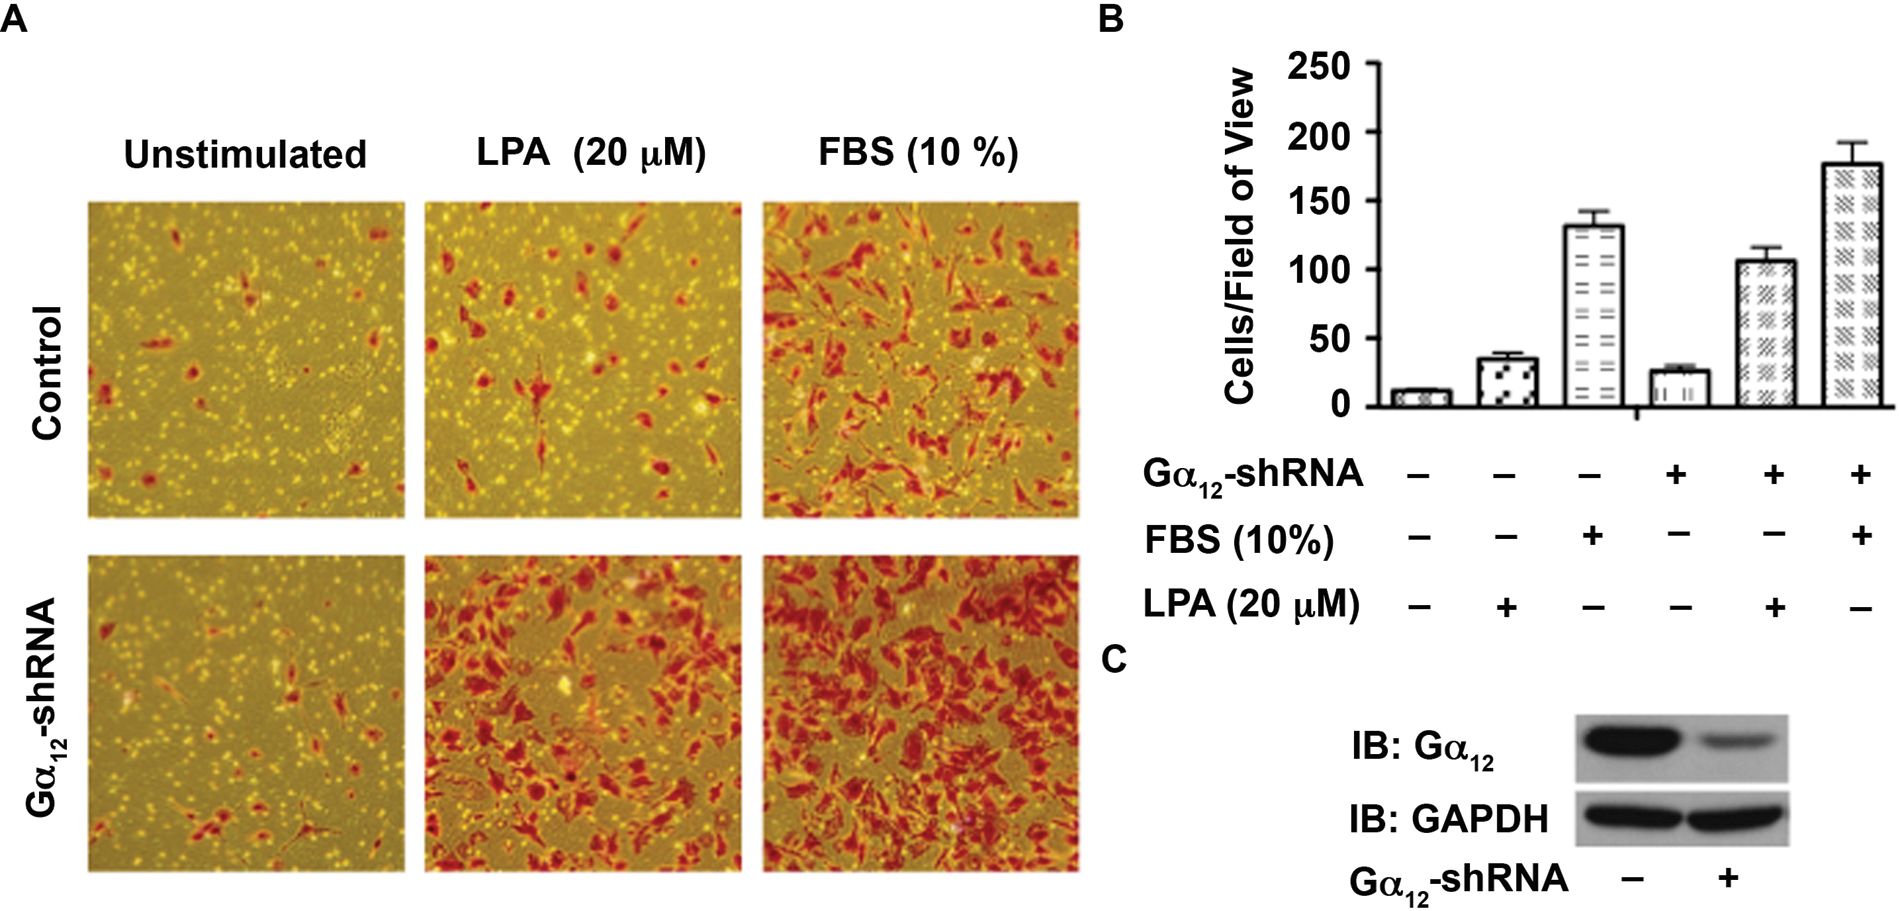
Silencing Gα12 does not attenuate LPA-mediated SKOV3 cell migration. (
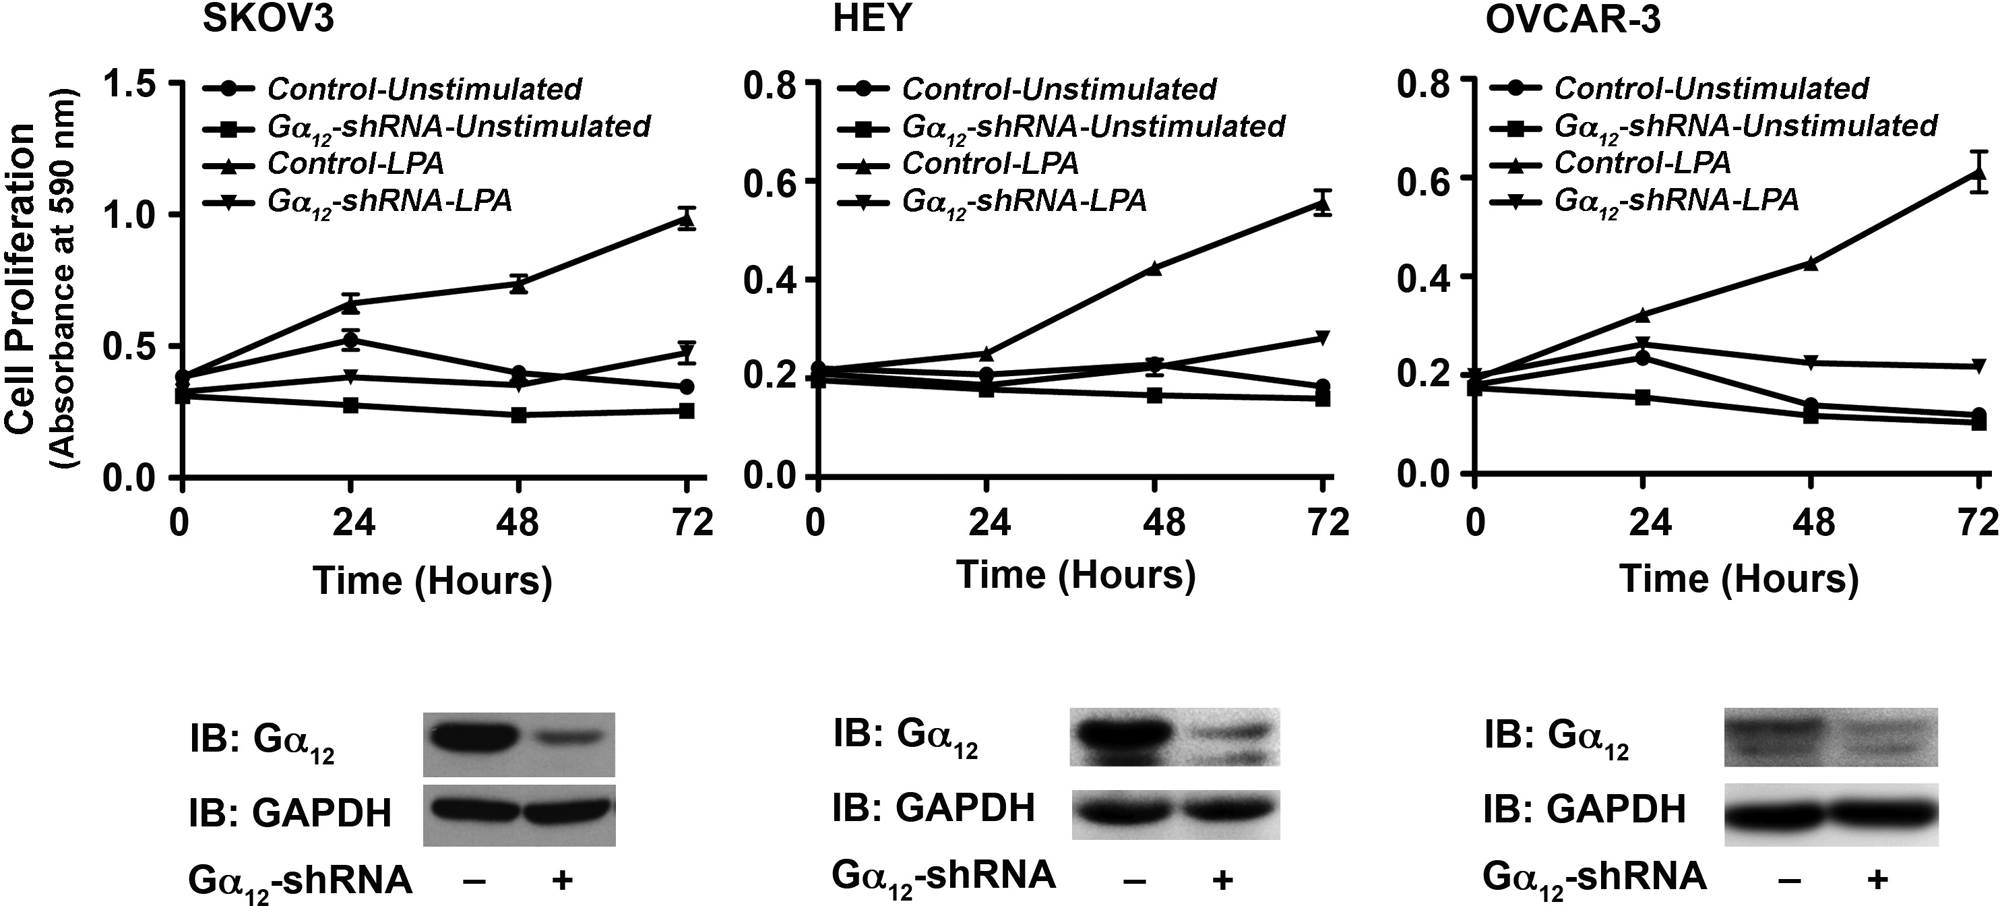
Silencing Gα12 attenuates LPA-mediated SKOV3 cell migration. Proliferation of SKOV3, Hey, and OVCAR-3 cells (2.5 × 10⁵ cells/well) in which the expression of endogenous Gα12 was silenced by stably expressed Gα12-specific shRNA in response to LPA (20 µg) along with unstimulated control groups using crystal violet–based proliferation assay. Triplicate samples were collected at 0, 24, 48, and 72 hours following LPA stimulation and processed for analysis. Absorbance at 590 nm was used as an index of cell proliferation. Results are mean ± SEM from 3 independent experiments (
Discussion
The role of LPA as a novel factor in the genesis and progression of ovarian cancers has been well established. However, since the publication of the original report that demonstrated LPA as an “ovarian cancer activating factor” that stimulated the proliferation of Hey cells,2,3 the downstream events involved in LPA-mediated mitogenic pathway have not been fully characterized. Although LPA receptors have been shown to activate the Gi, Gq, and G12 family of G proteins, the role of oncogenic Gα12 in LPA-stimulated mitogenic signaling is not fully understood. In this regard, the results presented here demonstrating that LPA induces a potent mitogenic response and that this is mediated by a signaling mechanism involving Gα12, which has been defined as the gep oncogene, are highly significant. While our results have confirmed the promigratory effect of LPA in ovarian cancer cells (Fig. 1A and 1B), most significantly, these studies demonstrate that LPA induces a robust proliferative response in multiple ovarian cancer cell lines (Fig. 2). The findings that LPA elicits mitogenic response in ovarian cancer cells (Fig. 2) but not in HOSE or IOSE cells (Fig. 3) provide strong evidence that the LPAR subtypes expressed in ovarian cancer cells (Fig. 4) are uniquely hardwired to proliferative response. This is consistent with the observation that silencing LPA2 or LPA3 receptors attenuated LPA-stimulated proliferation of SKOV3 cells. 21
In addition to confirming an unequivocal role for LPA in stimulating proliferation of ovarian cancer cells, we firmly establish here that Gα12 is the critical signal transducer involved in this response. First, using the GST-TPR binding/pull-down assay, we identify that Gα12 exists in an activated configuration in a large panel of ovarian cancer cells and not in nonmalignant HOSE cells incubated with serum (Fig. 5). Recent studies have shown that ovarian cancer cells as well as ovarian cancer cell lines show an autocrine loop involving LPA and LPA receptors. In light of these observations, it is tempting to speculate that the observed increase in the levels of active configuration of Gα12 (Fig. 5B) is indicative of the presence of such a functional Gα12-activating autocrine loop in ovarian cancer cells. In addition to demonstrating the rapid activation, within 1 minute, of endogenous Gα12 by LPA, we show here that CT12, the dominant-negative minigene of Gα12, potently inhibits such activation (Fig. 6A). In conjunction with the observation that Gα12 exists in an activated configuration in ovarian cancer cells and ovarian cancer cells show a heightened production of LPA along with an increased expression of LPA2/3 receptors, it can be surmised that LPA-LPAR–mediated activation of Gα12-dependent signaling pathways plays a crucial role in ovarian cancer cells including their proliferation. The clinching evidence for this supposition comes from the use of ovarian cancer cell lines that stably express CT12, the dominant-negative mutant construct of Gα12 (CT12) or shRNA for Gα12 (Figs. 6 and 8). The CT12 construct functions by inhibition of the receptor-Gα12 protein interaction, which occurs via the C-terminus of the α subunit. 29 Given this, the results indicating that CT12 expression completely inhibited the activation of Gα12 (Fig. 5B) and significantly attenuated the mitogenic response to LPA (Fig. 6) point to the critical role of LPA-LPAR-Gα12 signaling in ovarian cancer cell proliferation. While it can be argued that LPA-receptor-CT12 also affects the activation of other G proteins that could be activated by LPA receptors, our finding that the silencing of Gα12 attenuates LPA-stimulated proliferation of ovarian cancer cells (Fig. 8) firmly establishes that it is a Gα12-specific event. It is of great interest to note here that the signaling conduit provided by Gα12 is only involved in cell proliferation and not in migration (Figs. 7 and 8). It is surprising to note that the silencing of Gα12 rather promotes LPA-mediated cell migration (Fig. 7). Although the underlying mechanism is presently unknown, it is possible that silencing Gα12 leads to the release of Gα12-interacting signaling components, involved in both proliferation and migration such as the Rho family of GTPases, that become available for other G proteins that can promote cell migration. In this context, it should be noted here that silencing of Gα13 leads to a strong attenuation of LPA-stimulated migration of SKOV3 cells with little or no effect on LPA-mediated proliferation (Ha et al., unpublished data). Thus, LPA-Gα12 signaling appears to focus on cell proliferation rather than cell migration. Collectively, our findings presented here establish a thus far uncharacterized, critical role for Gα12 in LPA-mediated cell proliferation.
It is important to note that the studies presented here establish for the first time that Gα12 signaling mediates the proliferative response to LPA in ovarian cancer cells. This is consistent with the neoplastic growth-promoting role of Gα12 in fibroblast and other cell systems.30-34 While many of these studies have used ectopic expression of mutationally active constructs to characterize the growth-promoting effects of Gα12, none of the studies have established a role for the activation of endogenous Gα12 in these pathways. Therefore, the results presented here, demonstrating that 1) the endogenous Gα12 is activated by pathophysiological concentrations of LPA (Fig. 6A, lower panel, lane 4), 2) the expression of CT12 results in the complete inhibition of Gα12 activation by LPA (Fig. 6A, lower panel, lane 5), and 3) the expression of the inhibitory CT12 attenuates LPA-mediated proliferation of ovarian cancer cells (Fig. 6), are highly significant. These findings, taken together with similar results obtained with the use of shRNA-mediated silencing of Gα12 specifically on LPA-mediated proliferative response (Figs. 7 and 8), firmly establish the role of Gα12 in LPA-mediated mitogenic signaling in ovarian cancer cells.
These data contribute to the emerging role of LPA as an autocrine factor in ovarian carcinoma. Recent studies have demonstrated that significant levels of LPA are produced by multiple ovarian cancer cell lines compared to cells derived from normal ovarian surface epithelium. 25 This autocrine synthesis has been linked to the activity of an integral membrane-associated phospholipase autotaxin, 26 as well as decreased expression and activity of the lipid phosphate phosphatase-1 (LPP-1). 27 It has been speculated that the oncogenic response to LPA could be explained by overexpression of LPAR2/3 in malignant compared to benign ovarian tissues.17-20 Recently, it has also been demonstrated that the SKOV3 xenografts overexpressing LPAR2 or LPAR3 resulted in increased tumor size, ascites volume, and decreased animal survival. 21 However, based on data suggesting that LPAR3 is not known to interact with Gα12, 35 it can be speculated that the pathophysiological signaling event in ovarian cancer involves the LPA-LPA2-Gα12 signaling unit. However, in light of the observations that there are at least 4 more, albeit less characterized, LPARs that can potentially couple to Gα12, further work should identify the specific receptor involved in Gα12 activation and subsequent stimulation of proliferation of ovarian cancer cells. Now that the basic paradigm involving LPA-LPAR-Gα12 in ovarian proliferation has been established, studies that are currently under progress should unravel the identities of the specific LPAR involved in this pathway, signaling mechanism downstream of the gep proto-ongone Gα12, and the target genes that mediate ovarian cancer genesis and/or progression. More significantly, our findings that the silencing or inhibition of Gα12 using an 11–amino acid peptide potently attenuates LPA-mediated proliferation of ovarian cancer cells identify the components of the LPA-LPAR-Gα12 signaling nexus as potential therapeutic targets for ovarian cancer treatment.
Materials and Methods
Cells, plasmids, and transfections
The ovarian cancer cell lines SKOV3, HEY, and OVCAR-3 were kindly provided by Dr. E. Premkumar Reddy (Mount Sinai School of Medicine, New York, NY). The 2008 cells were kindly provided by Dr. Scott Shore (Fels Institute, Temple University, Philadelphia, PA). In addition, HOSE cell lines derived from normal, noncancerous, ovarian tissue specimens, immortalized with HPV E6/E7, 36 were a kind gift from Dr. George Tsao (University of Hong Kong, Hong Kong). All of these cell lines were maintained in Dulbecco’s modified Eagle’s medium (DMEM) (Cellgro, Manassas, VA) containing 10% FBS (Gemini Bio-Products, West Sacramento, CA), 50 U/mL penicillin, and 50 µg/mL streptomycin at 37°C in a 5% CO2 incubator. LPA was obtained from Avanti Polar Lipids (Alabaster, AL). It was dissolved to 20 mM stock solutions in sterile water and stored at −20°C until use.
Construction of Gα12 minigene
The pcDNA3 vector expressing C-terminal 11 amino acids of Gα12 tagged with HA-epitope (termed CT12) was constructed as follows: Strands of complementary oligonucleotides encoding the C-terminal 11 amino acids of Gα12 (LQENLKDIMLQ) were synthesized along with the flanking BamHI and HindIII sites for cloning into a pcDNA-HA-tag vector. For the sake of screening clones, a diagnostic silent KpnI site was introduced in the adapter sequence. In order to generate the double-stranded DNA sequence, the following complementary strands of oligonucleotides (5′GGTGGATCCGGGTACCCTGCAGAGA ACCTGAAGGACATCATGCTGCAGTGAAAGCTT GCG3′ and 5′CGCAAGCTTTCACTGCAGCATGATGTC CTTCAGGTTCTCCTGCAGGGTACCCGGATCCACC3′) were mixed at 1 µg/µL, heated to 95°C, and cooled slowly to anneal as DNA duplex. The vector and adapter sequences were digested with BamHI and HindIII and sequentially and gel purified using Qiagen Gel purification kit (Qiagen, Valencia, CA). The fragments were ligated and transformed in DH5α cells. Positive clones were identified by restriction analysis with KpnI followed by DNA sequencing.
Establishing CT12-expressing ovarian cancer cell lines
pcDNA3 vectors encoding HA-epitope–tagged CT12 constructs (C-terminal 11–amino acid peptide of Gα 12 ) were transfected into SKOV3, OVCAR-3, Hey, and Cos-7 cells using the FuGENE 6 reagent (Roche, Indianapolis, IN) according to the manufacturer’s protocol. Briefly, 9 µL of FuGENE reagent (Roche) was mixed with 738 µL DMEM supplemented with 12.5 mM HEPES. There was 3 µg of DNA added to this solution, which was incubated for 20 minutes at room temperature. This solution was added to a 100-mm culture dish of the indicated cell line grown to approximately 40% confluence. After 24 hours, the cells were inspected for any signs of cytotoxicity and changed to fresh media containing 10% FBS. Stable clones expressing the pcDNA3.1 vector containing the 12CT cassette and the neomycin resistance gene were selected from the transfectants using a G418 antibiotic selection protocol following previously published methods. 37 Expression of the 12CT was verified by immunoblot analysis.
Establishing Gα12-silenced ovarian cancer cell lines
pLKO.1 vectors encoding a set of human shRNA-targeting Gα12 (RHS4533-NM_007353) and the control shRNA vector were obtained from Open Biosystems (Huntsville, AL). SKOV3, Hey, and OVCAR-3 cells were transfected with pLKO.1-shRNA/Gα12 or pLKO.1 vector control, respectively, using Amaxa Nuclearfector (Lonza, Walkersville, MD). To select for stably transfected shRNA/Gα12 cell colonies, puromycin (2 µg/mL; MP Biomedicals, Solon, OH) was added 24 hours posttransfection. Single clones were cored, and the silencing of Gα12 expression was by Western blotting.
In vitro wound-healing assay
The in vitro wound-healing assay was carried out following previously published methods. 38 5 × 10⁵ cells were seeded into 60-mm culture dishes with media containing 10% FBS and allowed to adhere overnight. Cells were then washed 3 times with PBS and incubated in serum-deprived media for 24 hours. A linear scratch wound was made across the cell monolayer using the sharp end of a 10-µL sterile pipette tip. The cells were washed with serum-free media to remove cellular debris. Fields of view (at 100x magnification) were selected at random along the linear wounds and imaged using an Olympus CK40 microscope (Tokyo, Japan) and Kodak DC290 camera system (Rochester, NY). The photographed fields were marked with a felt tip marker to allow re-identification at the next time point. The cells were then incubated with serum-free media containing 20 µM LPA or serum-free media alone for the control. After 24 hours’ incubation, the fields of view were identified and re-imaged.
Transwell migration assay
Cell migration was monitored using a transwell chamber assay as previously described. 39 Cell culture inserts (polyethylene terephthalate membrane with 8.0-µm pores, #353097; BD Biosciences, Franklin Lakes, NJ) were coated with rat-tail collagen type 1 (BD Biosciences). The collagen-coated cell culture inserts containing 4 × 10⁵ cells suspended in 200 µL serum-free media were placed in the well of the companion plate. Each well contained 500 µL media containing serum-free media control, serum-free media containing 20 µM LPA, or 10% FBS. The cells were incubated for 20 hours. Nonmigrating cells on the proximal side of the inserts were removed with a cotton swab, and the migrated cells on the distal side of the insert were fixed and stained with Hemacolor (EMD Chemicals Inc., Gibbstown, NJ). Images were obtained of random fields of view at 100x magnifications, and the number of migrated cells was enumerated.
Cell proliferation assays
Cell proliferation assay using CyQUANT reagent was carried out using the CyQUANT Cell Proliferation Kit (Invitrogen, Carlsbad, CA) following previously published procedures. 12 Equal numbers of cells (5 × 10³) were seeded into 96-well plates overnight, serum deprived for 24 hours, and then stimulated with 10, 20, or 40 µM LPA or unstimulated control for 48 hours. The cells were then quantified using the CyQUANT reagent (Invitrogen) as described by the manufacturer, and the fluorescence was monitored using a microplate reader at 492-nm absorbance. Cell proliferation measurement by crystal violet staining was carried out according to previously published protocols.15,16 Equal numbers of cells (2.5 × 10⁴) were seeded in 12-well culture dishes overnight, serum deprived for 24 hours, and then stimulated as described above. At the indicated time point, cells were fixed using 10% formalin (Fisher Scientific, Pittsburgh, PA) dissolved in PBS for 10 minutes. Triplicate samples were fixed in this manner immediately before stimulation (0 hour) and at 24, 48, and 72 hours. After fixation, all of the samples were stored in sterile PBS at 4°C. At the conclusion of the experiment, the fixed samples were stained with 0.1% crystal violet (Sigma-Aldrich, St. Louis, MO) for 6 hours. The samples were then washed extensively to remove excess dye and dried overnight. The cell-associated dye was then extracted by incubation with 1 mL acetic acid (Fisher Scientific) for 60 seconds. The optical density of each sample was quantified at 590 nm. Determination of cell proliferation by enumeration was carried out as follows: equal numbers of cells (2.5 × 10⁴) were seeded in 12-well culture dishes with media containing 10% FBS and allowed to adhere overnight. Cells were then incubated in serum-free media for 24 hours after washing twice with PBS. Cells were then stimulated with 20 µM LPA dissolved in serum-free media, serum-free media alone (unstimulated control), or media containing 10% FBS as indicated in the appropriate experiment. At the indicated time point, triplicate samples were harvested by incubation with 0.25% trypsin EDTA solution and gentle agitation for 2 minutes. Cell solutions were resuspended with media containing 10% serum and counted with a hemocytometer. Cells were counted in this manner at immediately before stimulation (0 hour) and at 24, 48, and 72 hours.
BrdU incorporation assay
BrdU incorporation was carried out according to previously published procedures 13 with some modifications. Hey and OVCAR-429 cells were grown on 12-mm cover slips in 6-well plates. Following serum starvation for 16 hours, these cells were stimulated with LPA (20 µM), FBS (10%), or none. At 48 hours, the cells were pulsed with 1x solution (1 µM) of 5-bromo-2- deoxyuridine (Calbiochem, EMD Chemicals Inc.) for 24 hours. Cells were fixed by 3% paraformaldehyde, and the DNA was denatured using 2 M HCl. The fixed cells were washed 3 times with PBS and incubated with 1:200 dilution of monoclonal BrdU antibodies (EMD Chemicals Inc.) for 1 hour followed by 1:200 dilution of goat anti-mouse IgGs labeled with Alexa Fluor 488 dye (#A-11001; Invitrogen). Cells were costained with DAPI (0.5 µg/mL; Roche Molecular Biochemicals, Mannheim, Germany) for nuclear staining to monitor the total number of cells. Slides were mounted with ProLong Gold antifade reagent (Invitrogen). BrdU-labeled as well as DAPI-stained total cells were analyzed using a Nikon Eclipse TE2000 inverted epifluorescent microscope (20x magnification) (Tokyo, Japan). Using ImageJ software (National Institutes of Health, Bethesda, MD), the number of BrdU-labeled cells in relation to DAPI-labeled total number of cells was calculated. Results were expressed as a percentage of BrdU-labeled cells (mean ± SEM, n = 3).
Analysis of Gα12 activation with GST-TPR assay
A GST-TPR pull-down assay was used to determine the levels of activated Gα12 using previously published methods.23,24 GST-TPR encoding the pGEX-4T-2 vector was kindly provided by Dr. Negishi (Kyoto University, Kyoto, Japan). Cells stimulated with 20 µM LPA for 1 minute, unstimulated control, or Cos-7 cells expressing constitutively active Gα12QL were rinsed twice with PBS and lysed with 500 µL cell lysis buffer (25 mM HEPES, 0.1% Triton X-100, 300 mM NaCl, 20 mM β-glycerophosphate, 1.5 mM MgCl2, and 0.2 mM EDTA, 10 µg/mL aprotinin, 10 µg/mL leupeptin, 1 mM PMSF, and 1 mM Na3VO4). Cell lysates were then centrifuged for 10 minutes at 15,000g at 4°C, and supernatants were incubated with GST-TPR bound to glutathione sepharose beads for 3 hours at 4°C. After washing the beads with ice-cold lysis buffer, the bound proteins were fractionated by SDS-PAGE and subjected to immunoblot analysis with antibodies to Gα13.
RT-PCR analysis
Total RNA from cells grown to approximately 80% confluence was isolated using Trizol reagent (Invitrogen) according to the manufacturer’s protocol. RT-PCR reaction was carried out with the ThermoScript System (Invitrogen) using a 5-µg aliquot of total RNA for cDNA synthesis. There was 2 µL of cDNA solution that was subjected to PCR amplification using Taq PCR Master Mix Kit (Qiagen). The following primers were used for the PCR reactions for expression of LPARs7,17: LPA1-specific forward (5′-GCTCCACACACGGATGAGCAACC-3′) and reverse (5′-GTGGTCATTGCTGTGAACTCCAGC-3′); LPA2 specific forward (5′-AGCTGCACAGCCGCCTGCCCC GT-3′) and reverse (5′-TGCTGTGCCATGCCAGACCTT GTC-3′); LPA3-specific forward (5′-TTAGCTGCTGCC GATTTCTT-3′) and reverse (5′-ATGATGAGGAAGGCC ATGAG-3′).
The PCR reaction conditions were carried out with 30 cycles at 94°C (3 minutes and 30 seconds), 55°C (2 minutes), and 72°C (11 minutes). The GAPDH (glyceraldehyde-3-phosphate dehydrogenase)–specific forward (5′-GTG AAGGTCGGTTGTGAACGG-3′) and reverse (5′-GATG CAGGGATGATGTTCTG-3′) primers were used as a loading control. GAPDH was amplified with 33 cycles at 94°C (30 seconds), 58°C (1 minute), and 72°C (1 minute). The amplification products were analyzed by 1% agarose gel electrophoresis.
Immunoblot analysis
Immunoblot analyses with specific antibodies were carried out following the previously published procedures. 12 The antibodies that were used for immunoblot analyses were from Ambion (Austin, TX) (GAPDH antibody #4300) and Santa Cruz Biotechnology (Santa Cruz, CA) (Gα12 #sc-409 and HA-epitope #sc-805). Peroxidase-conjugated anti-rabbit IgG (W401B) and anti-mouse IgG (NA93IV) were purchased from Promega (Madison, WI) and GE Healthcare (Buckinghamshire, UK), respectively.
Footnotes
The author(s) declared no potential conflicts of interest with respect to the research, authorship, and/or publication of this article.
This work was supported by the National Institutes of Health [grant numbers CA116984, CA123233]; The American Medical Association Foundation; The Pennsylvania Department of Health; The Benjamin and Mary Siddins Measey Foundation; and The World Class University Project funded by the Ministry of Education, Science and Technology Development, South Korea [grant number R32-2008-000-10098-0].