
Abstract
Background:
Functional arterial hemoglobin oxygen saturation is a critical clinical parameter and the reference for verifying accuracy of SpO2 values during performance testing of a pulse oximeter. Variable performance between blood gas analyzers that perform co-oximetry may complicate interpretation of research studies and regulatory guidance. This study quantifies systematic differences between multiple same model analyzers from two widely used brands of co-oximeters.
Methods:
Three sequential experiments were conducted using controlled hypoxemia in healthy adult volunteers according to regulatory clearance criteria for use of functional arterial oxygenation from co-oximetry analysis (sO2), to simultaneous SpO2 values over the range of 70–100%. To account for potential methodological confounders in experiments 1 and 2, a third experiment analyzed 31 arterial samples across multiple same model analyzers for co-oximetry (two Werfen GEM Premier 5000, and three Radiometer ABL90 Flex) in a randomized order after simultaneous preparation. Statistical analysis included paired differences, mixed-effects modeling, and variance analysis to isolate analyzer-specific effects while controlling for confounding variables.
Results:
The GEM analyzers consistently measured sO2 2.3% higher on average than ABL analyzers (95% CI 2.01–2.63%, P < .001). This difference was more pronounced at lower saturations (3.2% in the sO2 70s range vs 1.4% in the 90s range). Despite strong correlation between measurements (r = 0.999), 96.8% of paired samples differed by >1% and 61.3% by >2%. Within-manufacturer variability was similar between brands (mean absolute difference: ABL 0.38%, GEM 0.47%, P = .55).
Conclusions:
Clinically important systematic differences in sO2 measurement exist between GEM and ABL blood analyzers that perform co-oximetry, with potential implications for patient care and pulse oximeter verification studies. Larger studies with more co-oximeter brands, coupled with blood tonometry, are needed to better characterize these findings. In the meantime, regulatory standards and reports of pulse oximeter clinical trials should account for these findings and specify which manufacturer’s co-oximeters were used.
Keywords
Introduction
Accurate assessment of blood oxygenation status is paramount in clinical decision-making for disease management, in bedside use of pulse oximetry, and in the development and verification of pulse oximeter performance. Co-oximeter (ie, a spectrophotometric analysis of arterial hemoglobin)-derived functional arterial oxygen saturation (sO2) is required for regulatory clearances by the United States Food and Drug Administration (FDA) 510(k) guidance process and by the International Organization for Standardization (ISO) standard for manufacturers of pulse oximeters intended for medical purposes (ISO 80601-2-61).1,2
The reliability of pulse oximetry, particularly its performance across diverse patient populations and skin pigments, is currently a significant area of investigation, underscoring the importance of a dependable reference standard like sO2. 3 However, the accuracy of this standard may be compromised by variations between different commercially available co-oximeters.4–7 Inter-device variability in sO2 poses several potential problems: (1) it can lead to potentially different clinical interpretations and management strategies for patients across settings using different co-oximeters; (2) it can undermine the comparability of pulse oximeter device verification studies or clinical trials across different study sites; (3) it can potentially impact regulatory clearance processes.
Despite the critical reliance on sO2, standardized comparisons of different analyzer platforms using identical samples under rigorously controlled conditions are limited, especially for newer co-oximeters, leaving a gap in understanding the extent and clinical relevance of inter-analyzer differences. This study addresses this gap by conducting a detailed comparison of sO2 measurements obtained from two commonly used blood gas analyzers that perform co-oximetry, the GEM Premier 5000 (Werfen North America, Bedford, MA, USA) and ABL90 Flex (Radiometer America, Brea, CA, USA).
QUICK LOOK
Current knowledge
Functional arterial hemoglobin oxygen saturation (sO2) measured by co-oximetry serves as the reference standard for pulse oximeter accuracy verification in regulatory clearance processes and clinical research. Co-oximeters from different manufacturers are widely used interchangeably in clinical practice and research settings. Previous limited studies have suggested potential variability between co-oximeter brands, but comprehensive comparisons using identical samples under controlled conditions are lacking.
What this paper contributes to our knowledge
This study demonstrated a consistent 2.3% difference between GEM 5000 analyzers and ABL90 Flex analyzers across controlled hypoxemia experiments in healthy volunteers, with the GEM 5000 measuring higher. The systematic difference was more pronounced at lower oxygen saturation levels, with 96.8% of paired measurements differing by more than 1% and 61.3% differing by more than 2%. These systematic differences between co-oximeter manufacturers could impact patient management decisions and affect the interpretation of pulse oximeter performance studies, particularly those investigating accuracy across different patient populations.
Methods
Experimental design
The study was approved by the UCSF Institutional Review Board (IRB), and written informed consent was obtained from all subjects. We conducted three sequential experiments to assess systematic differences in sO2 measurement between two manufacturers (Fig. 1).
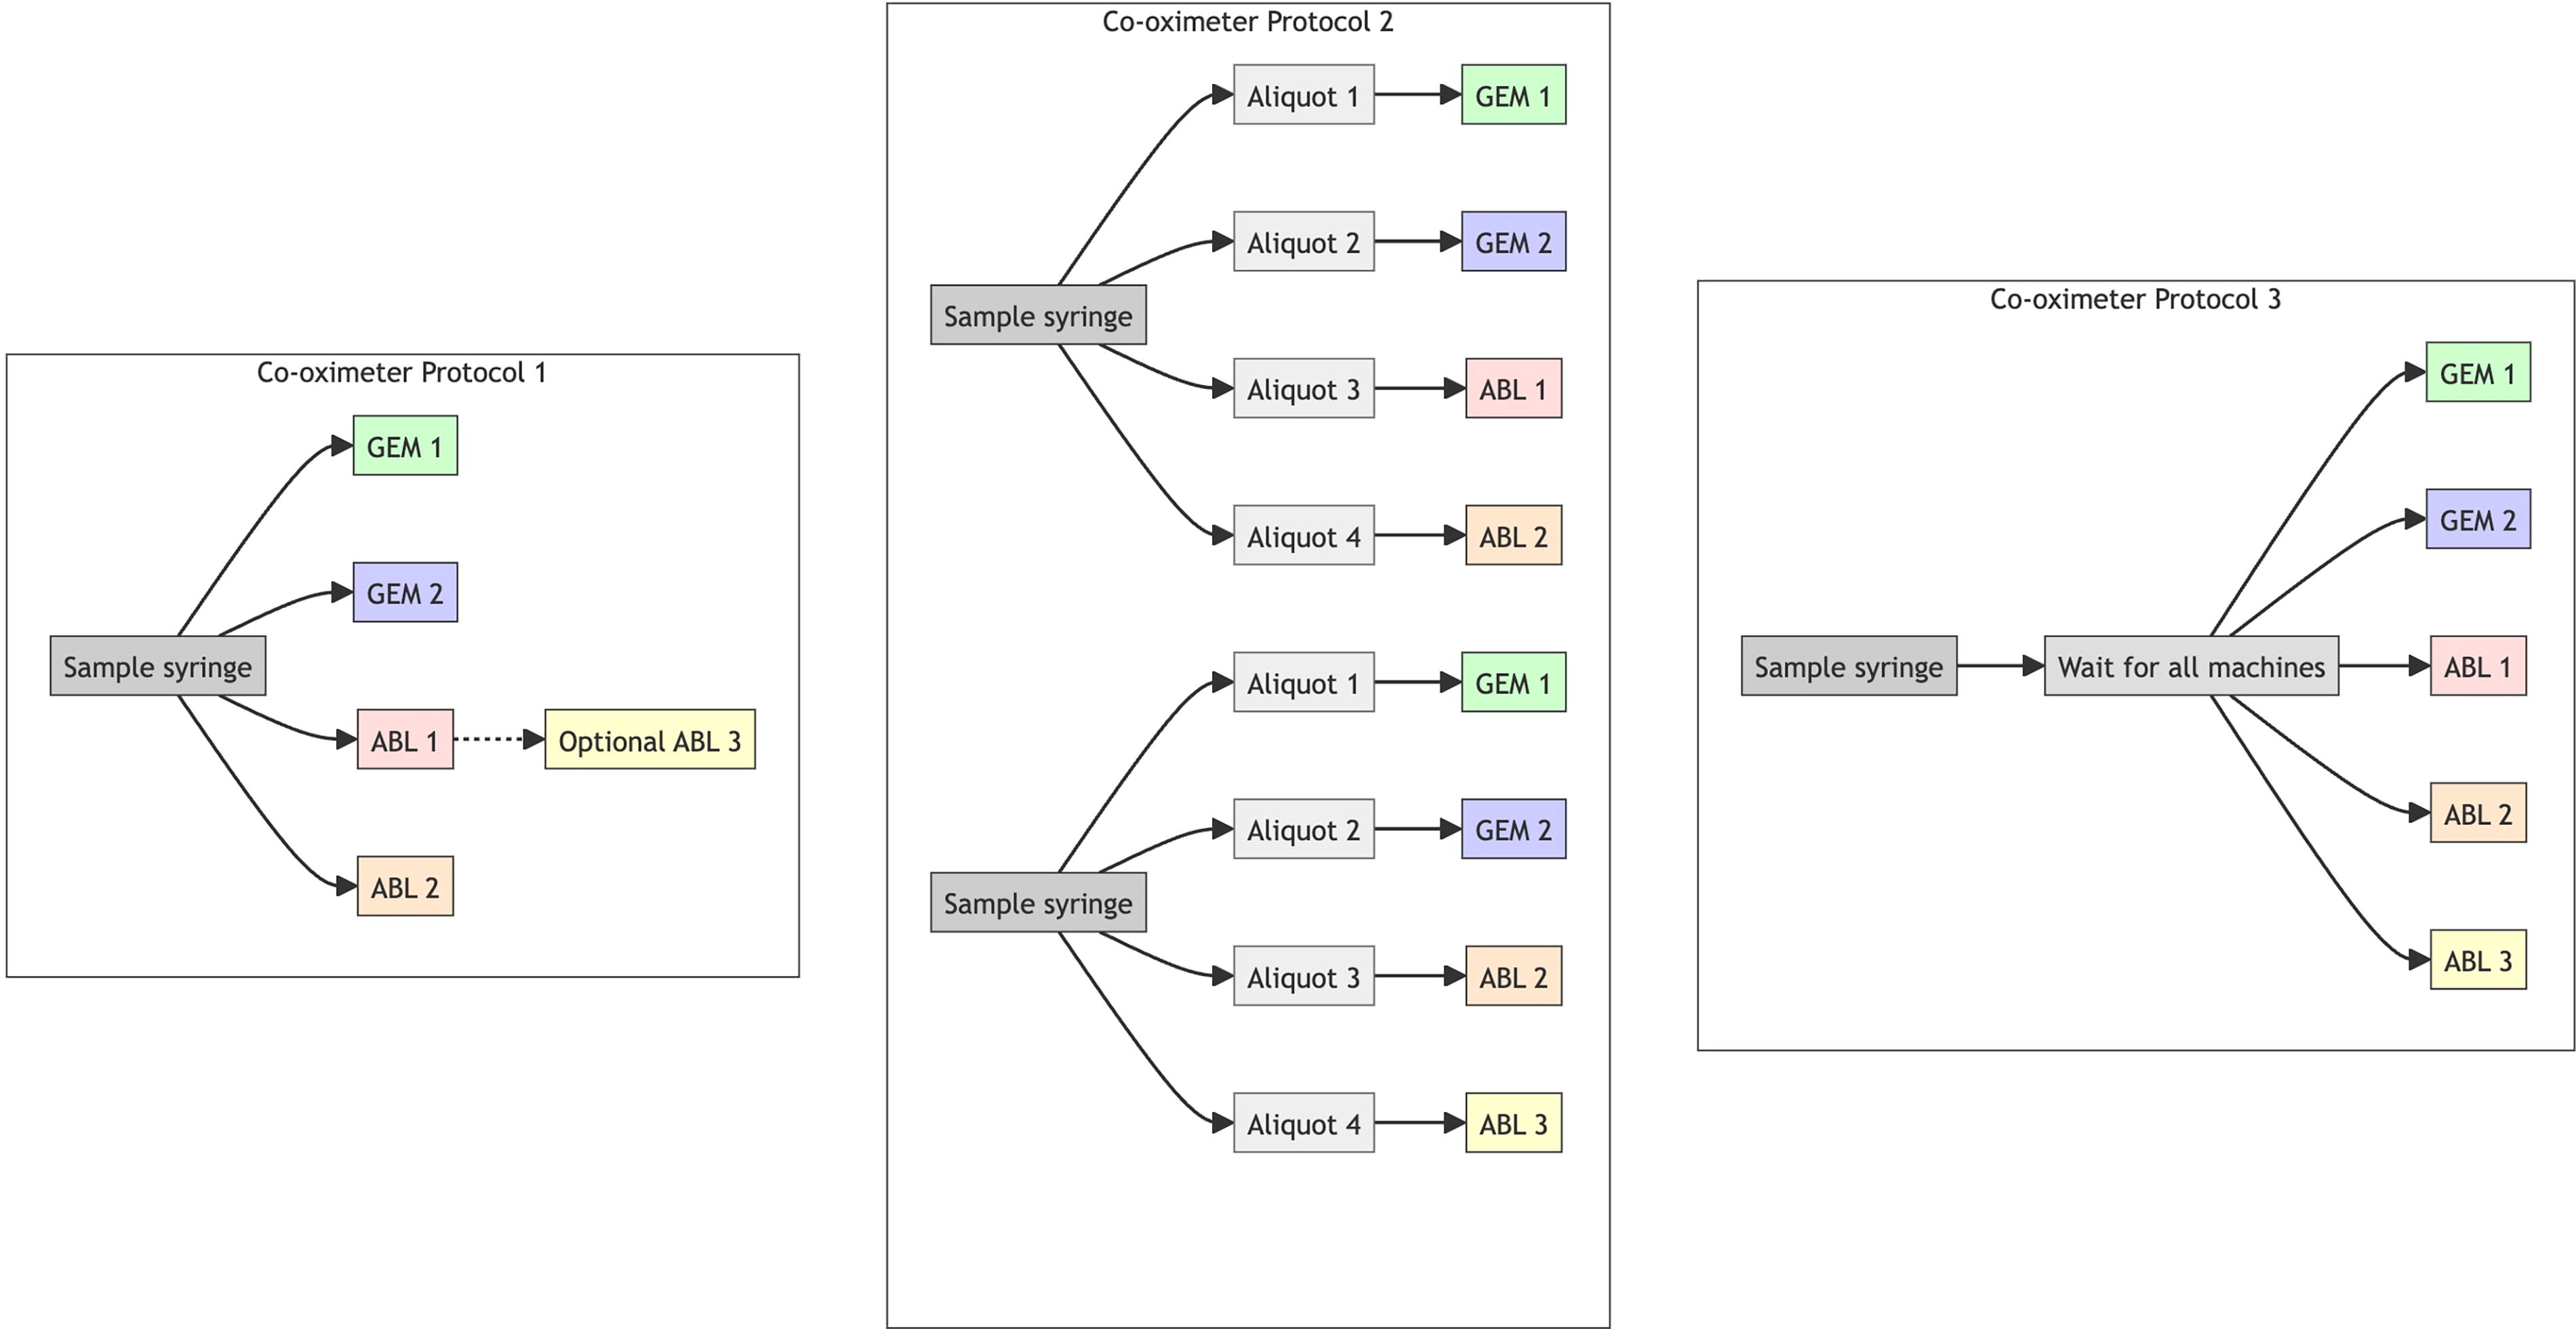
Experimental design. Three protocols for processing blood samples with multiple co-oximeters are illustrated.
Co-oximeters
We used two GEM Premier 5000 [SN22082386 and SN24016212] and three ABL90 Flex Plus [SN092R0477N004, SN092R0392N006, and SN092R0392N007] analyzers. Before data collection, we performed internal calibration, tHb calibration, internal quality control, and external ampule quality control tests on the ABL90s as per the user manual. 8 In addition, the hemolyzer frequency was checked daily and compared with acceptable ranges. The GEM automatically performed calibration after cartridge insertion (GEM 5K GB/Hct/Lytes/CO-Ox 300 test) and only allowed samples to be run once the process was successful. The sensors within the GEM were automatically monitored as per the protocol outlined in the GEM Premier 5000 user manual, utilizing pre-tonometered process control solutions (IL Performance Verification Product, product number 0024001515). 9
Blood sampling
After informed consent, arterial blood samples were obtained from healthy adult volunteers undergoing controlled desaturation studies as previously described. 10 These data were collected as part of the UCSF Hypoxia Lab Study: Accuracy of pulse oximeters with profound hypoxia (UCSF IRB# 21-35637). Briefly, the study investigator controlled the delivered oxygen concentration for each participant by adjusting nitrogen, oxygen, carbon dioxide, and room air flow meters via a custom breathing circuit setup to achieve different steady state levels of hypoxemia from 70– 100% sO2. A stable plateau began once stability was reached (1-min slope of calculated SaO2 change <2%). Discard samples were drawn (3 mL, ie, 3 times the volume of the arterial line circuit at the start of a plateau, or 0.5–1 mL between samples within a plateau). Study samples were then drawn with 3 mL syringes (ICU Medical, San Clemente, CA, USA) that contained lyophilized balanced Li-heparin at a concentration of 23.5 IU/mL. Per our standard operating procedure, air bubbles were expelled through the syringe’s vented tip cap, and syringes were gently mixed by inverting and rolling prior to sampling unless otherwise stated below.
Co-oximeter protocol 1
Twenty-one participants underwent controlled staged hypoxemia. Multiple arterial samples were drawn at least 20 seconds apart, at three stable plateaus (SpO2 in 90s, 80s, and 70s) (typically 4 samples over about 2 min). All samples were first processed on two ABL analyzers (in 15 cases there was a >0.5% difference in sO2 between the first two machines, and the sample was run on a third ABL machine per routine lab protocol). When machines were available, after ABL analyses were completed, blood samples were then run on two GEM analyzers. Analyzer internal clocks were not synchronized over the days of the experiment and could not be corrected in analysis, and so timing variables were not included in the analysis.
Co-oximeter protocol 2
We designed a second experiment to quantify the potential impact of sample time-order on sO2 values in protocol 1. A single study participant underwent controlled staged hypoxemia, and 30 arterial blood samples were drawn over the sO2 range 70–100%, and each sample syringe was immediately split into four aliquots, each processed on different analyzers (two GEM and two ABL) as soon as each analyzer was available. To ensure coverage across all three ABL machines, we shifted the analyzer pair for each sample (eg, machines 1 and 2, then machines 2 and 3, then machines 3 and 1). Analyzer processing times and delays between draw and analysis were recorded for each sample. In interim analysis, we found that the within-manufacturer variability was higher than expected based on prior experience in our laboratory with the ABL analyzer (typically <0.5%), suggesting that the oxygen content of the syringes could have been impacted by the aliquoting process.
Co-oximeter protocol 3
To address potential impact of the fractionation procedure on sO2 in protocol 2, we refined our approach. A single study participant underwent controlled staged hypoxemia. Each sample was maintained in a single syringe until all five analyzers (two GEM and three ABL) were simultaneously ready for analysis. When all analyzers were ready, the sample syringe was vortexed for 3 s, then analyzed by all five analyzers in a predetermined random order. Processing times were recorded as in protocol 2. This design minimized both the delay between analyses and potential bias from the analyzer selection order.
Statistical analysis
Descriptive statistics for experiments 1, 2, and 3
Descriptive statistics were calculated for each experiment, including mean bias and pairwise differences within analyzer manufacturers. We calculated the proportion of paired measurements falling within predefined clinical agreement thresholds (±0.5%, ±1%, ±2%). Pairwise comparisons were made by taking the difference between each possible pair of analyzers per manufacturer (eg, GEM1 vs GEM2, ABL1 vs ABL2, ABL1 vs ABL3).
Primary analysis: Paired differences
For each sample in experiment 3, we calculated the mean sO2 value for each analyzer manufacturer (averaging the two ABL measurements and the two GEM measurements) to create a single paired comparison per sample. The difference was calculated as sO2_GEM-sO2_ABL. We used a paired t test to assess whether the mean difference was significantly different from zero. We report the mean difference, 95% CI, P value, and percentage of samples exceeding clinically meaningful thresholds (±1%, ±2%). We also report Bland–Altman plots across all experiments demonstrating the upper and lower limits of agreement.
Within-manufacturer variability in experiment 3 was analyzed by calculating empirical measurement differences between analyzers of the same manufacturer analyzing identical blood samples. We generated statistical summaries of these differences, including mean absolute differences, and determined the percentage of paired measurements exceeding clinically relevant thresholds (0.5%, 1%).
Secondary analysis: Mixed-effects model
A linear mixed-effects model was used to account for all individual measurements in experiment 3 and incorporate potential confounding factors. The model specified sO2 as the response variable, treated sample_id as a random effect (accounting for correlation within samples), and included fixed effects for analyzer manufacturer, time to analysis, and sO2 decile. A supplementary model including experiment as a random effect was also performed.
Results
Descriptive statistics for experiments 1, 2, and 3
The three experiments analyzed 288, 30, and 31 blood samples, resulting in 1,165, 120, and 155 total co-oximeter measurements respectively (Table 1). A consistent mean difference between manufacturers was observed across all experiments; GEM analyzers ranged from 2.1% (SD 1.2) to 2.3% (SD 0.8) higher than ABL analyzers. The mean within-manufacturer pairwise differences were also similar between experiments 1 and 3.
Descriptive statistics for experiments 1–3
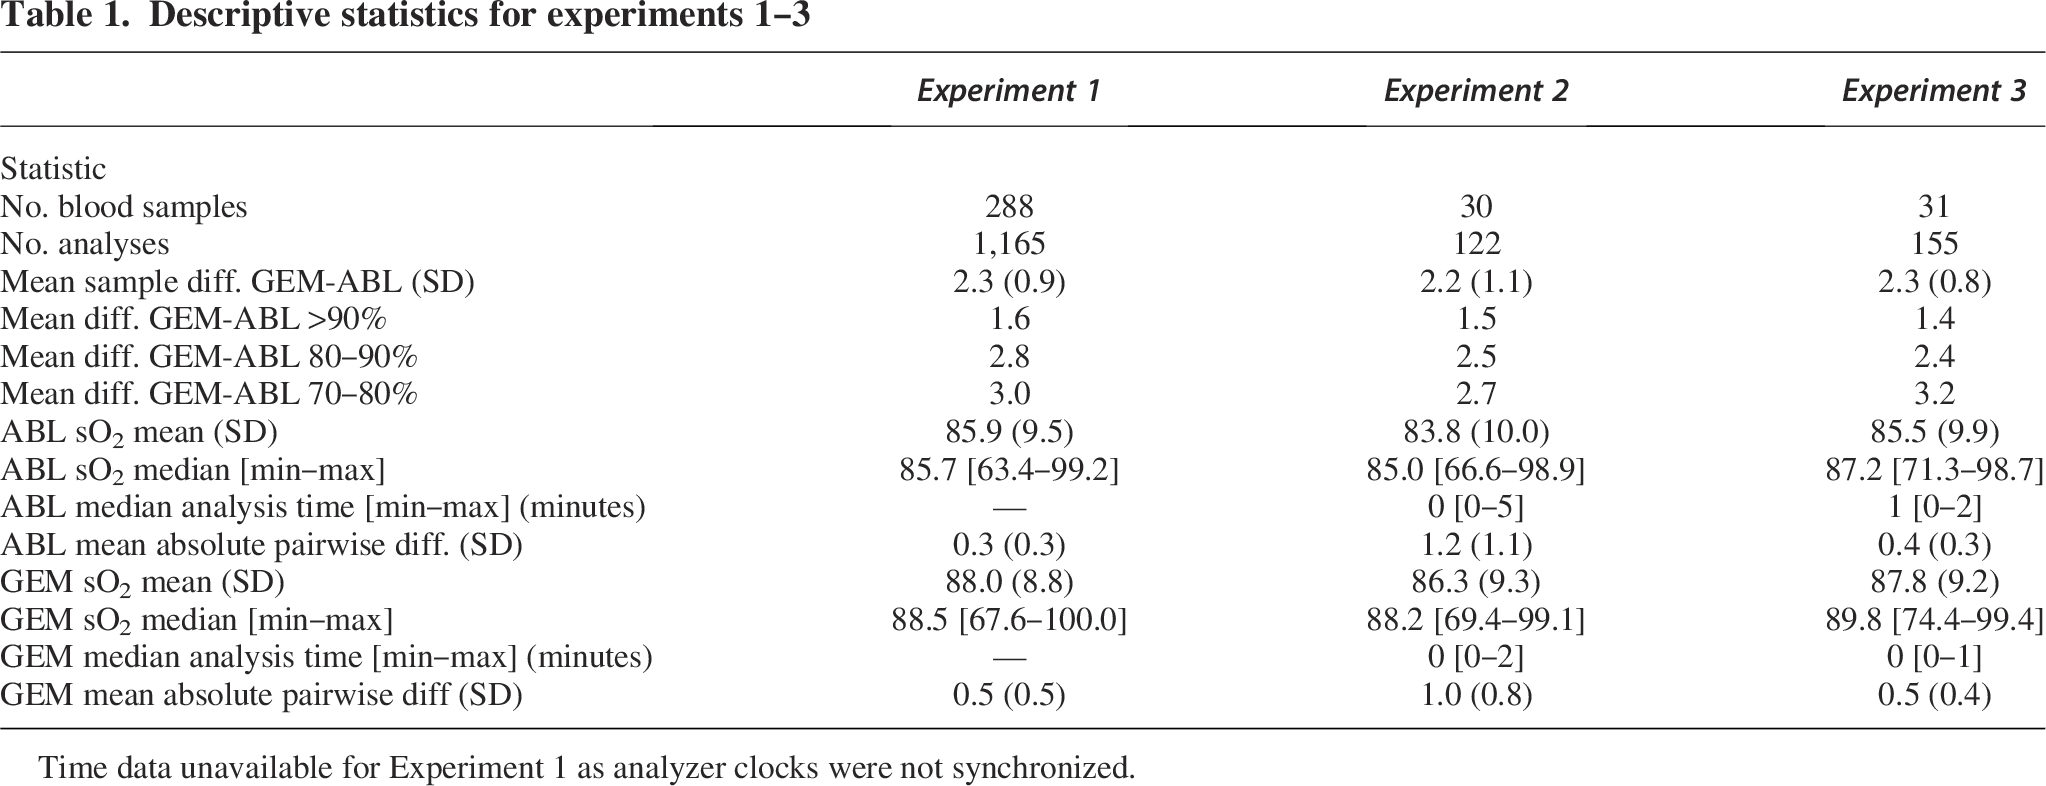
Time data unavailable for Experiment 1 as analyzer clocks were not synchronized.
The median time from first to last analysis was 1.0 min for ABL machines (range 0–2 min) and 0.4 min for GEM machines (range 0–1.2 min). The median time from collection to analysis in experiment 3 was 21.3 min (range 0.6–64 min) for ABL machines and 22.5 min (range 1.3–65 min) for GEM machines. Overall, regardless of machine type, the median time span from first to last analysis per sample was 1.5 min.
The difference in reported sO2 between analyzer manufacturers varied across oxygen saturation levels (Fig. 2, Supplementary Table S1). In the lower saturation range (70s), the difference was 3.2%, while in the higher range (90s), the difference decreased to 1.4%.
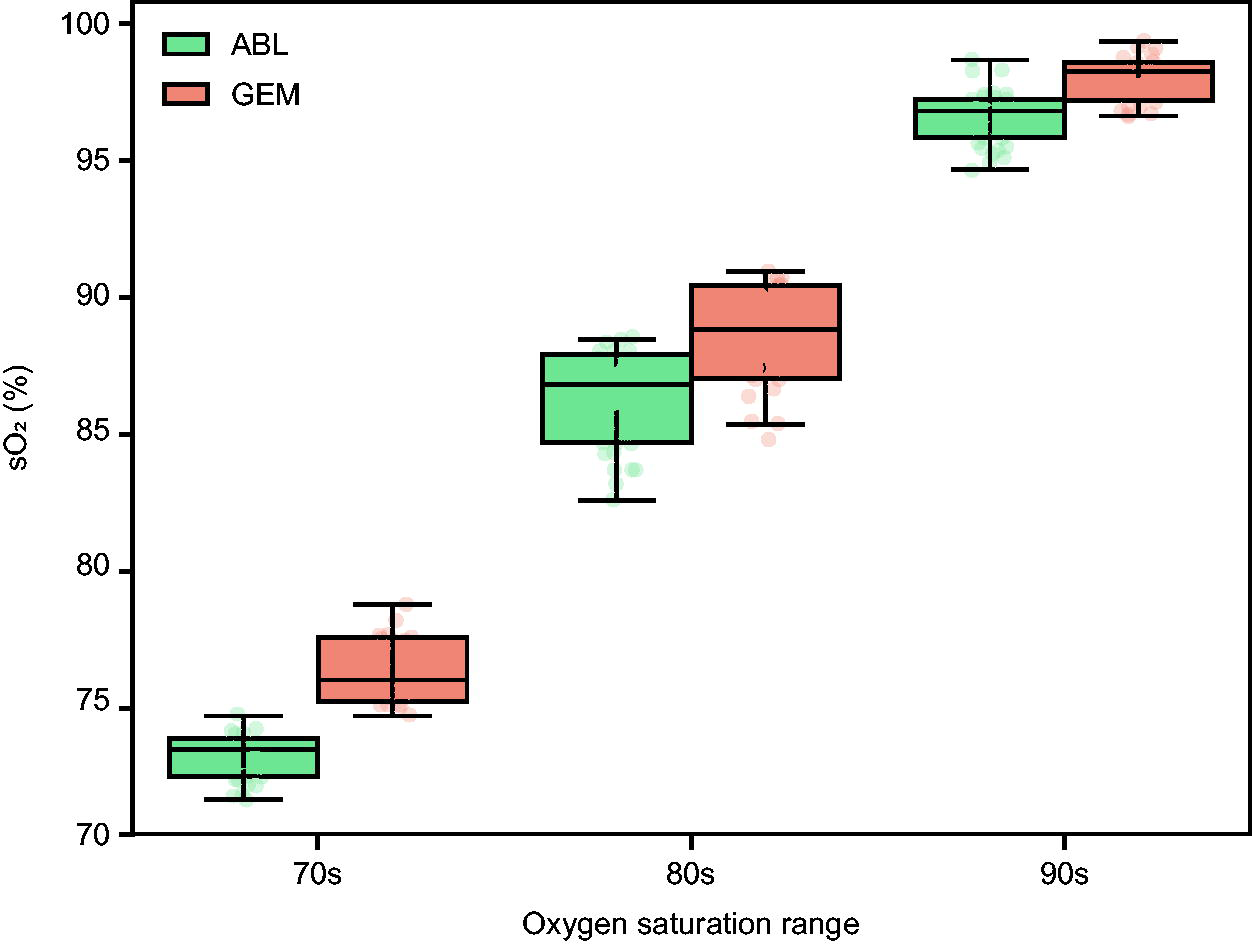
sO2 Measurements by analyzer manufacturer and saturation range (Experiment 3). Boxplots display sO2 values measured by two blood gas analyzers across three pulse oximeter saturation (SpO2) ranges: 70s, 80s, and 90s. Each box represents the interquartile range (IQR), with the median marked as a horizontal line. Whiskers extend to 1.5 × IQR, and individual data points are overlaid. GEM measurements tend to show systematically higher sO2 values than ABL in the 70s and 80s saturation ranges, with values converging in the 90s.
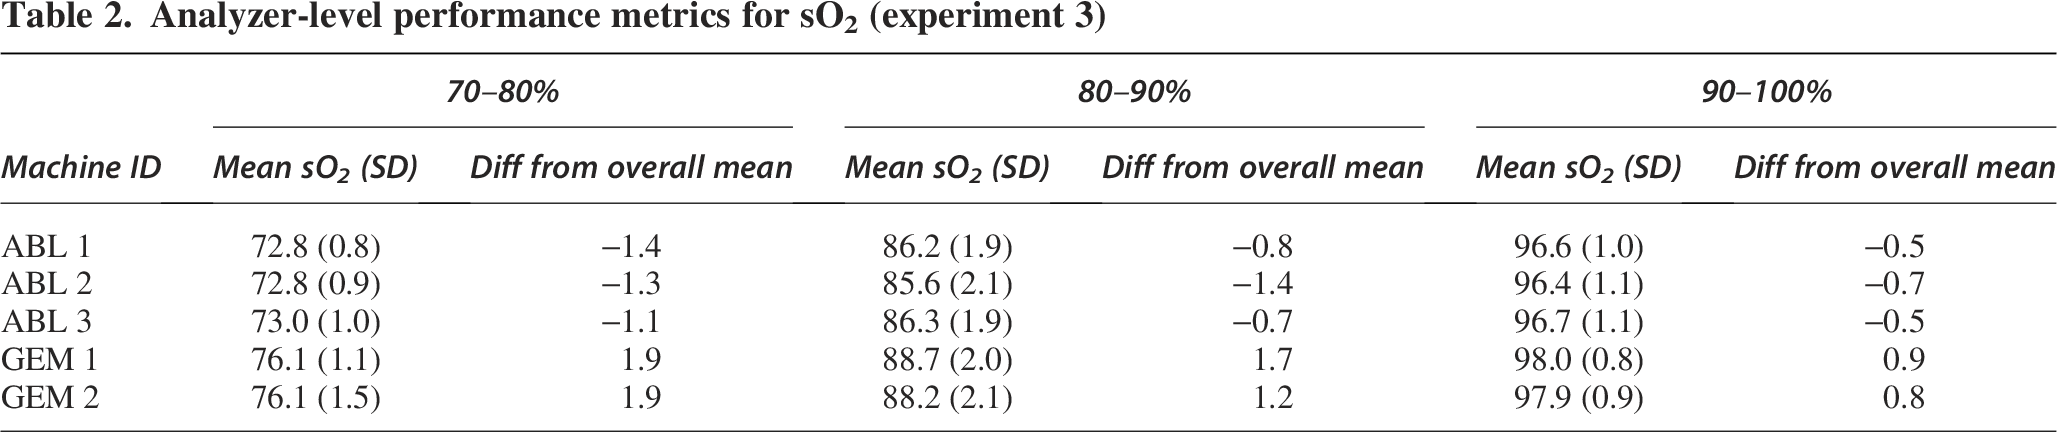
We observed variation in differences between individual analyzers (Table 2, Supplementary Figure S1). The analyzers with the largest deviation from the overall mean were GEM1/2, with a difference of 1.9% in the 70– 80% saturation range. This highlights that variation may exist not only between analyzer manufacturers but also between individual analyzers from the same manufacturer.
Analyzer-level performance metrics for sO2 (experiment 3)
Paired differences analysis
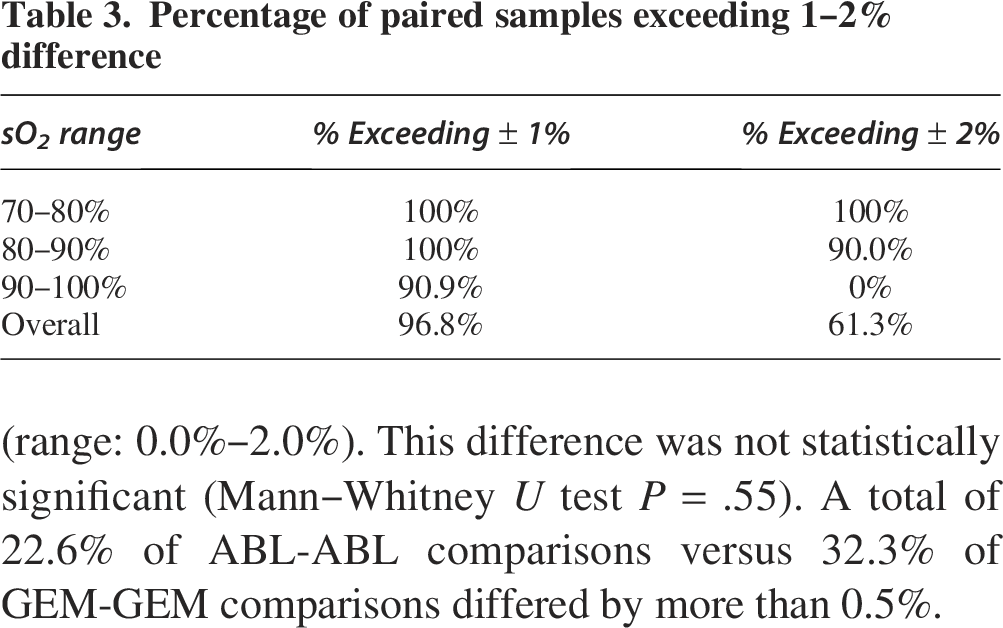
Paired t test analysis demonstrated that the 2.3% difference in experiment 3 was statistically significant (95% CI: 2.0% to 2.6%, P < .01). A total of 90.9% of paired measurements differed by more than 1% in the 90–100% range, while none differed by more than 2%. In contrast, 100% of samples differed by 1% in the 70–80% range (Table 3). Despite the systematic difference, GEM and ABL measurements showed a strong correlation (r = 0.99) (Fig. 3), suggesting that while the absolute values differ, the relative changes in sO2 are similarly captured by both analyzer manufacturers.
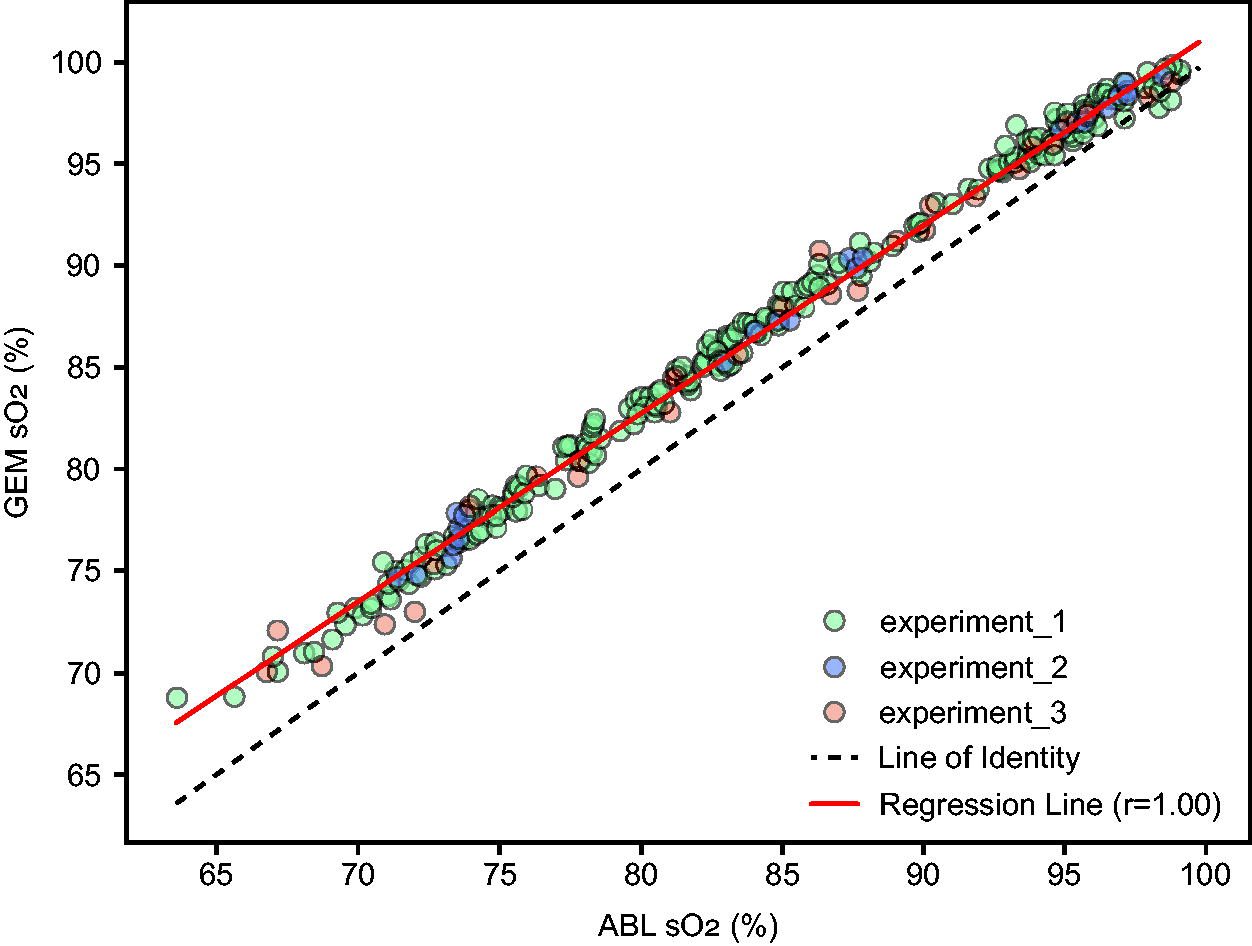
Correlation of sO2 Measurements: GEM versus ABL (all experiments). Each point represents a paired sO2 (%) measurement from the GEM and ABL analyzers, color-coded by experiment). The X axis shows ABL sO2 (%) and the Y axis shows GEM sO2 (%). The black dashed line represents the line of identity. The red solid line indicates the linear regression fit across all data points, with the reported Pearson correlation coefficient.
Percentage of paired samples exceeding 1–2% difference
The Bland–Altman plot (Fig. 4) across all experiments provides a visualization of agreement between the two measurement methods. This plot helps identify any systematic difference (mean difference not equal to zero) and whether the variability of differences is consistent across the measurement range. The Bland–Altman analysis confirms the systematic difference and establishes 95% limits of agreement ranging from 0.5% to 4.2%. This means that for 95% of measurements, we expect GEM readings to fall within this range relative to ABL readings.
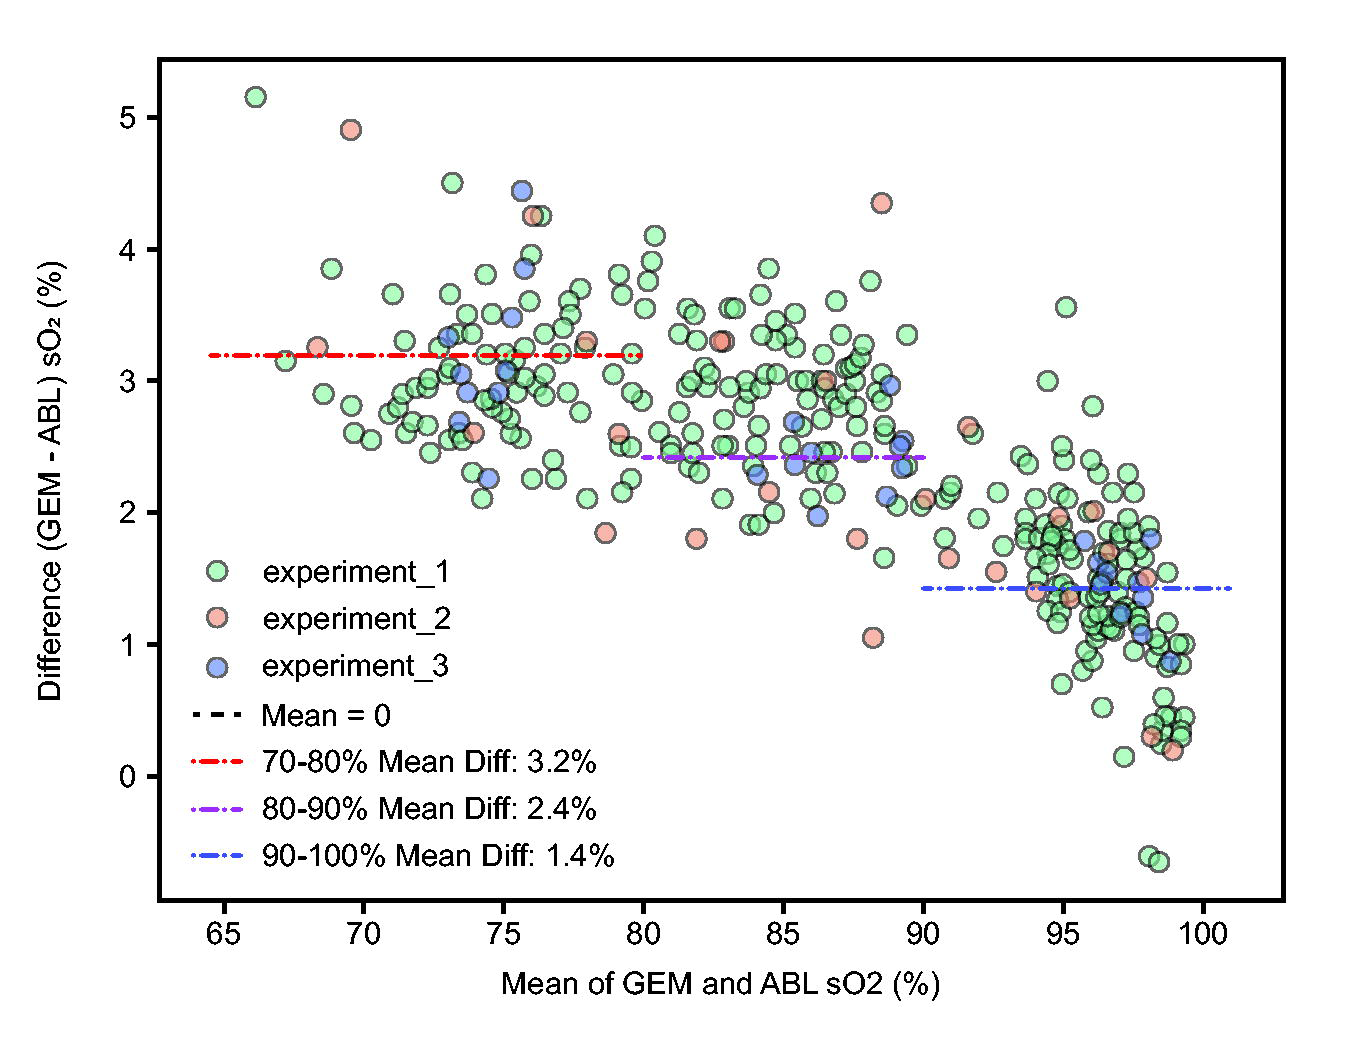
Bland–Altman plot of sO2 measurements. Each point represents the difference in sO2 (%) between GEM and ABL analyzers plotted against the mean of the two measurements. Points are colored by experiment. The black horizontal line indicates zero difference. The red dashed line shows the mean difference. Red dotted lines represent the upper and lower limits of agreement (LoA).
When the same sample was analyzed on different ABL analyzers, the mean absolute difference was 0.38% (range: 0.0%–1.6%) (Fig. 5), while the mean absolute difference between different GEM units was 0.47% (range: 0.0%–2.0%). This difference was not statistically significant (Mann–Whitney U test P = .55). A total of 22.6% of ABL-ABL comparisons versus 32.3% of GEM-GEM comparisons differed by more than 0.5%.
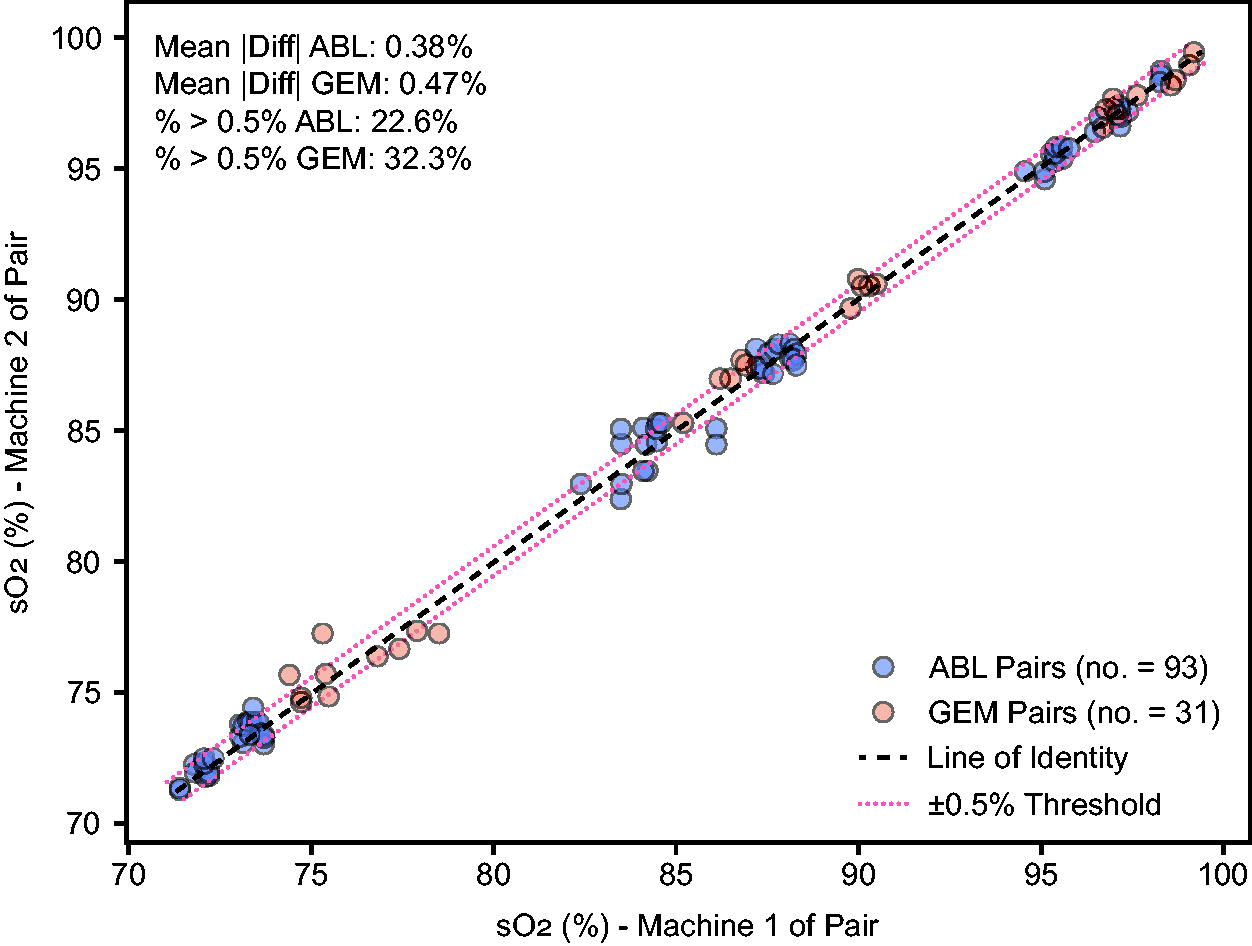
Distribution of sO2 measurement differences within analyzer manufacturers (Experiment 3). Each point represents a matched blood sample measured by two machines of the same type: ABL or GEM. The X axis shows the sO2 value from one machine in the pair, and the Y axis shows the corresponding sO2 from the second machine. The black dashed line indicates perfect agreement (line of identity), while the red dotted lines mark a ±0.5% difference threshold.
Mixed-effects model analysis
The mixed-effects model for experiment 3 confirms that the analyzer manufacturer significantly influences sO2 readings even after accounting for saturation decile and time to analysis. Specifically, GEM read 2.3% higher than ABL (P < .01). In addition, we found that time delay to analysis had a small effect of −0.04% per minute (P = .009) (Supplementary Tables S1 and S2).
Discussion
Our comparison of sO2 measurements between two common co-oximeters demonstrates a significant difference of 2.3%, a difference that remained consistent across multiple experimental approaches. Differences varied with saturation levels, with a larger difference in the lower range (sO2 70s) compared with the higher range (sO2 90s). The majority of paired measurements exceeded ±2% difference below 90%, indicating that the systematic difference between analyzer manufacturers could potentially impact clinical decision-making, especially near critical thresholds. The mixed-effects model also identified a small effect of time delay on sO2 readings.
These findings are generally consistent with prior, more limited, studies that have demonstrated variable performance across co-oximeter manufacturers.4,5 In 2007, Gehring et al found differences in sO2 values amongst sets of identical devices amongst five different manufacturers’ devices, as well as an increase in these differences as saturation levels decreased. Gehring found up to a 2.6% difference for sO2 readings at the 97% level, and up to a ±4% difference at the 75% level, although the mean differences appeared much smaller. In 2012, another report continued to find systematic differences in hemoximeter measurements of sO2. 6 Gehring determined that one can “assume that a measurement error also exists even for the gold standard of hemoximetry, and this will influence pulse oximeter calibration.” 5 Our findings support this assessment. In addition, our findings are in good agreement with previous studies that report a 2.2% difference in sO2 between the GEM Premier 5000 and Radiometer ABL 800 Flex. 4
There are several important implications that arise from our findings. First, for analyzer manufacturers and regulatory bodies, these results highlight critical issues with current calibration and verification practices. Co-oximeter manufacturers commonly calibrate analyzers against predicate reference instruments, meaning the selection of the reference analyzer could introduce systematic bias.8,9 The outcome of regulatory submissions for pulse oximetry instruments may change depending on the reference co-oximeter used, especially if testing facilities use different instruments or if the same analyzers are not used consistently. Blood tonometry has historically been the reference standard, as outlined in Burnett et al’s recommendations to the International Federation of Clinical Chemistry (IFCC).2,11,12 Tonometry reliably creates fully oxygenated or deoxygenated samples, and has been used to produce samples with intermediate oxygen saturations. 13 However, tonometry is difficult, time-consuming, and not practical for routine use. Radiometer states in their reference manual that tonometry was the primary reference method for co-oximeter sO2 readings, 8 and GEM utilizes pre-tonometered solutions for pO2 and pCO2 device verification. 9 To our best knowledge, there is currently no certified reference material available for hemoglobin fractions as measured by co-oximetry, hindering harmonization of sO2 values between manufacturers. Therefore, given the current state of potential for differences in sO2 values between co-oximeter manufacturers, regulatory submissions for new pulse oximeters should require disclosure of which co-oximeter manufacturer and model were used as the sO2 reference.
Second, a 2% difference can significantly impact clinical care, especially when decisions are threshold-based, such as prescribing or titrating supplemental oxygen, managing mechanical ventilation, or prescribing medications, among other decisions.14–17
Finally, these findings have important implications for pulse oximetry research, particularly studies investigating the potential impact of factors like skin color on pulse oximeter performance. Most research concerning skin color effects on pulse oximetry has identified small differential effects with dark skin, typically in the range of 1–2% bias. A systematic review of 32 studies by Shi et al found that “pulse oximetry overestimates oxygen saturation in people with a high level of skin pigmentation” with a pooled mean bias of 1.11%, and a CI of 0.29% to 1.93%. 3 This wide interval may be confounded by the use of different analyzers within the studies reviewed. It is conceivable that depending on the analyzer used, not only could the magnitude of bias be impacted but also its direction—positive or negative. Specifically, the use of the GEM may minimize the apparent impact of dark skin color on bias and reduce the observed rate of occult hypoxemia. Previous evidence may need reevaluation considering which analyzers were used as reference analyzers, as the choice of reference analyzer could either mask or amplify true differences attributable to patient factors. Our findings regarding co-oximeter measurement differences do not invalidate previous studies demonstrating clinically important systematic differences between oximeters themselves in patient populations.18,19
This study has several important limitations. Our experimental design evolved across three sequential protocols to address methodological challenges identified during data collection: ABL machines always run before GEM in Experiment 1, and alterations in oxygenation from the aliquoting process in Experiment 2. While all protocols yielded consistent findings regarding inter-manufacturer differences, this adaptive approach limits direct comparability across experiments. In addition, the time from collection to analysis in Experiment 3 was longer than typical; this was due to the requirement that all machines be ready to analyze before starting any analysis. Because of automated intermittent self-QC cycles, all sampling waited until all machines were ready. However, evidence suggests that co-oximetry results may remain stable up to 1–3 hours. 20 Moreover, this would not affect cross-device results, and in fact, once analyses were begun, the time from first to last sample was short. Finally, while this study demonstrates differences between these two analyzers, the results cannot necessarily be generalized to other models by the same manufacturers nor across manufacturers. These results do not establish which analyzer provides more accurate measurements, only that there was a difference. Caution should be used in trying to account for this difference across Werfen and Radiometer devices in the clinical setting.
Conclusions
In this study of two co-oximeter models from different manufacturers, we demonstrate a significant difference in sO2 results. Such differences (ie, choice of blood analyzer that performs co-oximetry) could impact clinical care, as well as conclusions from pulse oximeter performance studies in the literature. We have two major recommendations: 1) Disclosure of the co-oximeter manufacturer and model used as a reference for pulse-oximeter studies should be required for regulatory submission as well as for reports in the medical literature. 2) Manufacturers of co-oximeters should make efforts to harmonize their sO2 results so sO2 values between manufacturers are interchangeable.21,22
Footnotes
Author Disclosure Statement
X.M.R.v.W. received honoraria from Becton, Dickinson and Company (BD) and Abbott Diagnostics, and is a former employee of Beckman Coulter (part of Danaher, owner of Radiometer).
Funding Information
The study was performed at the University of California, San Francisco. There was no specific funding for this study; costs were covered by the Hypoxia Research Laboratory at UCSF.
Supplemental Material
References
Supplementary Material
Please find the following supplemental material available below.
For Open Access articles published under a Creative Commons License, all supplemental material carries the same license as the article it is associated with.
For non-Open Access articles published, all supplemental material carries a non-exclusive license, and permission requests for re-use of supplemental material or any part of supplemental material shall be sent directly to the copyright owner as specified in the copyright notice associated with the article.