
Abstract
Background:
The interaction between nebulizer technology and mechanical ventilation can be confusing. Mesh technology has recently been quantified using the mass balance, a technique that measures all aerosol delivered and lost in ventilator circuits. Data for jet nebulizers are limited, and ventilator technology has changed over time. The present study was designed to better define aerosol behavior during jet nebulization by testing device position, gas source, humidification, inspiratory time (TI), and circuit compliance.
Methods:
Using radiolabeled particles, mass balance and output rate were measured for the AeroTech nebulizer placed close to the ventilator (IP), Y-piece (YP), and proximal to ETT (DY) in aerosol HME or humidified settings. The nebulizer was driven continuously (8 L/m, 50 PSIG) or by breath actuation (BA) during volume control ventilation at two inspiratory times (TI 0.7 and 0.55 s). Five ventilators and two circuits with different tubing compliance were tested. Radiolabeled saline (3 mL, Tc99m) was nebulized. A well counter measured filters inhaled and expiratory mass (IM, EM), and nebulizer residual (NR). Tubing deposition was measured with a gamma camera. A shielded ratemeter measured output rate and treatment time.
Results:
Mass balance ranged from 96 to 104% (no. = 66). IM obtained with IP, HME circuit, continuous nebulization (29.8 ± 5%), IP, and BA (26.8 ± 4%); with humidification, continuous (15 ± 1%), BA (27.1 ± 4). Lowest IM at YP position, HME (8.8 ± .6%). Circuit losses ≤20%. EM was lowest for IP (19.2 ± 2%) and highest for YP and DY (46 ± 3%). NR was higher with BA (43.1 ± 6 vs 37.1 ± 3, P = .002). Higher tubing compliance lowered IM (21.8 ± .7% vs 28.3 ± 3% [no. = 9], P = .01). Treatment time for IP, continuous, HME circuit (10 min), and BA circuit (50 min). Changing TI (0.55 s) reduced IM and further increased treatment time.
Conclusions:
Optimal conditions for jet nebulization were IP position, HME circuit, continuous nebulization, and stiff tubing. Humidification should be supplied with an aerosol HME. If active humidification, IP breath-actuated was most efficient but with marked increase in treatment time.
Introduction
In intubated patients, aerosols are used for a variety of reasons, but reports describing factors that affect aerosol delivery are often ambiguous.1–9 For example, a series of reviews supported placing the nebulizer 15–18 inches from the Y connector.5,6 However, Ari et al recommended placement close to the ventilator. 1 Previous studies have favored breath actuation (BA) and bypassing the humidifier to optimize delivery but more recent articles have questioned the value of breath actuation and minimized the influence of humidification.7–9 In a peer-reviewed, consensus study, citing “low-level evidence,” continuous jet nebulization was associated with changes in ventilator parameters because of added flow and low aerosol delivery, citing it as not a preferred approach for aerosol delivery. 3 However, in another study, the effects of nebulizer flow on ventilator settings were of minimal significance. 10
Findings from previous studies may not apply to present practices that currently utilize low tidal volume ventilation, heated wire humidification, and limitations to using nebulizers on the wet side of the circuit, with resultant condensation effects. 11 Study conditions vary, limiting consensus on the factors that affect aerosolization.1,3,7,12 Conclusions defining the fate of aerosol losses are often limited mechanistically because the deposition of all generated aerosol in ventilator circuits is not measured (eg, by total mass balance). 6 Studies usually focus on deposition on the inspiratory filter, leaving circuit distribution and losses to speculation. 1
These limitations apply to vibrating mesh technology (VMN) as well.13,14 Ari et al compared jet, VMN, and pressurized metered-dose inhaler in humidified and nonhumidified settings during mechanical ventilation and concluded that the VMN was more efficient than the jet and found 15 cm proximal to Y connector to be ideal for VM nebulization. 1 In another study, she reported VMN mounted directly on the humidifier delivered more drug. 2 Li et al and Dugernier et al found the highest inhaled mass (IM) when the VMN was placed close to the ventilator.14,15
Recently, Montigaud et al measured the mass balance of aerosols generated by VMN. 16 Their technique used scintigraphy, scanning the ventilator circuit following aerosolization under different conditions. They tested methods of humidification, specifically, active humidification versus dry conditions (no humidification) and at four different nebulizer positions—close to ventilator, close to humidifier, 15 cm from Y-piece, and immediately after the Y-piece. Furthermore, they measured the total and regional delivery of particles to a porcine lung. 16 They reported major changes in deposition influenced by these variables that may be important in designing clinical aerosol studies using VMN technology.
Jet nebulization represents an alternative technology for drug delivery that is cost-effective, reliable, and reproducible compared with mesh devices.17,18 Triggered by flow and pressure, these devices may interact differently with the ventilator circuit such that the findings of Montigaud et al may not apply. To further define the effects of modern ventilators on aerosol delivery during jet nebulization, we performed the mass balance that, like Montigaud et al, tested the effects of variables under the control of medical personnel. Our intention is to use jet nebulization in ongoing studies of antibiotic delivery. The goal was to provide a guide toward optimizing clinical delivery using this technology. The fate of all generated aerosol was measured as a function of circuit position, humidity, breath actuation or continuous nebulization, and circuit compliance.
QUICK LOOK
Current knowledge
Predicting aerosol delivery from a jet nebulizer is confounded by confusing data in the literature. Consensus reviews often state jet nebulizers perform poorly when compared with vibrating mesh nebulizers, and humidification affects aerosol delivery.
What this paper contributes to our knowledge
Circuit placement was the key factor defining jet nebulizer aerosol delivery. The optimal position for continuous jet nebulization was IP (close to the ventilator), using an aerosol HME for humidification in open position, with a low compliance circuit. Nebulizer residual was reduced using continuous nebulization, improving delivery to a simulated patient with a reduction in treatment time. Choice of ventilator tubing can be important because increased circuit compliance can reduce aerosol delivery.
Methods
Figure 1 shows the ventilator circuit with the nebulizer connected in three different positions, along with the humidifier (MR-850: Fisher & Paykel Healthcare, Auckland, New Zealand). The positions were defined as close to ventilator (IP), close to the Y-piece at the end of the inspiratory heated wire tubing (YP), and between an aerosol HME and the endotracheal tube (DY). HEPA filters (Intersurgical, Syracuse, New York) were placed at the distal end of a 7.5 mm endotracheal tube (IM filter) and the distal end of the expiratory limb of the ventilator circuit (expiratory mass [EM] filter). The IM filter at the end of the ET tube was in turn connected to the Michigan lung (dual adult lung simulators [Michigan Instruments, Grand Rapids, MI]), compliance was set at 0.02 L/cm H2O. Of note, for HME studies, the humidifier and connecting tubing were removed from the inspiratory line. For these experiments, the aerosol HME was included in the circuit, placed distal to the Y connector in the open position during aerosolization for (IP/YP) experiments and closed when the nebulizer was in the (DY) position. Dynamic changes in aerosol delivery were measured during nebulization with a ratemeter (Model 2200 Scalar Ratemeter: Ludlum Measurements, Sweetwater, Texas).19,20
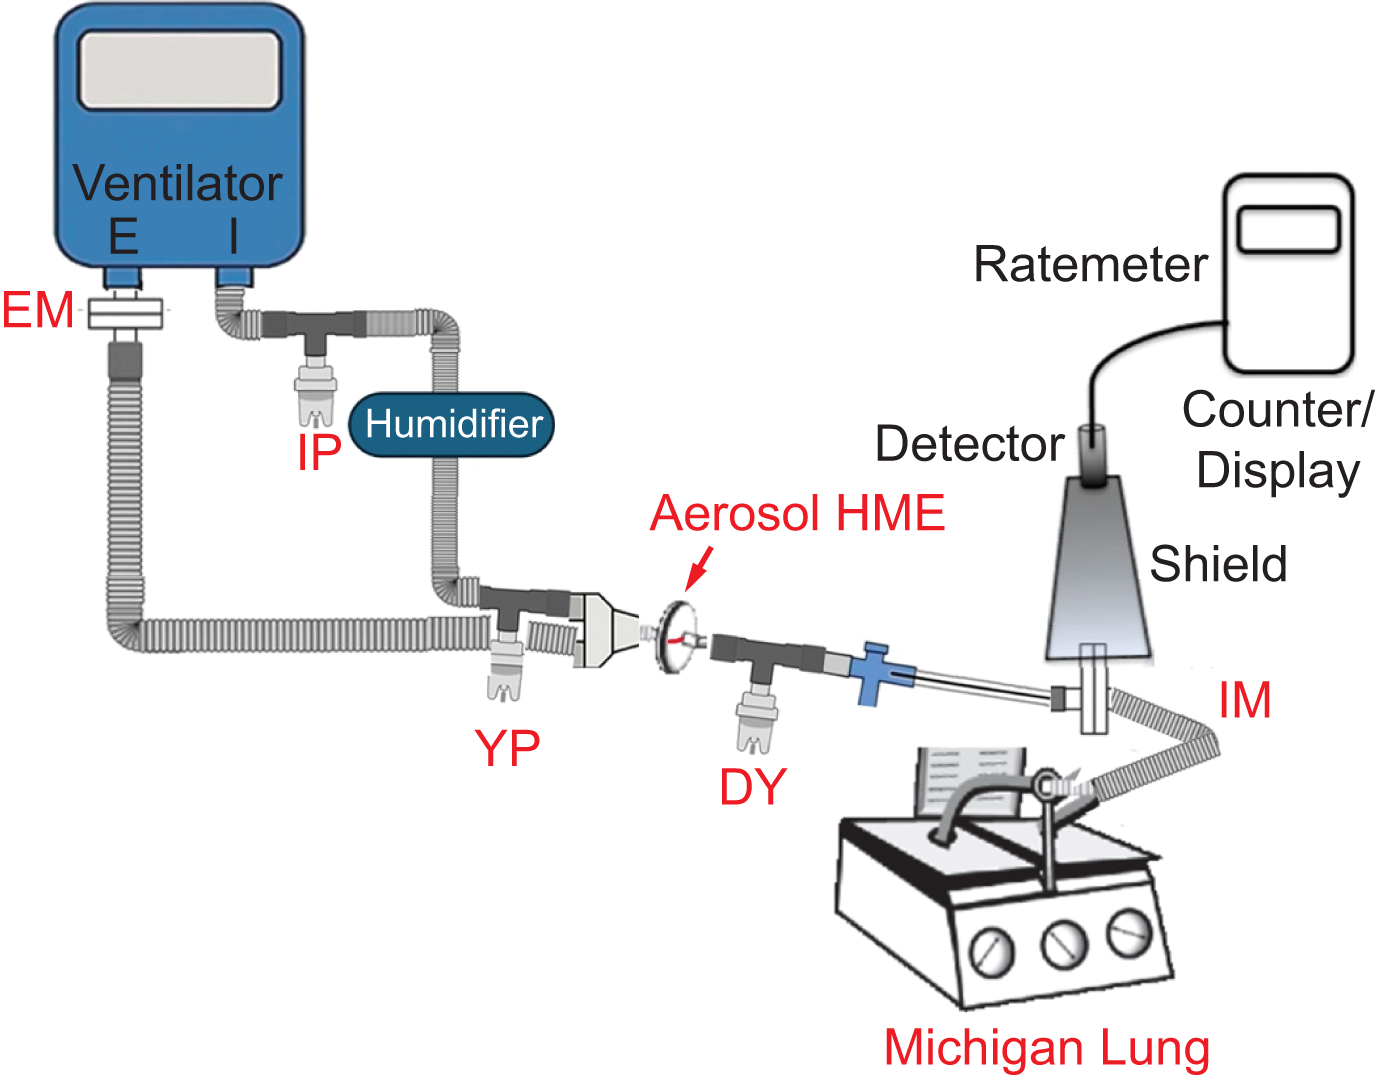
Ventilator circuit connected to the Michigan lung with the three different nebulizer positions (IP, YP, and DY). Ratemeter location is shown. IM, Inhaled mass filter; EM, Expiratory mass filter; IP, Close to ventilator; YP, Close to Y-piece; DY, Proximal to ETT.
Five different ventilators were utilized in the experiments: Puritan Bennett 7200 (Puritan Bennett), Avea (Vyaire Medical), Dräger XL Evita (Dräger), Servo-i (Getinge), and Bellavista (Vyaire Medical). Preliminary experiments were conducted using the Puritan Bennett 7200 to compare with early studies from our group, and it can be tested without bias flow. 7 Although multiple nebulizer positions have been evaluated by other investigators, we did not add any unheated tubing lengths to the circuit to avoid possible condensation.
To mimic clinical use, for humidification, we assumed patients would be maintained with an HME or active humidification, and that aerosol therapy would be administered using an HME circuit or a circuit with active humidification. We did not test aerosol delivery with an active humidifier turned off and left in the circuit or bypassed. Only nonhumidified experiments were conducted in the DY position, with the aerosol HME placed in the closed position. The IP and YP positions were studied in both HME and actively humidified circuits, using breath-actuated nebulization from the ventilator (if available) or continuous nebulization using compressed air at 8 L/min at 50 PSIG.
Mass balance of aerosols was assessed via gamma camera (Maxi Camera 400, General Electric, Horsholm, Denmark; Power Computing, Model 604/150/D, Austin, Texas; Nuclear MAC OS, Version 4.2.2, Scientific Imaging, Thousand Oaks, California) and a well counter (Atom Lab 100: Biodex, Inc., Shirley, New York) converting all regional counts to activity in µCi. The nebulizer was filled with 3 mL saline mixed with technetium-99m pertechnetate (Tc99m), measured in a radioisotope calibrator, defining the nebulizer charge at T = 0. Once nebulization was started, the ratemeter measured scintigraphy counts every 5 minutes from the IM HEPA filter at the distal end of the endotracheal tube (Rusch, Teleflex Medical, Morrisville, North Carolina). The experiment was continued until the counts plateaued. The ratemeter counts were converted to µCi, and activity accumulating on the IM filter was reported as the fraction of nebulizer charge delivered to the inspiratory filter (IM) per minute.
In actively humidified experiments, the humidifier temperature was allowed to reach 37°C before the experiment was started. The humidifier was connected to the ventilator using the standard corrugated tubing (18 inches) provided with the ventilator circuit. At the end of the experiment, radioactivity was measured throughout the entire circuit. The inhaled mass (aerosol deposition in the inspiratory filter, IM), expiratory mass (aerosol deposition in the expiratory filter, EM), and nebulizer residual (residual medication left in the nebulizer, NR) were measured using the well counter.
Regional and total activity in circuit components (eg, circuit tubing, humidifier, T-piece, flow sensors, aerosol HME) was measured using the gamma camera, with counts converted to µCi using calibrated camera efficiency. A mass balance close to 100 ± 10% was considered adequate to account for all the initial nebulizer radioactivity.16,19
Additional tested components included effects of a spring-loaded T (D&D Medical, Little Rock, Arkansas) and different measured circuit compliances; Hudson HUD1607, nonheated ventilator circuit (Hudson, RCI, IL, USA) 1.9 mL/cm H2O/meters and Evaqua RT380 (Fisher & Paykel Healthcare) at 0.66 mL/cm H2O/meters.
The protocol consisted of initial mass balance experiments using the Puritan Bennett 7200, performed in duplicate for each position (IP, YP, DY), HME or active humidification, and mode of nebulization (breath-actuated vs continuous). Based on the preliminary results, we repeated the experiments on other ventilators (Avea, Dräger XL Evita, Servo-i, and Bellavista), with modifications to inspiratory time (TI) and circuit compliance. A summary of the experiments is provided in Table 1.
Summary of experimental conditions
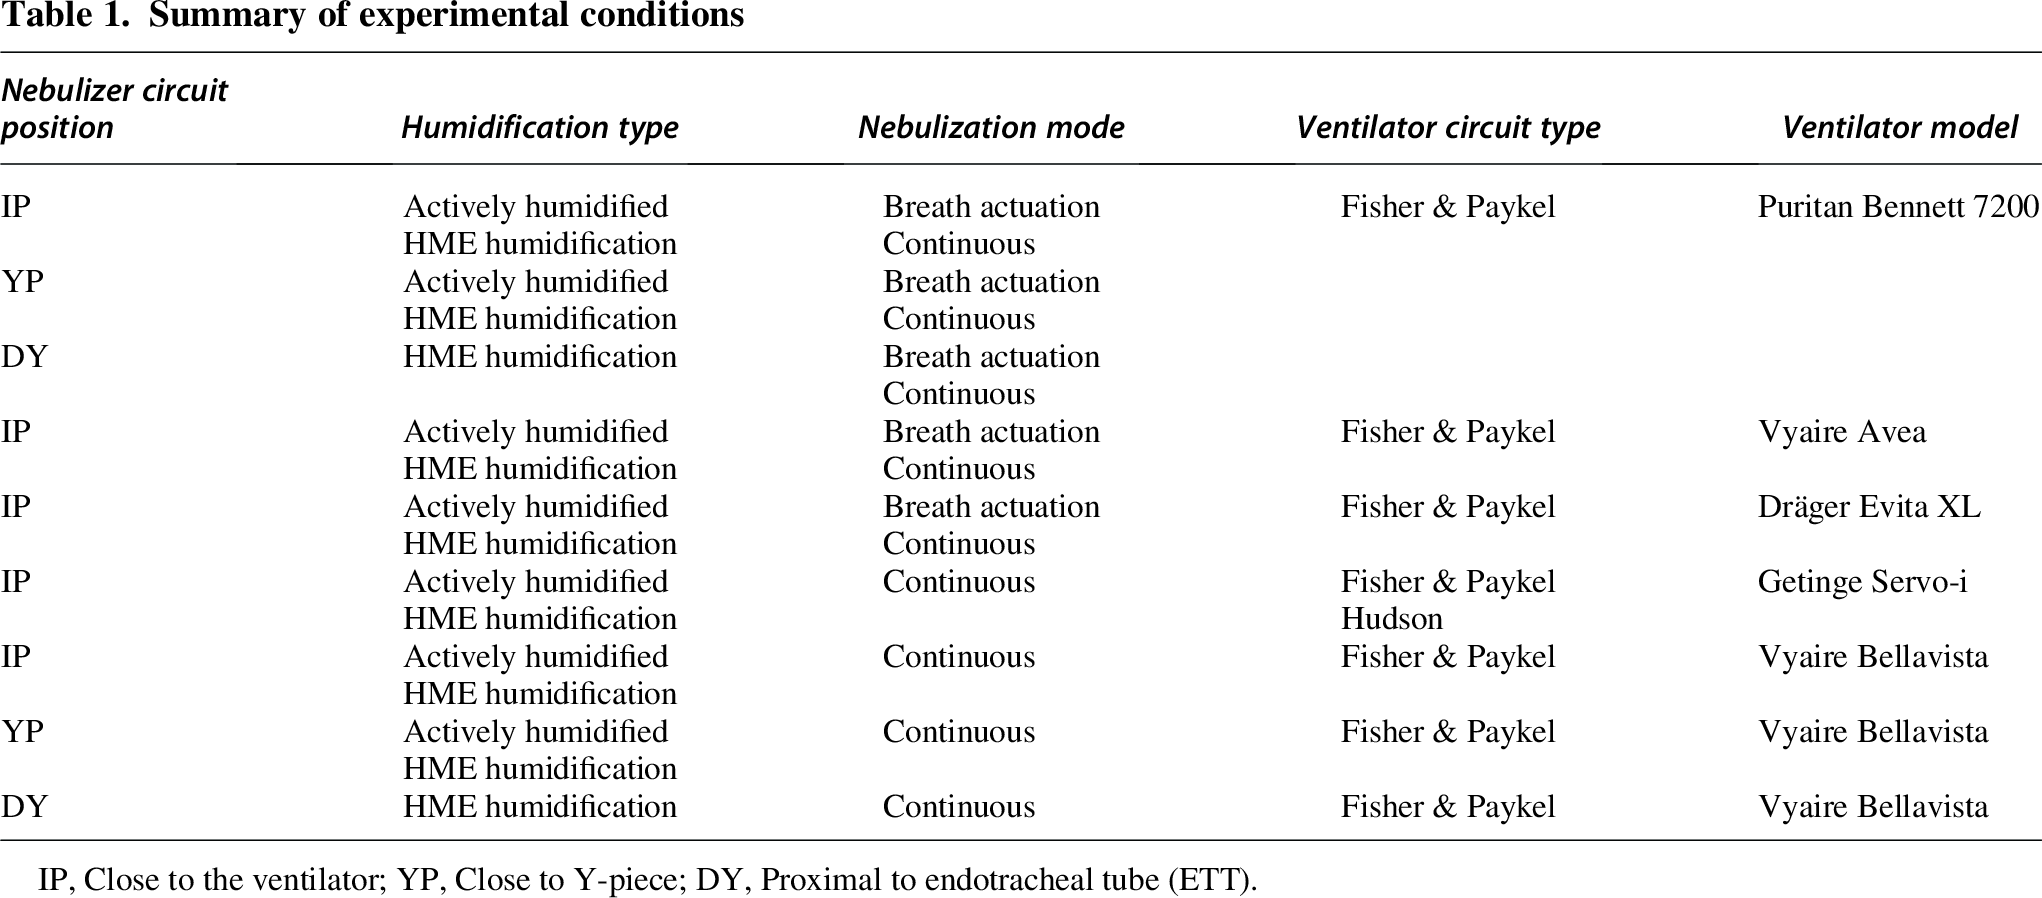
IP, Close to the ventilator; YP, Close to Y-piece; DY, Proximal to endotracheal tube (ETT).
Ventilator settings
Volume-controlled continuous mandatory ventilation (VC-CMV) and two different inspiratory times (TI) were used. High (TI 0.7 s): tidal volume (VT) 500 mL, rate 18 breaths/min, PEEP 5 cm H2O, FIO2 0.21, and low TI (TI 0.55 s): tidal volume (VT 460 mL, rate 15 breaths/min, PEEP 5 cm H2O, and FiO2 0.21. Flow was varied between ventilators to ensure the predetermined inspiratory time. The VC-CMV mode was chosen because it is commonly used worldwide and by others measuring nebulizer function.8,16
Nebulizer
We used the AeroTech jet nebulizer (Biodex Medical Systems, Shirley, New York), previously studied by our group. Five individual nebulizers were used on a rotational basis and cleaned between experiments.
In addition, two mass balance experiments were performed using the Aerogen Solo (Aerogen, Galway, Ireland) nebulizer. These devices were tested in the IP position using aerosol HME. These were confirmatory studies to clarify the major observations of Montigaud et al.
Statistical analysis
For the quantitative data, we used count, mean, and standard deviation for descriptive data analysis. For inferential analysis, we used the Mann–Whitney U test, assuming nonparametric distribution and independent samples. Linear regression analysis was performed to evaluate IM, EM, and NR using independent variables. A P value of < .05 was considered statistically significant. Unless indicated, two-tailed P values were calculated. Data visualization and analysis were conducted using GraphPad Prism v10 for Mac OS X (GraphPad Software, San Diego, California) and statistical software R in RStudio v 2024.04.2 + 764 (R Foundation for Statistical Computing, Vienna, Austria).
Results
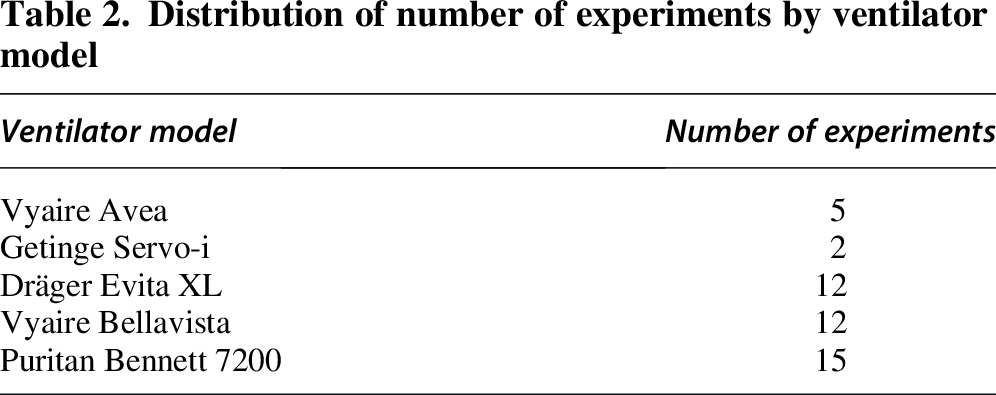
Sixty-six experiments were performed, 44 of which were mass balances. For the remaining 22, only the IM, EM, and NR were measured (Table 2).
Distribution of number of experiments by ventilator model
Mass balance totals ranged from 96% to 104%. Table 3 summarizes the observed IM, EM, and NR in all positions. IM was highest for IP, continuous, HME humidified nebulization (29.8 ± 5%, mean ± SD). Breath-actuated effects were minimal, with (27.1 ± 4%) active humidification or HME humidification (26.8 ± 4%). The IM was lowest for YP, actively humidified nebulization—continuous nebulization (8.8 ± 0.6%) followed by breath-actuated nebulization (11.7 ± 0.4%).
Summary of mass balance data: Nebulizer circuit position, humidification type, and mode of nebulization
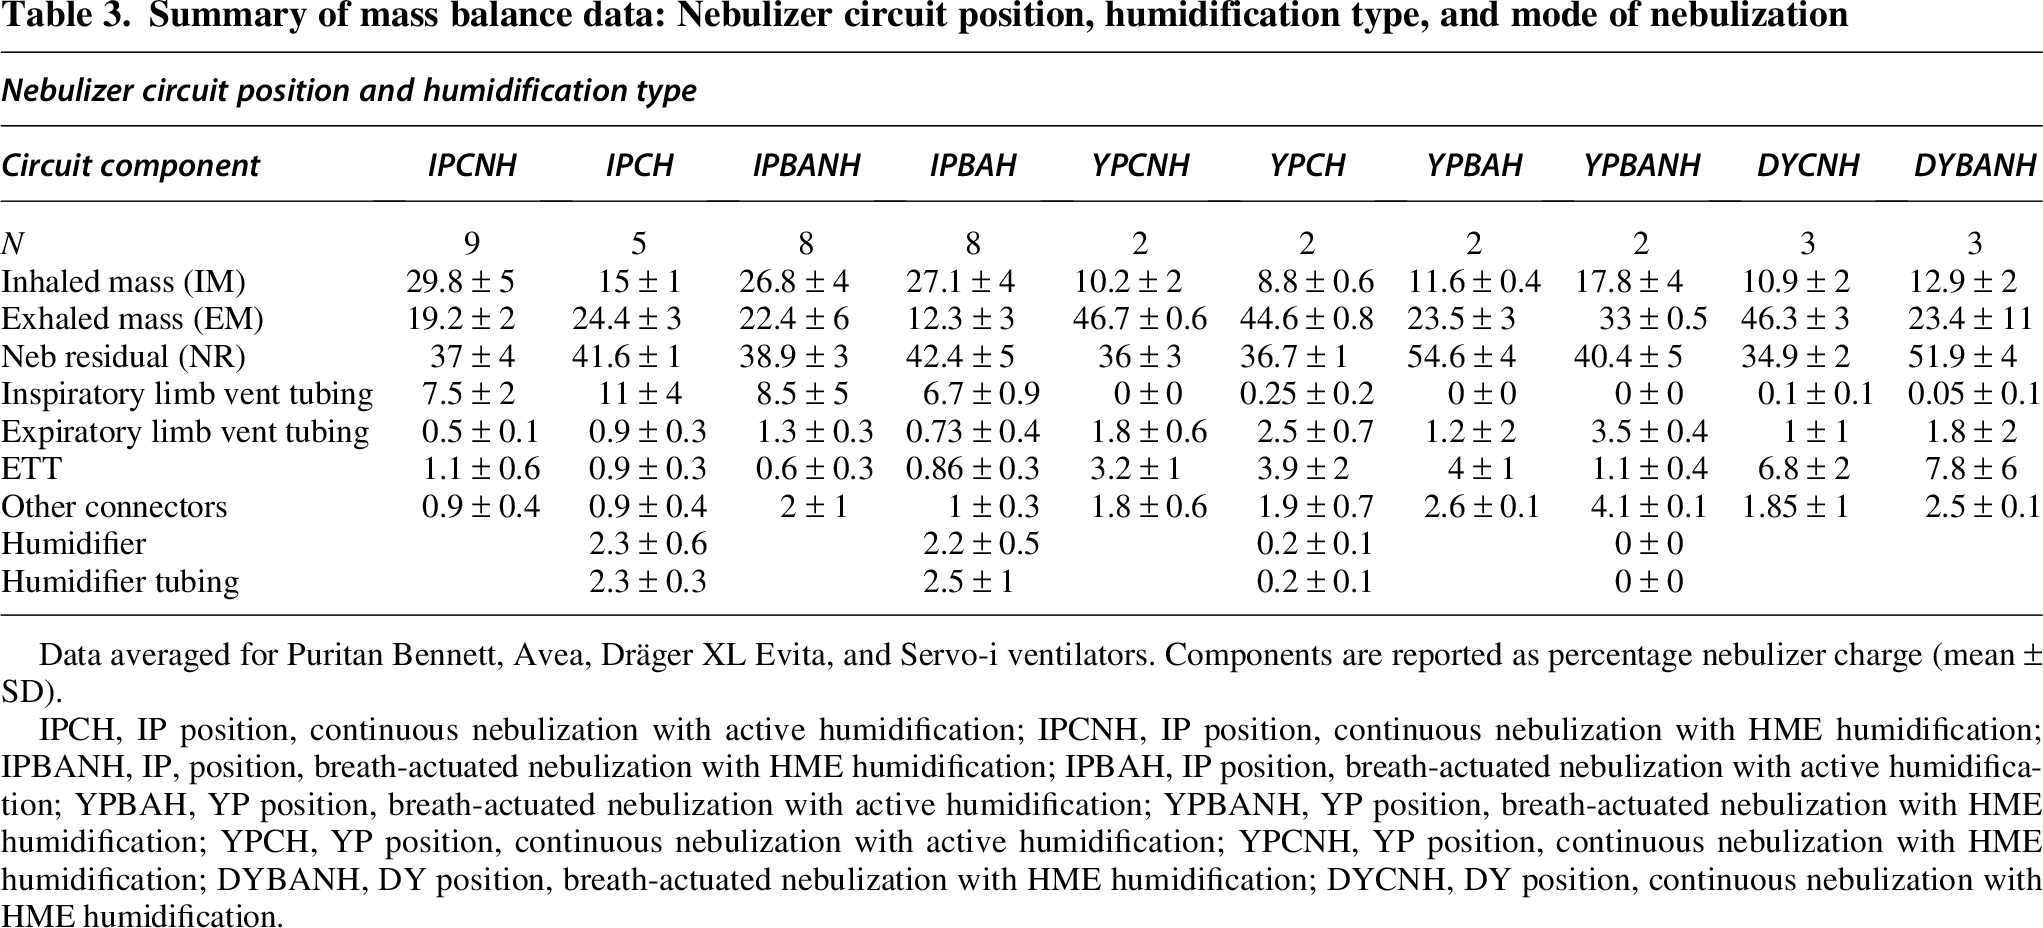
Data averaged for Puritan Bennett, Avea, Dräger XL Evita, and Servo-i ventilators. Components are reported as percentage nebulizer charge (mean ± SD).
IPCH, IP position, continuous nebulization with active humidification; IPCNH, IP position, continuous nebulization with HME humidification; IPBANH, IP, position, breath-actuated nebulization with HME humidification; IPBAH, IP position, breath-actuated nebulization with active humidification; YPBAH, YP position, breath-actuated nebulization with active humidification; YPBANH, YP position, breath-actuated nebulization with HME humidification; YPCH, YP position, continuous nebulization with active humidification; YPCNH, YP position, continuous nebulization with HME humidification; DYBANH, DY position, breath-actuated nebulization with HME humidification; DYCNH, DY position, continuous nebulization with HME humidification.
Aerosol losses to the expiratory mass filter (EM) appeared primarily affected by location, with the lowest losses observed with IP, breath-actuated nebulization in an actively humidified circuit (12.4 ± 3%), followed by IP, continuous nebulization in an HME-humidified circuit (19.3 ± 2%). The highest EM losses were observed at YP, continuous nebulization with HME humidification (46.7 ± 0.6%), and DY, continuous nebulization with HME humidification (46.3 ± 3%).
The nebulizer residual (NR) appeared to be influenced by experimental conditions, particularly BA versus continuous nebulization (eg, YP breath-actuated [54.7 ± 4%] vs continuous [36.8 ± 2%]). Across all experiments, differences in NR, breath-actuated versus continuous nebulization, were significant (43.1 ± 6% vs 37.1 ± 3%, P = .002).
Together, IM, EM, and NR account for ≥ 80% of aerosol distribution throughout the circuit, with the remaining particles depositing in the circuit (Table 3)—inspiratory and expiratory limbs of the circuit, humidifier, corrugated tubing connecting the humidifier and connectors—Y-piece, T-piece, and plastic connectors/elbows.
Using a spring-loaded T-piece resulted in significantly higher T-piece deposition compared with a non-spring-loaded T-piece (8.4 ± 4% vs .55 ± 0.3%, P = .01, no. = 12), but changes in IM were not significant (24.2 ± 7 vs 20.3 ± 7, P = .38, no. = 12).
No significant differences were noted in the circuit deposition patterns or aerosol delivery among the Puritan Bennett, Avea, Dräger Evita XL, and Servo-i ventilators. However, the Bellavista had lower IM for all positions. Data are presented separately (Table 4). For the Bellavista, similar to the other ventilators, IP, continuous, HME humidified nebulization was the best mode of nebulization (18.4 ± 3%). Aerosol deposition on the external flow sensor varied between 3.3% and 5%, except when the nebulizer was placed in DY position (0.7%).
Summary of mass balance data with Bellavista ventilator: Nebulizer circuit position, humidification type. Components are reported as percentage nebulizer charge (mean ± SD)
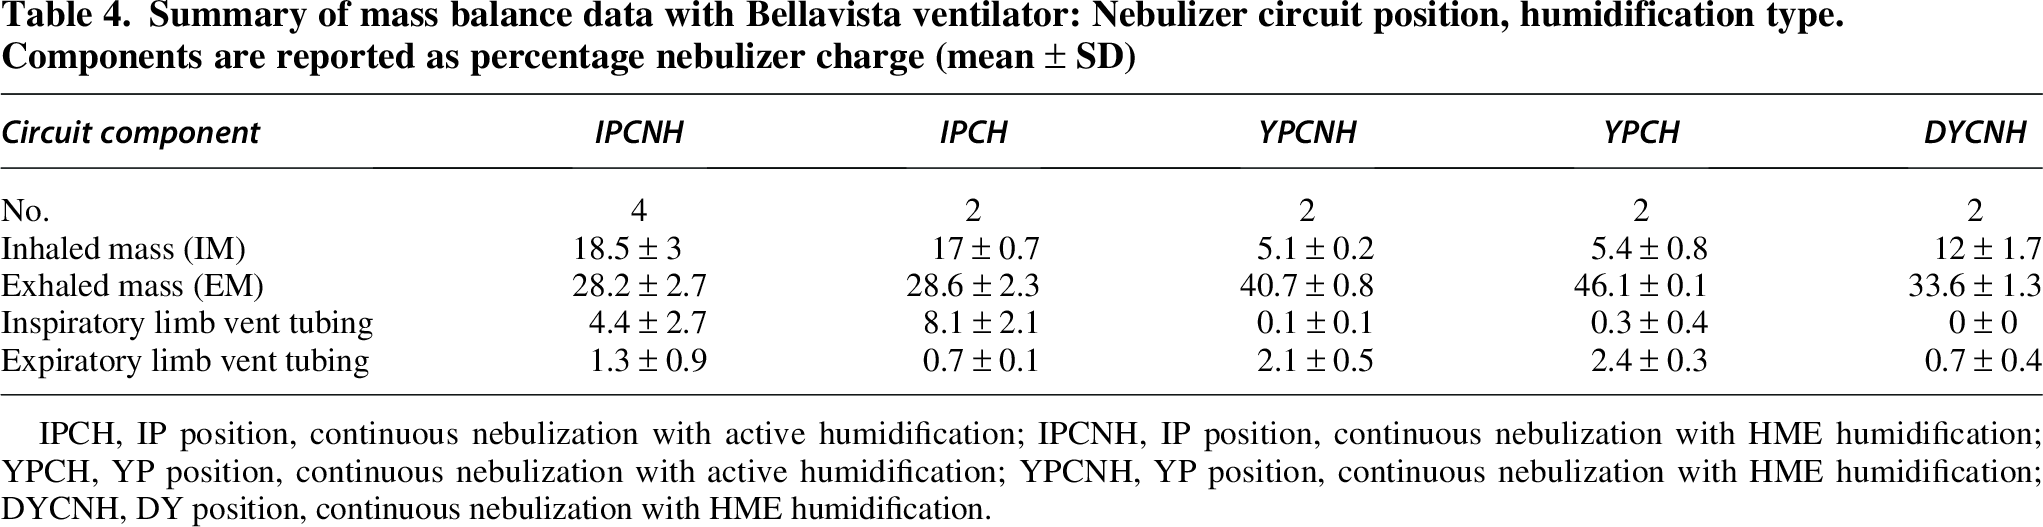
IPCH, IP position, continuous nebulization with active humidification; IPCNH, IP position, continuous nebulization with HME humidification; YPCH, YP position, continuous nebulization with active humidification; YPCNH, YP position, continuous nebulization with HME humidification; DYCNH, DY position, continuous nebulization with HME humidification.
Effects of circuit compliance were significant. For example, for IP, HME humidified, continuous nebulization, Hudson versus Fisher Paykel circuits showed differences in IM (22 ± 0.7% vs 28 ± 3%, P = .01, no. = 8) and EM (35.3 ± 2% vs 22 ± 3%, P = .01). NR was not significantly different between the two circuits (37 ± 1% vs 40 ± 3, P = .08).
Regression analysis tested nebulizer position in the circuit, active humidification versus HME circuit, breath actuation versus continuous nebulization, deposition on the inspiratory limb of the ventilator circuit, and TI (0.7 s vs 0.55 s) to evaluate the effect on IM, EM, and NR. IP nebulizer placement and humidification were significant variables, but in multiple variable regression, only IP position was statistically significant with an R2 of 0.557 for IM. No interaction was observed between nebulizer position and humidification in explaining IM. For EM, IP position, BA, deposition in the inspiratory limb of the ventilator circuit, and NR were significant. However, in multiple variable regression analysis, IP position, BA, and NR remained significant with R2 value of 0.566, whereas deposition in the inspiratory limb of the ventilator circuit was not significant. Supplementary Table S1 provides a summary of the regression analysis (Supplementary Data).
Gamma camera images (Fig. 2) demonstrate nonuniform aerosol deposition within the tubing. Most of the deposition was in the proximal portion of the inspiratory limb of the ventilator circuit and the proximal endotracheal tube. The humidifier itself did not show significant aerosol deposition.
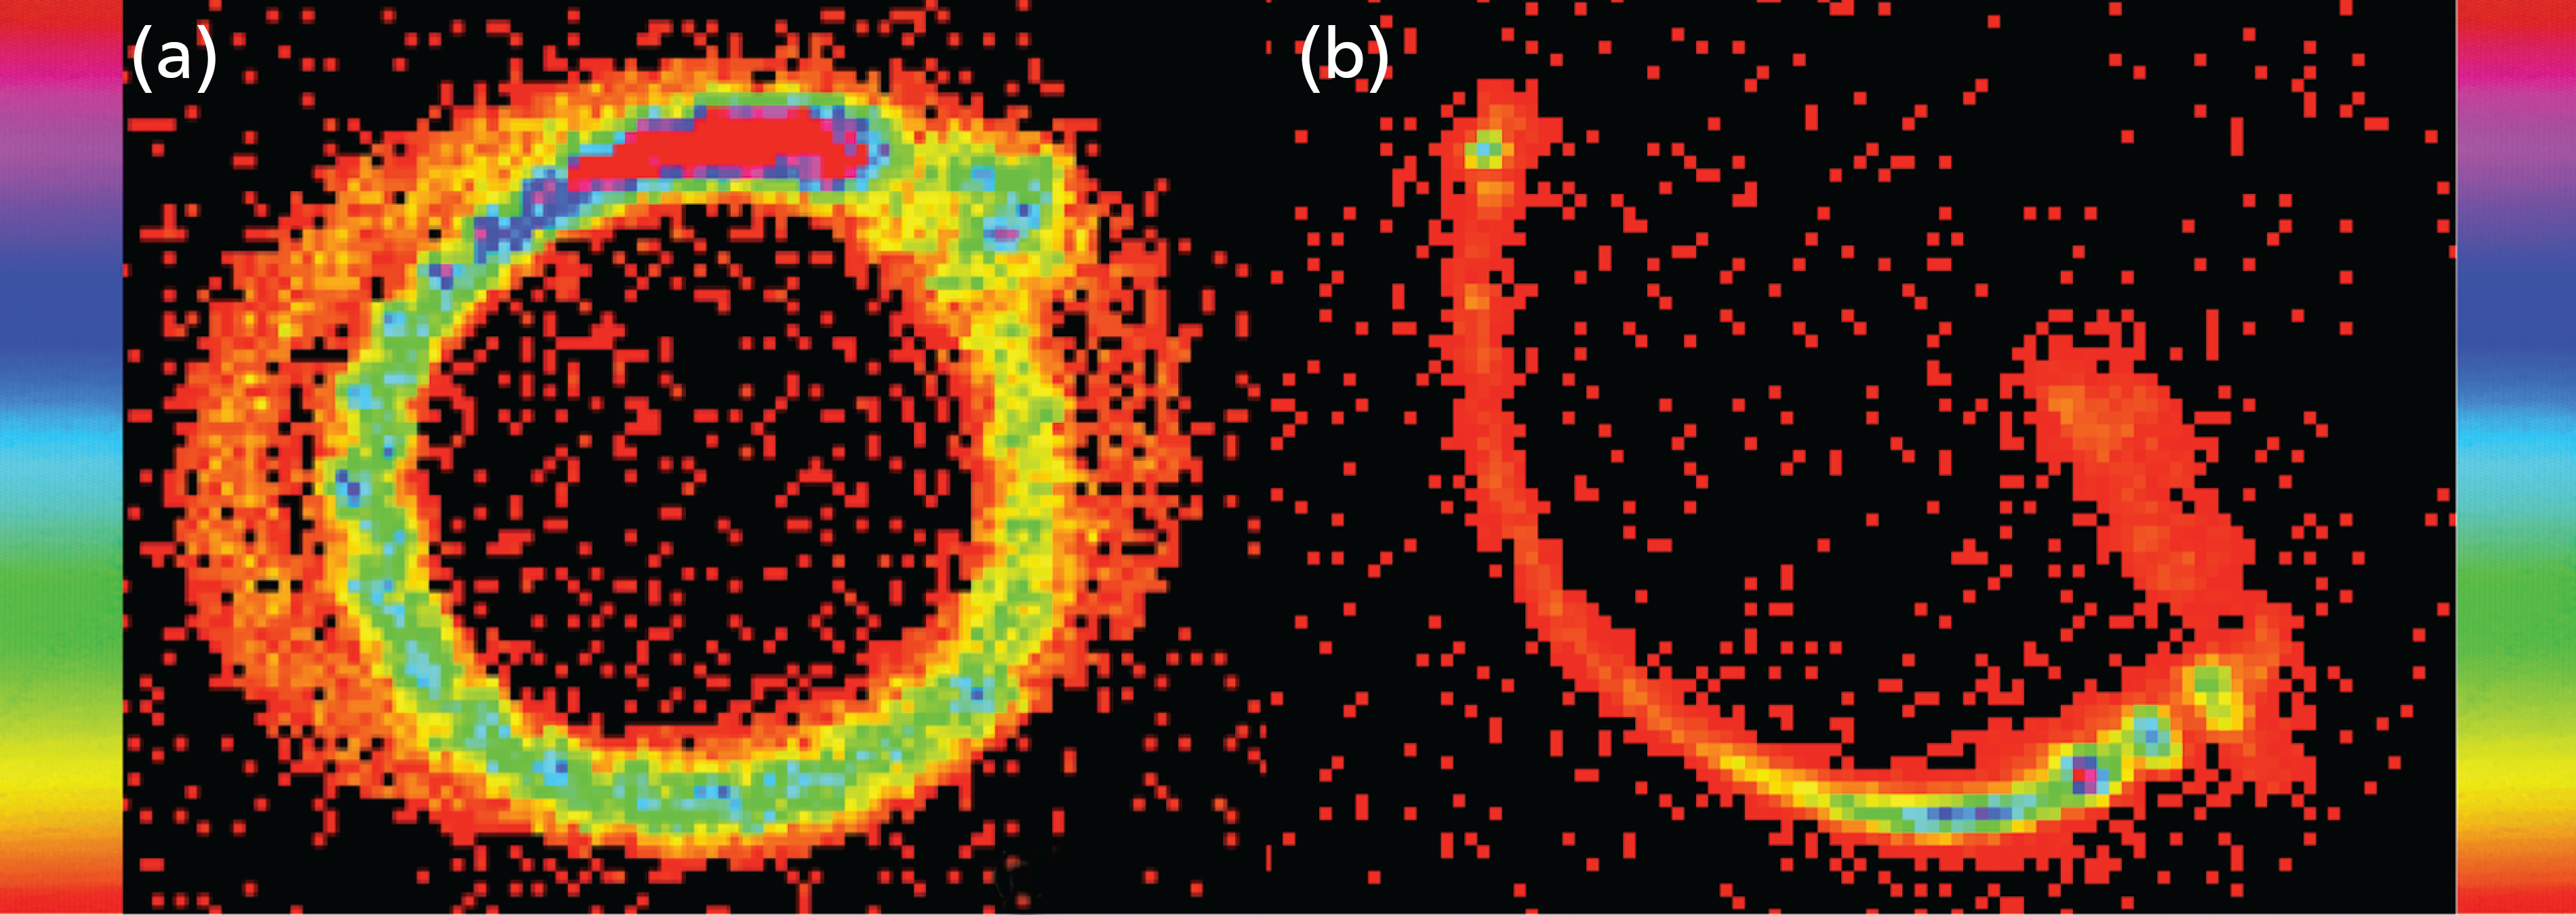
Gamma camera images of circuit components showing entrance effect in
Figure 3 depicts the ratemeter tracings of activity, plotted as the fraction of nebulizer charge versus time (minutes), that is, the aerosol delivered to the IM filter per minute as a fraction of the nebulizer charge. The time to plateau of the ratemeter tracing measures the treatment time for the nebulizer charge. The green curves represent the optimal condition (IP, HME humidification, continuous nebulization). Treatment time was shortest for IP, HME humidified, continuous nebulization with all the IM delivered in ∼10 min. Active humidification resulted in a significant drop in the IM but it did not affect the treatment time (pink curves). IP, breath-actuated experiments had a similar IM, but the treatment time increased to 40 min (red and brown curves). Active humidification during BA did not affect the IM or the treatment time. A shorter inspiratory time (Ti 0.55 s) resulted in lower IM with longer treatment time (∼90 min, lower panel—Fig. 3.2, solid lines) for IP, breath-actuated, actively humidified nebulization, whereas HME humidification had a longer treatment time without much change in the IM. Dotted lines represent TI 0.7, plotted for comparison.
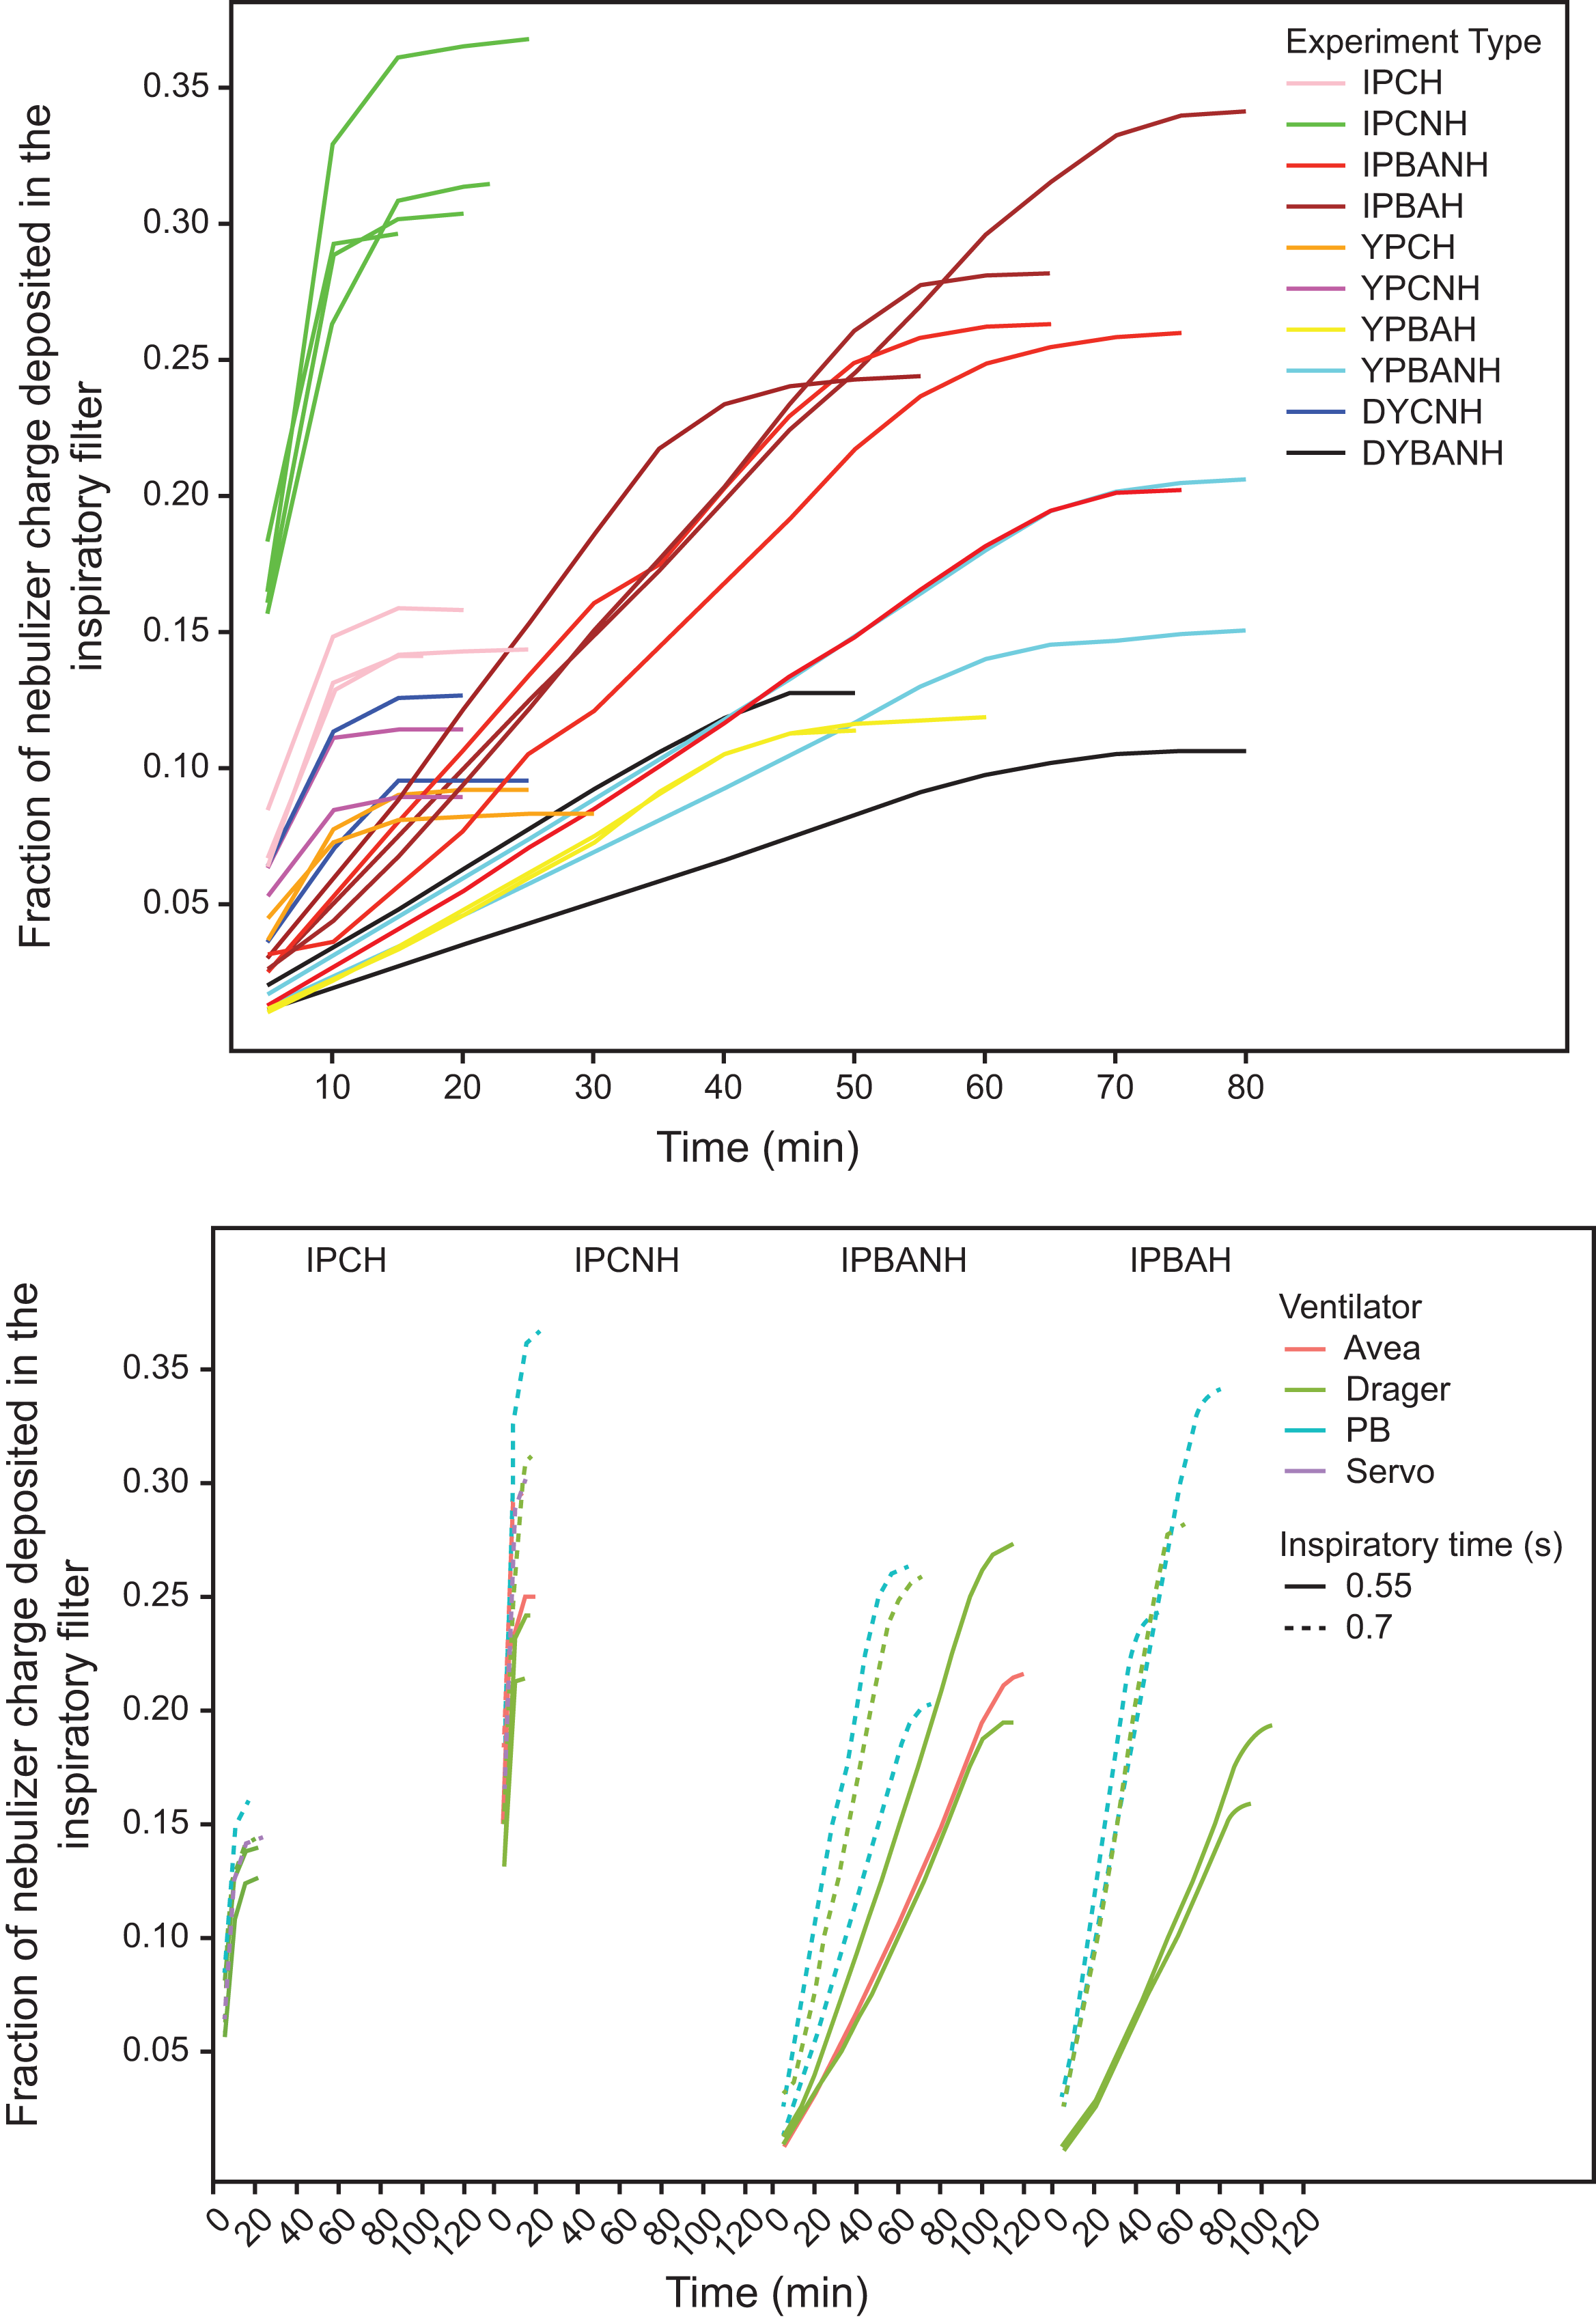
Top panel: Ratemeter output (fraction of nebulizer charge) versus time (min): TI = 0.7 s. Curves that plateau in ∼10 min are all continuous nebulization; IP position, continuous nebulization, and HME humidification (IPCNH) plateau at 0.3–0.32. Output drops to ∼0.15 with active humidification (IPCH) and decreases further with YP and DY positions (YPCNH, YPCH, DYCNH). Curves plateauing in 40–70 min are all breath-actuated; IPBAH and IPBANH overlap between 0.24 and 0.34, decreasing to 0.12–0.17 at YPBAH, YPBANH, and DYBANH. Bottom panel: Data from all IP experiments: TI = 0.7 (dashed lines) and TI = 0.55 (solid lines), from all ventilators (color coded). Lower TI increases treatment time for breath-actuated, HME humidified experiments with preserved inhaled mass. When actively humidified, the inhaled mass was significantly reduced. Treatment time for continuous experiments was not affected by changes in TI. IPCH, IP position, continuous nebulization with active humidification; IPCNH, IP position, continuous nebulization with HME humidification; IPBANH, IP, position, breath-actuated nebulization with HME humidification; IPBAH, IP position, breath-actuated nebulization with active humidification; YPBAH, YP position, breath-actuated nebulization with active humidification; YPBANH, YP position, breath-actuated nebulization with HME humidification; YPCH, YP position, continuous nebulization with active humidification; YPCNH, YP position, continuous nebulization with HME humidification; DYBANH, DY position, breath-actuated nebulization with HME humidification; DYCNH, DY position, continuous nebulization with HME humidification.
Figure 4 shows the results of our Aerogen Solo mass balance (no. = 2) compared with those reported by Montigaud et al for IP continuous nebulization in an HME circuit, IM 19.2 ± 3.4%, inspiratory limb of 45 ± 4%, and NR 6 ± 1%. Treatment time was ∼15 min.
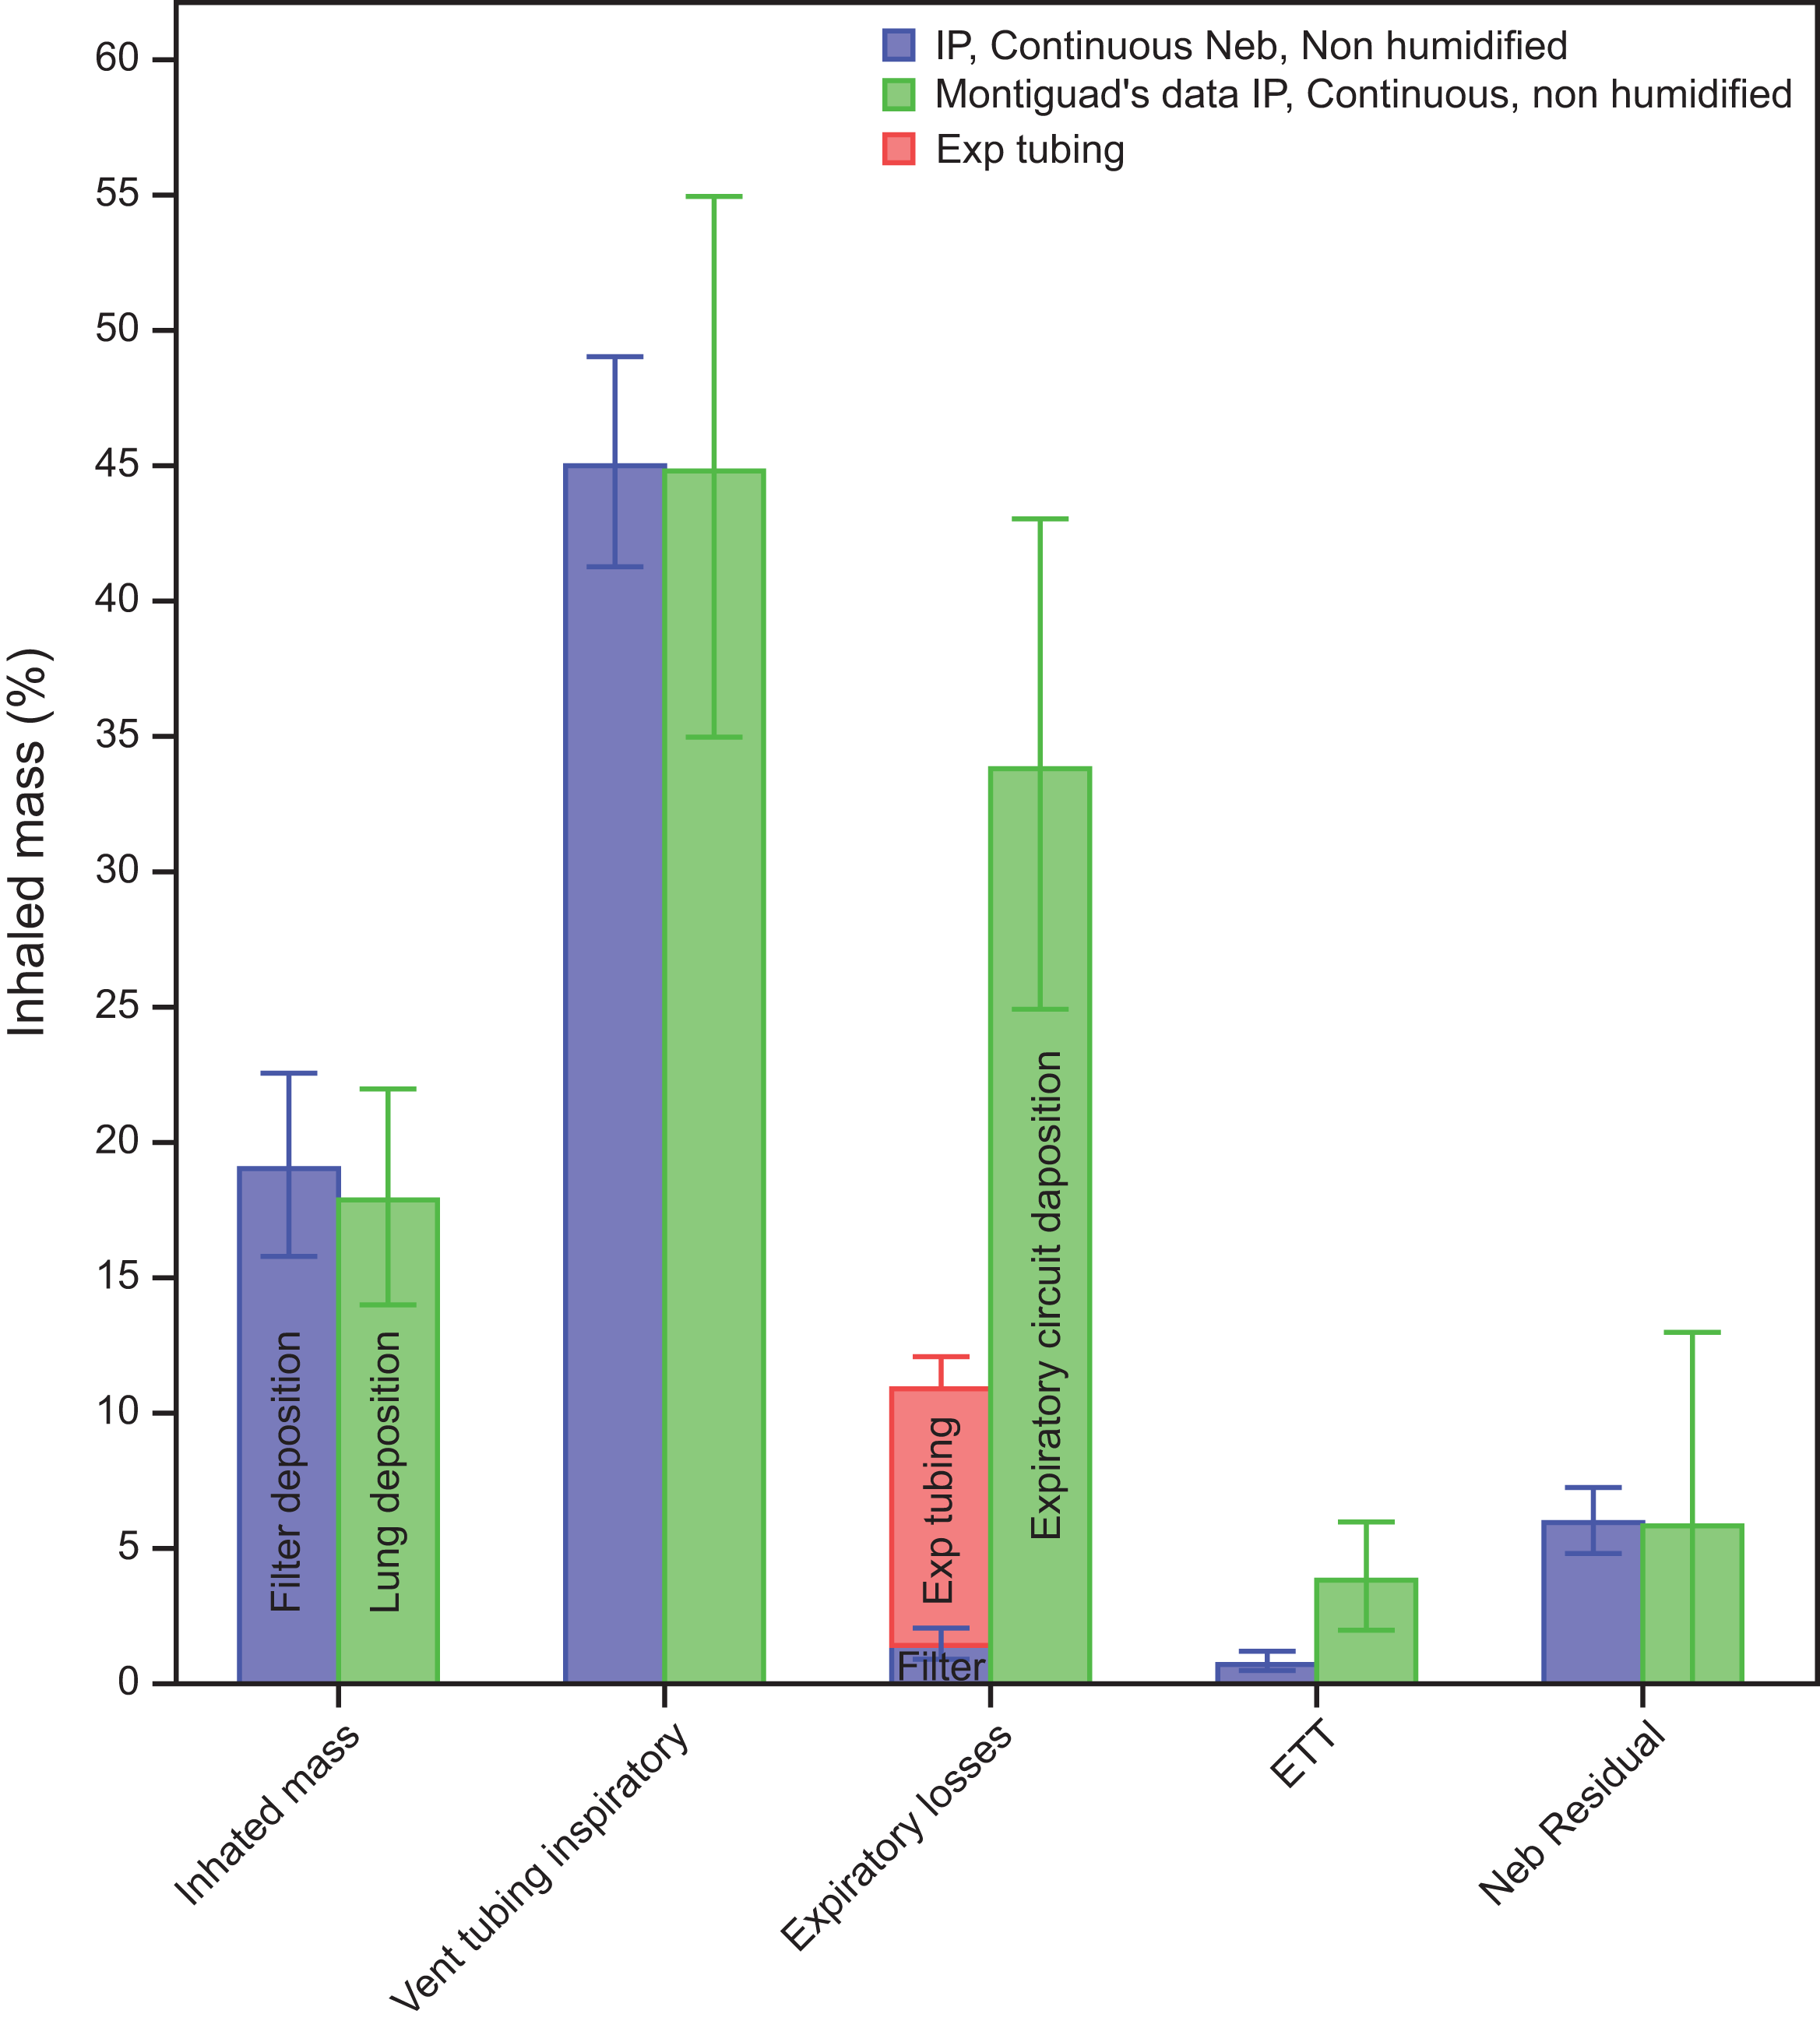
Comparison of our data with Montigaud et al for IP, continuous nebulization using Aerogen Solo in an HME circuit. Inhaled mass represents the percentage of nebulizer charge deposited in the inspiratory filter (blue) in our experiments and is compared with the deposition in the lung in Montigaud et al experiment (green). The expiratory losses for our data included deposition in the expiratory circuit (pink) along with expiratory mass filter (blue). The difference in the total expiratory losses between our data and Montigaud represents exhaled particles from Montigaud’s porcine lung. IP, close to ventilator.
Discussion
This study aimed to identify modifiable factors that optimize medication delivery using jet nebulizers. These data will serve to plan methods of ventilator drug delivery in future clinical trials of dose-dependent drugs, such as antibiotics. Using the mass balance, we report new factors affecting jet nebulizer performance during mechanical ventilation. There were unexpected contributions of newly measured important variables (circuit compliance, NR, spring-loaded T). Previously tested factors (BA, nebulizer position, humidification) important in modern mechanical ventilation were retested with unexpected results.
Drug delivery via jet nebulizer is primarily defined by the transfer of particles from the inspiratory to the expiratory circuit, measured by activity on the expiratory filter (EM). An increase in EM indicates a decrease in tubing deposition and/or transfer of inspiratory gases to the expiratory line. For the jet nebulizer in the IP position, the inspiratory tubing reduces the transfer of particles to the expiratory line. Deposition within the lines is relatively low.
Figure 2 demonstrates regional deposition in the components of the ventilator circuit, specifically the proximal inspiratory limb for IP and proximal endotracheal tube for YP and DY. We attribute this regional deposition to a combination of entrance effects (local turbulence at tubing connectors) and impact of relatively large particles.
Most studies evaluating nebulizers have focused exclusively on IM measurements.1,2,8,21,22 This approach leaves the mechanisms of aerosol losses to speculation. Over the years, ventilators and nebulizers have evolved, such as ventilator settings with short duty cycles (eg, reduced Ti), heated wire humidification, and VMN. Many newer ventilators lack breath-actuated nebulization. Generally, manufacturers of ventilators and circuits do not address aerosol delivery, leaving this area to individual investigators.
The position of the jet nebulizer, humidification, TI, and circuit compliance can significantly affect aerosol delivery. Regression analysis showed that approximately 55% of the variability in the IM can be explained by the nebulizer position alone. For instance, IP delivered four times higher inhaled mass compared with DY placement, with other independent variables kept constant. By altering these factors, the IM can range from 8 to 33% with jet nebulizers. Montigaud et al also found different but significant effects of nebulizer position with VMN. 16
For EM losses, three variables—IP placement, NR, and BA—accounted for 56% of the variability in EM in our data. IP position was the most important factor explaining changes in EM (Supplementary Table S1). NR was higher in breath-actuated experiments, suggesting the flow transients in the nebulizer may result in more losses on the nebulizer wall.
Using a spring-loaded T-piece permits the removal of the nebulizer from the circuit without circuit disruption. It was noted to have significantly higher aerosol deposition than a non-spring-loaded counterpart, likely because of the deposition of particles destined for circuit deposition, as no significant changes were seen in the IM.
BA did not offer any benefit over continuous nebulization in an HME circuit. Ehrmann et al has highlighted the limitations of BA with existing ventilator technology, noting that failure to stop nebulizing during expiration limits its value. 8 For the IP position, BA and active humidification matched delivery for continuous nebulization in an HME circuit.
Humidification had paradoxical effects on aerosol delivery, which appeared to depend on nebulizer position. Since activity on the expiratory filter (EM) represents aerosol transferred from the inspiratory circuit to the expiratory circuit, EM should increase if tubing deposition decreases and/or inspiratory gases are transferred to the expiratory line. For all positions and modes of nebulization where the nebulizer was located downstream to the humidifier, humidification resulted in both reduced circuit deposition and transfer of aerosol to the expiratory circuit, effects that were offset by an increase in NR. As a result, the overall effect was either unchanged or slightly reduced IM. However, with IP, continuous nebulization, higher deposition in the inspiratory limb of the circuit, and transfer of aerosols were observed, along with an increase in NR, resulting in a notable drop in IM. We attribute this to the humidifier tubing, which lies distal to the nebulizer in the IP position. These observations, different from previous reports, advocate only two configurations optimal for nebulization, active humidification, or HME. Shutting the humidifier off and leaving it in the circuit may have adverse effects on aerosol delivery. Others have left the humidifier in the circuit, shutting it off during so-called nonhumidifed experiments.9,21–24
High compliance circuit tubing (eg, Hudson corrugated, nonheated ventilator circuit) resulted in higher EM. We hypothesize that the higher compliance allows it to hold an additional 20 mL of gas in the circuit compared with the low-compliance ventilatory circuit (Fisher Paykel heated ventilatory circuit). The additional gas decompresses with expiration, transferring more aerosol to the expiratory limb.
NR appears to be a multifactorial problem likely affected by surface properties of the nebulizer charge and, from our results, the flow pattern when the nebulizer is triggered. We found that breath-actuated nebulization increases NR significantly over continuous nebulization, and it adds to the previously reported flaws of BA reported by Ehrmann et al. 8 Sirr et al postulated surface tension as one of the factors affecting NR. 25 They used ethanol to lower surface tension, which doubled IM.
As shown in Figure 3, there were marked differences in treatment time between continuous and breath-actuated nebulization. Continuous nebulization, in addition to having a higher IM, had the shortest treatment time (10 min). Breath-actuated nebulization on average required 40–50 min. A shorter TI of 0.55 s further lengthened the treatment time to at least 90 min and/or reduced IM, making this mode of delivery impractical (Fig. 3.2).
IM for all positions was reduced for the Bellavista. Although that ventilator has an external flow sensor that captured some aerosol, the Bellavista has significantly more bias flow (6 vs 2 L/min), resulting in more expiratory losses (high EM, Table 4).
Montigaud et al did similar experiments using VMN technology, evaluating the distribution of aerosols using SPECT in a porcine lung model. 16 Because results using VMN from other reports differed from those of Montigaud et al, we performed experiments to confirm Montigaud’s observations, particularly for IP position, in an HME circuit (Fig. 4).3,14–16 Our findings in the inspiratory circuit were virtually identical with Montigaud et al when the nebulizers were placed in IP position with an open HME circuit. Differences in the expiratory tubing and ETT tube reflect the fact that the porcine lung in Montigaud’s article was not a complete filter, and much of the aerosol was exhaled from the lung, depositing in the expiratory components of their circuit, represented by a single number in Figure 4. A contributing factor to this deposition behavior is the difference in particle distributions between the two nebulizer technologies. Miller et al reported a mass median aerodynamic diameter (MMAD) for the AeroTech II of 1.2 ± 0.1 µm in an HME circuit, increasing to 2.3 ± 0.3 µm with humidification. 7 For VMNs, Montigaud et al measured an MMAD of 1.69 ± 0 µm in an HME circuit, increasing to 4.94 ± 0.3 µm with humidification.
This exhaled fraction suggests that the large particles produced by VMN were filtered in the inspiratory ventilator line, and the aerosol entering the lung was primarily small particles, many of which were exhaled. These data are consistent with the overall VMN observation that to maximize patient deposition, the VMN should be close to the patient.
Our results show significant differences between the jet nebulizer compared with VM technology. Jet nebulizers work best when placed close to the ventilator and are significantly affected by humidification on continuous nebulization, but VMNs work best when placed close to the patient in YP, and their overall performance is not much affected by humidification. YP happens to be the least favorable placement for the jet nebulizers. However, if the VMN is left in the circuit, this location exposes the unheated nebulizer to condensation effects.
VMN losses are similar in magnitude to jet losses but through different mechanisms. VMN suffers from significant deposition in the upstream circuit, with as much as 50% deposition reported by Montigaud et al in their experiments, where it was placed close to the ventilator. 16 We validated this work and found 45 ± 4% deposition in the inspiratory limb when Aerogen Solo was placed IP for continuous nebulization in HME circuit. Use of mass balance allows identification of these deposition patterns compared with experiments where only IM is measured.1,2,21,22 Our study results may explain why Elhansy et al found considerable differences in the performance of jet nebulizers compared with VMNs.21,22 VMN and comparison jet nebulizers were tested at YP, with VMNs reported to be superior. A clinical study by the same group tested treatment effectiveness, again using the YP location for jet versus VMN. In that study (Moustafa et al), there was an insignificant trend favoring VMN. 22 We found YP to be the least favorable position for jet nebulization, giving the lowest IM, which is worsened by leaving the humidifier connected in the circuit (but not working) or by active humidification. Although YP seems ideal for VMN, it is the least effective placement of the jet nebulizer, particularly in a humidified circuit. The ideal configuration for jet nebulization is IP, continuous nebulization in an HME humidified circuit to maximize IM and minimize circuit deposition and EM. This position also avoids long-term condensation.
In summary, for current nebulizer/ventilator technology, our data support IP and continuous nebulization in an HME circuit as the optimal method for jet nebulization. This differs from VM technology where YP position appears to be superior in delivering higher IM as described by Montigaud et al 16 It also differs from the consensus statement given by Li et al in which IP position is not recommended. 3 In addition to the inefficient BA reported by Ehrmann et al, we found higher NR with BA in our experiments. 8 BA, however, was less sensitive to active humidification compared with continuous nebulization. We do not recommend active humidification with continuous nebulization and would use an HME. The effect of circuit compliance, a new finding, reveals an inverse relationship with IM, secondary to increased transfer of aerosols to the expiratory limb, leading to high EM losses.
In our experiments, we accepted the use of external wall gas to trigger the nebulizer. The only other choice to power the nebulizer would be BA, if available. It is well known that ventilators with internal flow sensors will report the extra gas as increased exhaled volume. Although this technique was often accepted by therapists years ago, modern therapists often feel uncomfortable adjusting alarms to allow a nebulizer treatment. Some authors have suggested that the tidal volume be reduced to compensate for this “extra ventilation” 26 (we do not support this recommendation), and review articles often cite the problem of overventilation without reference to any measured data.3,27 More recently, direct measurement of delivered tidal volume and airway pressure during jet nebulization with an external air source has indicated that actual effects on delivered volume and pressure are small, approximately 10% under the highest external flows, similar to those in the present article. 10
Our data are limited and may not apply to spontaneously breathing patients or other nonvolume control modes of ventilation. We studied two relatively short inspiratory times, which are commonly used in the intensive care unit. Longer inspiratory time is reported to deliver higher IM.7,8 Our work with ventilators using external flow sensors was limited to Bellavista and as such cannot be generalized to all ventilators with external flow sensors.
Conclusions
Jet nebulizers have a different aerosol footprint when compared with VMN. Factors like the position of the nebulizer in the circuit and humidification can significantly alter the inhaled mass. With jet nebulizers, for best results, we recommend IP, continuous, and HME humidified nebulization; the optimized circuit should incorporate an aerosol HME in open position, using low-compliance circuit tubing.
Footnotes
Author Disclosure Statement
Dr. Smaldone is a consultant to InspiRx and is a member of the Advisory Board. Ms. Cuccia and Dr. Chaudhary have no competing interests to declare.
Funding Information
Internal funding supported this study.
Supplemental Material
References
Supplementary Material
Please find the following supplemental material available below.
For Open Access articles published under a Creative Commons License, all supplemental material carries the same license as the article it is associated with.
For non-Open Access articles published, all supplemental material carries a non-exclusive license, and permission requests for re-use of supplemental material or any part of supplemental material shall be sent directly to the copyright owner as specified in the copyright notice associated with the article.