
Abstract
Using data from 12 public universities in North Carolina over a 4-year period, we assess how principal intern characteristics and internship experiences predict entry into the school leader labor market as an assistant principal. In line with prior research, we found that a sizable number of interns never enter school leadership. Furthermore, using accelerated failure time (AFT) survival analyses, we found that intern characteristics, preparation program type, mentor principal effectiveness, and intern school characteristics were all associated with movement into the assistant principalship. We conclude with limitations of our work and implications for practice, policy, and future research.
Keywords
Introduction
Principal preparation programs (PPPs) can play an important role in developing the skills and competencies that school leaders need to effectively lead (Anderson et al., 2018; Young & Crow, 2016). Scholarly research on the characteristics of exemplary leader preparation has found common features, including proactive recruitment; program structures that support collegial learning; curriculum focused on developing people, instruction, and the organization; meaningful, authentic, and applied learning opportunities; and expert mentoring or coaching (Darling-Hammond et al., 2007, 2022). Yet research on PPP graduate outcomes suggests wide variation in performance, even among graduates from within the same program (Grissom et al., 2019; Larsen et al., 2016). This variation in performance highlights the need to better understand how program structures and experiences influence leadership development.
Among the components of PPPs, principal internships are widely considered to be the most important, as high-quality internships have been found to be associated with a variety of school leadership outcomes, such as increased leadership knowledge, positive career intentions of becoming a principal, and working in leadership roles (Orr, 2011; Orr & Orphanos, 2011). Nonetheless, internships vary widely, including variation in the number of required hours, the mentorship and support interns receive, and the types of activities in which interns engage (Anderson & Reynolds, 2015; Campbell & Parker, 2016; Drake, 2022). For example, recent work suggests that internships vary based on the characteristics of their placement schools and mentor principals (Bastian & Drake, 2023) and that many candidates complete their principal internships at the same school in which they were previously employed (Drake & Bastian, 2024). An important—unanswered—question is how differences in internship placements and experiences affect graduates’ labor market outcomes.
In this paper we extend work on principal internships by assessing how intern characteristics and internship experiences predict entry into the school leader workforce. More specifically, using principal preparation and internship placement data for 12 public universities in North Carolina from 2015–16 through 2018–19 we address the following research questions:
(1) To what extent do characteristics of interns and internship experiences predict movement into an assistant principal position?
(2) To what extent do characteristics of interns and internship experiences predict movement into an assistant principal position in a high-need school?
We believe this study makes an important contribution to the research literature on principal preparation and has important implications for PPPs and school districts. Research studies on PPPs more generally, and the internship specifically, have been largely qualitative in nature and focused on single programs (Reyes-Guerra & Barnett, 2016). Most quantitative studies of the principal internship focus on survey data, though more recent studies have begun to employ secondary data (Rangel et al., 2024). As with our previous work (Bastian & Drake, 2023; Drake & Bastian, 2024; Drake et al., 2023), this study builds upon these quantitative analyses of the principal internship by providing statewide, longitudinal estimates of how interns’ characteristics and internship experiences shaped their labor market outcomes. By providing data on the factors that are associated with leadership placement, this study can help inform the internship placement decisions of PPPs and their district partners and the hiring decisions of districts and schools.
Literature Review
The principal labor market presents a unique challenge for school district leaders. On one hand, there have historically been far greater numbers of educators certified to be licensed administrators than there are positions requiring leadership certification (Zepeda et al., 2012). For example, in the 2022–23 school year, North Carolina had approximately 2,500 public schools and nearly 13,000 educators who held a school principal license. On the other hand, district leaders have struggled to recruit qualified leadership candidates (Lee & Mao, 2023), especially in schools serving many low-income, non-White, and low achieving students (Loeb et al., 2010; Snodgrass Rangel, 2018). Furthermore, once principals gain leadership experience, they tend to move from lower- to higher-performing school settings (Pendola, 2022). However, principals with more favorable working conditions—such as higher salary, beneficial job contracts, more influence on professional development and budgeting, and a tenure system—are less likely to move schools, especially in schools with high concentrations of students of color (Yan, 2020).
The unique nature of the principal labor market has generated interest from researchers and policymakers in better understanding the factors—including the role of PPPs—that contribute to successful leadership hiring. Researchers have suggested that preparation programs can have an important role in graduates’ career pathways. A straightforward way to examine this relationship is to explore variation in PPP graduates’ job placement rates. For example, Grissom et al. (2019) found that among PPPs in the state of Tennessee, approximately 28 to 52% of graduates were hired as an AP within 5 years of program completion. Both the minimum (28%) and maximum (52%) program employment rates significantly differed from the median program (36% hired as an AP). In a series of studies in Texas, Fuller et al. (2019; 2016) evaluated how PPP characteristics—including program type (e.g., traditional, alternative), average age, % White, % female, total graduates, and Carnegie classification—influenced leadership position. Among these program characteristics, they found that program size was negatively associated with employment as an AP 5 years after certification and that graduating from a Research I and II Doctoral institution was positively associated with AP employment.
In contrast to the Texas study, which found no difference in employment outcomes between graduates from traditional versus alternative PPPs, Corcoran et al. (2012) found that graduates from a district-based alternative certification program in New York City spent far less time employed as an AP before becoming a principal. Furthermore, these graduates were principals in higher poverty, higher minority, and lower achieving school settings compared with principals from traditional programs. Similarly, in an evaluation of New Leader’s alternative certification program, Doss et al. (2022) found that preservice competencies—in particular, those of Cultural Leadership and Adult and Team Leadership—positively predicted initial placement as an AP or principal.
In recent studies, researchers have focused on examining variation in candidates’ scores on the leadership assessments required for licensure. Among Tennessee graduates, Grissom et al. (2017) found that performance on the School Leaders Licensure Assessment (SLLA) was positively associated with becoming a school administrator in the year after program completion. A follow-up study found that SLLA scores varied significantly by PPP, though it is unclear if this variation was related to selection into programs or preparation experiences (Grissom et al., 2019). More recently, states have begun to employ performance assessments to evaluate candidate readiness (Orr & Hollingworth, 2018). Orr and Hollingworth (2023) found that students who completed Massachusetts’ Performance Assessment for Leaders (PAL) advanced into leadership positions at a faster rate than non-PAL completers and that the implementation of PAL cut scores increased the rate of initial leadership placement as an AP.
Taken together, the findings from these studies suggests that PPPs can exercise an important influence over leaders’ initial employment. Of course, it may be that some of these differences in leadership placement are not only driven by differences in PPP quality, but also by differences in other characteristics of principal candidates. For example, in studies on the pathways into leadership, researchers have focused on a number of personal characteristics associated with initial leadership placement. Women—especially women of color—have been found to transition from certificate holder to school administrator at lower rates than men (Davis et al., 2017), a finding that may be attributable to their lower application rates to leadership positions (Browne-Ferrigno, 2003; Yang et al., 2021) or systematic delays based on race and gender (Bailes & Guthery, 2020). Similarly, Fuller et al. (2019; 2016) found that within 5 years of certification in Texas, men, Latinos, and middle-aged graduates had greater odds of employment as a school leader than women, Whites, and younger and older graduates, respectively. Other findings indicate that geography has played an important role in predicting initial leadership placement, with licensed administrators generally working in leadership roles in districts within close proximity of their preparation program (Bathon & Black, 2011) and in similar schools to the ones they worked in during their preparation (Grissom et al., 2019).
In summary, PPP type (e.g., traditional, alternative), university Carnegie classification, graduation rate, preservice competencies, PPP student demographics (e.g., race/ethnicity, gender), and geography may influence initial leadership placement. Alongside these findings, the field needs a better understanding of how principal internships influence initial leadership placement. This is a significant omission, as research findings show that across the elements of high-quality preparation, strong clinical experiences—especially full-time principal internships—stand out as among the most important because they provide aspiring school leaders with opportunities to translate the theoretical into practical (Havard et al., 2010; Reyes-Guerra & Barnett, 2016). In particular, internships help future school leaders develop concrete leadership skills through hands-on experiences across multiple domains, including instructional leadership, organizational management, student affairs, external relations, and administration (Drake, 2022). Internships also serve as an important learning opportunity for aspiring school leaders as they receive guidance from principal mentors, university supervisors, and/or coaches (Clayton & Myran, 2013; Thessin et al., 2020).
In our previous research, we explored the geography of principal internships and the characteristics of principal interns, their mentor principals, and internship schools in North Carolina (Bastian & Drake, 2023; Drake & Bastian, 2024). Through this research, we found that many candidates complete their principal internships at the same school in which they were previously employed, a finding that may be a cause for concern as the National Educational Leadership Preparation (NELP) program standards highlight the value of conducting internships in new school settings due to the leadership skills and competencies that can be cultivated there (NPBEA, 2018). We also found differences in the characteristics of internship schools and mentor principals based on the race/ethnicity of the intern. For example, we found that, on average, interns of color were placed in schools with lower ratings of leadership and school climate, lower teacher retention rates, and lower test proficiency relative to their White peers. These findings held when comparing within the same PPP. Interns of color were also placed with mentor principals who were more likely to be leaders of color and less likely to have led a school in the prior year that exceeded expected achievement growth. Furthermore, we found that interns enrolled in a competitive scholarship loan program were significantly less likely to complete their internship at the same school in which they were previously employed. This finding suggests that program structure and requirements are consequential for internship experiences.
Despite this prior work, research on how internship experiences predict entry into the school leader workforce is very thin. In fact, we found only one study that links characteristics of the internship (i.e., internship quality) to placement as a school or district leader. Specifically, Orr (2011) surveyed graduates from 13 PPPs and found that internship quality, as rated by interns, did not correlate with graduates’ current position as a school or district leader. We address this gap in the literature by evaluating the extent to which intern characteristics and internship experiences predict entry into the school leader workforce. We focus specifically on interns’ placement as APs for a few important reasons. First, nearly all principal candidates become APs before assuming the role of principal, often spending a number of years in the role before transitioning to the principalship (Bastian & Henry, 2015; Oleszewski et al., 2012). As such, these positions are closest to the preservice training and internship experience and therefore most likely to show a relationship. Second, while experience as an AP benefits future principal performance (Bastian & Henry, 2015), research on APs is lacking, especially with respect to the distribution and allocation of APs within and between districts (Goldring & Rubin, 2021).
Internships in North Carolina
Clinical practice and internship requirements for licensure vary widely between states (Anderson & Reynolds, 2015). North Carolina state law requires that all candidates enrolled in a PPP complete an internship that is at least 500 hr (NC Gen. Stat. §115C-284.1). However, programs can choose whether these internships are carried out in the same school in which the principal candidate works or whether the candidate is required to intern at a new school site. Additionally, there are no state requirements regarding the characteristics of placement schools or mentor principals. As a result, programs may vary regarding the extent to which they prioritize placements in certain types of schools (e.g., schools with more marginalized students) or with certain mentor principals (e.g., principals earning higher performance ratings). Furthermore, programs may enroll students in a traditional Masters of School Administration (MSA) program or an add-on licensure program. The state also has a competitive scholarship loan forgiveness program—the North Carolina Principal Fellows program—which provides state funding to participating PPPs for financial stipends and enrichment opportunities for Fellows.
Methods
Data Sources
To assess how characteristics of interns and internship experiences predict movement into an AP position, we leverage data from the following sources: (a) principal preparation and internship placement data from 12 public universities in North Carolina 1 and (b) K-12 administrative records from the North Carolina Department of Public Instruction (NCDPI). Overall, these preparation and K-12 administrative records allow us to identify principal interns and their employment history before and after their internship and to link interns to characteristics of their internship schools and mentor principals.
Our preparation and internship placement data include 1,131 individuals serving as a principal intern in the 2015–16, 2016–17, 2017–18, or 2018–19 school years and contain fields for intern demographics, program type, the year and term(s) of the internship, and the district and school in which the internship occurred. Principal candidates in our analysis sample remained in a single, primary placement for their internship. Programs often supplemented these internship placements with site visits and practicum-based experiences in other schools. These additional preparation experiences are unobserved in our study.
Our K-12 administrative data are from the 2013–14 through 2022–23 academic years and include information on all school personnel and public schools across North Carolina. Personnel level data from NCDPI include fields for employment, credentials, and measures of job performance. In particular, employment data identify the districts and schools in which individuals work and the roles (e.g., teacher, AP) in which they work. Credential data identify teacher and principal experience, educators’ licensure areas and exam scores, and whether educators are Nationally Board Certified (NBC) or have a graduate degree. Measures of job performance include teacher and school administrator evaluation ratings from the North Carolina Educator Evaluation System (NCEES). With NCEES, teachers are rated on up to five standards annually; school administrators are rated on seven standards each year. For each standard, educators receive ratings of either not demonstrated (a), developing (b), proficient (c), accomplished (d), or distinguished (e). 2 Finally, school level data from NCDPI include information on school grade configuration, urbanicity, the percentage of low-income students and students of color enrolled, responses to North Carolina’s Teacher Working Conditions (TWC) survey, test proficiency rates, and whether the school did not meet, met, or exceeded expected achievement growth in a given year.
Data Measures
For this study, we created measures that captured whether a principal intern becomes an AP in North Carolina public schools (NCPS) 3 and the number of years between the end of the internship and becoming an AP. Specifically, we used employment records from NCDPI to identify the first year, post-internship, that an individual holds an AP position. 4 For example, if an individual completed their principal internship in 2016–17 and becomes an AP in 2017–18, then we code them as a “1” for becoming an AP and that it took 1 year for them to become an AP. We can observe this movement into an AP position for up to 7 years for our initial internship cohort (interns in 2015–16) and for 4 years for our last internship cohort (interns in 2018–19). Contingent on becoming an AP, we also identified whether an intern’s initial AP position is in a high-need school. We focused on high-need schools given the volatility of the principal labor market in these settings (Pendola, 2022; Perrone, 2022). We defined high-need schools in two ways: (a) whether the school was in the top quartile (statewide) for the percentage of low-income students enrolled and (b) whether the school was designated as low-performing by North Carolina’s school accountability system. 5 The top panel of Table 1 shows that during our study period 59.7% of interns progressed into an AP position. Conditional upon becoming an AP, 28.3 and 25.2% of interns had an initial AP position in a low-income or low-performing school, respectively.
Descriptive Statistics for our Outcome and Focal Measures.
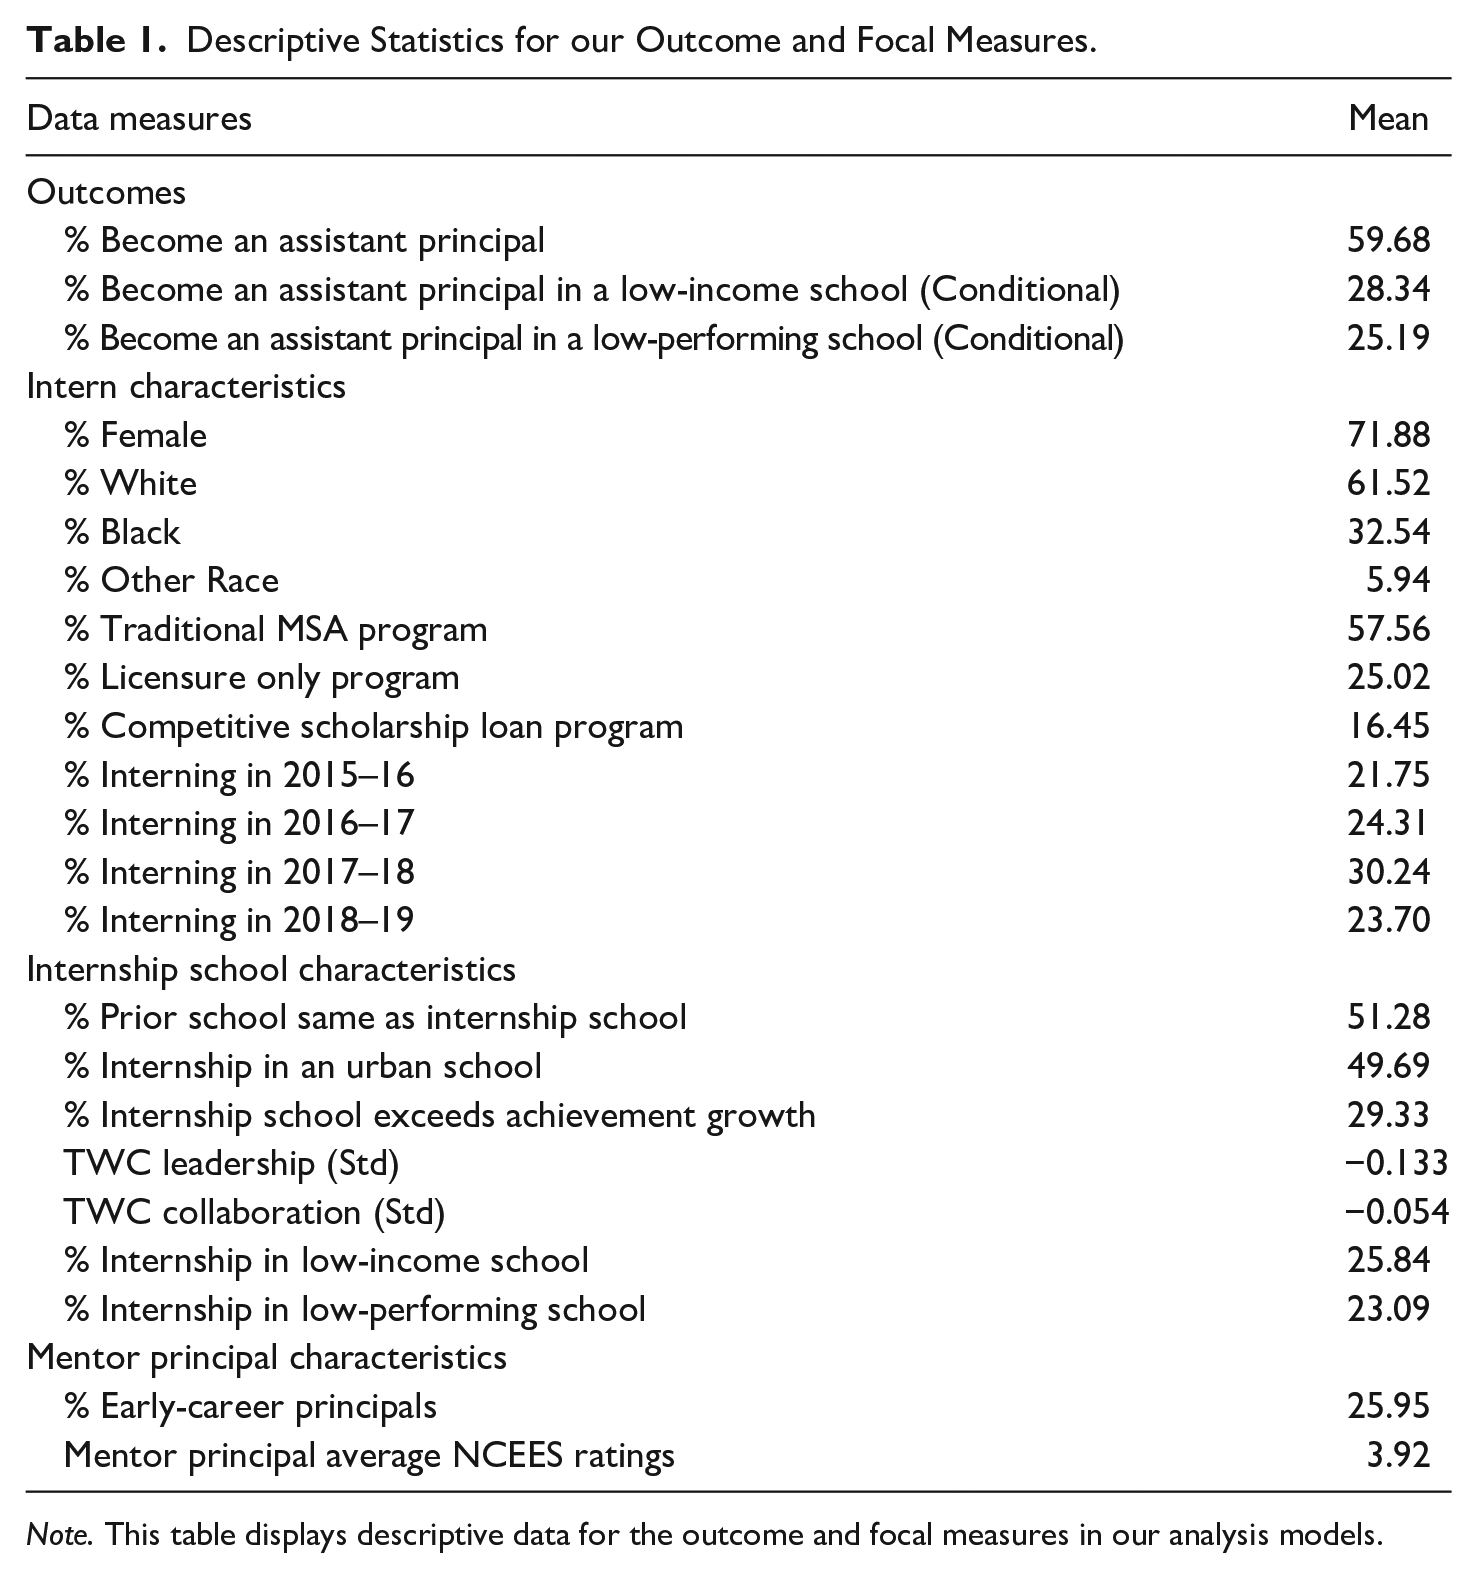
Note. This table displays descriptive data for the outcome and focal measures in our analysis models.
We are interested in the extent to which characteristics of interns, internship schools, and mentor principals predicted movement into an AP position. In our models the focal intern characteristics are gender, race/ethnicity, and program type—that is, traditional MSA, competitive scholarship loan, or licensure only program. We focused on these characteristics given prior work showing that women and leaders of color are less likely to move into school administrator positions (Davis et al., 2017; Fuller et al., 2019). Furthermore, as reviewed above, prior work indicates that program structure and requirements impact internship placements (Drake & Bastian, 2024) and may influence progression into leadership roles (Doss et al., 2022; Grissom et al., 2019). In particular, interns in competitive scholarship loan programs may be especially likely to move into school administrator positions given perceptions of program quality and the emphasis on closer relationships between these programs and their partner districts. The second panel of Table 1 shows that nearly 72% of the interns in our analysis sample were women, 61% were White, and 33% were Black. Almost 60% were in a traditional MSA program, while 25% completed a licensure only program and 16% completed a competitive scholarship loan program.
Beyond intern characteristics, our models include measures for characteristics of internship schools and mentor principals. Our focal internship school characteristics are an indicator for interns completing their internship in the same school in which they were previously employed, an indicator for an internship placement in an urban school, 6 an indicator for whether the internship school exceeded expected achievement growth, and two standardized measures from the North Carolina TWC survey focused on perceptions of school leadership and educator collaboration at the internship school. 7 We hypothesize that those completing their internship in the same school in which they were previously employed may not experience the same rigorous and authentic leadership opportunities as peers completing their internship in a different school. As such, these interns may be less competitive for open AP positions. We control for the urbanicity of the internship site to adjust for characteristics of the administrator labor market that may influence entry into an AP role—that is, there may be greater demand (and greater supply) for new APs in urban areas. Our focus on achievement growth and working conditions at the internship school is motivated by prior research showing the value of student teaching in a high-quality learning environment (Bastian et al., 2022; Bastian et al., 2023; Ronfeldt, 2015).
In models assessing movement into an AP position in a high-need school, we also controlled for whether the intern completed their internship in a low-income school or in a low-performing school. With these measures we assessed whether interning in a high-need environment influences becoming an AP in a similar environment. The third panel of Table 1 shows that more than 50% of interns completed their internship in their prior employment school, 50% interned in an urban school, nearly 30% interned in a school exceeding expected achievement growth, and, on average, that internships were in schools with standardized working conditions values (leadership and collaboration) slightly below the statewide mean. Approximately 25% of interns completed an internship in a low-income or low-performing school.
Finally, our focal mentor principal characteristics were an indicator for being an early-career principal—less than 3 years of principal experience—and mentor principals’ average NCEES ratings. 8 We focused on mentor principal experience given that early-career principals may be less well prepared to support interns’ readiness for a school administrator position. Our motivation to include mentor principals’ average NCEES ratings comes from findings that early-career teachers are more effective if they student taught with a highly-rated cooperating teacher (Bastian et al., 2022; Ronfeldt et al., 2018). Interning with a highly-rated mentor principal may also benefit the workforce outcomes of principal candidates. The bottom panel of Table 1 shows that 26% of interns had an early-career mentor principal. On average, interns’ mentor principals had NCEES ratings of 3.92 (on a 1–5 scale).
Analysis Plan
To assess how intern, internship school, and mentor principal characteristics predict movement into an AP position (overall and in a high-need school), we estimate a series of accelerated failure time (AFT) survival analyses (Khanal et al., 2014; Saikia & Barman, 2017). We prefer a survival analysis approach, relative to linear or logit regression models, because we are interested in both whether an event occurs and the time to that event. Furthermore, we prefer a survival analysis approach given that our outcome measures are censored—we do not know whether an intern will move into an AP position after the end of our study period—and because, post-internship, we can track the employment outcomes of each internship cohort for a different number of years.
We began by testing whether a Cox Proportional Hazard model, the most common survival analysis approach, was well-suited for our data. These analyses revealed that several focal covariates violated the proportional hazard assumption. Coefficients for these measures were invalid. As such, we explored other survival/time-to-event models and selected the AFT approach. 9 The AFT models the log of survival time (time-to-event) with an error term that follows a specified distribution. We evaluated four commonly used distributions for the survival time—exponential, log-logistic, Weibull, and log-normal—and selected the log-normal distribution because it had the lowest AIC and BIC values 10 when fit to our data and because the shape of the log-normal distribution most accurately depicts the survival time in our data. 11
For each of our research questions, we estimate two variations of a log-normal AFT model. In particular, we estimate one AFT model with all focal covariates and a second AFT model with all focal covariates stratified by PPP. Stratified AFT models use the stratifying variable as a covariate and generate separate estimates of the shape of the survival distribution for each stratum (i.e., PPP). In practice, stratifying our AFT models by PPP allows us to assess how variation in the characteristics of interns and internship placements, within programs, is related to variation in the timing of becoming an AP. We prefer estimates from these stratified AFT models because they adjust for differences across programs and help us better isolate the associations between intern and internship characteristics and becoming an AP.

Equation (1) displays our AFT model. Here, for our preferred model stratified by PPP (
Estimates from our AFT models capture the association between intern, internship school, and mentor principal characteristics and the time to becoming an AP—that is, whether certain characteristics speed up or slow down the transition into school leadership. For ease of interpretation, we exponentiate all AFT coefficients to represent them as time ratios, with the effect of a covariate’s respective time ratio being multiplicative on the time to event. Time ratios above “1” indicate that the covariate slowed the transition into an AP position; time ratios below “1” indicate that the covariate sped up the transition into an AP role. For example, if the time ratio was 1.5 for Black interns that would suggest that it took Black interns 50% longer than White interns (reference group) to move into an AP position. Conversely, if the time ratio was 0.75 for Black interns, that would suggest they became APs 25% faster than White interns. In the Results section we present time ratios and standard errors from our basic and stratified (by preparation program) AFT models. In addition, we graph cumulative failure curves—that is, the probability that an individual becomes an AP up to time t—for select intern, internship school, and mentor principal covariates.
Results
To What Extent Do Characteristics of Interns and Internship Experiences Predict Movement Into an Assistant Principal Position?
To begin our analyses, we depict movement into an AP position with a Kaplan-Meier curve. For each year after the principal internship, Figure 1 shows the cumulative probability—adjusting for intern, internship school, and mentor principal characteristics—of becoming an AP in NCPS. There are two key takeaways from these data: (a) The largest movement of interns into an AP position occurs in the first year after the internship. In each successive year, there are a smaller—and marginally diminishing—number of movements into an AP position. (b) 7 years after the internship, it is predicted that approximately 63% of interns will have moved into an AP role in NCPS. This suggests that a sizable percentage of principal interns may never serve in a school leadership position. 12
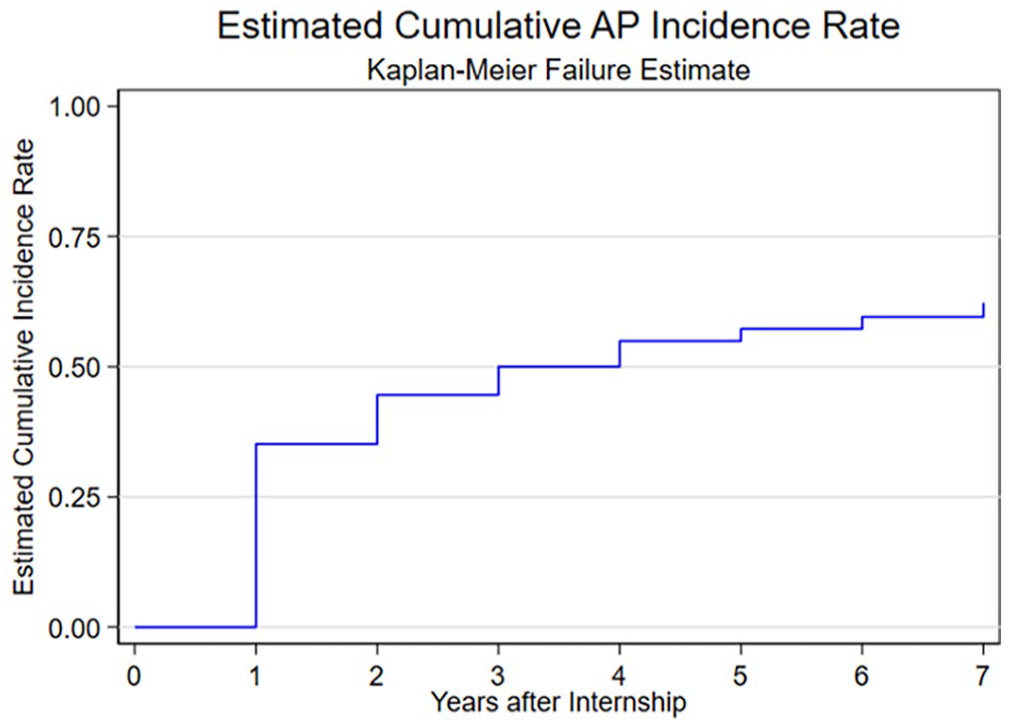
Kaplan-Meier failure curve—Becoming an assistant principal in NC public schools.
Turning to our first research question, Table 2 presents time ratio estimates from models predicting becoming an AP in NCPS. 13 Results in column 1 are from an AFT model without stratification; results in column 2 are from our preferred approach that stratifies by PPP. Regarding intern characteristics, we found large differences by sex. In particular, we found that it takes female interns nearly 50% longer than male interns to move into an AP position. There are no statistically significant differences by race/ethnicity—Black interns and other interns of color move into an AP position as quickly as their White peers. 14 Estimates for program type show that interns from a competitive scholarship loan program move into an AP position at a much faster rate (50% faster) than peers from a traditional MSA program (reference group). Conversely, it takes interns in a licensure only preparation program 26% longer than those in a traditional MSA program to become an AP. While these results may be due to differences in program quality, it is also possible that these estimates reflect differences in the types of candidates selecting into programs.
Results from Lognormal Accelerated Failure Time Regressions Predicting Becoming an Assistant Principal.
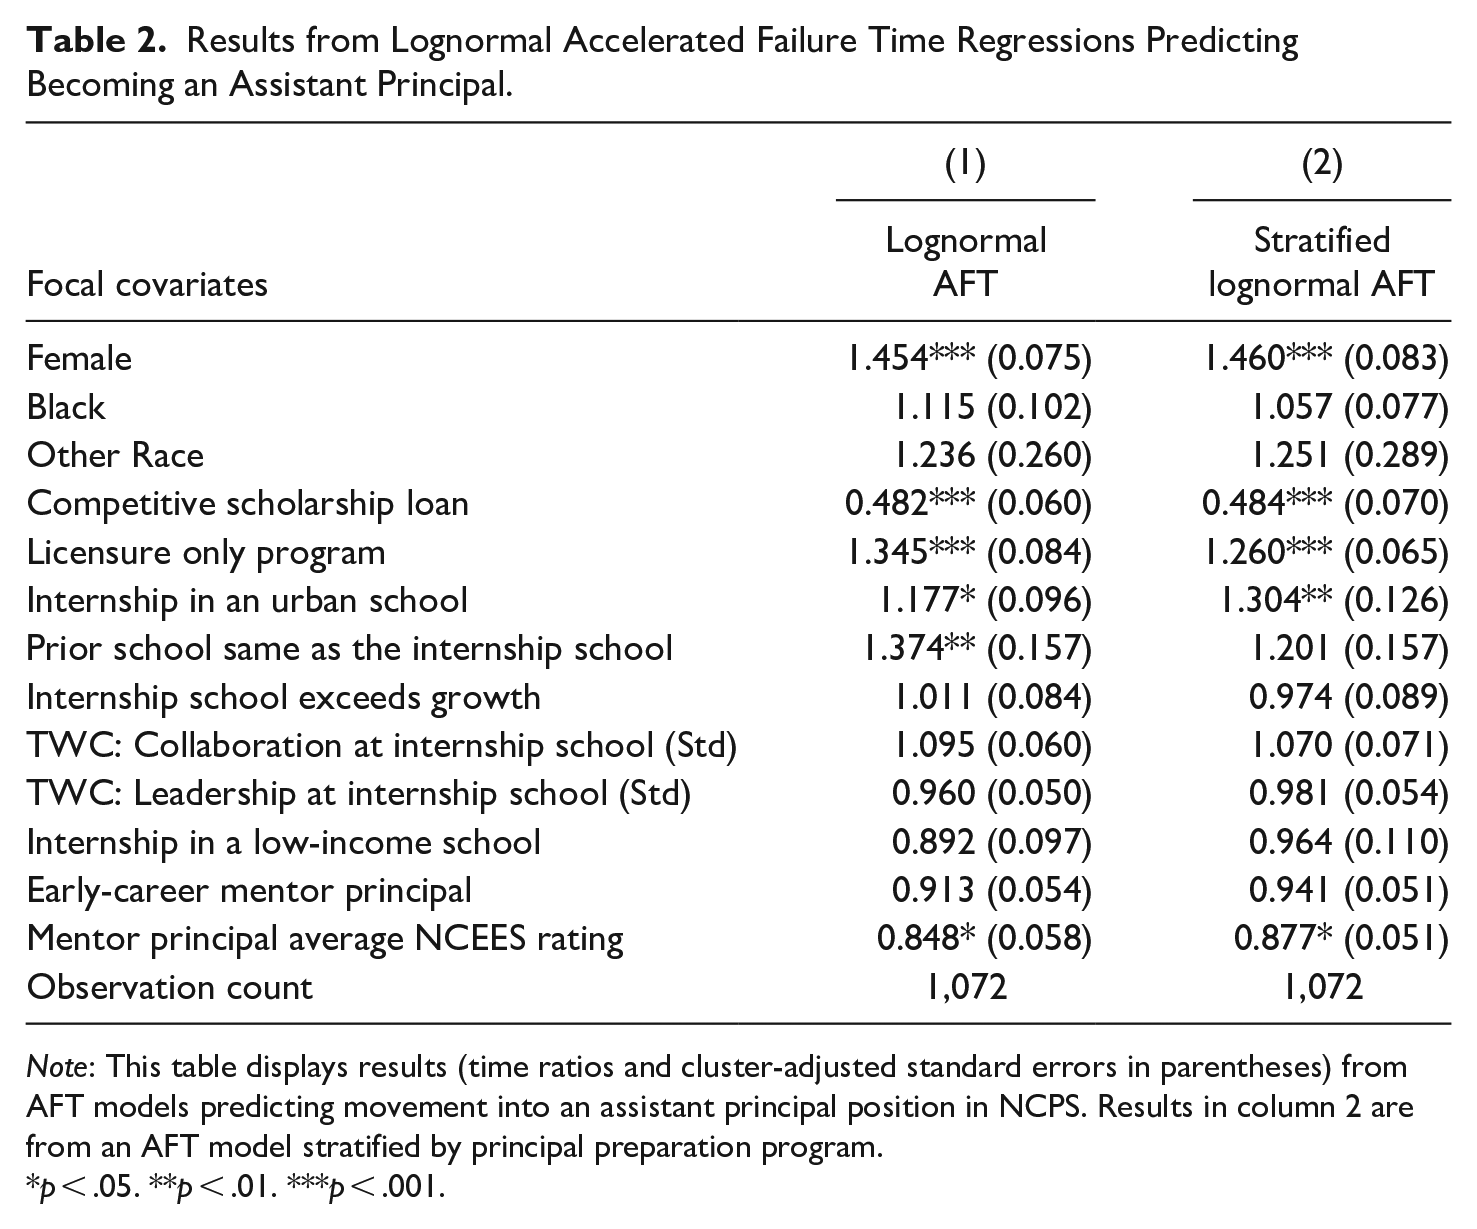
Note: This table displays results (time ratios and cluster-adjusted standard errors in parentheses) from AFT models predicting movement into an assistant principal position in NCPS. Results in column 2 are from an AFT model stratified by principal preparation program.
p < .05. **p < .01. ***p < .001.
The remainder of Table 2 presents estimates for our internship school and mentor principal characteristics. We found that those who interned in an urban school move into an AP role at a slower rate. Specifically, interns from an urban school take 30% longer to transition into an AP position than peers who interned in a rural school. This result may reflect differences in AP job openings and the number of applicants in rural versus urban locations. Those who interned in the school in which they were previously employed take 37% longer to become an AP. This may align with concerns that interning in the prior employment school impacts opportunities for authentic leadership experiences and readiness for an administrator position. However, this estimate is reduced in magnitude and no longer statistically significant in AFT models stratified by program.
Highlighting the role of the mentor principal, we found that interns placed with a more highly-rated mentor move into an AP position at a faster rate. In particular, a one-point increase in the mentor principal’s average evaluation ratings predicts interns becoming an AP 12% faster.
This result could indicate that effective mentors help interns get administrator positions more quickly—either through greater learning during the internship and/or through connections that more effective principals may help interns make. It is important to note, however, that this result may also be due to higher-quality interns being more likely to have a highly-rated mentor. None of the remaining internship school and mentor principal characteristics significantly predict movement into an AP role.
As an extension of these analyses, Figure 2 displays cumulative failure curves—that is, the probability that an individual becomes an AP up to time t—for select focal covariates. These cumulative failure curves come from our stratified AFT model and are an opportunity to further understand differences in the movement into an AP position based on characteristics of interns and internship experiences. 15 The top left panel of Figure 2 presents differences by intern gender. Here, we found that 2 years after the internship approximately 40% of male interns versus 25% of female interns are predicted to have become an AP in NCPS. Data by program type (top right panel of Figure 2) show that 2 years post-internship approximately 55% of competitive scholarship loan interns have moved into an AP position. Conversely, only 27% of traditional MSA interns and 20% of licensure only interns are predicted to have become an AP. Data by internship locale (bottom left panel of Figure 2) indicate that 2 years after the internship approximately 35% of those interning in a rural school versus 25% of those interning in an urban school have moved into an AP role. Lastly, 2 years post-internship, there is a 10 percentage point difference in the probability of having moved into an assistant principalship for interns mentored by a principal rated at proficient (level three) versus interns mentored by a principal rated at distinguished (level five).
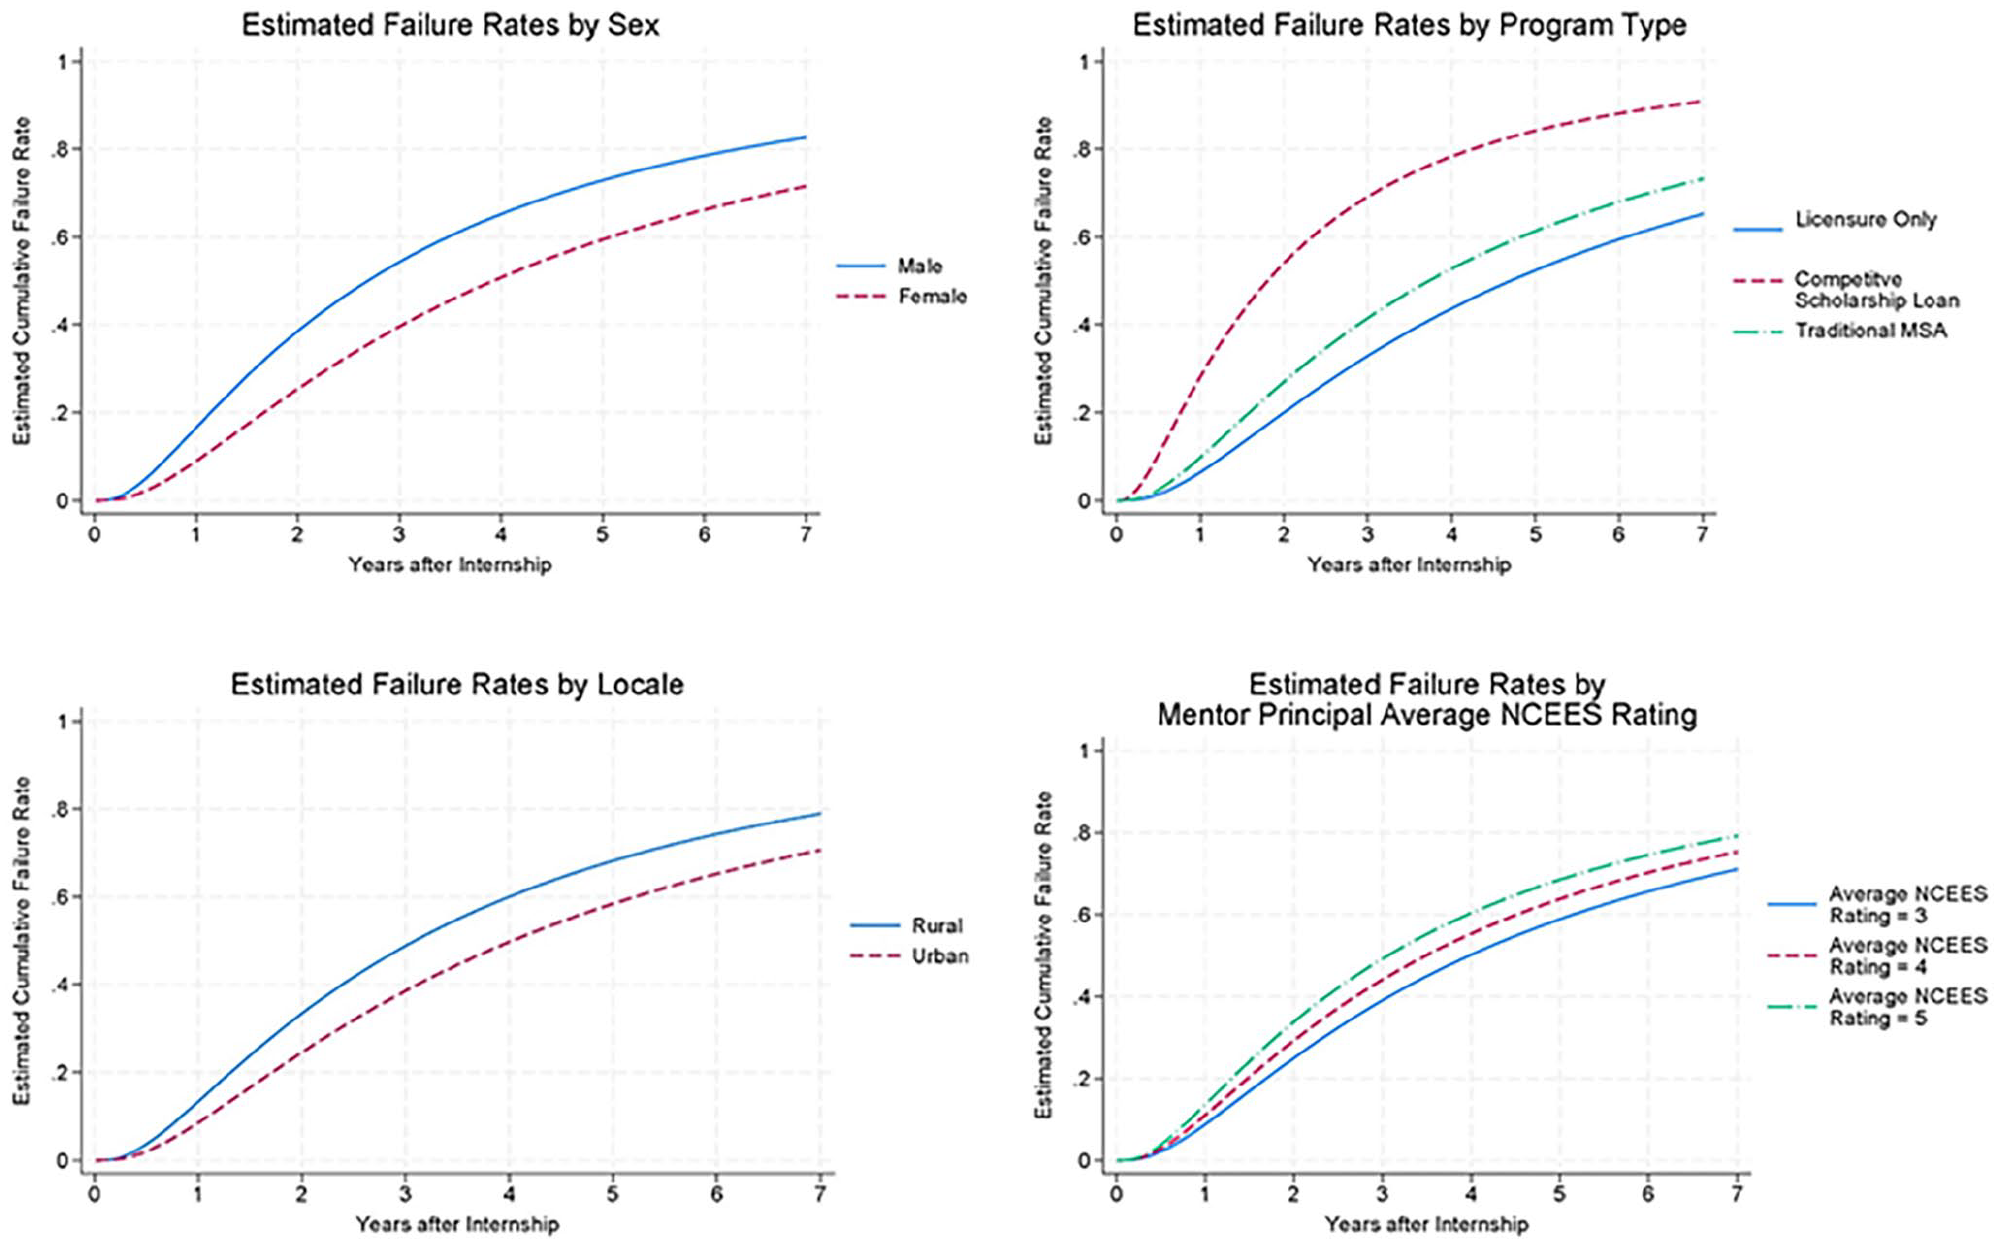
Cumulative failure curves for select intern, internship school, and mentor principal characteristics.
To What Extent Do Characteristics of Interns and Internship Experiences Predict Movement into an Assistant Principal Position in a High-Need School?
Table 3 presents time ratio estimates from models predicting whether an intern’s initial AP position was in a high-need school. These models are conditional upon ever becoming an AP in NCPS during our study period and are an important extension of our main analyses, especially given the need for stable and high-quality leadership in high-need schools. Similar to the results from our first research question, Table 3 shows that female interns (in models stratified by preparation program) move into an AP position in a high-need school more slowly than their male peers—that is, taking 30% longer to move into an AP role in a low-income school and 20% longer to move into an AP role in low-performing school. Likewise, interns completing a competitive scholarship loan program move into an AP position in a high-need school approximately 40% faster than peers completing a traditional MSA program. Relative to peers who interned in a rural area, those who interned in an urban school take significantly longer—approximately 40% to 55% longer—to move into an assistant principalship in a low-income or low-performing school. This result may reflect the lower incidence of low-income and low-performing schools in North Carolina’s urban areas.
Results from Lognormal Accelerated Failure Time Regressions Predicting Becoming an Assistant Principal in a High-Need School.
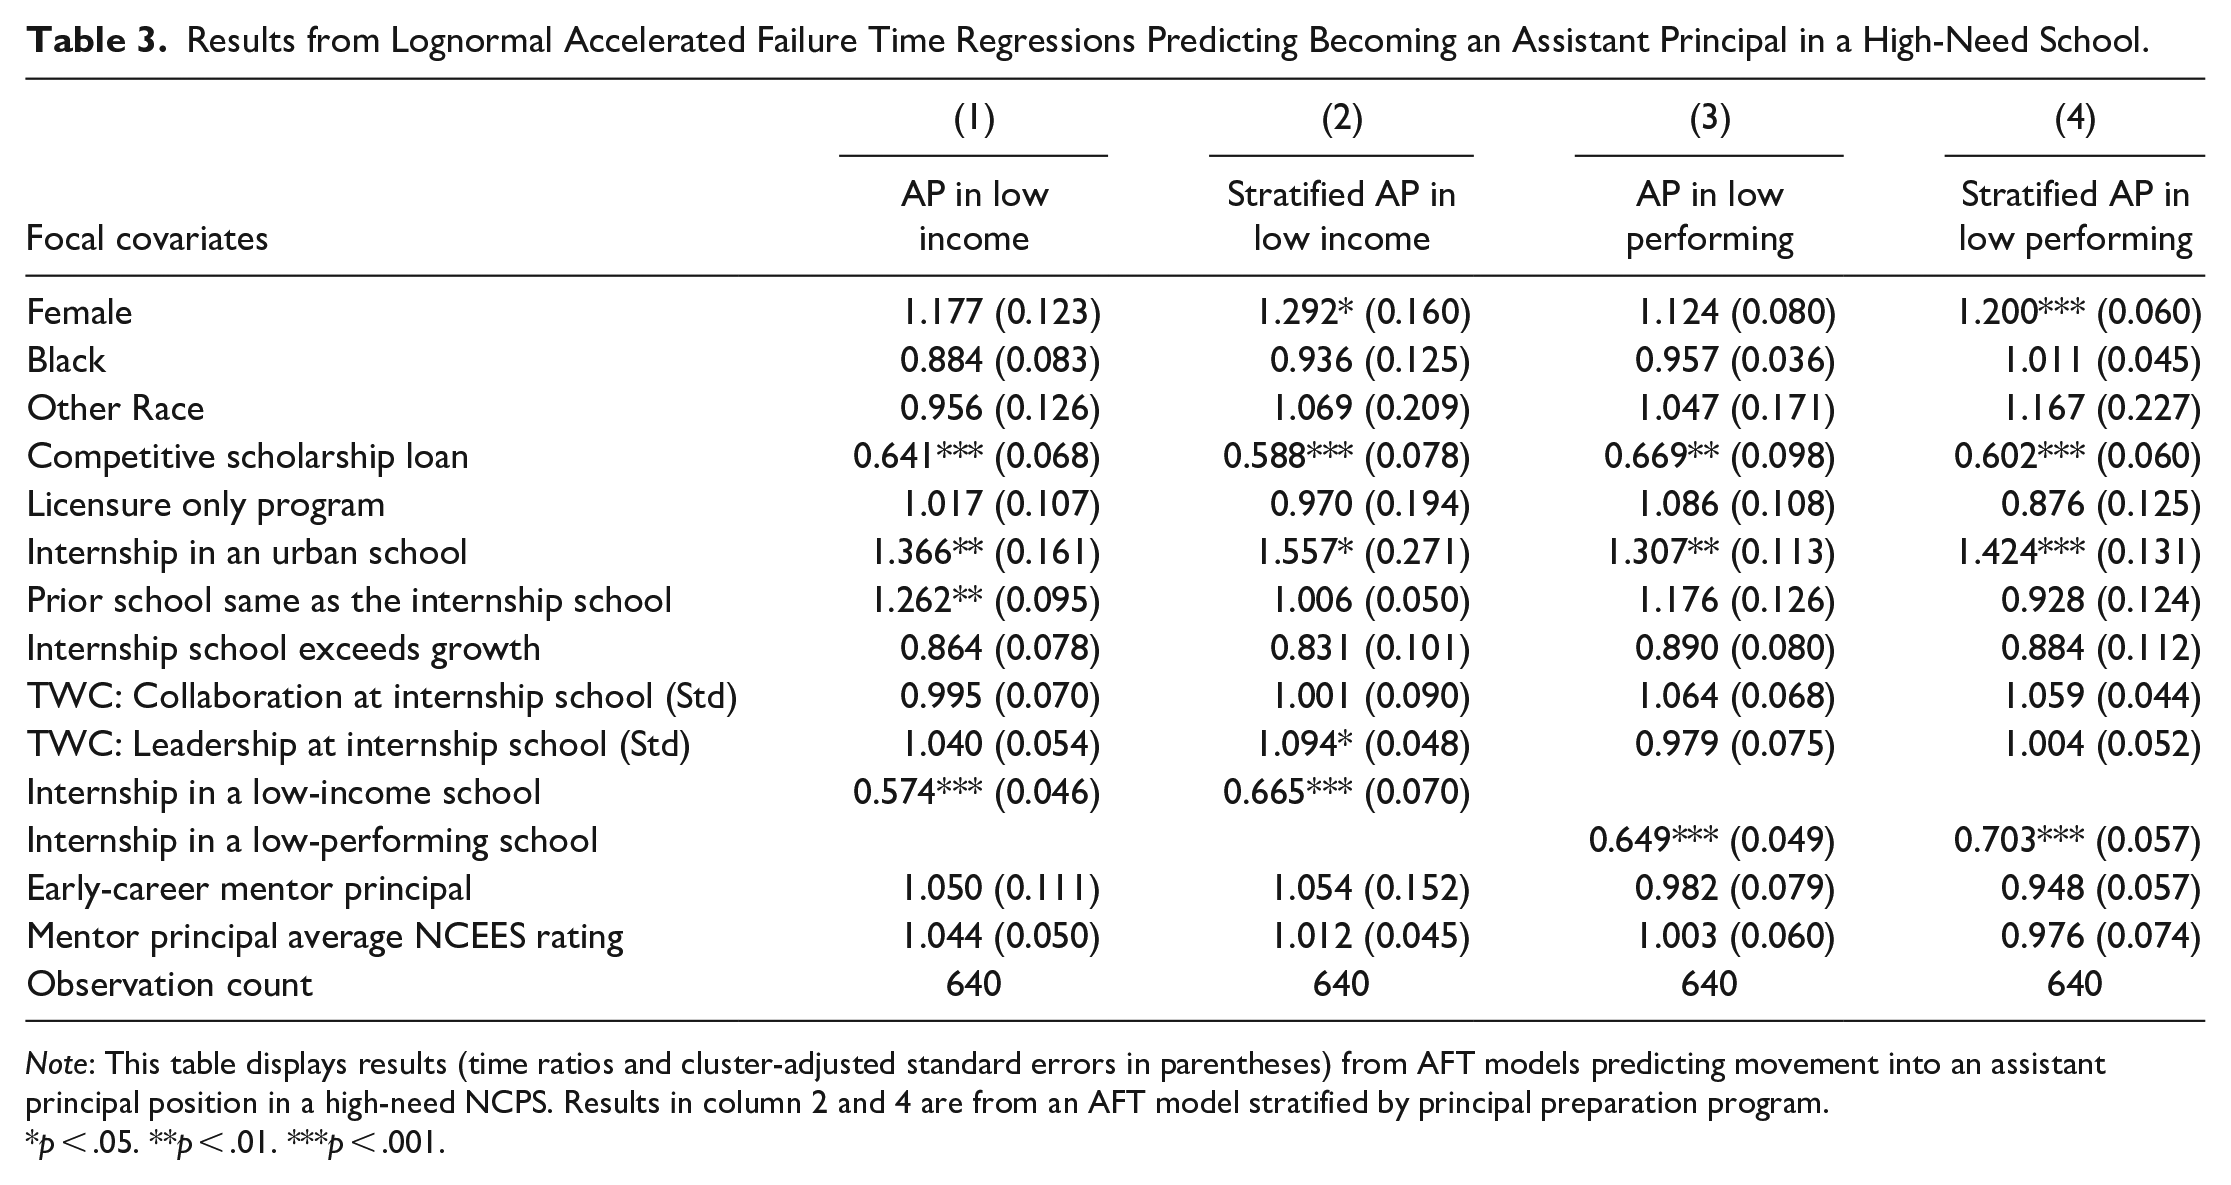
Note: This table displays results (time ratios and cluster-adjusted standard errors in parentheses) from AFT models predicting movement into an assistant principal position in a high-need NCPS. Results in column 2 and 4 are from an AFT model stratified by principal preparation program.
p < .05. **p < .01. ***p < .001.
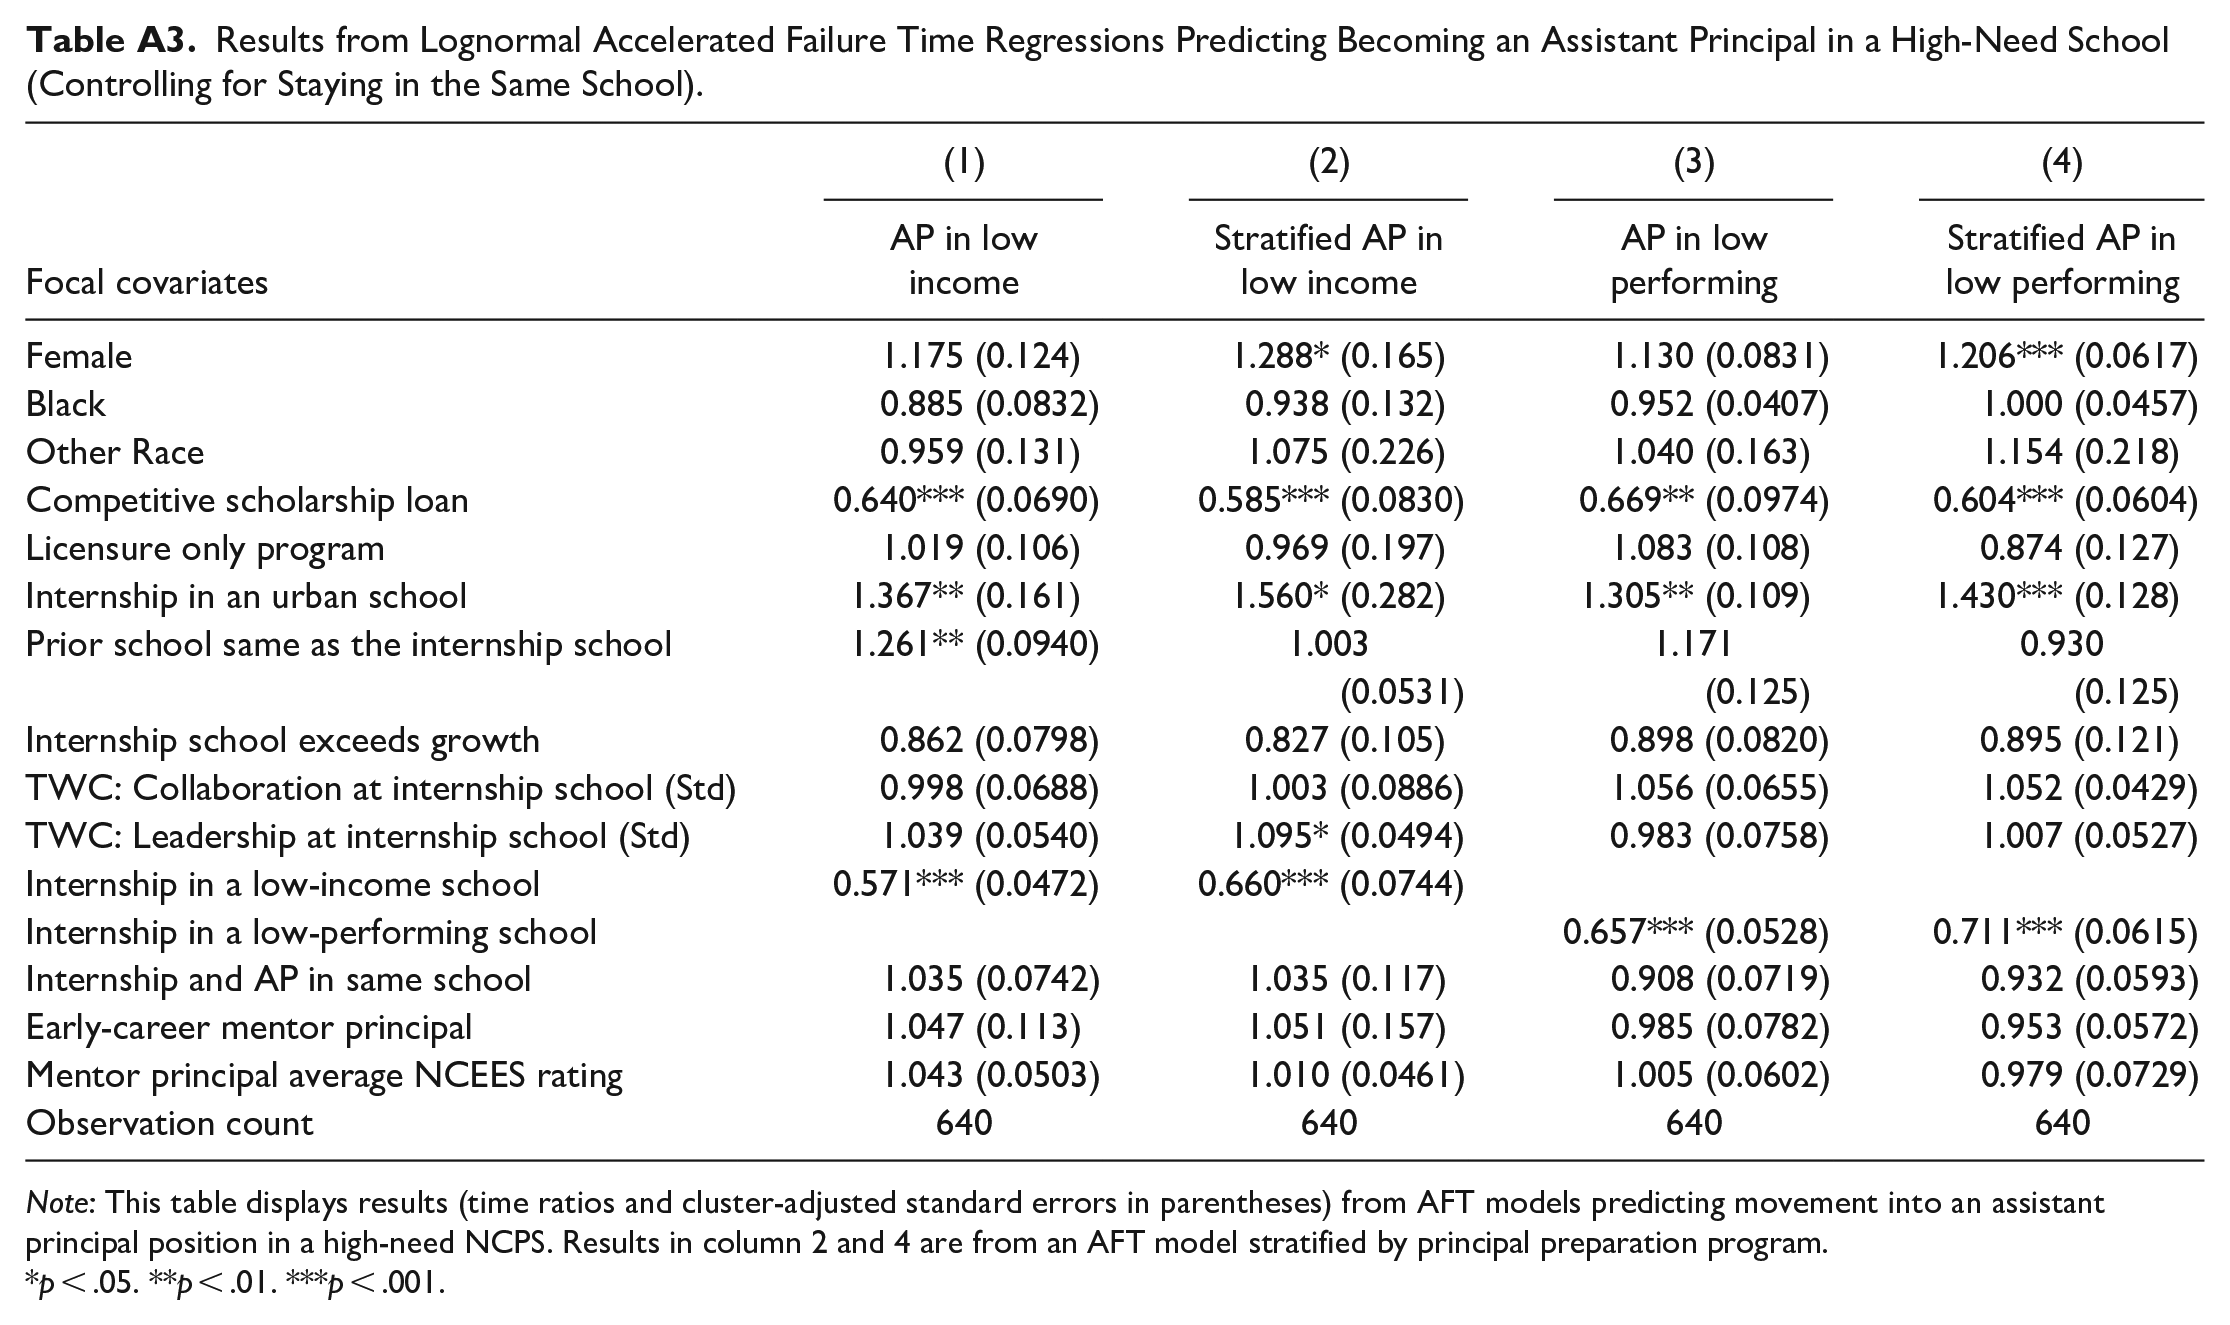
The biggest takeaway from Table 3 is that interning in a low-income or low-performing school strongly predicts becoming an AP in a similar environment. For example: (a) those who interned in a low-income school move into an assistant principalship in a low-income school 33% faster than peers who interned elsewhere and (b) those who interned in a low-performing school move into an assistant principalship in a low-performing school 30% faster than peers who interned elsewhere. These estimates may be the result of either interning in a high-need school and then becoming an AP in a different high-need school or becoming an AP in the same high-need school as the internship. To evaluate these possibilities, we estimated additional AFT models that control for whether the internship and assistant principalship school are the same. Results from these models (shown in Table A3) indicate that staying in the same school does not account for the time ratio estimates in Table 3. That is, even after controlling for staying in the same school, those who interned in a low-income school move into an assistant principalship in a low-income school 33% faster. Those who interned in a low-performing school move into an assistant principalship in a low-performing school 29% faster.
To visualize these differences, Figure 3 displays cumulative failure curves—conditional upon becoming an AP in NCPS—for interning in a low-income or low-performing school. We found that 2 years post-internship approximately 40% of those who interned in a low-income school are predicted to be an AP in a low-income school. By comparison, the value is less than 20% for those who did not intern in a low-income school. Likewise, the bottom panel of Figure 3 shows sizable differences for those who interned in a low-performing school. In particular, 2-years post-internship nearly 35% of those who interned in a low-performing school are predicted to be an AP in a low-performing school. The corresponding value is less than 20% for those who did not intern in a low-performing school.
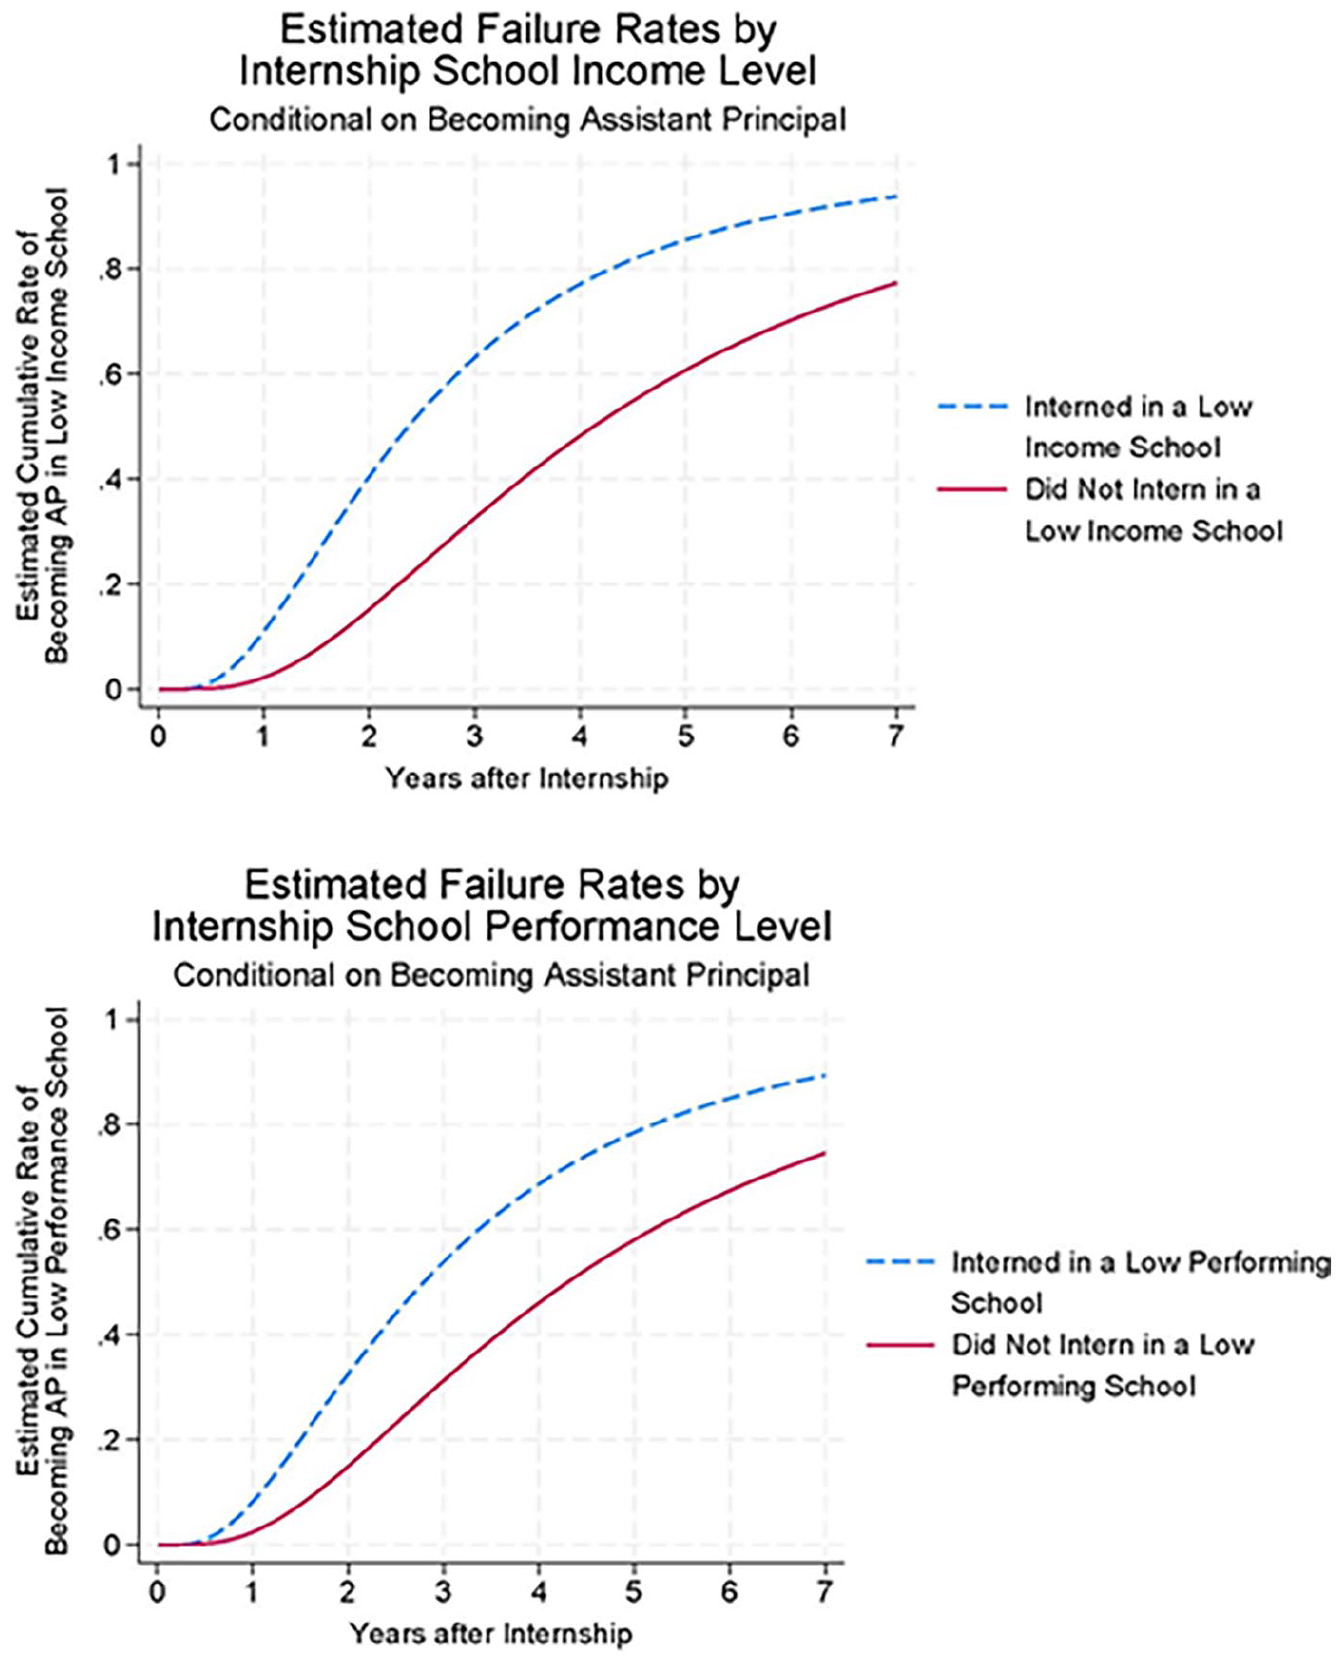
Cumulative failure curves for interning in a low-income school and low-performing school.
Discussion
In this study we extended prior work on pathways into leadership and explicitly focused on how PPPs and principal internships influenced transitions into AP positions. Similar to other studies, we found that a sizeable number of interns never enter school leadership. For example, DeAngelis and O’Connor (2012) found that 50% of their survey respondents had not assumed a leadership position 6 years after certification. Similarly, Fuller et al. (2016) found that about 50% of graduates obtained a leadership position within 5 years and about 70% did over 10 years. In our study, we examined the timing of these transitions and found that over half of those who will become school leaders do so within the first year after their internship, with marginally diminishing increases up to 7 years after. A meaningful percentage of interns in our analysis sample—approximately 35%—may never serve in a school leadership position.
Other studies of leadership employment have examined the characteristics of PPP graduates, finding that gender and race/ethnicity play a significant role in influencing leadership pathways (Bailes & Guthery, 2020; Davis et al., 2017; Fuller et al., 2019). Similar to these studies, we found significant differences in AP entry for male versus female interns, with it taking female interns nearly 50% longer to move into an AP position. Whether this difference is a result of systemic bias against women, a lower probability that women apply for leadership positions, or some combination of both is unobserved in our study. Though limited, research on leadership application data comparing women and men found mixed results. For example, DeAngelis and O’Connor (2012) found no significant difference in application rates for leadership positions between men and women in Illinois. Conversely, Yang et al. (2021) found that women were less likely to apply to leadership positions in rural settings in Wisconsin. In a unique study analyzing language from leadership applications, Finch et al. (2019) found that women and men differed significantly in the language patterns they used on applications. More generally, while the proportion of female leaders has grown substantially over the last few decades, their representation is still disproportionate to the broader educator workforce and disproportionately concentrated in elementary schools (Grissom et al., 2021). We found no statistically significant differences in AP employment by race/ethnicity, an important finding given other research that highlights the critical role leaders of color can play, especially in high-needs settings (Grissom et al., 2017; Jang & Alexander, 2022).
Prior research has also found mixed results on the relationship between program type (e.g., alternative, traditional) and entry into leadership (Doss et al., 2022; Fuller et al., 2019; 2016; Grissom et al., 2019). In our study, we found major differences by program type, with interns from competitive scholarship loan programs and interns from licensure only programs moving into an AP position at a much faster and slower rate, respectively, than peers from a traditional MSA program. The degree to which these differences are attributable to systematic variation in program quality (e.g., university-district partnerships), differential selection into programs, or some combination of both is unclear.
Our estimates indicate that many of the characteristics of internship placement sites do not predict entry into an AP position. One notable exception is that interns placed with higher rated mentor principals move into AP positions more rapidly than their peers with lower rated mentor principals. We acknowledge that this result may be due to selection—that is, higher-quality interns, who may move into an AP role more quickly, may be more likely to have a highly effective mentor principal. However, a host of research studies attest to the importance of the mentor-intern relationship, finding that mentors play critical roles in exposing interns to many aspects of leadership practice, such as leading professional learning communities, supervising and evaluating teachers, conducting professional development, engaging with parents and the community, and preparing data reports (Geer et al., 2014; Palmer et al., 2021; Thessin et al., 2020). As such, it is possible that the benefits of a high performing mentor principal may extend beyond the internship and into the labor market, either through networking and/or the skills and leadership practices an intern develops through expert mentorship.
Finally, our study found that where candidates interned was consequential for where they began work as an AP. Specifically, those who interned in a low-income or low-performing school were more likely to be hired as an AP in a low-income or low-performing school. Why this occurs remains unknown. For instance, it is possible that interns decided to work as APs in low performing schools due to their prior experiences working in such settings (either as an intern and/or in employment before the internship). It is also possible that districts and schools hire interns into high-need schools because of their experience working in such environments. It is clear from the research literature that low performing schools have the greatest leadership needs (Loeb et al., 2010; Perrone, 2022). Accordingly, PPPs, school districts, and state policymakers looking to address these needs could consider internship placements in low performing settings with highly rated principal mentors as a (potentially) effective approach to increase the availability and quality of school leader candidates.
Conclusion & Future Directions
The school leadership labor market is unique in that there are far more certified school leaders than there are positions. Yet, given a high rate of leadership turnover, school districts are often in need of effective leaders, especially in high needs schools (e.g., Perrone, 2022). PPPs play an important role in preparing high quality leaders and meeting this need (Darling-Hammond et al., 2022; Young & Crow, 2016). In this study, we examined the relationship between a critical component of principal preparation—the internship—and future job market outcomes. In particular, we found that many characteristics of internship placement sites were not significantly related to AP entry. Nevertheless, a few of our findings have important implications for both policy and future research.
First, we found that interns enrolled in competitive scholarship loan programs were faster in becoming APs (including in high needs schools) than interns enrolled in traditional MSA programs. It appears that North Carolina’s investment in a statewide competitive scholarship loan program is paying off in the form of supplying a higher proportion of candidates ready for leadership employment. States looking to fill leadership roles in schools may consider a similar investment. Conversely, it does not appear that opening access to leadership preparation in the form of add-on licensure programs has a similar yield in leading candidates to enter administrative positions. In this case, state policymakers may be cautious of relaxing program requirements as a means of addressing leadership shortages. Future research should continue to explore how leadership licensure reforms influence labor market outcomes.
Second, interns who had higher-rated mentor principals moved into school leadership at a faster rate than interns with lower-rated mentor principals. Future research could further explore how mentor principals’ performance is related to interns’ development, professional network, and job success. In particular, it might be especially important for future analyses to examine the relationship between mentor principals’ effectiveness and interns’ future leadership performance. Such findings could further substantiate the need to prioritize internship placements with highly-effective mentor principals.
Finally, we found that candidates who interned at high needs schools were much more likely to become an AP in a high needs school. This was true even when controlling for whether a candidate became an AP in their internship school. States and districts are searching for ways to address leadership staffing challenges in high needs schools. Our results suggest that PPPs—through internship placements—have a role to play to meeting these challenges.
The biggest limitation to our work is that we know relatively little about the internship placement process for prospective school leaders. For example, there is still much to learn regarding the role of intern, the role of the PPP, and the role of the school district/mentor principal in the internship assignment process. Understanding this process and how it might vary across interns, programs, and districts is essential to evaluating the causality of our estimates and to helping translate findings to practice. Furthermore, to best inform practice, it is important to assess whether internship experiences impact interns’ future performance as school leaders. To the extent that internship characteristics matter to leader outcomes, that amplifies the need to prioritize high-quality internship placements. Moving forward, we encourage continued studies to better understand the internship placement process and the impacts of internship experiences on school leader outcomes.
Despite these limitations, we believe that this study makes an important contribution to the research literature by identifying factors that are positively linked to leadership employment. These factors can guide PPPs and their district partners in making informed internship placement and hiring decisions.
Footnotes
Appendix
Results from Lognormal Accelerated Failure Time Regressions Predicting Becoming an Assistant Principal in a High-Need School (Controlling for Staying in the Same School).
| (1) | (2) | (3) | (4) | |
|---|---|---|---|---|
| Focal covariates | AP in low income | Stratified AP in low income | AP in low performing | Stratified AP in low performing |
| Female | 1.175 (0.124) | 1.288* (0.165) | 1.130 (0.0831) | 1.206*** (0.0617) |
| Black | 0.885 (0.0832) | 0.938 (0.132) | 0.952 (0.0407) | 1.000 (0.0457) |
| Other Race | 0.959 (0.131) | 1.075 (0.226) | 1.040 (0.163) | 1.154 (0.218) |
| Competitive scholarship loan | 0.640*** (0.0690) | 0.585*** (0.0830) | 0.669** (0.0974) | 0.604*** (0.0604) |
| Licensure only program | 1.019 (0.106) | 0.969 (0.197) | 1.083 (0.108) | 0.874 (0.127) |
| Internship in an urban school | 1.367** (0.161) | 1.560* (0.282) | 1.305** (0.109) | 1.430*** (0.128) |
| Prior school same as the internship school | 1.261** (0.0940) | 1.003 | 1.171 | 0.930 |
| (0.0531) | (0.125) | (0.125) | ||
| Internship school exceeds growth | 0.862 (0.0798) | 0.827 (0.105) | 0.898 (0.0820) | 0.895 (0.121) |
| TWC: Collaboration at internship school (Std) | 0.998 (0.0688) | 1.003 (0.0886) | 1.056 (0.0655) | 1.052 (0.0429) |
| TWC: Leadership at internship school (Std) | 1.039 (0.0540) | 1.095* (0.0494) | 0.983 (0.0758) | 1.007 (0.0527) |
| Internship in a low-income school | 0.571*** (0.0472) | 0.660*** (0.0744) | ||
| Internship in a low-performing school | 0.657*** (0.0528) | 0.711*** (0.0615) | ||
| Internship and AP in same school | 1.035 (0.0742) | 1.035 (0.117) | 0.908 (0.0719) | 0.932 (0.0593) |
| Early-career mentor principal | 1.047 (0.113) | 1.051 (0.157) | 0.985 (0.0782) | 0.953 (0.0572) |
| Mentor principal average NCEES rating | 1.043 (0.0503) | 1.010 (0.0461) | 1.005 (0.0602) | 0.979 (0.0729) |
| Observation count | 640 | 640 | 640 | 640 |
Note: This table displays results (time ratios and cluster-adjusted standard errors in parentheses) from AFT models predicting movement into an assistant principal position in a high-need NCPS. Results in column 2 and 4 are from an AFT model stratified by principal preparation program.
p < .05. **p < .01. ***p < .001.
Acknowledgements
The authors would like to acknowledge the University of North Carolina System Office and the North Carolina Department of Public Instruction for providing the administrative data for this research.
Declaration of Conflicting Interests
The author(s) declared no potential conflicts of interest with respect to the research, authorship, and/or publication of this article.
Funding
The author(s) received no financial support for the research, authorship, and/or publication of this article.