
Abstract
This is the second in a series of articles looking at school health data collection from identification of data points to utilizing data to share your story and submit your data to contribute to the National School Health Data Set: Every Student Counts! This article focuses on using data to share your story. Data storytelling versus data visualization will be discussed as well as
Keywords
What Is Data Storytelling?
In a recent study, 87% of participants “. . . indicated their organizations would be more efficient if their front-line workers were more empowered by data” (Harvard Business Review, 2020; Mattison, 2023, para 1). These front-line workers include school nurses. Collecting and sharing your data is essential in using it to tell a story. Incorporating data into your story provides supporting evidence to engage the intended audiences. Bergren and Maughan (2020) discussed this need for school nurses to increase data literacy and “apply data and evidence to inform practice” (p. 140). Sharing data is a fundamental skill in advocating for the role and value of the school nurse in the 21st century (National Association of School Nurses [NASN], 2020). The benefits of utilizing data storytelling include
increasing comprehension of complex data,
making data more meaningful and memorable,
simplifying the communication of the data to a wider range of stakeholders, and
providing a more compelling story that increases the persuasiveness and impact of the data (Sigma, 2023).
Data visualization is the graphic representation of data and enables the viewers to identify trends and patterns from the data visually. Data storytelling incorporates the visual representation of the data with the narrative and context to make the data more relatable with a goal of influencing decision-making (Calzon, 2022; Sigma, 2023). Data storytelling requires three components: the narrative, the data, and the visual representations (Calzon, 2022). It is not enough to be at the table for discussions; utilizing data provides school nurses with a voice at the table.
WHAT Story Do You Want to Tell With the Data?
Children with medical conditions can experience barriers to learning and barriers to being present in the classroom because of issues related to their health, including side effects from medication, absences due to doctor visits, stress, pain, as well as ineffective coping skills . . . School-based care coordination is the most effective strategy for keeping children with chronic conditions healthy and ready to learn. (Missouri Kids Count, 2016, para. 9)
School nurses are experts in school-based care coordination and advocating for safe, supportive, and equitable learning environments for all students (NASN, 2023). School nurses collect data related to student needs, barriers, successes, and school nurse interventions every day. The next step in the process is utilizing the data to share your story. Refer to Box 1 for techniques and best practices in storytelling.
Seven Techniques and Best Practices for Data Storytelling
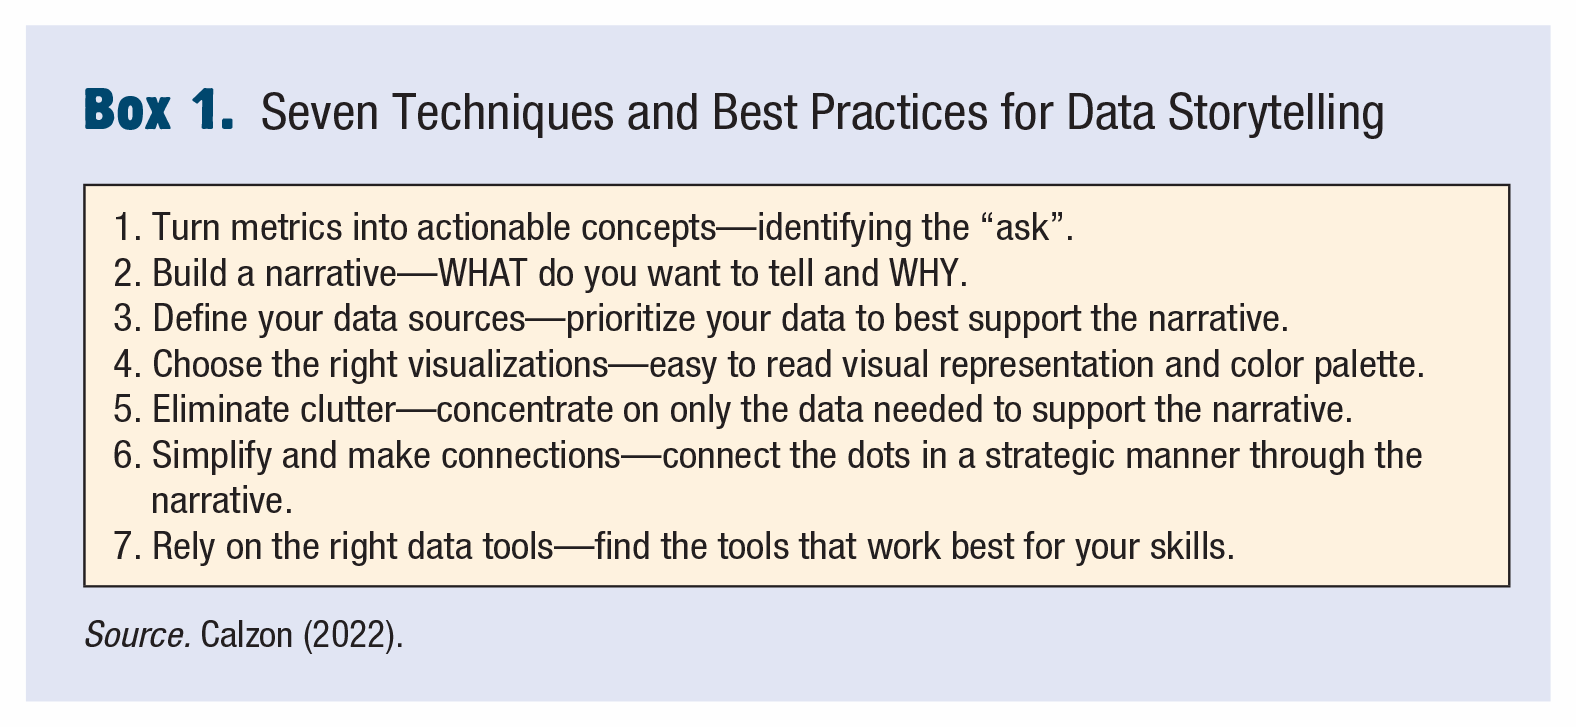
Source. Calzon (2022).
The story you tell,
Table 1 provides a sampling of school health data points, how they link to student outcomes, and the academic indicators they can connect with in your storytelling. As a reminder from the first article, “academic achievement is measured through academic indicators. Academic indicators include academic performance (grades, graduation rates, test scores), educational behavior (attendance, dropout rate, behavior referrals), and school attributes (student engagement, school climate, parent/family engagement)” (Stanislo, 2023, p. 312). Identifying the academic indicators is essential in identifying the
Linking School Health Data to Educational Data
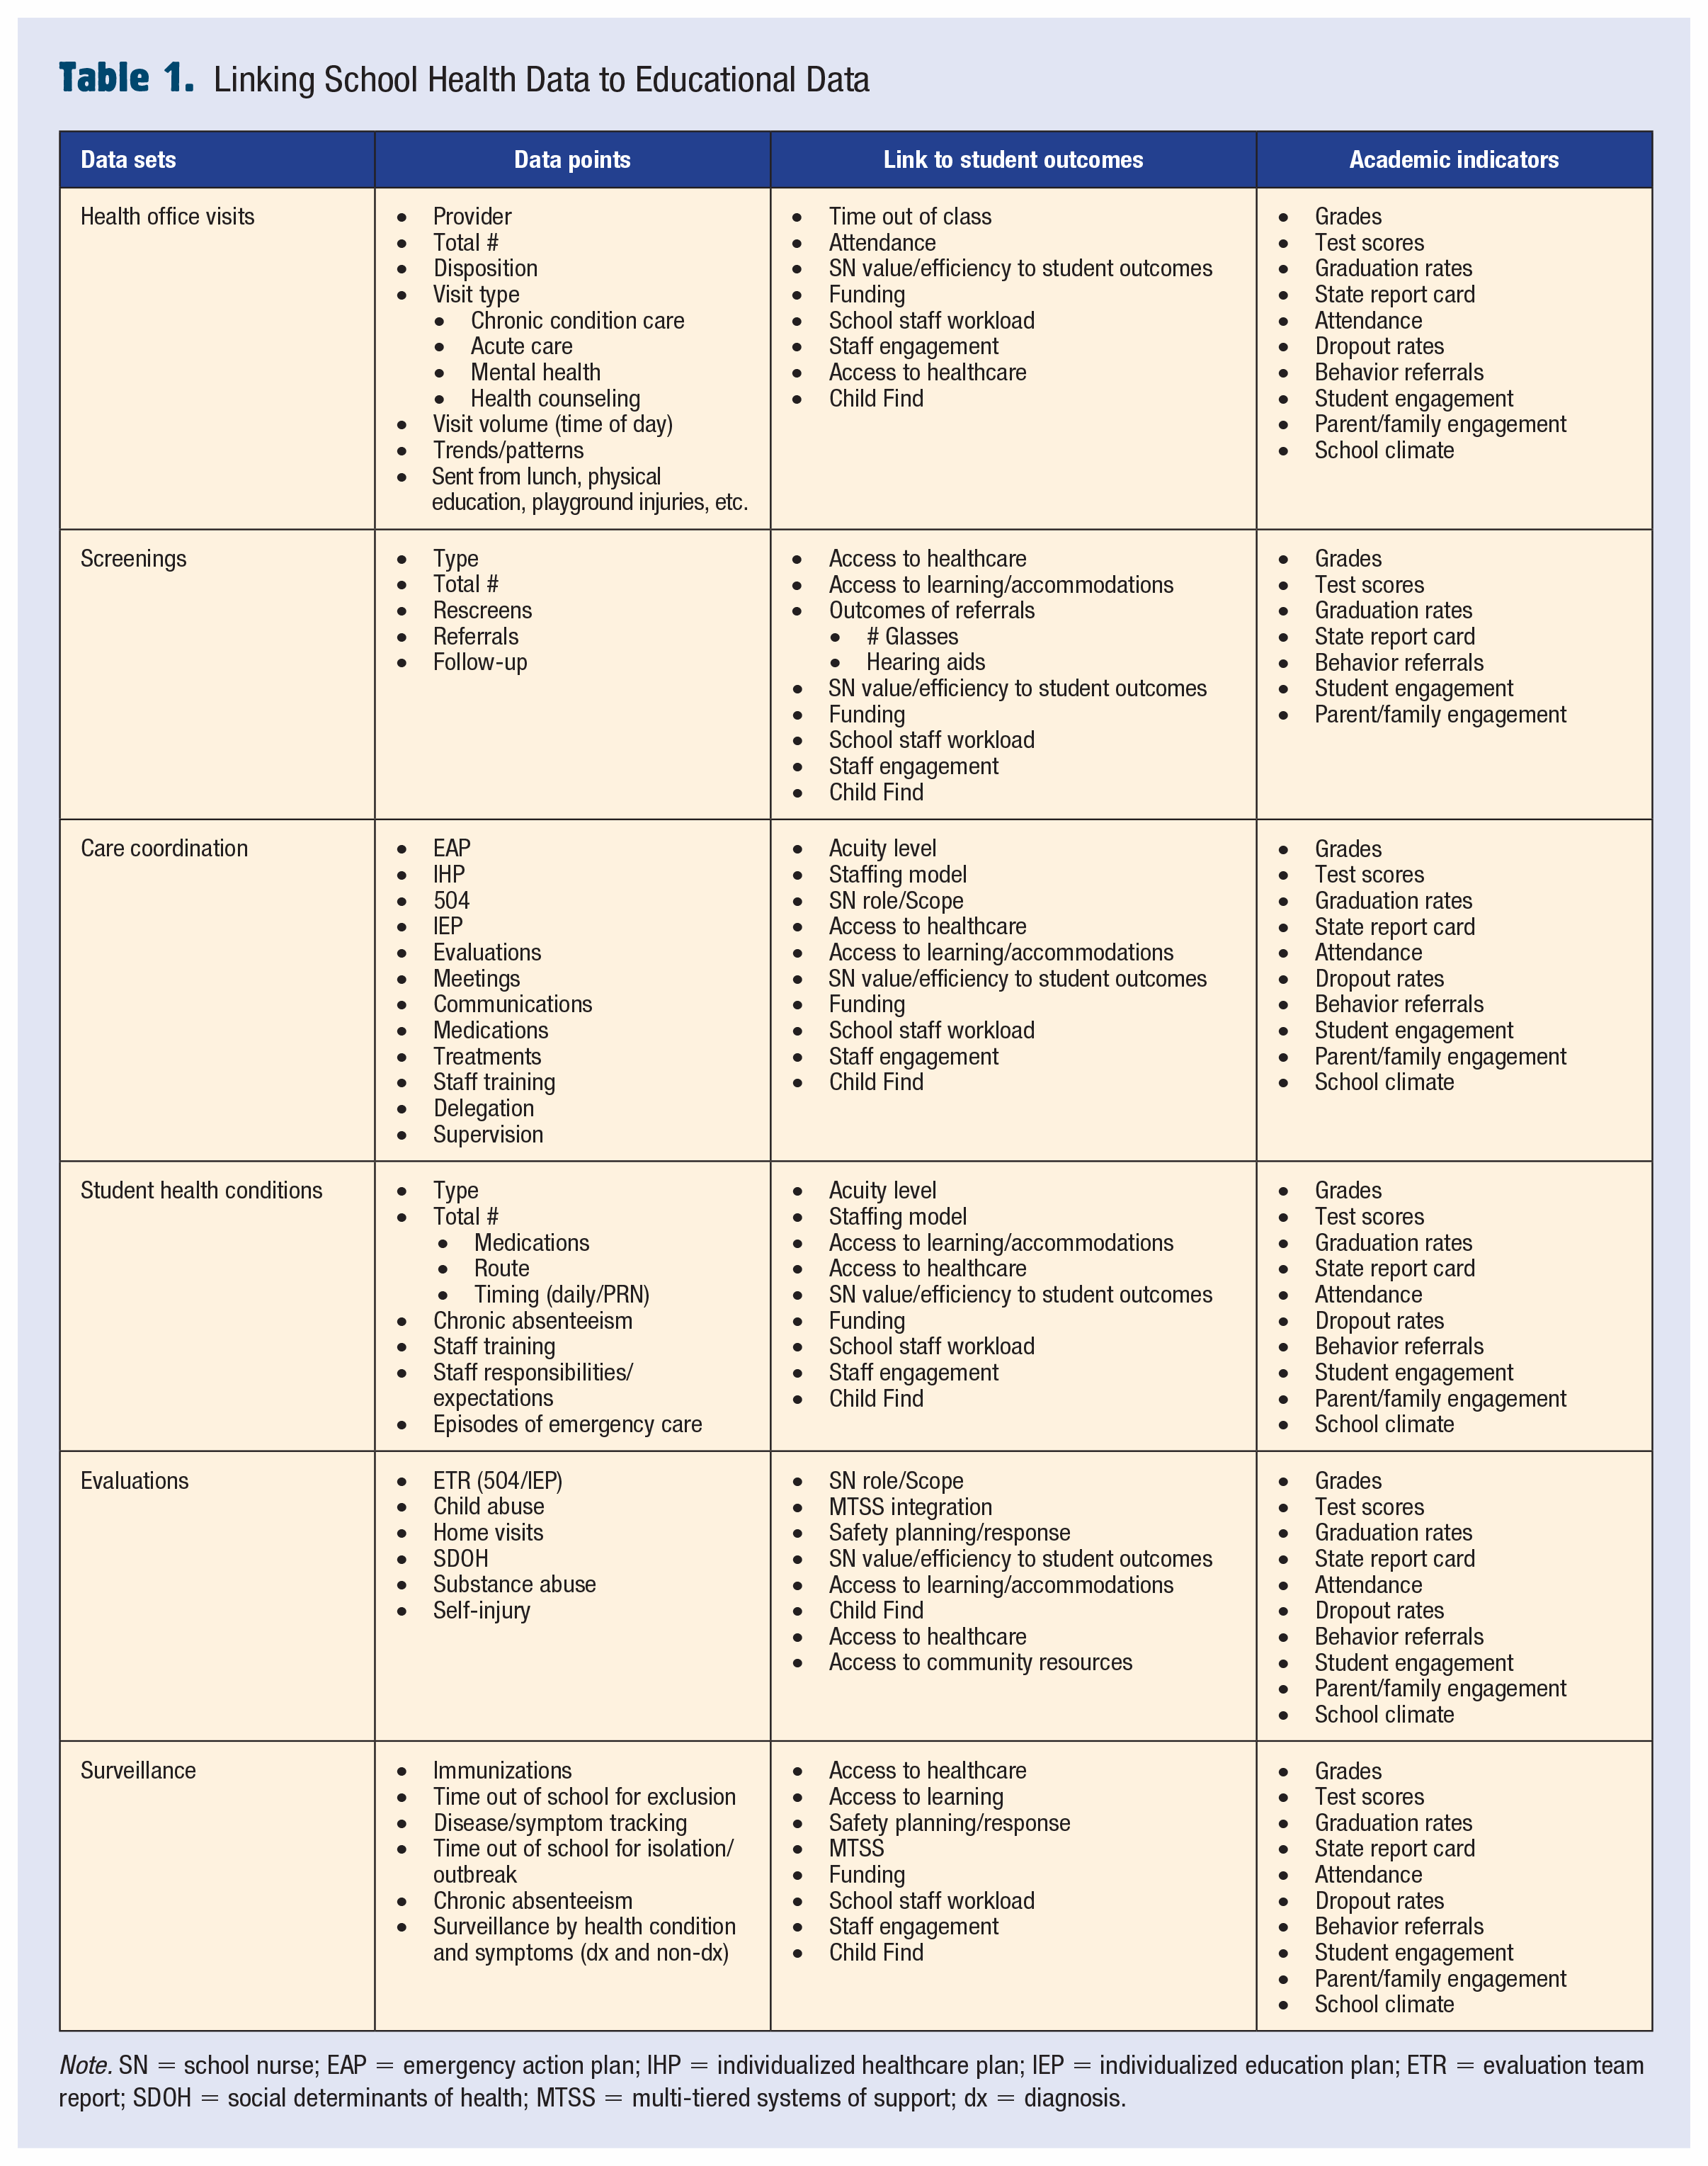
Note. SN = school nurse; EAP = emergency action plan; IHP = individualized healthcare plan; IEP = individualized education plan; ETR = evaluation team report; SDOH = social determinants of health; MTSS = multi-tiered systems of support; dx = diagnosis.
Although submitting data for school, district, state, and or national utilization, such as the National School Health Data Set: Every Student Counts! (ESC!), is important, the most important part of the data collection process is the utilization of data by the school nurse at the local level (Bergren & Maughan, 2020). Identifying
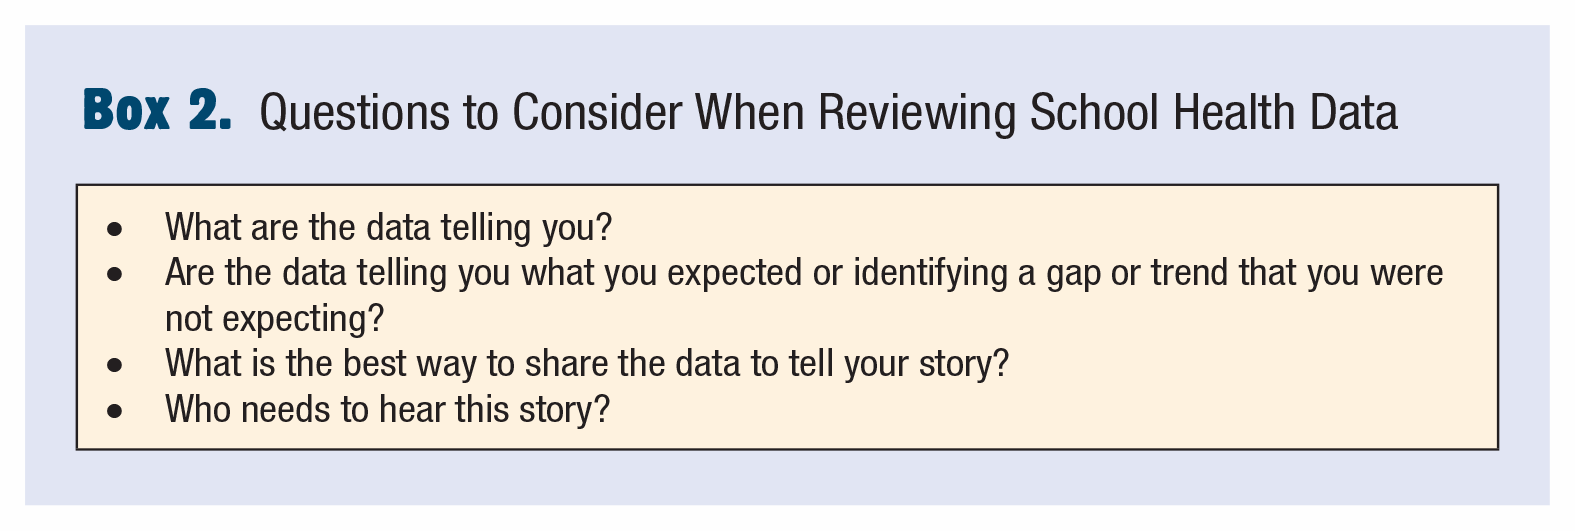
Data in school nursing practice represent the paver stones along the path. The most important step on this path is the first one; engaging with your data by starting where you are. See Box 2. The data helps frame the story you will share and the next steps on the path.
Questions to Consider When Reviewing School Health Data
Data Sharing Standards
Data sharing, like any information sharing, presents privacy issues. This can seem complicated in schools.
Data Sharing Examples and Resources—HOW to Tell Your Story
Once the data points and stakeholders are identified, identifying the
Monthly report
Newsletter
Infographic
In-services (beginning/end of year)
Legislative testimony
Data spotlight stories
School/clinic bulletin board
Scheduled meetings with school/district administrators
Board meetings
The stories can focus on an explanation, identification, or comparison. Do the data tell a story of changes over a school year, differences between schools, identifying trends or gaps, or highlighting student outcomes or school nursing practice? Is the story about improvements or changes related to a new policy or practice or identifying trends by month over a year or year to year?
The format for sharing data through storytelling is dependent on the
Examples of State School Health Infographics
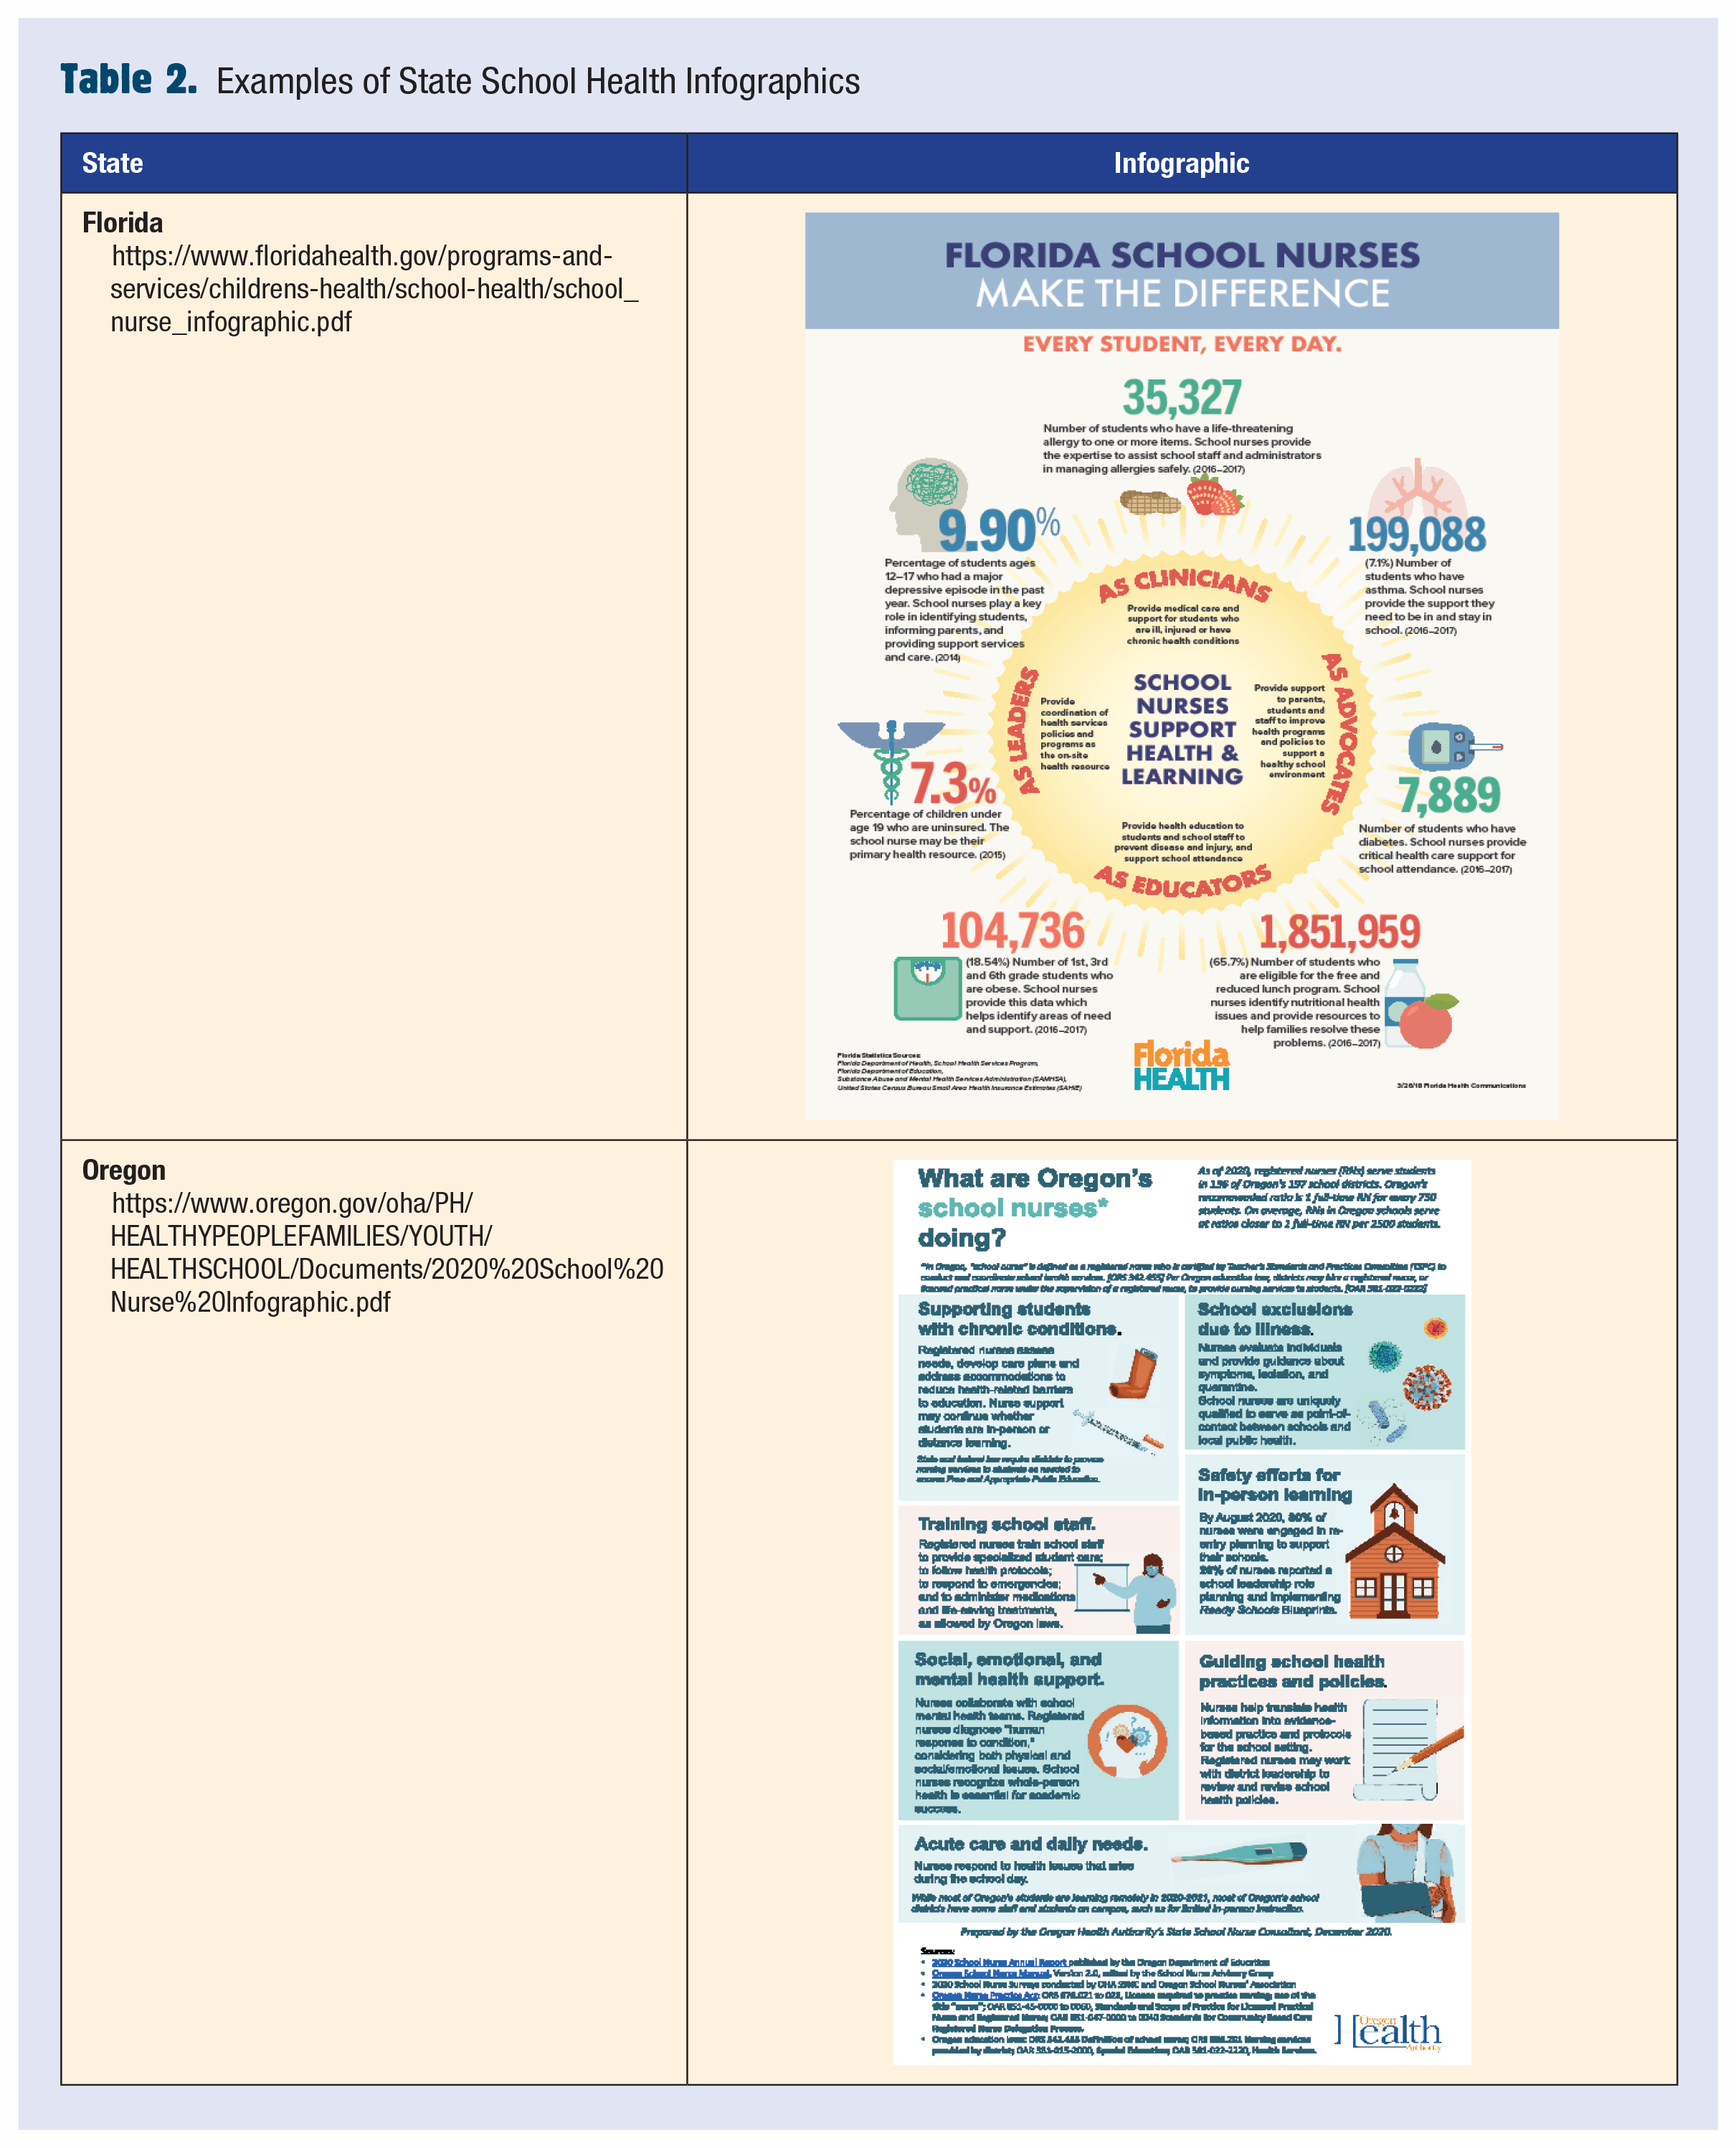
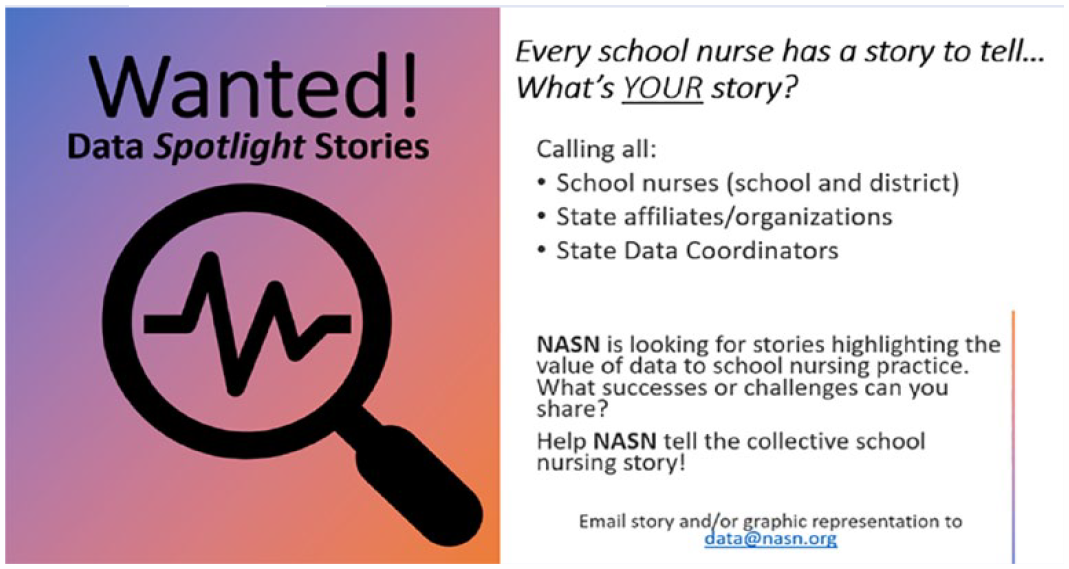
Creating graphics to share data can be intimidating. Table 3 provides examples of resources to create your own graphics or utilize premade templates, like the fillable infographic located on NASN’s ESC! website, that are easy to access and do not require expensive programs or apps. Microsoft and Google applications like Word, Excel, and PowerPoint also provide graphic features that are readily available.
The Health Visit Disposition, Student Visits, and Life-Threatening Allergy examples were created with PowerPoint by adding a chart but could also be a Word document. Once selecting the insert option from top menu, a wide range of chart formats are available for choosing. Once a chart is selected, right clicking on the chart will open the edit data option where you can personalize the chart with your data and custom color palette.
The Student Visits graphic was created with the same method but a different chart option. Once the data are inputted, you can change the chart option and view it in several formats before choosing the one that best fits your story. The add shape option was utilized to create the arrow and insert a text for a short-written description.
The Life-Threatening Allergy graphic utilized multiple charts and shapes within a single slide or page to offer comparisons and visualization of more granular data.
The Facts & Stats/SN Outcomes utilized shapes and icons to create a graphic that included text within each shape for comparison.
The Facts & Statistics graphic utilized icons to represent data with smaller text explanations included. Graphic programs, such as Slidesgo, Canva, SmartDraw, Visme, and Adobe Express are all available with some free components.
Data Storytelling Resources
Note. NASN = National Association of School Nurses; ESC! = Every Student Counts!
School districts may also have accounts that the school nurse can utilize for more advanced features. School nurses utilizing the Teams communication platform can now access Canva and SmartDraw free through the Teams platform under the applications option.
Call to Action
In this article series, we have now covered
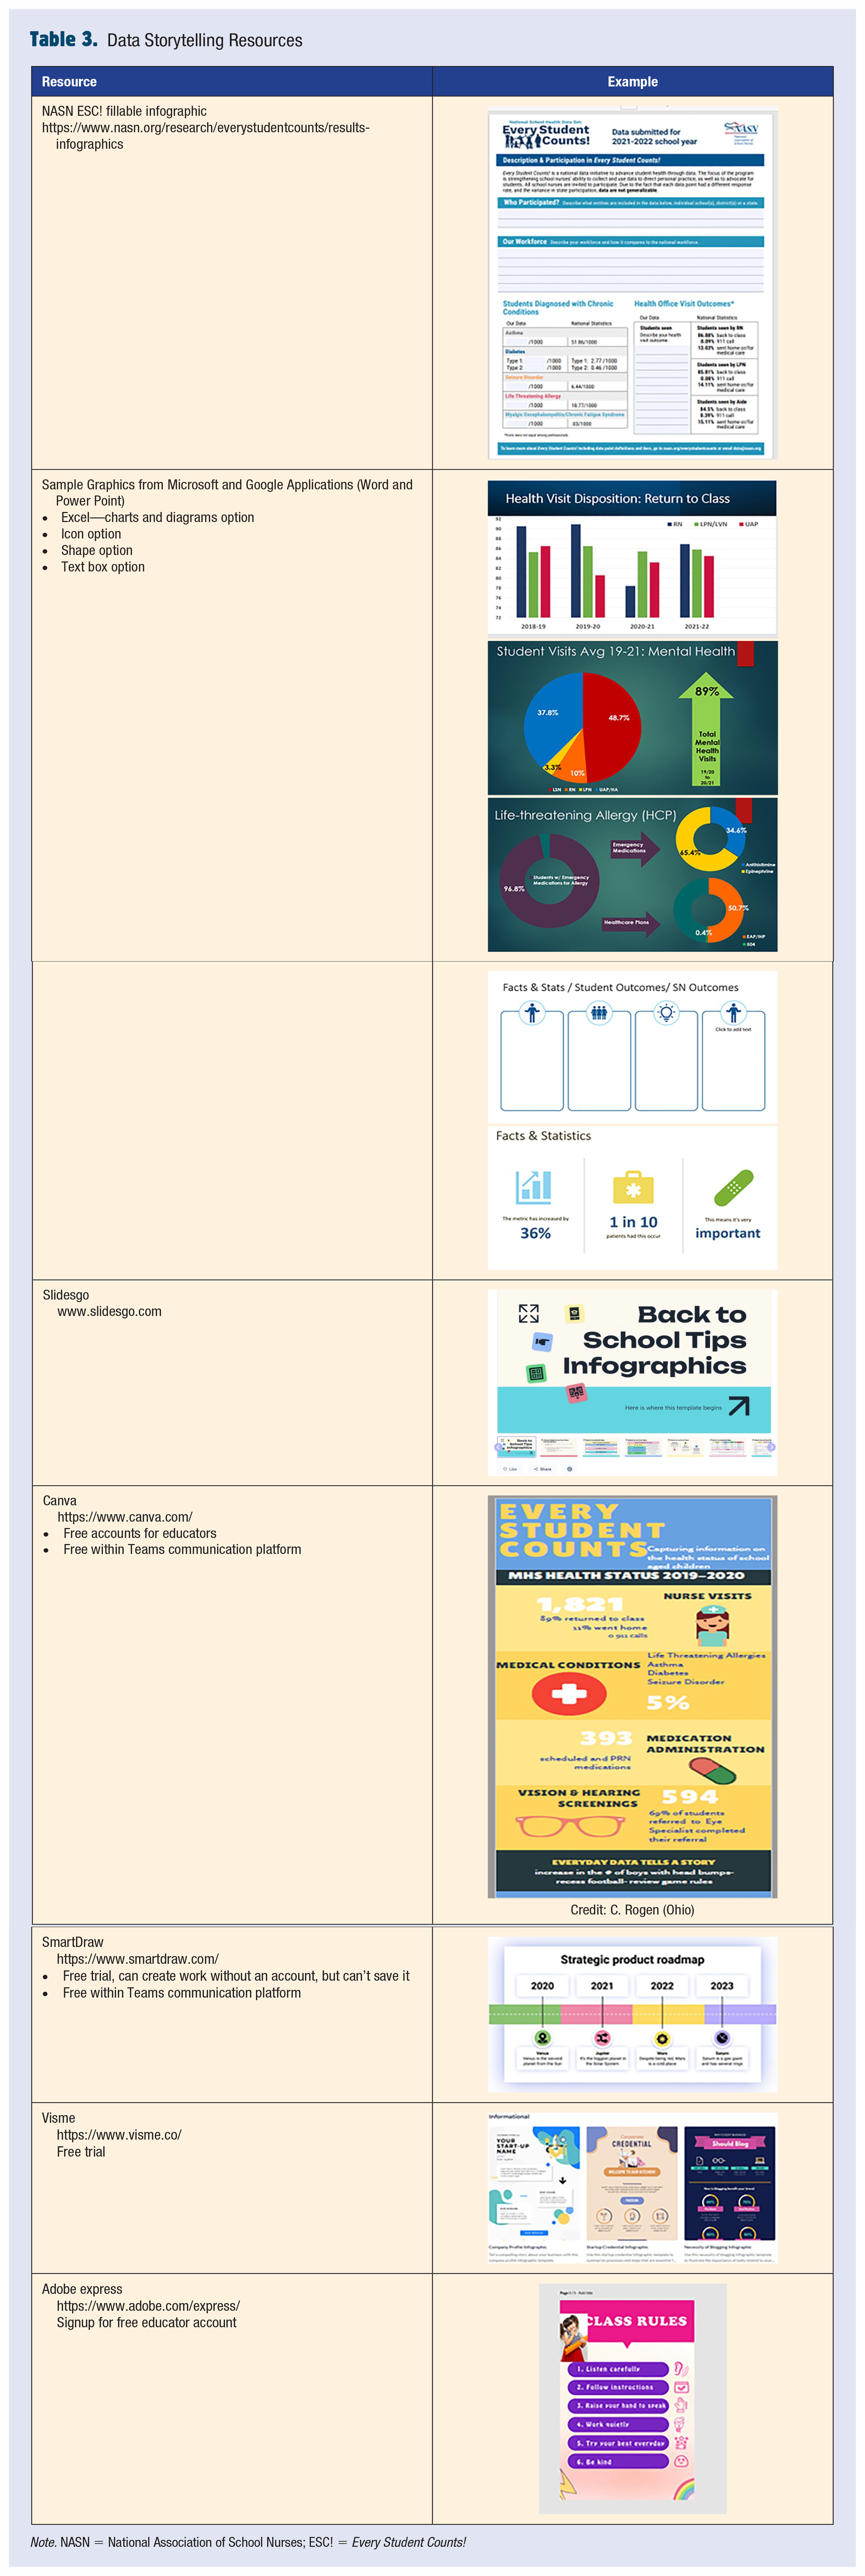
NASN Resources
Note. NASN = National Association of School Nurses; SDC = state data coordinators.
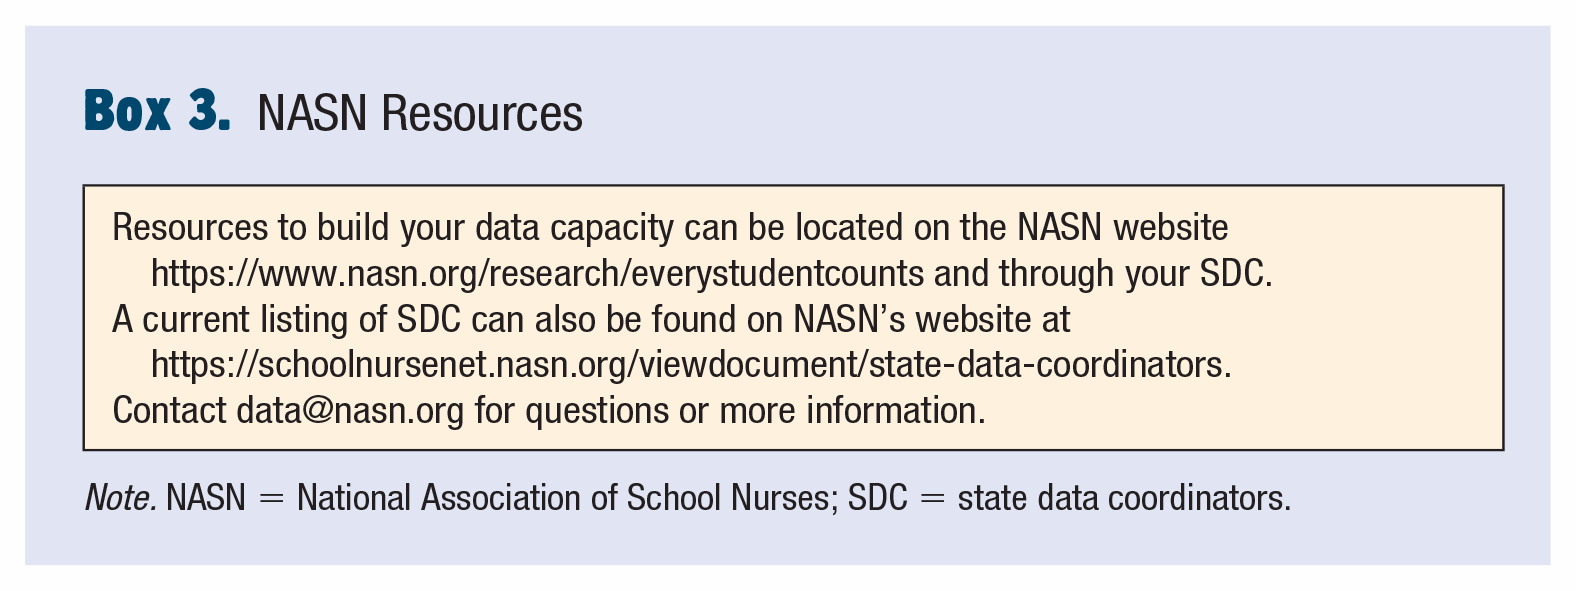
Once you tell your story, we invite you to help tell the collective story of school nursing through the National School Health Data Set: Every Student Counts! Our story is not complete without the story of each and every school nurse. NASN is also promoting a new initiative called Data Spotlight Stories (Figure 1). We want to hear from YOU! Every story, no matter how small, is an experience and example of school nurses utilizing data to drive evidence-based decision-making and promote evidence-based practice. Do you have a story you want to share? Do you want to highlight a school nursing peer in a story? We are looking for stories of local school nurses, district, state affiliates, state data coordinators (SDCs) to spotlight. Feel free to share a written story and/or graphic representation of the data. Email your story to
Data Spotlight Initiative
Footnotes
Since April 2022, Kim has served as the Research, Education, and Practice Director for NASN. Prior to this position, Kim was a Clinical Assistant Professor and Program Director for a School Nurse Certificate program at Ashland University and has worked in various school nursing roles since 2004. Kim also served as the State Data Coordinator for Ohio from 2016 to 2022.