
Abstract
Background:
Load management is a sports science concept describing the execution of well-established training principles to measure athletic workloads and enhance performance. The term ‘load management’ has become common in sports media to refer to a much wider range of scenarios, including the idea that by limiting regular season workload for athletes, their health and playoff performance will improve. Varying links between load and performance have been demonstrated in baseball and soccer. The purpose of this study was to objectively assess the impact of regular season workload on postseason performance among National Hockey League (NHL) goalies.
Hypothesis:
NHL goalies with lighter regular season workloads will perform better in postseason appearances.
Study Design:
Retrospective cohort.
Level of Evidence:
Level 3.
Methods:
NHL goalies with a minimum of 20 regular season games played and 3 playoff game appearances in the same season since 2013-2014 were eligible for inclusion. All regular season and postseason workload and performance metrics were collected from publicly available statistical databases. Workload outcomes included games started, minutes played, and shots faced. Performance outcomes included goals against average, save percentage, goals saved above average, and quality start percentage. Multivariable linear regression was used to determine whether regular season workload predicted postseason performance, when controlling for age and injury status.
Results:
A total of 51 goalies contributed 111 goalie-seasons to the analysis. The results of the primary model indicated that regular season workload explained only 6.8% of the variance in postseason performance, and that this relationship was not significant (R2 = 0.068; F(5,92) = 1.335; P = 0.26).
Conclusion:
Based on data from 6 full seasons, there is no evidence to support a specific regular season game limit among NHL goalies with the aim of improved performance.
Clinical Relevance:
Individualized workload plans may be more appropriate than a single league-wide standard.
The field of sport science traces its roots back over 2000 years, including multiple examples in the ancient world. 27 Nonetheless, in the past 3 decades, the field has advanced greatly due to a combination of technological advancements, 16 a growing focus on evidence-based medicine, 20 and a more multidisciplinary approach to the care of elite athletes. 7 With these developments, there has been a rapid and consistent growth in the field of sport science, which now is a broad and scientifically rigorous discipline incorporating a holistic approach to the care of athletes. This approach includes a range of interrelated disciplines, such as strength and conditioning, injury prevention and rehabilitation, nutrition, and sports psychology, that are involved in the measurement of physiologic load and exertion, as well as the optimization of athletic performance. 4
Measuring the physiologic load associated with exercise is a complex and evolving field of study. The crudest surrogate measures for quantifying physiologic loads are also typically the simplest to track and measure: these include metrics such as games or game segments participated in (eg, innings, periods), event-based measures (eg, pitch counts), or distance-based (eg, kilometers run). 9 These metrics are known as ‘external workload,’ or the general amount of work performed by the athlete. On the other hand, ‘internal workload’ refers to individualized outcomes that attempt to measure the actual impact of that workload on a given athlete (eg, subjective perception of exertion, objective measures of physiologic exertion such as heartrate).8,9 This concept is a critical consideration in athletic workloads and the topic of load management, as it stresses the importance of individual variability on the true amount of ‘work’ applied to the athlete’s body, which can have an impact on response to training, performance, and injury rates. 9
With the advent of advanced statistics and analytics in the world of professional sports, sports organizations continue to seek ways to optimize team performance. An investment in sport science and analytics staff and departments is now routine among the major professional sports leagues and their respective member organizations. 21 This has included an interest in the relationship between workload, performance, and injury status. This relationship has been explored extensively when it comes to baseball pitchers. Bradbury and Forman 2 reported that, among Major League Baseball pitchers, cumulative workload was directly predictive of future performance. Further, there was a somewhat weaker association between fewer days of rest and poorer performance. Birfer et al 1 similarly reported evidence of the association between muscle fatigue and altered biomechanics in a systematic review of baseball pitchers’ performance and injury rates.
Thus, in a scientific context, the concept of ‘load management’ refers to the execution of well-established and carefully measured training principles to enhance performance.6,13,25 In recent years, however, this term has come to be used much more broadly by sports media to refer to a wide range of scenarios, including players or teams choosing to sit out for a variety of reasons, the resting of low grade or lingering injuries, and a range of other tactical decisions by sports organizations that do not necessarily involve the actual measurement of workload.3,26,28 Empiric evidence for intentional load management is limited; however, a systematic review evaluated the relationship between workloads and injury/illness. Based on 35 articles across 12 different sports, the authors reported moderate evidence for a significant relationship between training load and the incidence of injury/illness. 8
In the context of professional ice hockey in the National Hockey League (NHL), load management is discussed most commonly in the media with respect to the goaltending position (‘goalies’). No goalie in the NHL has started over 60 regular season games (in an 82-game season) and won the Stanley Cup (the NHL’s championship trophy) since the 2008-2009 season. This statistic is often used by the sports media to justify a 60-start threshold as an ideal maximum for goalies in the NHL, and is sometimes attributed to ‘sport science’ by the media.3,26,28 However, it is unclear whether this load management strategy has any causal link to individual or team success. Sports medicine physicians and athletic trainers working with high-level goalies may be asked to comment on, justify, or optimize athletes’ workloads to minimize injury and optimize performance. Therefore, the aim of this study was to determine whether regular season game workload could predict postseason performance when controlling for age and injury status among professional ice hockey goalies.
Methods
Eligibility Criteria
No institutional review board approval or consent was required as all data used are publicly available. A retrospective review was performed to identify NHL goalies with a minimum of 20 regular season and 3 playoff game appearances in the same season between the 2013-2014 and 2018-2019 seasons. The 2013-2014 season was selected as it represents the first full season following the shortened 2012 NHL lockout season, following which rule changes were made with the explicit goal of increasing scoring in the NHL. As well, the 2018-2019 season was selected as the most recent season, as it was the final full season before a number of modified season structures due to the COVID-19 pandemic. 29
The games-played thresholds were selected to allow for goalies who started close to half (41) of a regular season in a platoon situation (ie, 2 goalies who roughly split starts, with no clear “number 1” goalie), but to exclude goalies who started only a handful of games in a season. Eligible goalies were identified by obtaining a list of all goalies who appeared in a playoff game in the seasons of interest, and assessing these goalies for eligibility was based on the above criteria. This was performed in duplicate and cross-referenced to ensure accuracy. All goalies meeting these criteria were included in the study. Given that goalies may have played for different teams over the course of their career, and each franchise may have gone through different building and rebuilding phases during this time, each goalie-season was treated as a separate datapoint.
Data Collection
Goalie demographic data, including name, date of birth, age at the start of the season, and team, were collected. Injury status and individual goalie statistics were extracted from publicly available sources, including https://www.nhl.com/ and https://www.hockey-reference.com/. The data were transcribed to a spreadsheet designed a priori (Microsoft Excel), which was piloted by the investigators before the initiation of the data abstraction process. All data were extracted in duplicate by 2 reviewers, and verified by a third author for accuracy.
The NHL has mandatory injury reporting for players who miss games due to injury, and these data are publicly available on the https://www.nhl.com/ website. The data do distinguish between injury and time missed due to personal reasons (eg, parental leave); however, they do not include injuries that do not cause players to miss at least a full game. Regular season game workloads were measured based on games started, shots faced, and minutes played. Although regular season starts are not a great measure of actual workload as they do not account for variability in length of a start or volume of shots, they were included as this is the most commonly discussed way to manage workload in NHL goalies, and is the most easily managed by coaching and team management.
Standard in-game performance statistics were collected and analyzed, including the number of games started, minutes played, saves, goals against (GA), goals against average (GAA), and save percentage (Sv%). More recently described advanced in-game statistics, such as goals saved above average (GSAA), and quality start percentage (QS%), were also collected. GSAA is the theoretical number of goals that a goalie has prevented based on their Sv% and number of shots against in comparison with the league average Sv% on the same number of shots. 24 A positive GSAA indicates that a goalie has prevented more goals than a league average replacement goalie, while a negative number indicates that the goalie has surrendered more goals than a league average replacement. Given that GSAA is a cumulative statistic, the GSAA was calculated per 60 minutes played to standardize this metric. The QS% represents the number of quality starts a goalie produces in reference to the number of games started. A quality start (QS) is defined as either a single game Sv% that exceeds the mean Sv% among all goalies that year, or the goalie gives up <3 goals while stopping ≥88.5% of shots faced. 23 All performance variables were recorded for both the regular season and corresponding playoff season. For each performance metric, the difference (Δ) between regular and postseason performance (ie, postseason - regular season) was used rather than the raw postseason performance metrics to account for season-to-season variations in team performance. Table 1 summarizes the 4 performance metric variables.
Details and definitions of outcome variables
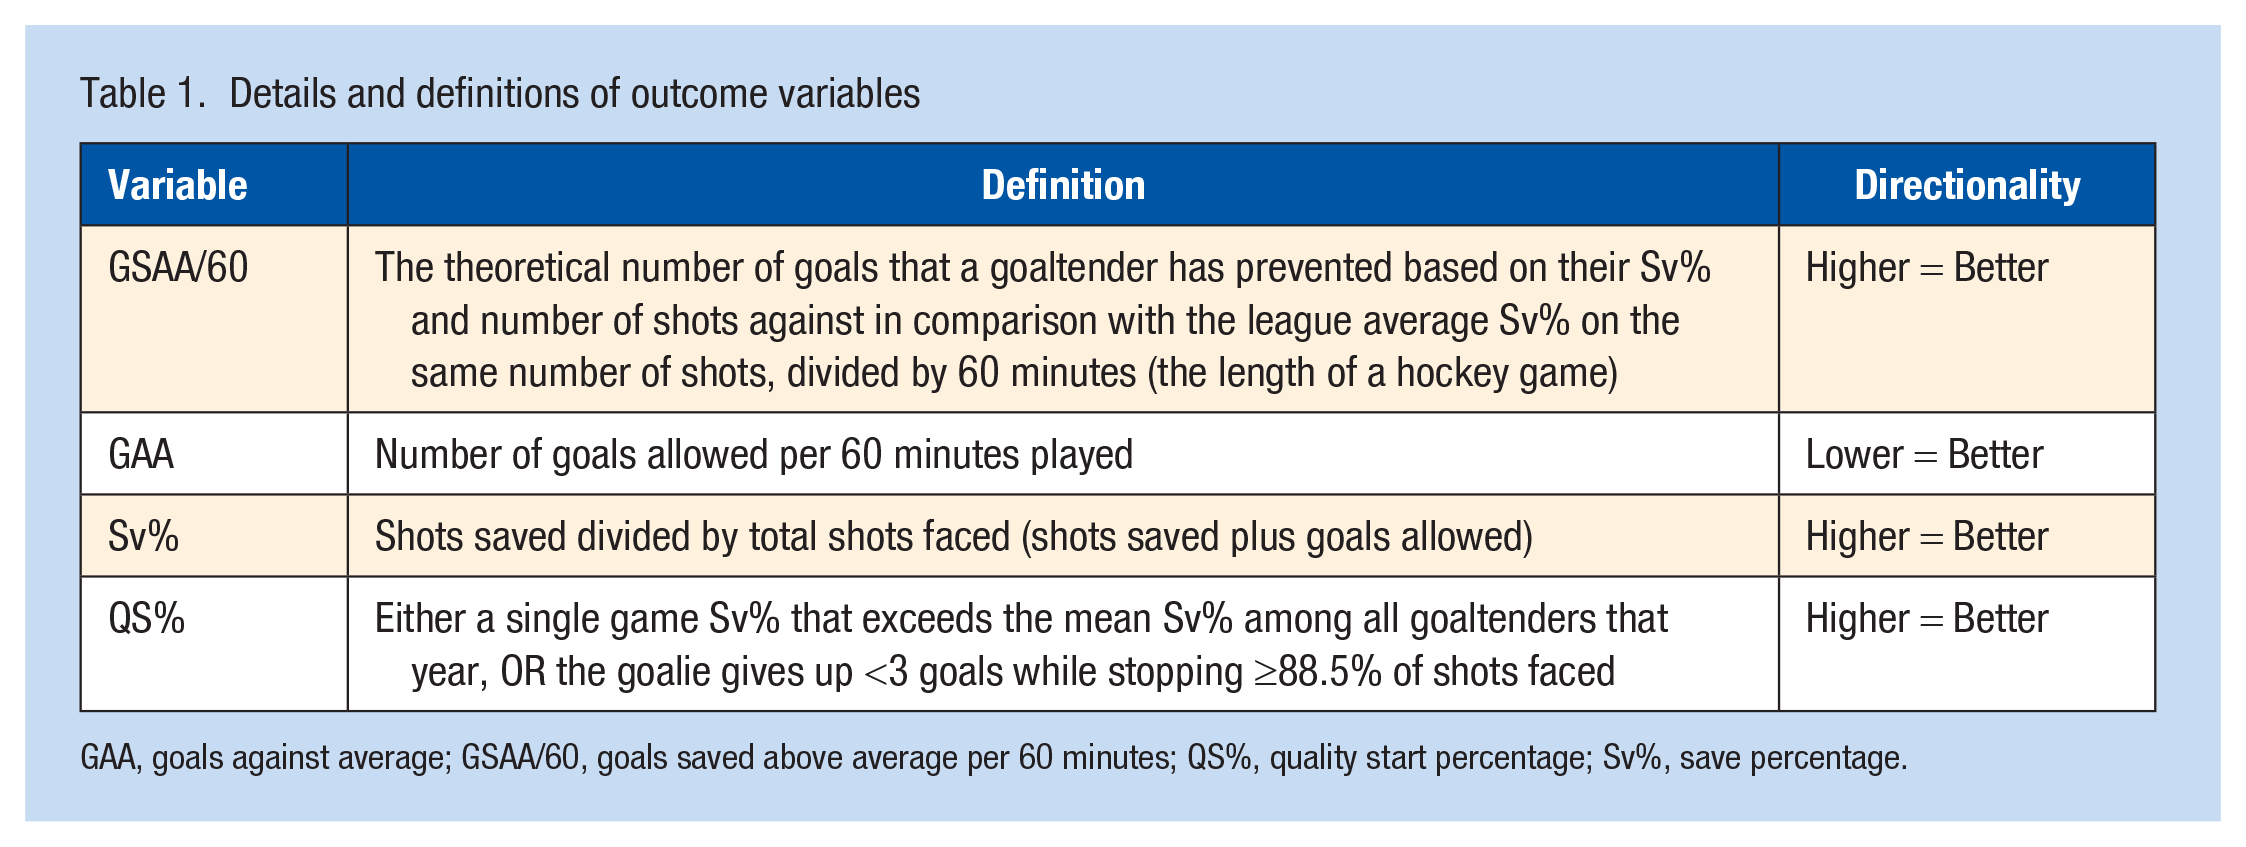
GAA, goals against average; GSAA/60, goals saved above average per 60 minutes; QS%, quality start percentage; Sv%, save percentage.
Data Analysis
The primary outcome of interest was ΔGSAA/60, as it is thought to be the metric that is best able to isolate a goalie’s performance from the quality of their team and their opposition. 23 The secondary outcomes were (1) ΔSv%, (2) ΔQS%, and (3) ΔGAA.
Descriptive statistics were analyzed for each variable. Histograms were constructed to identify any variables that were not normally distributed. Any variables which were not normally distributed were transformed before analysis. Normally distributed variables are presented as means and standard deviations; otherwise, they are presented as median and interquartile range (IQR). Performance metrics are presented in the conventional format of official NHL statistics, with Sv% and QS% presented as proportions with 3 significant digits and no leading zeros (.XXX), and GSAA/60 and GAA presented as continuous variables with 2 significant digits (Y.YY).
Multivariable linear regression was used to determine whether regular season game workload predicted postseason performance. Two linear regression models were constructed for each outcome variable. The primary model of interest included age, injury status, and regular season workload parameters (number of starts, total minutes, total shots) as continuous independent variables. Injury status was measured as a dichotomous yes/no variable, and defined as any injury or combination of injuries forcing a goalie to miss >1 game over the course of a full season. Number of games missed were collected and reported but not used as an independent variable as they would be related to games started. In a second, multivariable exploratory regression model for each outcome variable, regular season starts were treated as a dichotomous outcome and goalies were divided into 2 groups, those with ≥60 games played and those with <60 games played. Total season minutes and shots faced were also included in the secondary models as independent variables. For the purpose of this study, goalies who played <60 games in the regular season were deemed to have been either unintentionally or purposefully load managed. The dependent variables for both models were ΔSv%, ΔGAA, ΔGSAA/60, and ΔQS%.
Other Analyses
Missing data were excluded on a listwise basis, whereby records were excluded from analysis if any datapoint was missing for analysis. Given that the data are already verified before being made available by the NHL, and that data extraction was performed in duplicate with verification, the concern for outliers was low. Nonetheless, Cook’s D and Leverage statistics were calculated and used to assess for any potential outliers. Values >1 for Cook’s D 5 , or >2*(k+1)/n = 2(5+1)/111 = 0.11 for Leverage were investigated for accuracy. 11 Given that multiple seasons were used for some goalies, a sensitivity analysis was performed by using only the most recent available season for each goalie to ensure that there was no violation of the assumption of independence, which may have impacted the findings. Univariate models with bivariate scatter plots were constructed to assess for the presence of any potential nonlinear relationships. Residual plots were inspected for each model to ensure homoscedasticity and normality. The final multivariable models were constructed using an enter method with all independent variables included simultaneously, and all variables remaining in the model. Finally, a post hoc analysis was performed with the addition of playoff minutes played as an independent variable to the above models. This was to determine whether load managed goalies performed better with greater workloads in the playoffs (one of the potential benefits of load management). All tests were 2-tailed and statistical significance was set at the P < 0.05 level for the primary outcome and the exploratory analyses, and at the P < 0.01 level for all secondary outcomes due to concerns with multiple comparisons. All statistical analyses were completed using SPSS Statistics Version 26 (IBM).
Power Analysis
A post hoc power analysis was performed to evaluate whether the study was underpowered to detect a difference of a moderate effect size. The G*Power 3.1 (Heinrich Heine Universität Düsseldorf) software was used to perform the power calculation. Based on an F2 of 0.15 (moderate effect size), 19 3 predictors, alpha value of 0.05, and the sample size of 111, the study was found to have power of 93.5%. At an F2 of 0.10 (small effect size, 19 and with the same parameters as above), the power was 79.2%.
Results
Descriptive Statistics
A total of 51 goalies were eligible for inclusion and contributed 111 goalie-seasons to the analysis. The median number of seasons contributed per goalie was 2 (range, 1-6). No outliers were identified. Out of 31 teams, 29 (93.5%) were represented. Residual plots for all outcome variables satisfied homoscedasticity and normality. There were missing values for 2 (1.8%) and 13 (11.7%) goalie-seasons for ΔQS% and ΔGSAA/60, respectively. All independent variables and performance metrics were normal in distribution based on visual analysis of histograms. Mean age at the start of the included seasons was 28.8 (3.53) years. A total of 65 goalies (58.6%) missed >1 game in a given season due to injuries, and the median time missed due to injury was 7 games (range, 1-31). The mean number of regular season starts was 50.1 (14.21). There was, on average, poorer performance in the postseason compared with the regular season across all performance metrics (Table 2).
Descriptive Statistics
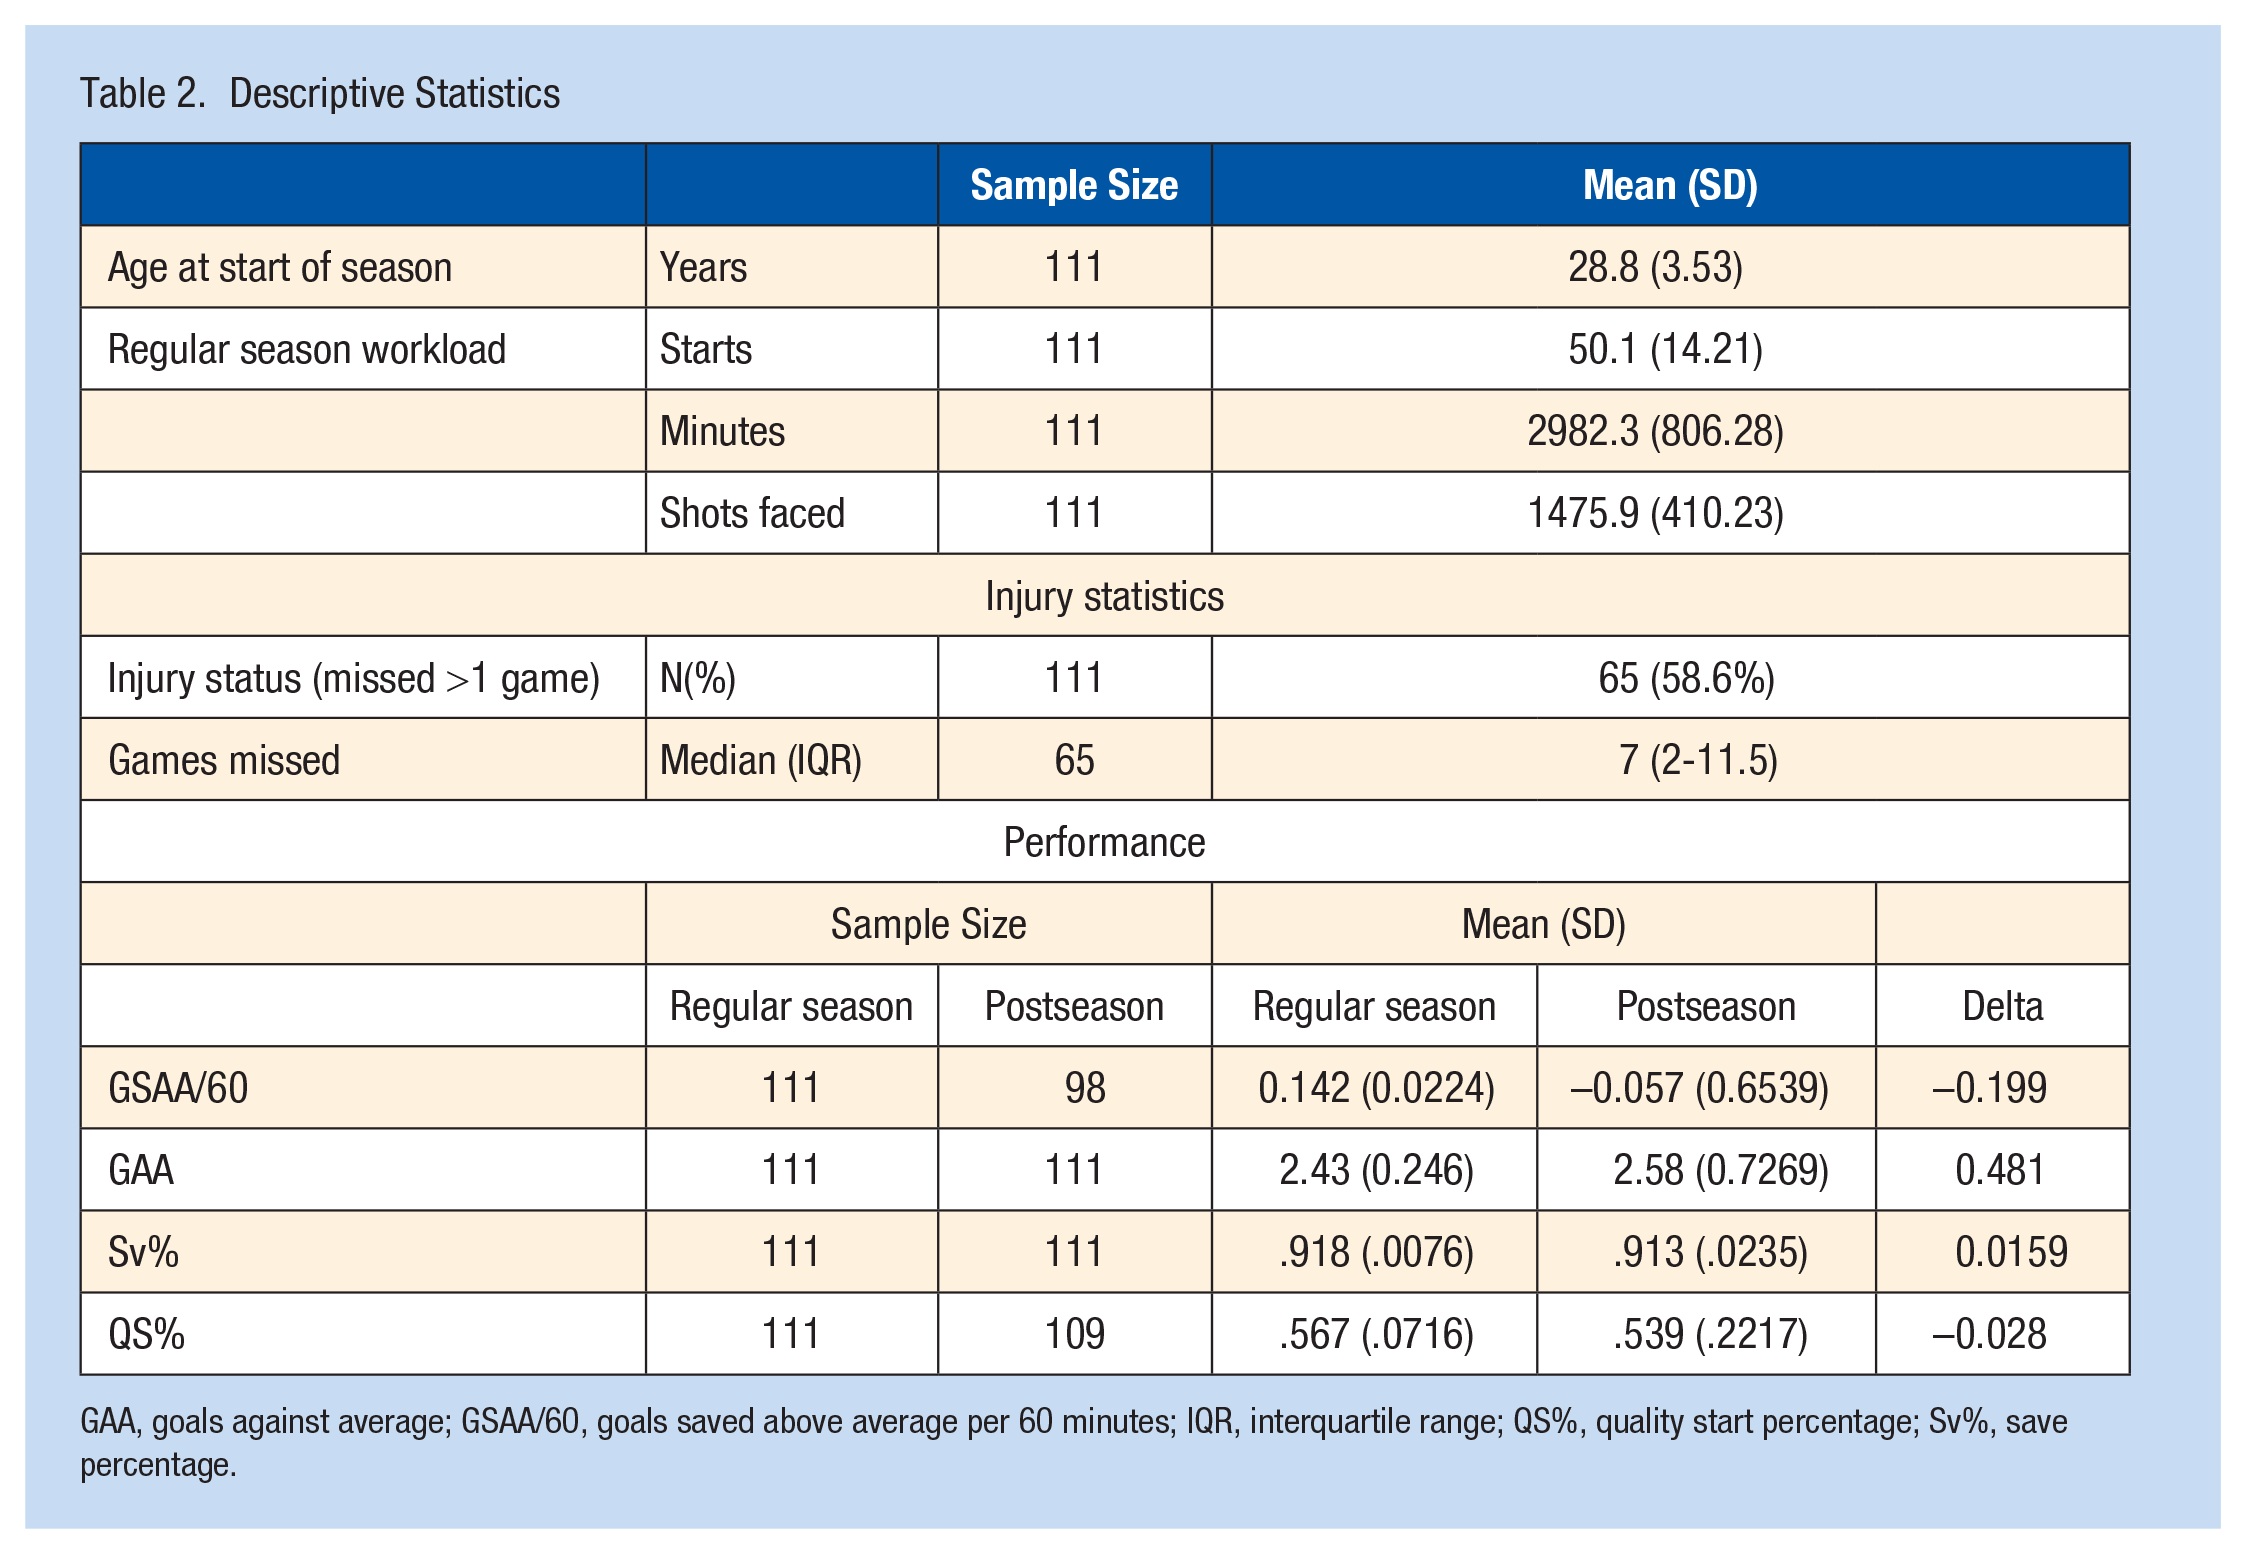
GAA, goals against average; GSAA/60, goals saved above average per 60 minutes; IQR, interquartile range; QS%, quality start percentage; Sv%, save percentage.
Regression Analysis
The results of the regression model for the primary outcome (ΔGSAA/60), with regular season starts as a continuous variable, indicated that the 5 predictors explained only 6.8% of the variance in postseason performance, and that this relationship was not significant (R2 = 0.068, F(5,92) = 1.335, P = 0.26). The results of the regression models for ΔSv%, ΔQS%, and ΔGAA explained between 1.8% and 2.7% of the variance and were not significant (Table 3).
Statistics for primary multivariable regression models
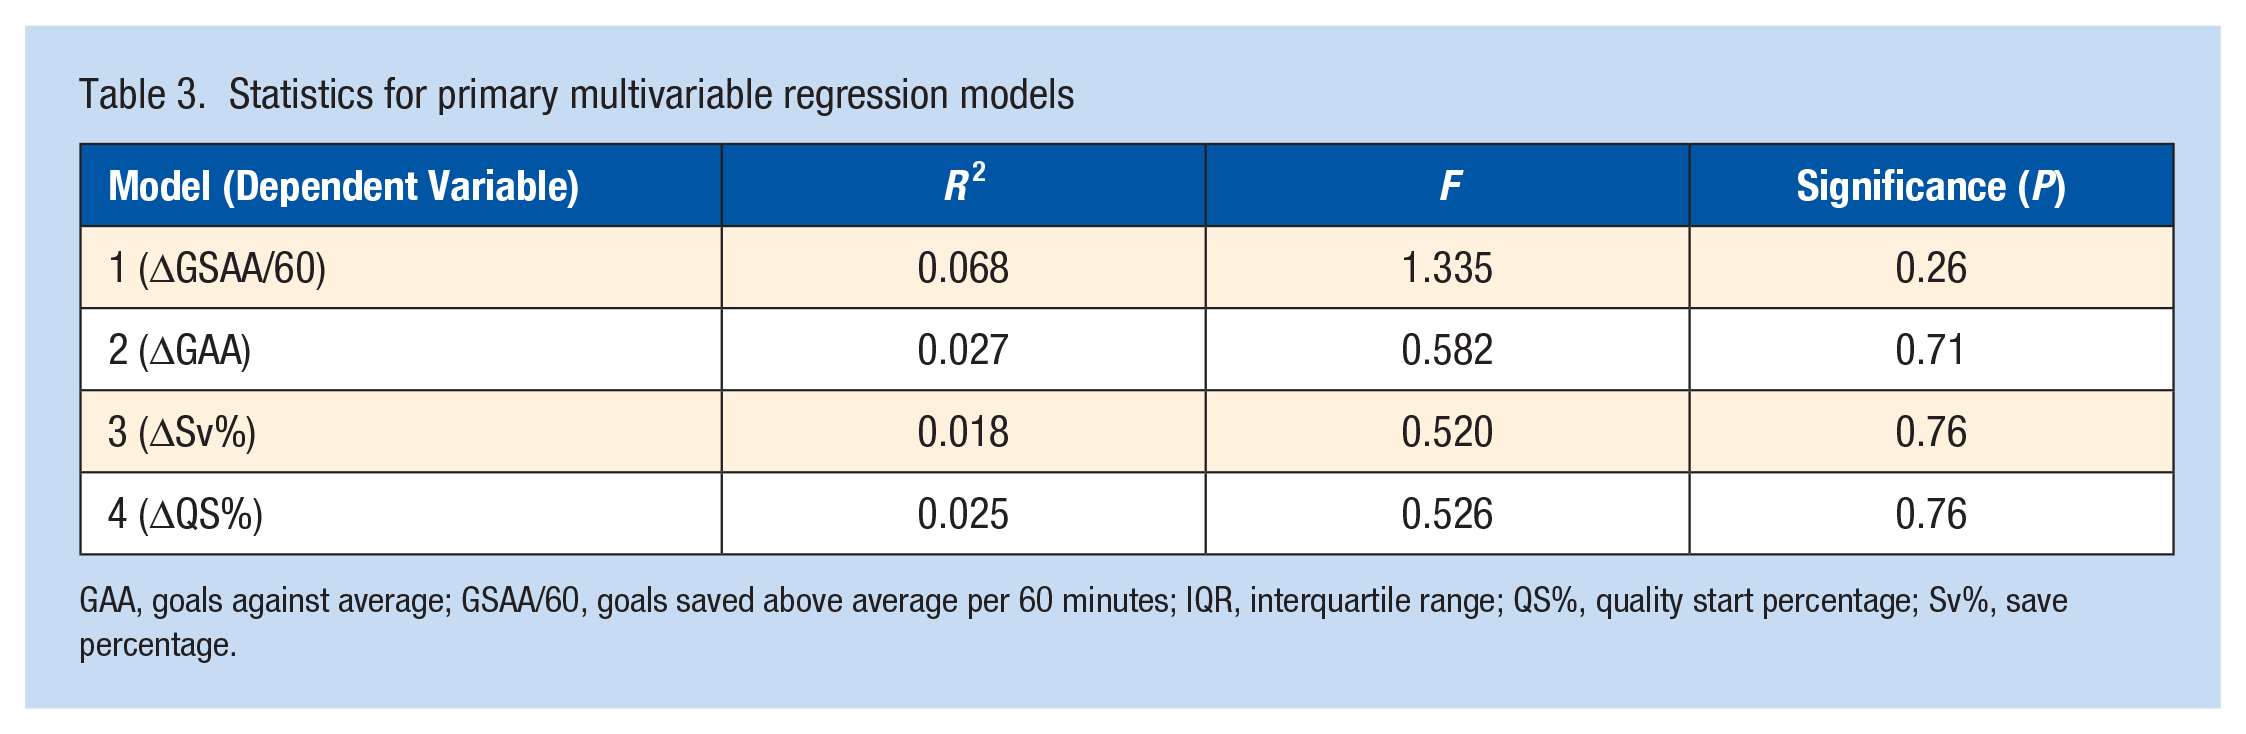
GAA, goals against average; GSAA/60, goals saved above average per 60 minutes; IQR, interquartile range; QS%, quality start percentage; Sv%, save percentage.
Other Analyses
None of the multivariable exploratory analysis models, in which regular season starts was treated as a dichotomous variable with 60 starts as the threshold, were found to be significant at the P < 0.05 level. The sensitivity analysis performed using only the most recent season for each goalie did not reveal any models to be significant at the thresholds set a priori; however, the model for ΔQS% was significant at the P < 0.05 level (R2 = 0.228, F(5,43) = 2.538, P = 0.04). None of the post hoc models, which included playoff minutes played as an independent variable, were found to be significant.
Discussion
The key finding of this study is that regular season game workload does not predict postseason performance among NHL goalies. This finding brings into doubt the version of “load management” discussed most frequently in the media, which is distinct from the well-established sports scientific version of the concept. Given that there does not appear to be a significant relationship between regular season game workload and postseason performance, the finding that no goalie starting >60 games has won a championship since 2009 may be anecdotal, or simply a positive feedback cycle. As teams pay greater attention to goalie workloads, goalies may also be starting fewer games in general, therefore making it more likely that the starting goalie on the championship team has started <60 games each year.
Goaltending is a unique position characterized by periods of short explosive movements on a background of long periods of relative rest. 22 Interestingly, despite covering far smaller areas of the ice, goalies have been shown to have higher sweat rates, and greater physiological dehydration despite having higher fluid intake compared with position players (“skaters”). 14 Clearly, total game workload is only one of a multifactorial set of variables which determine in-game ice hockey performance. Multiple previous studies have demonstrated that strength, body composition, and physical fitness are important determinants of on-ice performance, though most studies have focused on skaters.15,17,22 In the well-established scientific practice of load management, these factors are important considerations in creating an effective and individualized load management plan.
In a study of Division I collegiate men’s ice hockey players, Kniffin et al 12 found that strength and conditioning measures such as benchpress performance were related to playing time, which in turn translated into points scored. Similarly, Peyer et al 15 found that athletes who performed better on a range of strength and conditioning tasks were more likely to be in the top 2 (out of 4) lines and to have a better ± statistic (a net value of even strength goals for and against the team while a player is on the ice). A study of women’s international ice hockey teams found that athletes from countries with the best team records weighed more, had less body fat, greater muscular strength, and higher aerobic capacity compared with those with poorer records. 17 Interestingly, a study of Division I men’s ice hockey players also found that athletes with a higher body mass index (BMI, ≥25 kg/m2) had 2.1 times greater odds of injury compared with those with a BMI <25 kg/m. 10 Understanding the predictors of improved on-ice performance can help coaches and medical staff to optimize athletes’ off-ice time, and to effectively use individualized load management strategies in conjunction with focused strength and conditioning work to maximize athlete performance while minimizing risk of injury.
Despite the findings of this study, the general concept of load management as a personalized strategy (rather than a single general cut-off) may still have value in the NHL and other high-level sports. It may well be the case that some goalies thrive with heavier workloads, while others perform better with a more balanced approach, and appropriate thresholds may vary based on individual player circumstances. These patterns may also change throughout the different phases, or injury timelines, of each athlete’s career. For example, deliberate load management is often credited anecdotally with contributing to the success of National Basketball Association (NBA) player Kawhi Leonard and his team at the time, the Toronto Raptors. Following an injury-riddled season in which he played only 9 games, Leonard and the Raptors won an NBA championship with Leonard earning finals’ MVP honours. 18 Furthermore, Leonard missed only 4 games due to injuries in that season.
The strengths of this study include a robust dataset with verified accuracy (both by the NHL and in duplicate by the authors), and limited missing datapoints. As well, it is a scientific approach to a common sports medicine issue that has received a lot of media attention, but lacks evidence to support its widespread use.
The limitations of this study stem from its retrospective nature, and the fact that there was no way to distinguish between intentional and unintentional load management. Furthermore, although the study was sufficiently powered to detect moderate to large differences, it was slightly underpowered to detect a smaller effect size. In addition, the data were not collected by medical personnel, and were not collected for the specific purposes of this study or any type of similar analysis. As well, workload was evaluated based only on regular season in-game workload, which does not take into account all the other ways NHL athletes prepare for games, including practices and dryland training, and thus may not be a comprehensive representation of true season-long workload. Furthermore, while injury reporting is mandatory in the NHL, formal reporting and man-games lost may not necessarily account for more minor, lingering injuries, which can affect workload and performance without being officially recorded in the injury database. Finally, although the data were collected from verified NHL sources, there is no way to ensure that all data were collected and entered correctly before being made publicly available.
Future studies could compare these data with goalie performance before the 2008-2009 season, when starting ≥60 games was much more common. As well, future studies could incorporate knowledge of whether a goalie is being actively load-managed or not, which may provide a more specific answer. Such studies face certain challenges however. For example, it would be nearly impossible to perform a randomized controlled trial (RCT) to answer this question in the NHL. Teams are unlikely to surrender control of their goalie schedules to chance, and there may be financial and contract barriers to such a study. Furthermore, compared with many other professional sports, the NHL is notoriously opaque with regards to player injuries. As well, teams may be reluctant to share their specific tactics with researchers. Thus, it may not be feasible to obtain transparent information about each team and their load management strategies. An RCT may be feasible in a collegiate or minor league setting, where the stakes are lower and teams are often more willing to experiment. As well, a prospective cohort study in the NHL would likely be possible if collaboration from the league were to be obtained.
Conclusion
In summary, when controlling for age and injury status, regular season game workload did not predict postseason performance among NHL goalies. Individualized workload plans may be more appropriate than a single league-wide standard.