
Abstract
Background:
Understanding the epidemiology of injuries to athletes is essential to informing injury prevention efforts.
Hypothesis:
The incidence and impact of basketball-related injuries among National Basketball Association (NBA) players from 2013-2014 through 2018-2019 is relatively stable over time.
Study Design:
Descriptive epidemiology study.
Level of Evidence:
Level 3.
Methods:
Injuries from 2013-2014 through 2018-2019 were analyzed using the NBA Injury and Illness Database from an electronic medical record system. Descriptive statistics were calculated for injuries by season, game-loss, and onset. Incidence rates were estimated using Poisson models and linear trend tests.
Results:
Between 552 and 606 players participated in ≥1 game per season during the study. Annual injury incidence ranged from 1550 to 1892, with 33.6% to 38.5% resulting in a missed NBA game. Game-loss injury rates ranged from 5.6 to 7.0 injuries per 10,000 player-minutes from 2014-2015 through 2018-2019 (P = 0.19); the rate was lower in 2013-2014 (5.0 injuries per 10,000 player-minutes), partly due to increased preseason injury rates and transition of reporting processes. The 6-year game-loss injury rate in preseason and regular season games was 6.9 (95% CI 6.0, 8.0) and 6.2 (95% CI 6.0, 6.5) injuries per 10,000 player-minutes; the rate in playoff games was lower (P < 0.01) at 2.8 (95% CI 2.2, 3.6). Most (73%) game-loss injuries had acute onset; 44.4% to 52.5% of these involved contact with another player.
Conclusion:
From 2013-2014 through 2018-2019, over one-third of injuries resulted in missed NBA games, with highest rates of game-loss injuries in preseason games and lowest rates in playoff games. Most game-loss injuries had acute onset, and half of those involved contact with another player.
Clinical Relevance:
These findings - through reliable data reporting by team medical staff in an audited system - can guide evidence-based injury reduction strategies and inform player health priorities.
Basketball is one of the most popular sports globally, with an estimated 450 million players participating in recreational and professional settings.1,8 Despite the sport’s popularity, only limited comprehensive descriptions of injury incidence and impact based on high-quality, reliable data exist; such data are essential to informing injury prevention efforts. 5
Existing descriptions of injury incidence among National Basketball Association (NBA) players are either based on publicly available sources, which have significant limitations,5,10 or focus on data collected before the implementation of the NBA electronic medical record (EMR) Injury and Illness database.3,9 This centralized, standardized, and audited database provides the ability to analyze injuries as reported by medical staff. 7 Moreover, it is linked with other relevant health-related and basketball statistical data sources, enabling a robust approach to assessing injury occurrence, rates, and settings.
These data have been central to NBA team and league injury initiatives, ranging from investigation into player conditioning to assessing aspects of the NBA regular season schedule. 6 An epidemiologic understanding of the overall injury profile in the league is important for guiding player health priorities in the NBA and in the sport overall. Such data also serve as the basis for monitoring the potential impact of future injury reduction strategies and can influence game play standards, guidelines, rules, and treatment of injuries across all levels of sports. 2
The purpose of this study was to determine incidence and impact of basketball-related injuries among NBA players from 2013-2014 through 2018-2019. Our hypothesis is that the incidence and impact of basketball-related injuries in the NBA is relatively stable over the 6-year study period, as there have been no major changes to rules, regulations, or season structure.
Methods
After approval by the Hospital for Special Surgery Institutional Review Board (January 19, 2022; Study No. 2020-2289), the NBA, the National Basketball Players Association, and the Research Committee of the NBA Physicians Association, a retrospective cohort study was conducted of all injuries reported in the NBA Injury and Illness Database from 2013-2014 through 2018-2019.
Data Source
Injury and illness reporting is mandated and standardized across all 30 teams in the NBA. 6 Injuries are entered into the EMR by team medical staff in structured fields, including prespecified dropdown fields detailing characteristics such as body part, laterality, and injury type. The staff are trained annually, and data are subject to regular auditing to ensure data completeness and accuracy. Player game statistics are tracked by the NBA, including the total number of minutes played per player per game, which is integrated into the injury database.
Definitions
Team medical staff are required to report injuries and illnesses that result in ≥1 of the following: a missed NBA game or practice, the issuing of a prescription medication, or the need for a physician visit or specific medical care as previously described. 7 All injuries sustained during team-related activities were included for analyses, regardless of resultant time-loss from NBA competition.
Injuries are documented as acute (related to specific, identifiable events) or nonacute (unrelated to specific events, including insidious injuries and chronic injuries that require ongoing intervention). Additional injury characteristics are captured in the database, including season timepoint (offseason, preseason, regular season, or playoffs), setting at time of injury (game, practice, or other), mechanism of injury (contact or noncontact), and injury type. Because medical staff are required to document player game participation in the EMR, injuries can be searched based on whether they resulted in a missed game or impacted a player’s availability to participate in games or training (eg, teams can specify status for each injury as “not available for participation,” “available for limited participation,” or “availability for full participation”). A “game-loss injury” is defined as an injury that resulted in ≥1 missed NBA game. If the athlete was available to play in a game (either limited or full) but did not play for sport-related reasons or did not play due to rest or load management, games missed were not counted toward game loss due to injury. Only games missed specifically due to a particular injury were considered.
The number of games missed for each injury type was calculated in 2 different ways: (1) the total number of player-games in which the player could not participate during each season because of a team-related injury, providing in-season impact to teams and the league; and (2) across seasons as the total number of player-games missed for a specific injury, providing clinical impact of the injury measured by time missed.
For this study, time-at-risk was defined in 2 ways: (1) 1 player participating in 1 game (by player-games); and (2) by player-minutes, calculated as the total number of minutes 1 player participates.
Statistical Analysis
Descriptive statistics calculated for injuries included counts, percentages, means and standard deviations, medians, and interquartile ranges (IQRs). Game incidence rates were calculated per 1000 player-games and per 10,000 player-minutes of participation, accompanied by 95% CIs estimated through Poisson models. Differences in game incidence rates were estimated using Poisson models, with linear trend tests used to evaluate change over NBA seasons. All analyses were performed using SAS Version 8.2.
Results
Overall Injury Incidence
Between 552 and 606 players per season participated in ≥1 game (preseason, 78-118 games; regular season, 1230 games; playoffs, 79-89 games) and were included in this study (Table 1). On average, players participated in 52 games per regular season. The number of players playing in ≥1 game increased by approximately 8.9% over the study period due to the expansion of rosters from 15 to 17 players with the addition of up to two 2-way contract players in 2017-2018. All 2-way contract players must have ≤3 years of NBA service and split time between the NBA (for ≤50 NBA games) and the G League during the season. The incidence of all reported injuries from offseason through playoffs ranged from 1550 (2013-2014) to 1892 (2018-2019) injuries per season. Injuries in the first 2 years of the study increased from 1550 (2013-2014) to 1689 (2014-2015), during a time when reporting processes and auditing efforts were meaningfully upgraded, particularly for injury reporting in the offseason and preseason.
Time-at-risk and injury incidence by season, 2013-2014 through 2018-2019.
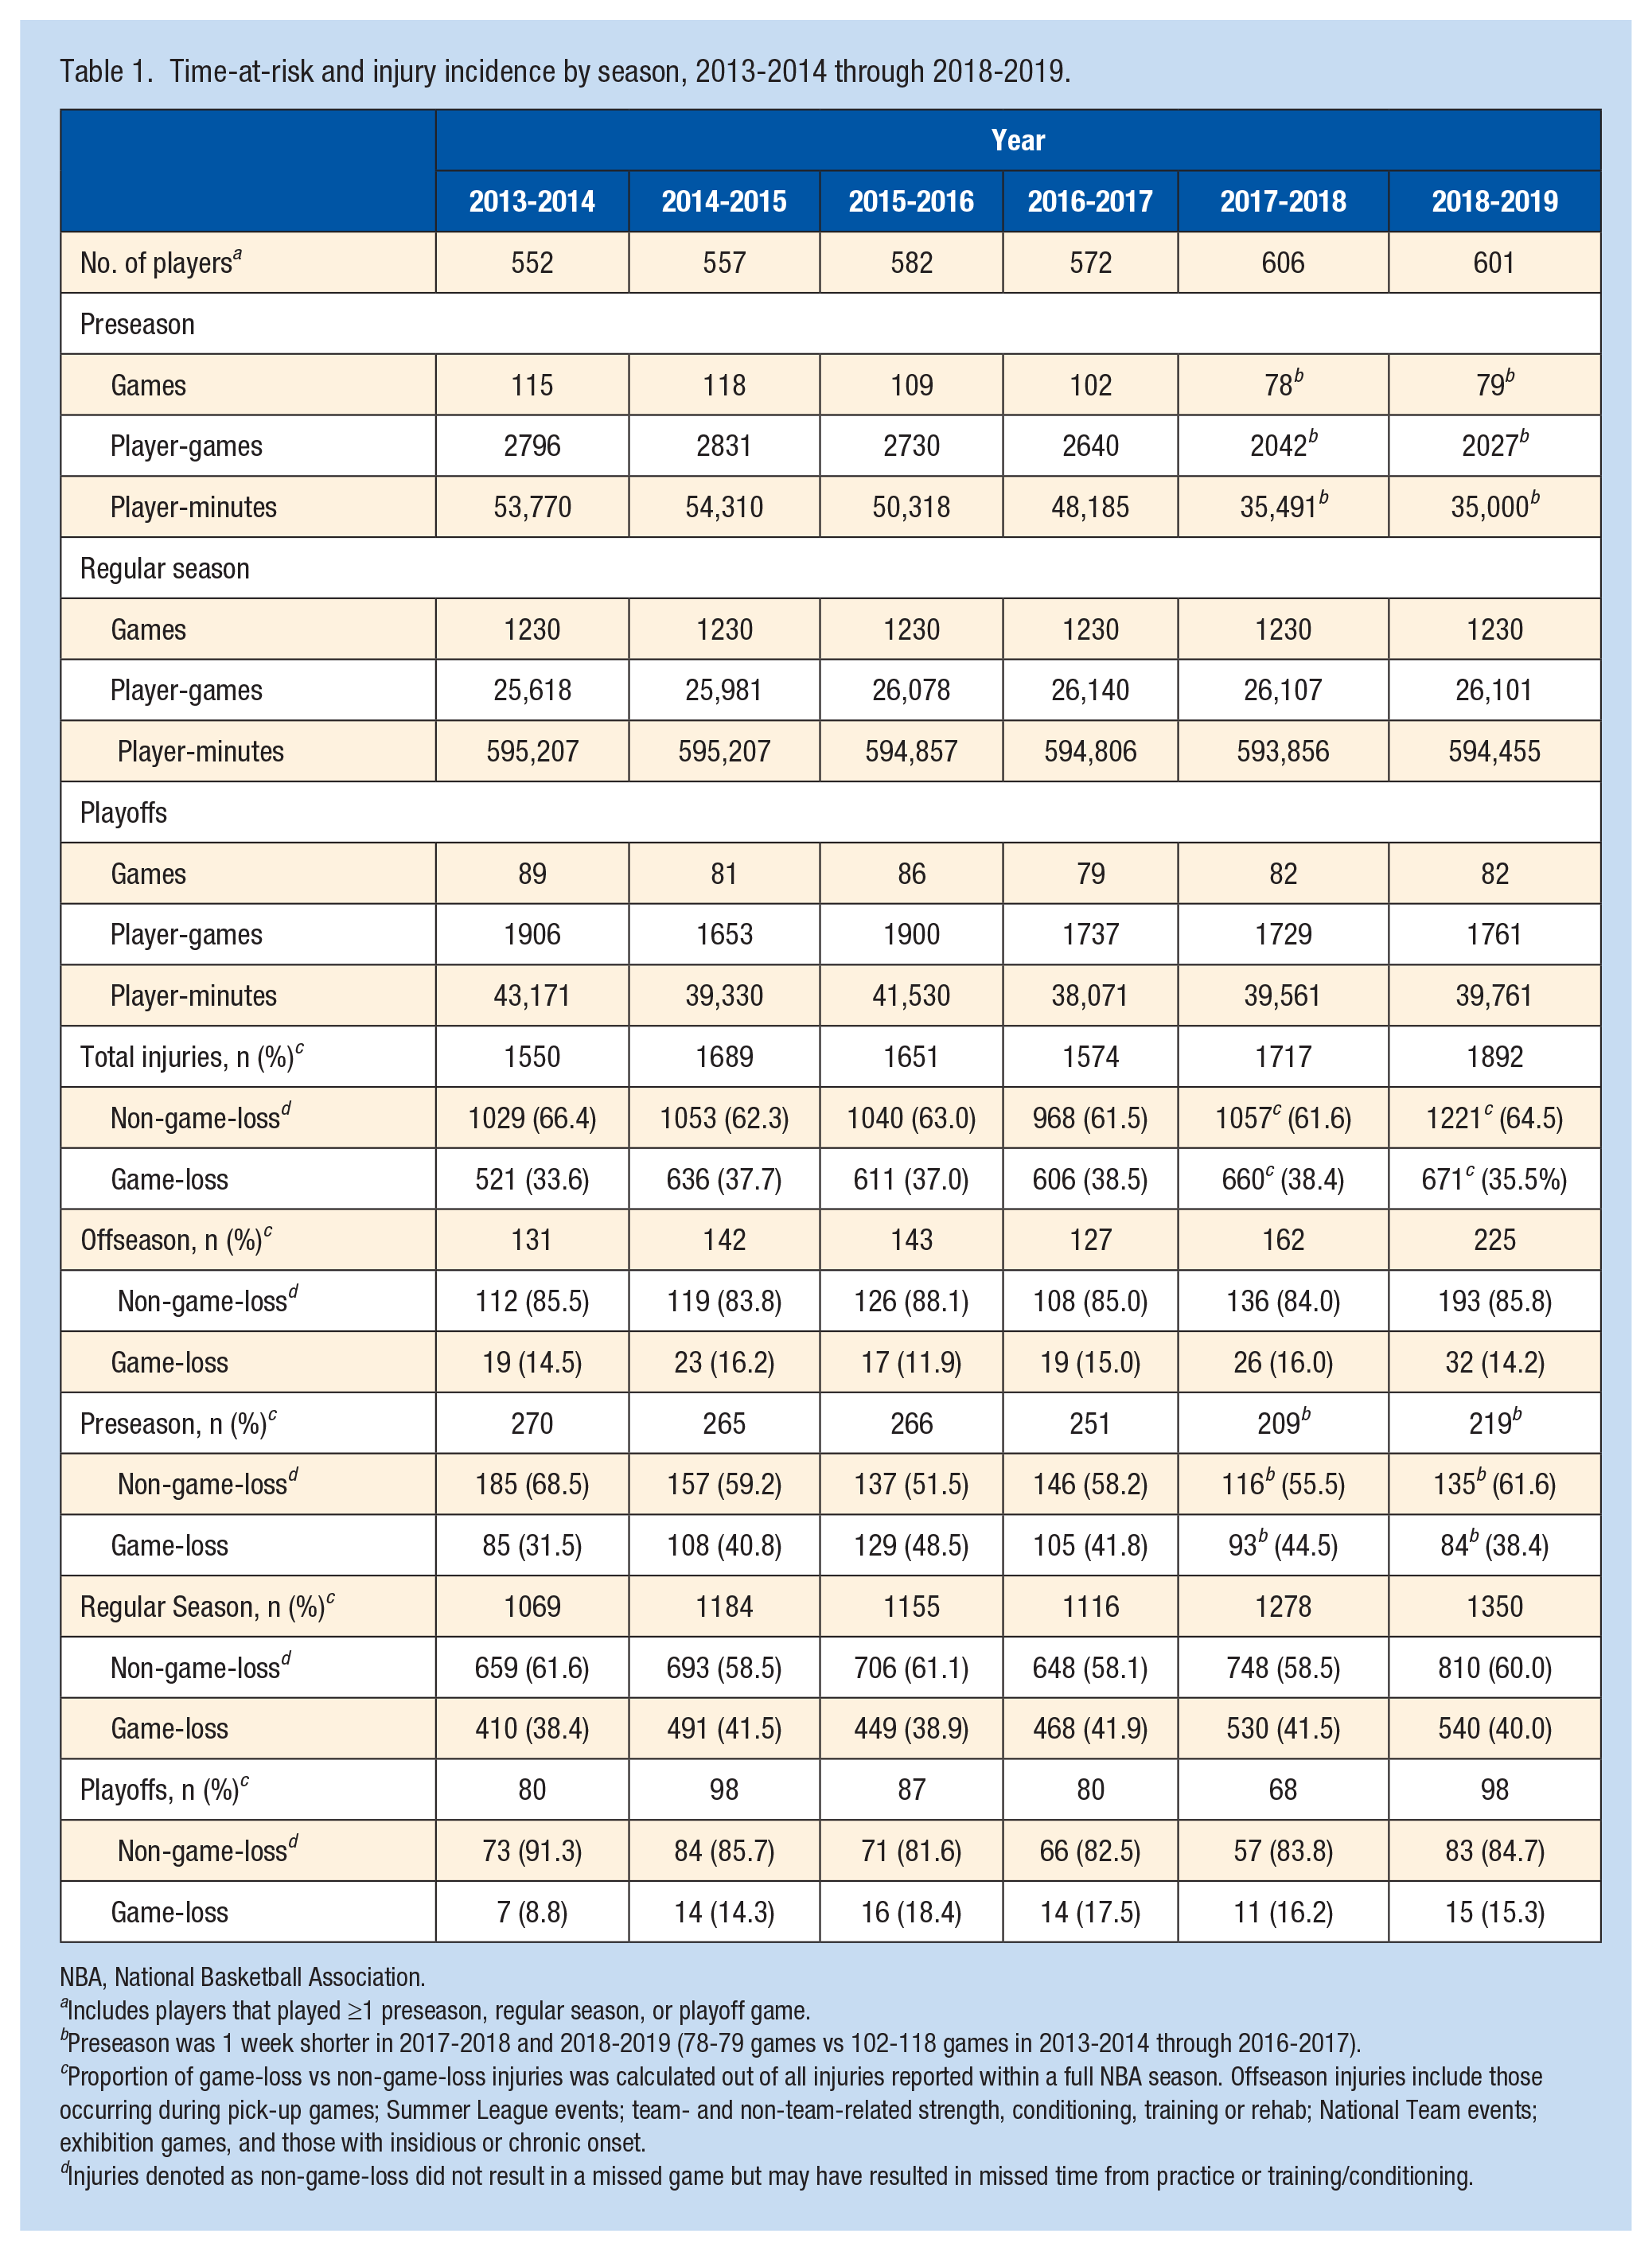
NBA, National Basketball Association.
Includes players that played ≥1 preseason, regular season, or playoff game.
Preseason was 1 week shorter in 2017-2018 and 2018-2019 (78-79 games vs 102-118 games in 2013-2014 through 2016-2017).
Proportion of game-loss vs non-game-loss injuries was calculated out of all injuries reported within a full NBA season. Offseason injuries include those occurring during pick-up games; Summer League events; team- and non-team-related strength, conditioning, training or rehab; National Team events; exhibition games, and those with insidious or chronic onset.
Injuries denoted as non-game-loss did not result in a missed game but may have resulted in missed time from practice or training/conditioning.
Game-Loss Injuries
From 2013-2014 through 2018-2019, approximately one-third (33.6%-38.5% over 6 years) of injuries resulted in missed games. Over the same period, 31.5% to 48.5% of preseason and 38.4% to 41.9% of regular season injuries resulted in ≥1 missed game (Table 1).
Among all game-loss injuries, 12.5% to 21.1% occurred during preseason and 73.5% to 80.5% occurred during regular season. Most preseason game-loss injuries occurred during practice (36.5%-51.2%), while most regular season game-loss injuries occurred during games (73.3%-79.6%) (Table 2).
Distribution of game-loss injuries by game/practice, 2013-2014 through 2018-2019 preseason and regular season
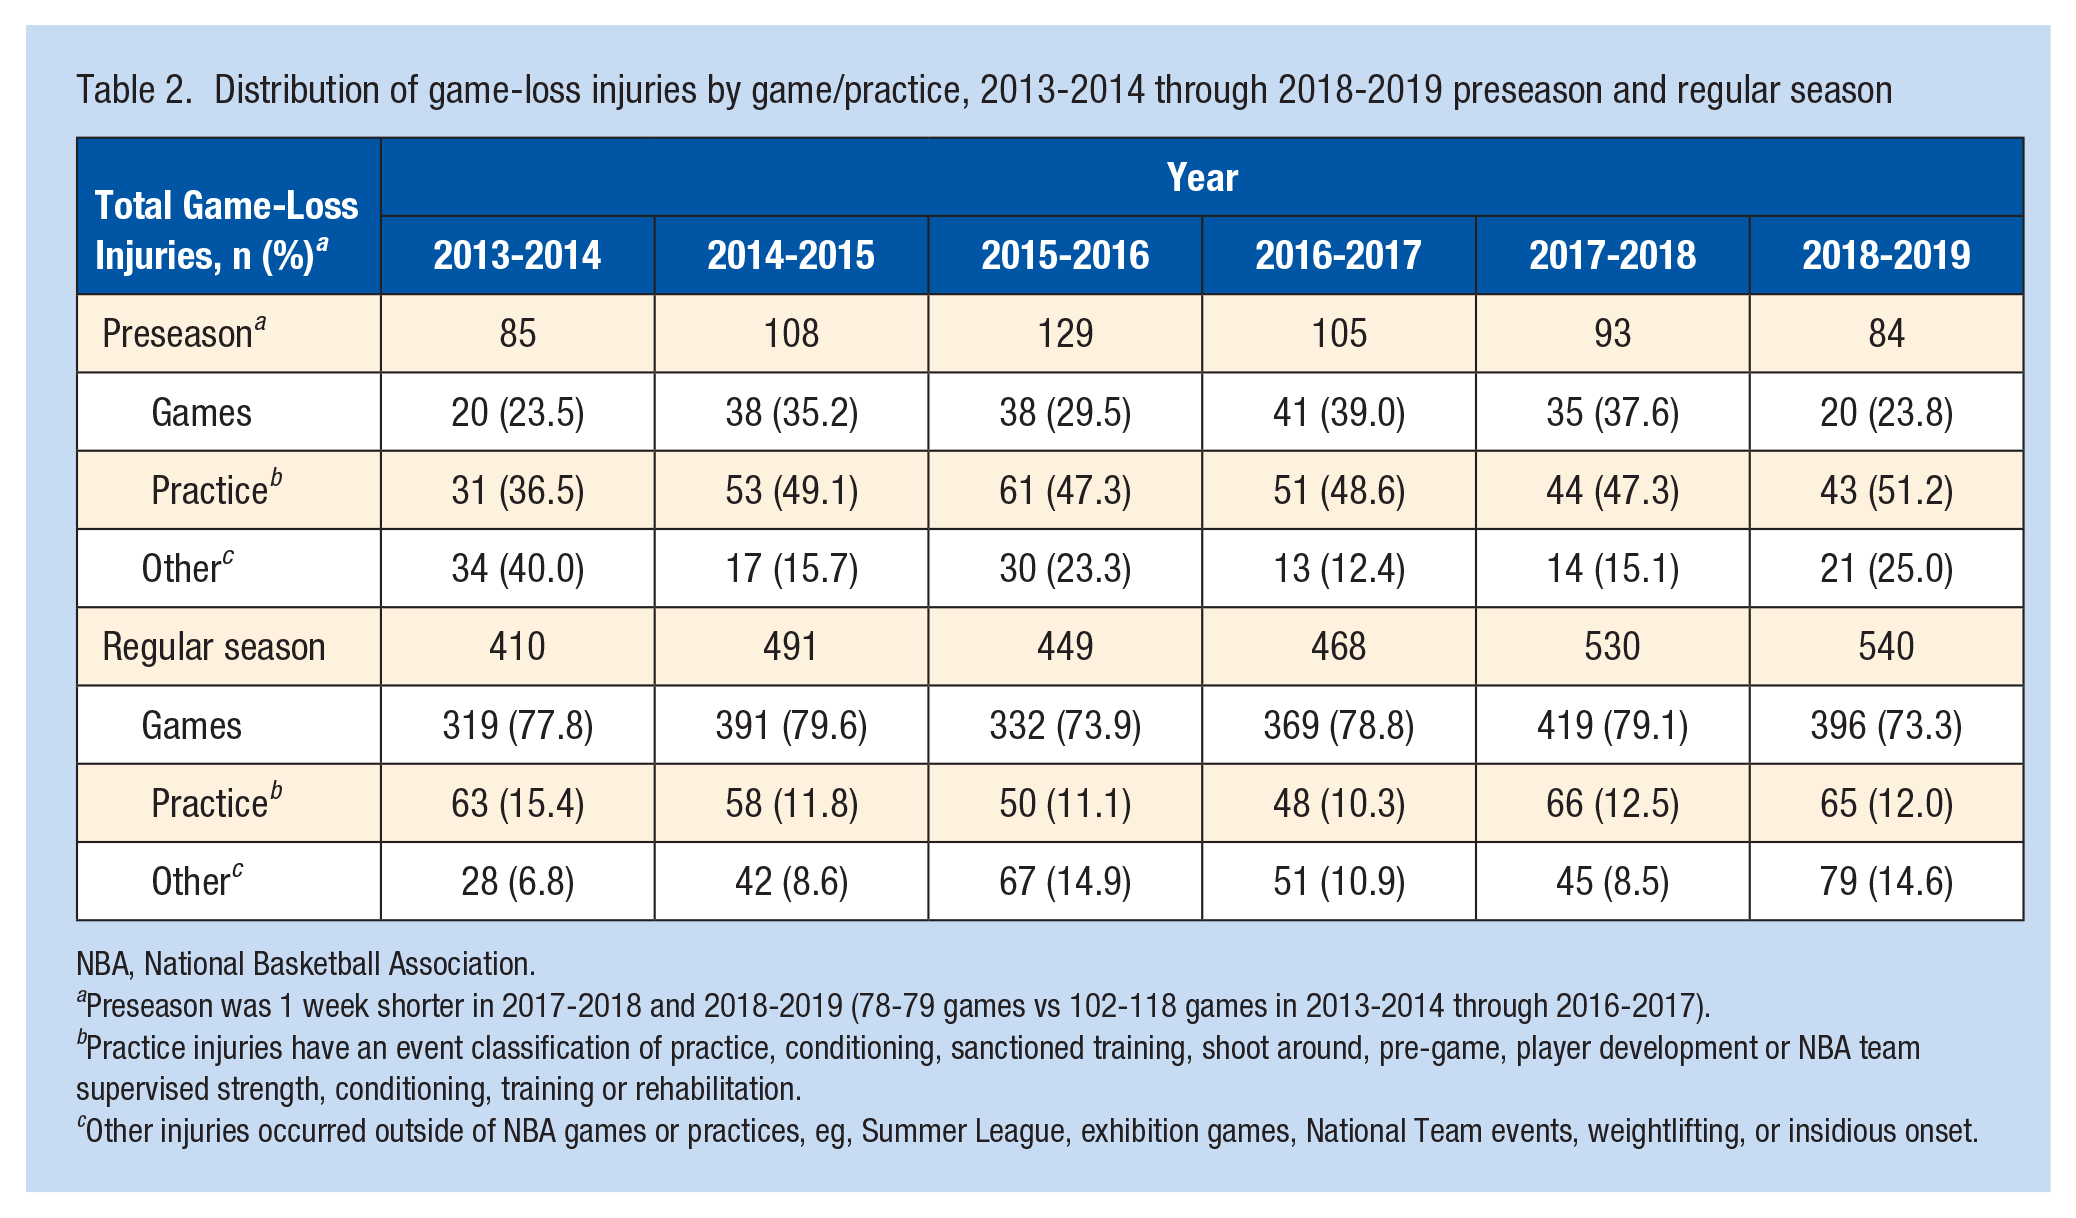
NBA, National Basketball Association.
Preseason was 1 week shorter in 2017-2018 and 2018-2019 (78-79 games vs 102-118 games in 2013-2014 through 2016-2017).
Practice injuries have an event classification of practice, conditioning, sanctioned training, shoot around, pre-game, player development or NBA team supervised strength, conditioning, training or rehabilitation.
Other injuries occurred outside of NBA games or practices, eg, Summer League, exhibition games, National Team events, weightlifting, or insidious onset.
The 6-year game-loss injury rate sustained during games was 6.1 per 10,000 player-minutes (95% CI, 5.8, 6.3). The rate in the 2018-2019 season (6.4 per 10,000 player-minutes; 95% CI, 5.8, 7.0) was significantly higher (P < 0.01) than that in 2013-2014 (5.0 per 10,000 player-minutes; 95% CI, 4.5, 5.6) but was not statistically different than the rate in 2014-2015 (6.4 per 10,000 player-minutes; 95% CI, 5.8, 7.0; P = 0.93), 2015-2016 (5.6 per 10,000 player-minutes; 95% CI, 5.1, 6.2; P = 0.08), 2016-2017 (6.2 per 10,000 player-minutes; 95% CI, 5.6, 6.8; P = 0.69), and 2017-2018 (7.0 per 10,000 player-minutes; 95% CI, 6.3, 7.6, P = 0.19). Furthermore, linear trend analyses did not suggest a change in game-loss injury rates from 2014-2015 through 2018-2019 games (P = 0.19).
The total (game-loss and non-game-loss) injury rate over 6 years was 34.7 per 1,000 player-games (95% CI, 33.8, 35.6). The game-loss injury rate over 6 years in preseason games was 6.9 injuries per 10,000 player-minutes (95% CI, 6.0, 8.0) compared with 6.2 injuries per 10,000 player-minutes (95% CI, 6.0, 6.5) in regular season games (P = 0.16) (Figure 1). The injury rate was lower in playoff games (P < 0.01), with 2.8 injuries per 10,000 player-minutes (95% CI, 2.2, 3.6). Combined, the 6-year injury rate during regular season and playoff games was 6.0 injuries per 10,000 player-minutes (95% CI, 5.8, 6.3) and 13.8 injuries per 1000 player-games (95% CI, 13.2, 14.3).

Game-loss injury incidence rates in NBA games by year, 2013-2014 through 2018-2019. Preseason was 1 week shorter in 2017-2018 and 2018-2019 (78-79 games vs 102-118 games in prior seasons). Playoffs are excluded due to small numbers; rates per 1000 player-games are 3.7, 7.3, 8.4, 6.9, 6.4, 5.7 and rates per 10,000 player-minutes are 1.6, 3.1, 3.9, 3.2, 2.8, 2.5 for 2013-2014 through 2018-2019, respectively. Denominators for game-loss injury incidence rates (player-minutes) are noted in Table 1. NBA, National Basketball Association.
Onset and Contact Type
From 2013-2014 through 2018-2019, 37% (n = 2706) of acute injuries and 37% (n = 999) of nonacute injuries were game-loss injuries. Most game-loss injuries (73%) had acute onset, with a mean of 451 injuries per season compared with nonacute onset injuries (27%), with a mean of 167 injuries per season (Table 3). The number of regular season games missed was not statistically different between acute (mean, 6.3; median, 2) and nonacute (mean, 7.8; median, 2) onset game-loss injuries (P = 0.60). Among acute game-loss injuries, 48.3% were reported to involve contact with another player, while 17.7% were due to nonplayer contact (eg, floor), and 34.0% did not involve any contact. Nonacute game-loss injuries most commonly affected the knee (n = 326, 33%), foot (n = 129, 13%), lower leg (n = 127, 13%), spine (n = 124, 12%), and thigh (n = 90, 9%).
Game-loss injury incidence and regular season player-games missed stratified by acute and nonacute onset, 2013-2014 through 2018-2019
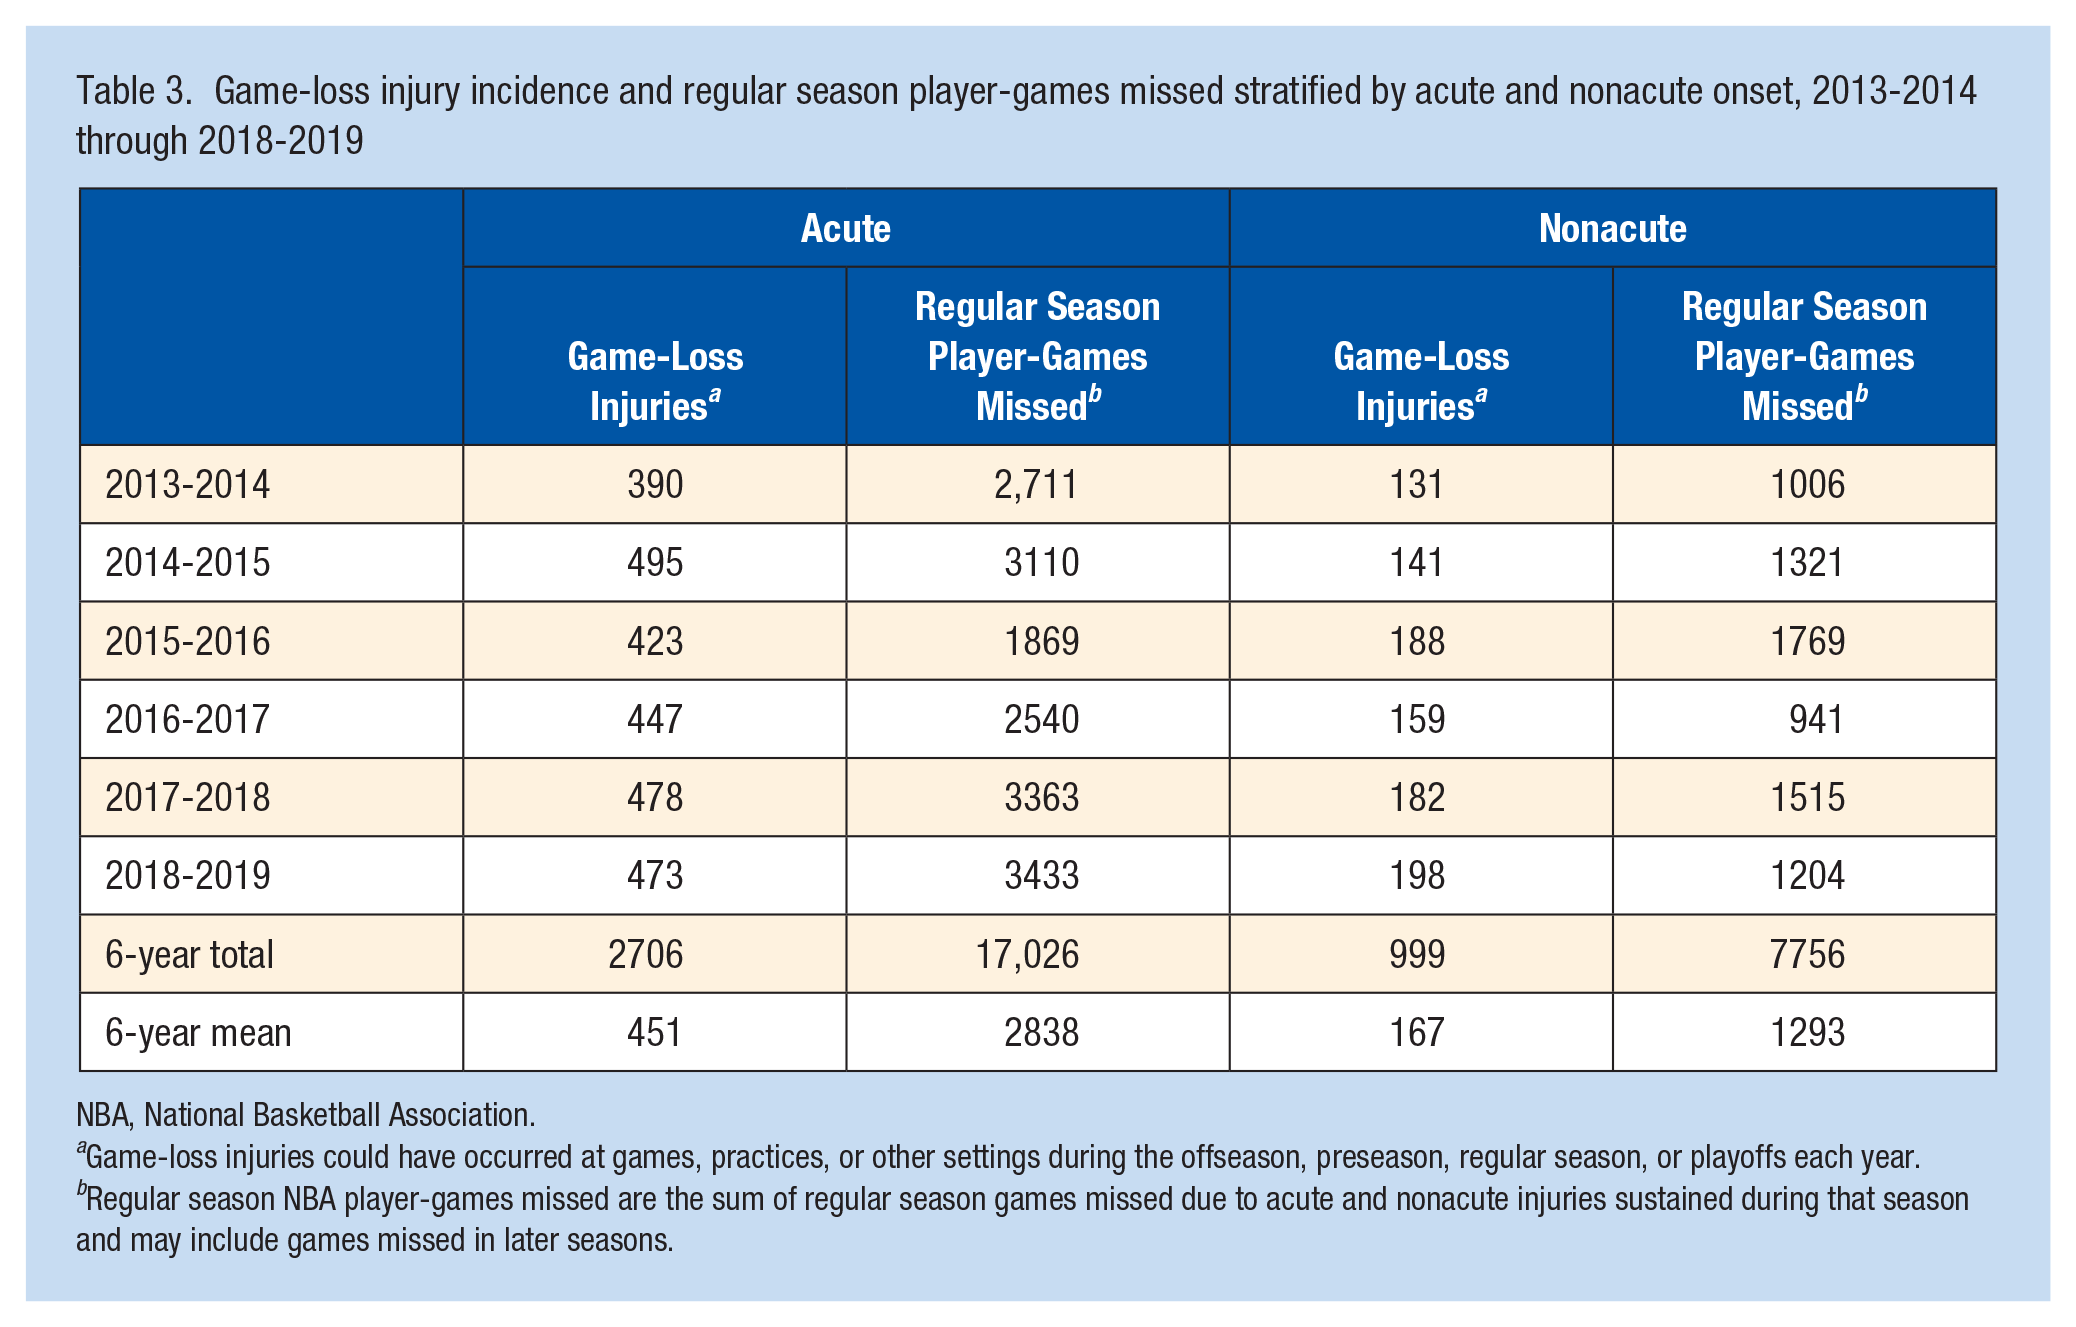
NBA, National Basketball Association.
Game-loss injuries could have occurred at games, practices, or other settings during the offseason, preseason, regular season, or playoffs each year.
Regular season NBA player-games missed are the sum of regular season games missed due to acute and nonacute injuries sustained during that season and may include games missed in later seasons.
Regular Season Player-Games Missed
Regular season games missed due to injury ranged from 3435 player-games in 2016-2017 to 4968 player-games missed in 2017-2018 (Figure 2). The impact of prior season, offseason, and preseason injuries on the ability to play during regular season is quantified in Figure 2, showing that most (64%-81%) regular season player-games missed due to injury were the result of injuries occurring during the regular season, and 19% to 36% were due to injuries occurring before the start of the regular season. On average, 2838 and 1293 regular season player-games were missed each season due to acute and nonacute injuries, respectively (Table 3).
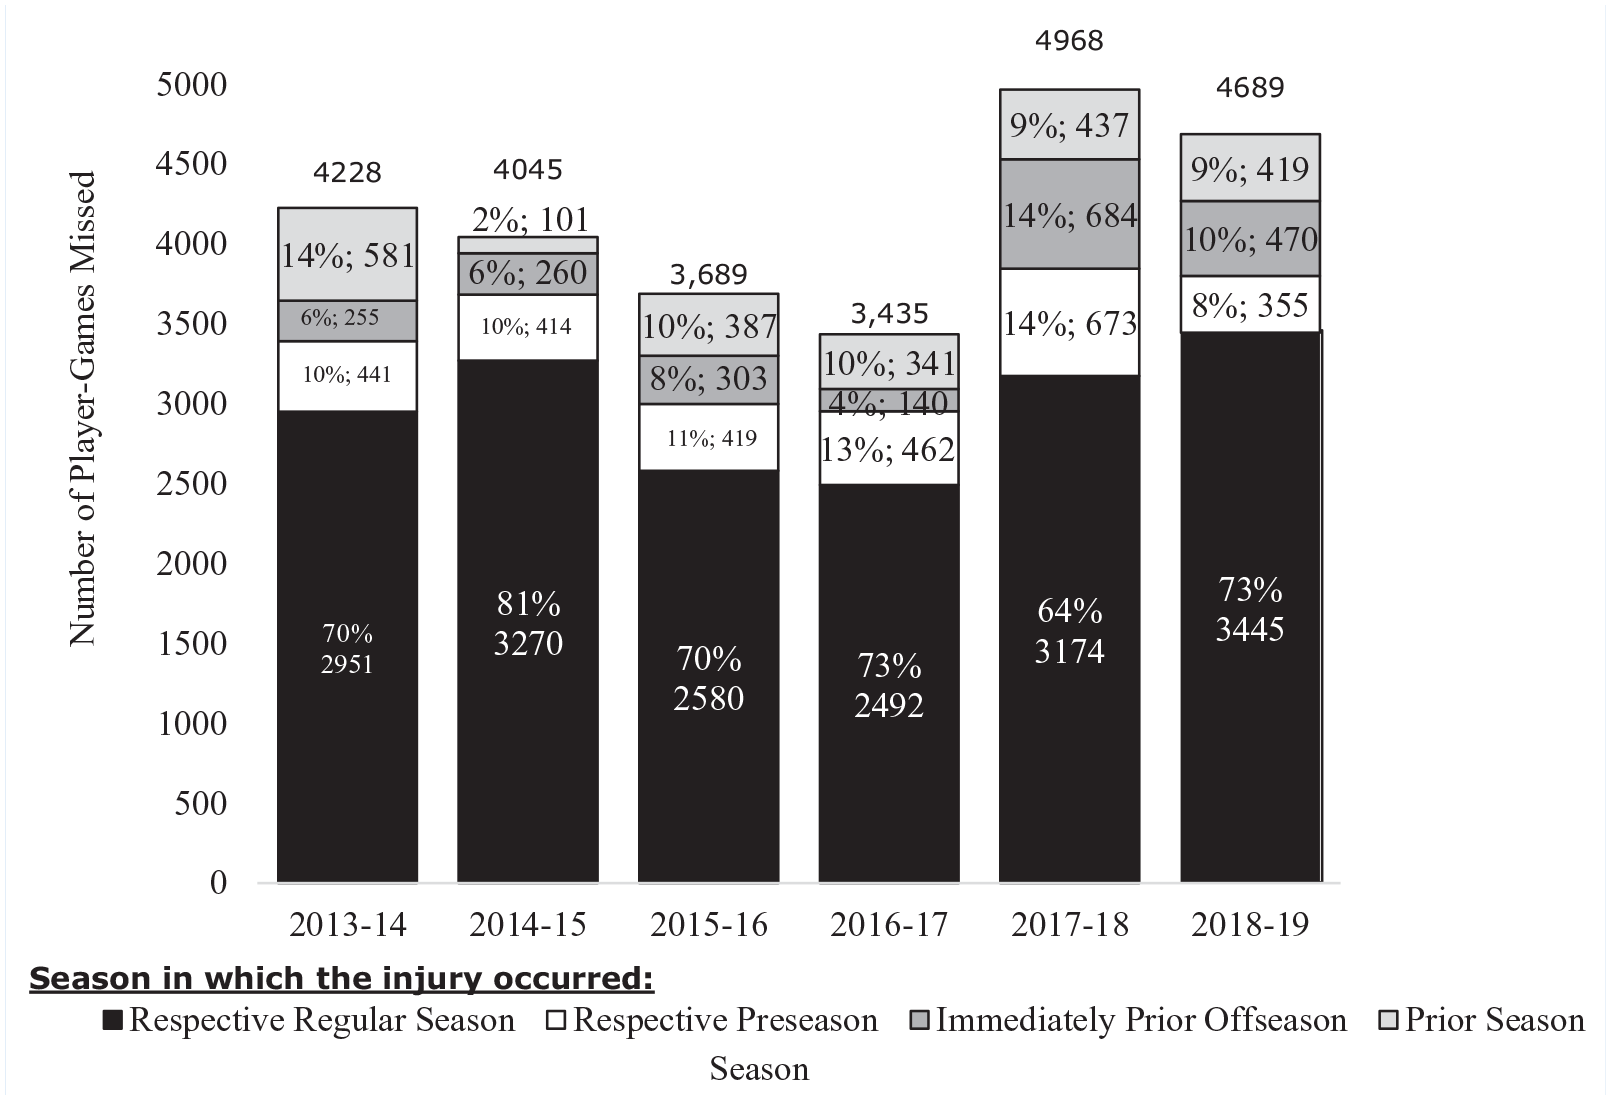
Number of regular season player-games missed due to injury by season in which the injury occurred, 2013-2014 through 2018-2019. Prior season injuries occurred before the start of the season (eg, for 2018-2019, prior season injuries occurred in 2017-2018 or earlier and resulted in games missed in the 2018-2019 regular season).
High-Frequency Injuries and Player Impact
Of the 5183 injuries occurring from 2016-2017 through 2018-2019, lower-extremity injuries were the most common among NBA players, accounting for 61.8% (n = 3201) of all injuries. The 2 most common injuries were lateral ankle sprains (n = 571, 11.0%) and hand/wrist soft tissue injuries (n = 407, 7.9%) (Table 4). Among the 25 most common injuries, lateral ankle sprains led to the most player-games missed (n = 1205), and, although 82% (n = 333) of hand/wrist soft tissue injuries did not result in missed games, the small proportion that did had a relatively high mean number of player-games missed per injury (mean [SD] = 8.4 [13.7]) (Table 4). The median player-games missed per injury among the most common game-loss injuries was generally consistent from 2016-2017 through 2018-2019. Expanding from common injuries to high-burden injuries, anterior cruciate ligament tears, isolated meniscal injuries, hand/wrist fractures, and Achilles tendon ruptures, among other injuries, meaningfully contributed to player-games missed but, depending on the injury, were relatively infrequent or represent chronic conditions managed over time.
Top 25 most common injuries from 2016-2017 through 2018-2019 with player-games missed statistics
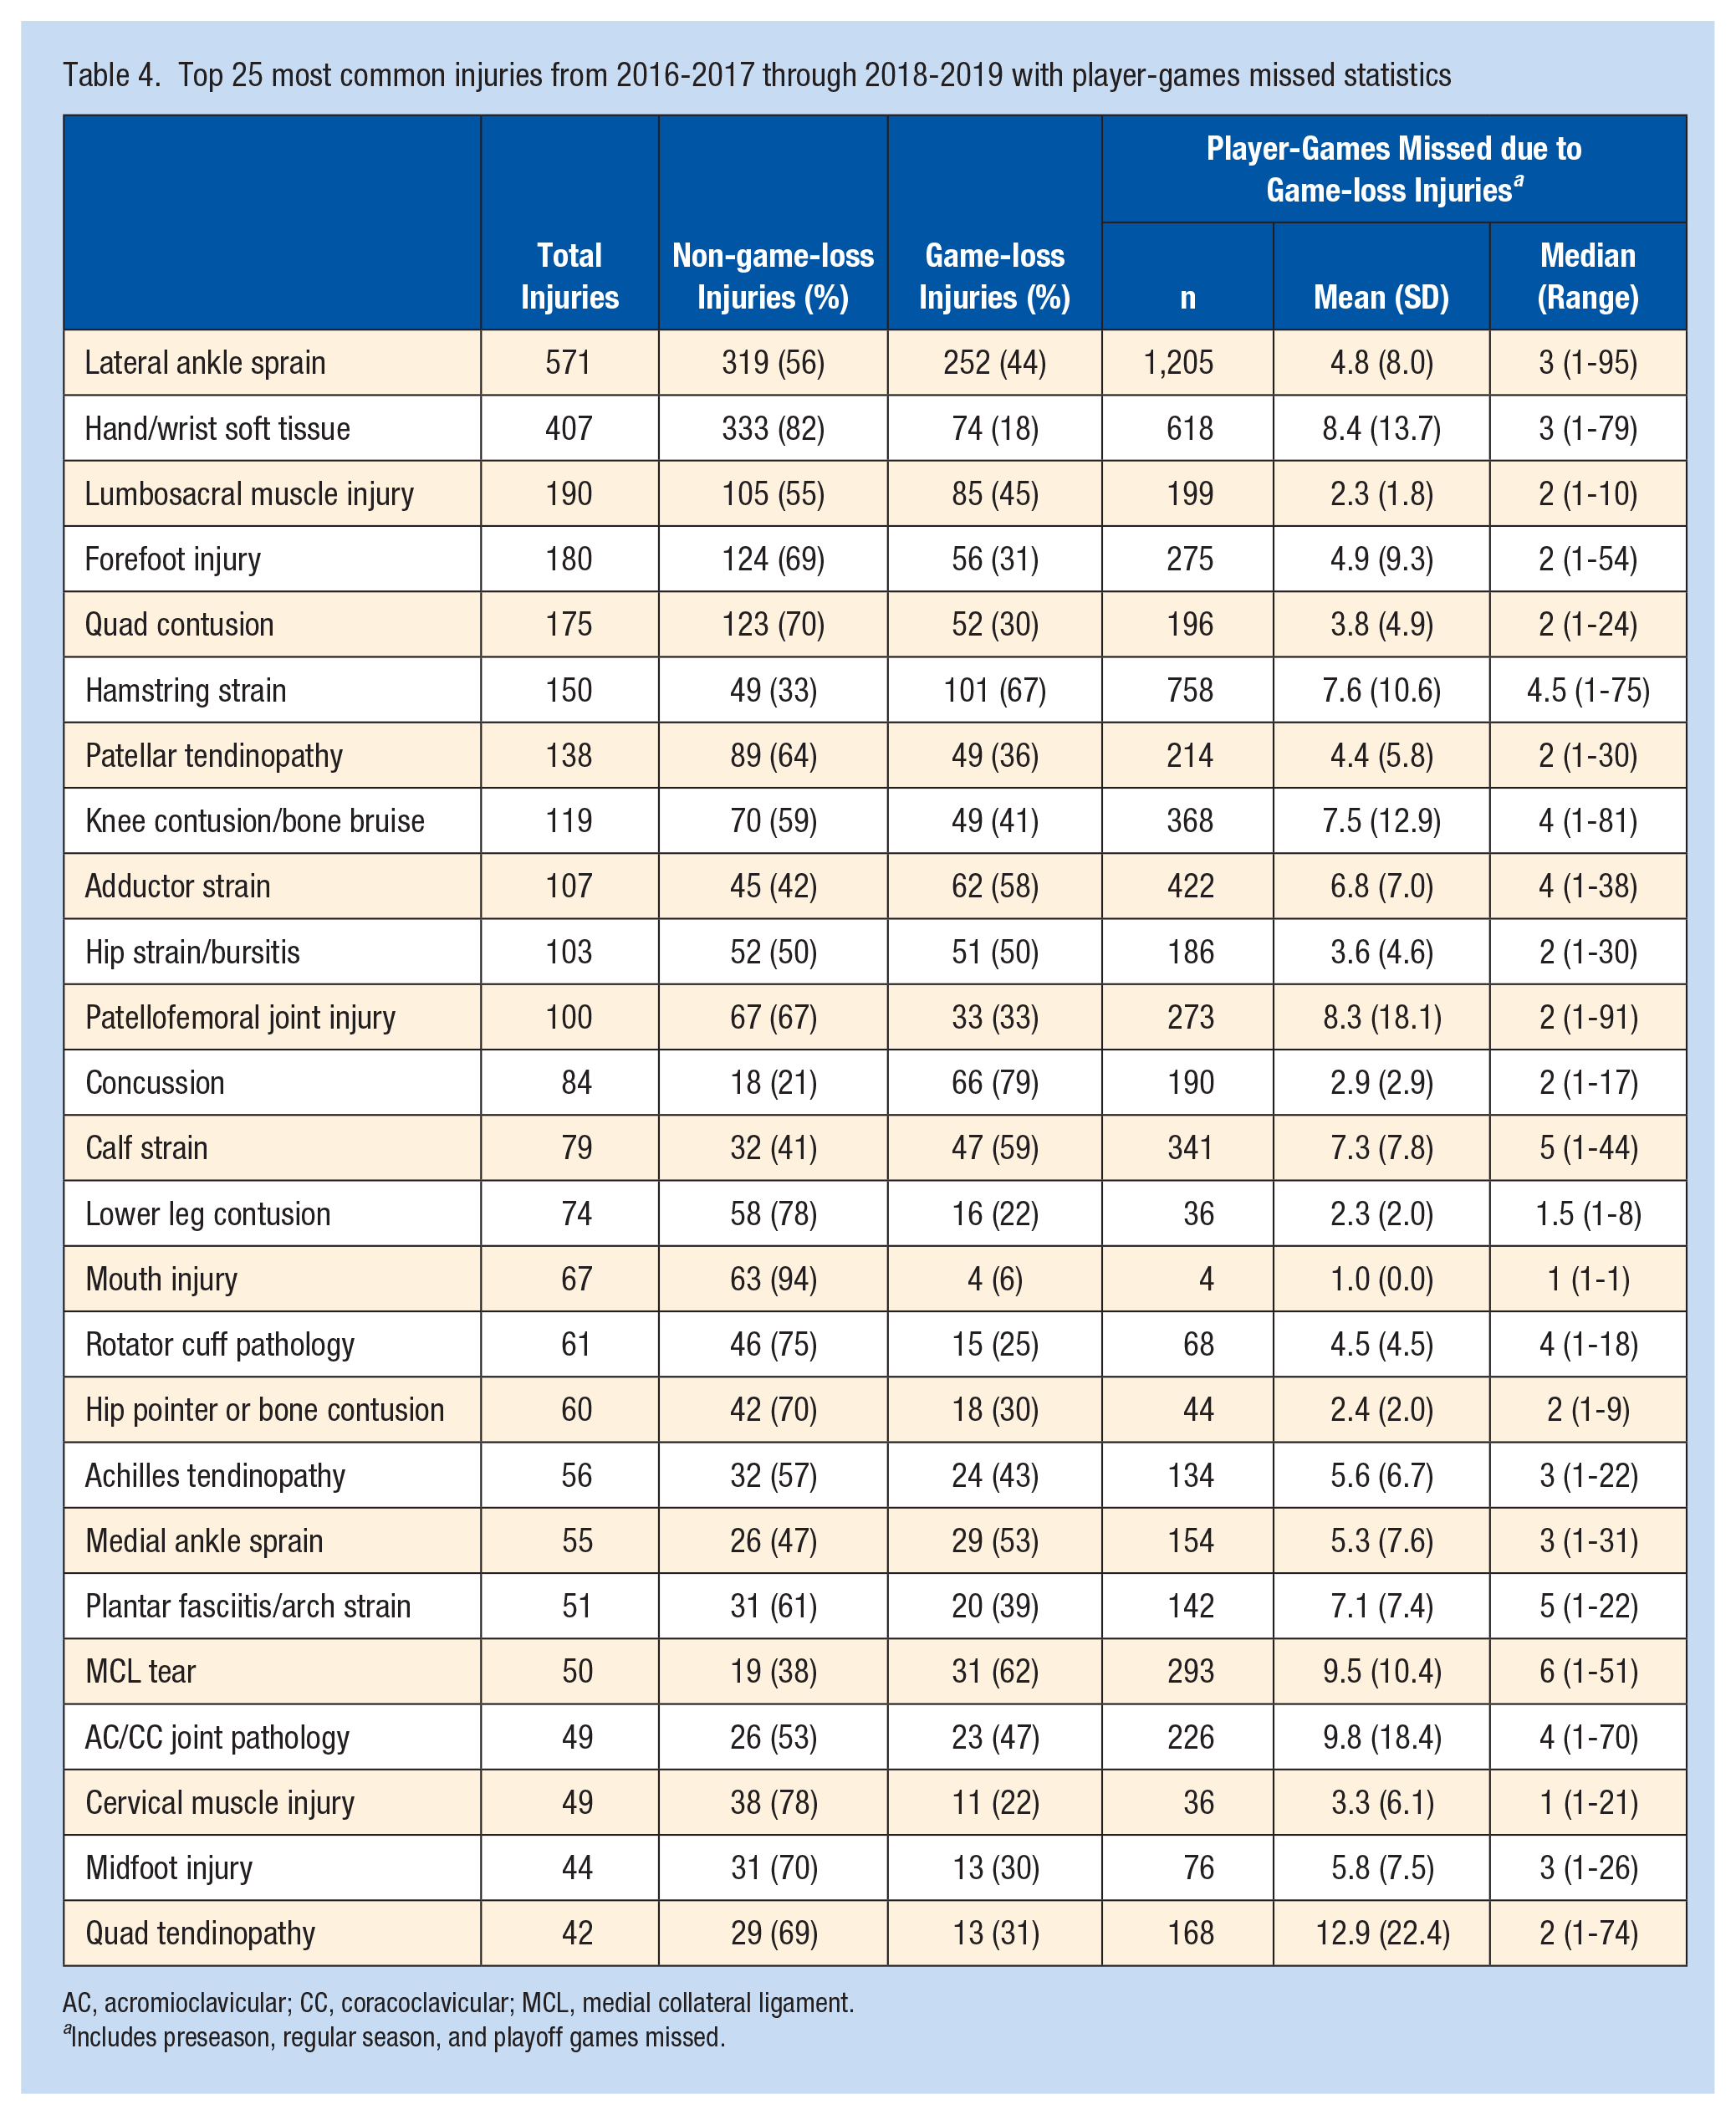
AC, acromioclavicular; CC, coracoclavicular; MCL, medial collateral ligament.
Includes preseason, regular season, and playoff games missed.
Discussion
The analysis presented here provides insights into both the type and incidence of injuries and any resultant competitive playing time lost. It provides fundamental injury data to guide evidence-based injury reduction strategies and inform player health priorities in the NBA. In addition to the validity of the data, the methodology is rigorous with respect to calculation of the incidence rate based on accurately recorded game minutes played.
Game-loss injury incidence rates fluctuated between 5.0 to 7.0 injuries per 10,000 player-minutes during games from 2013-2014 through 2018-2019. The largest increase in game-loss injury rates during games was during the first 2 years of the study (5.0 in 2013-2014 to 6.4 in 2014-2015), which was driven by an increase in preseason injuries (3.7 vs 7.0 injuries per 10,000 player-minutes). This increase also may, in part, reflect renewed emphasis on injury surveillance procedures and expansion of league-wide audits to include the full calendar year. 7 During regular season, rates were stable, with some fluctuation throughout the study period. The 6-year game-loss injury incidence rate was 6.9 per 10,000 player-minutes in preseason games compared with 6.2 per 10,000 minutes in regular season games. However, playoff injuries resulting in lost playing time had a substantially lower incidence (2.8 per 10,000 player-minutes), representing only 3% of all game-loss injuries sustained during the season. These trends may be confounded by the impact of timing within the season affecting a player’s clinical management. In terms of games missed, there may be more conservative management of injuries sustained in preseason versus regular season, and in turn, regular season versus playoffs. Future assessment of injuries in these different phases of the season may offer greater insights into the differences in management, use of adjunct modalities, and lost playing time.
From 2013-2014 through 2018-2019, 37% (n = 2706) of acute and 37% (n = 999) of nonacute injuries resulted in missed games. However, the incidence of acute versus nonacute game-loss injuries was approximately 73% and 27%, respectively. Interestingly, the amount of time lost for acute and nonacute injuries was similar at 6.3 and 7.8 regular season games missed, respectively. The impact of these nonacute conditions, however, is difficult to ascertain, as they are often prevalent conditions that may extend across seasons and therefore may be recorded in multiple seasons. Future analysis into the specific conditions and recurrence rates in the same players may offer greater insights into the true morbidity of nonacute conditions regarding lost playing time.
Preseason injuries occurred during practice, game play, and other team-related activities, such as strength and conditioning or insidious onset (injuries without acute trauma), while most regular season injuries occurred during games. Perhaps this reflects differences in player fitness and conditioning, the intensity and frequency of games relative to practice sessions during these different phases of the season, or other factors specific to the NBA (eg, impact of travel and regular season schedule). Offseason injuries were distributed between non-team-related activities (eg, pickup or exhibition games, Summer League or national team events, and team or non-team supervised training or rehabilitation) and injuries with insidious or chronic onset (defined as established injuries requiring ongoing intervention). Further studies will be necessary to elucidate the etiology of injury by timing and setting to focus efforts for health promotion in different timepoints and settings across the season.
Among the injuries occurring from 2016-2017 through 2018-2019, the most frequent were lateral ankle sprains and hand/wrist soft tissue injuries. Both have a different impact on players, with ankle sprains being a key driver of missed player-games. On the contrary, hand/wrist soft tissue injuries often do not lead to missed player-games but require management by players and medical staff, and the 18% of cases that do miss player-games have a large impact on game availability (high mean games missed per injury). Lateral ankle sprains caused the most missed player-games among the most frequent injuries. Hence, increased attention to understanding lateral ankle sprains remains a consistent focus. 4 Lower-extremity injuries collectively represented the highest frequency of injuries, at approximately 62%, and were the most common nonacute injuries; these remain an area of high focus.
Drakos et al 3 previously reported injury patterns in the NBA over a 17-year period (1988-1989 to 2004-2005); however, injury reporting mechanisms and methodologies were less rigorous during the study period, and games missed due to injury for preseason games and practices were not calculated. Drakos et al 3 reported an incidence rate of injury during regular season and postseason games of 19.1 per 1000 athlete exposures (ie, player-games) 3 The most common musculoskeletal injuries were lateral ankle sprains, patellofemoral inflammation, lumbar strains, and hamstring strains. For both studies, the incidence of lateral ankle sprains was relatively consistent (11%-13% of all injuries). In contrast to this study, however, the most player-games missed were secondary to patellofemoral pain syndrome followed by lateral ankle sprains, knee sprains, and lumbar strains or injuries. Perhaps this difference reflects the lack of stratification between acute and nonacute injuries as well as the upgrade of the injury reporting system after the study by Drakos et al 3 to a more standardized set of diagnoses with the implementation of the NBA EMR. Furthermore, Drakos et al 3 reported a higher rate of game injury of approximately 19.1 per 1000 athlete-exposures compared with the 13.8 per 1000 player-games for the regular season and playoffs in the current study. This difference may reflect an inclusion of game-loss injuries only in our study; if non-game-loss injuries are included, the rate considerably increases to 34.7 per 1000 player-games and is significantly higher than the incidence reported by Drakos et al. 3 This discrepancy may not reflect an increased injury risk in more recent NBA seasons but rather different inclusion criteria between the studies. Moreover, this discrepancy may reflect the upgraded injury reporting system with the implementation of the EMR after the Drakos study. 3
The most notable strength of the current study is the validity and accuracy of the dataset derived from a closed population with strong fidelity, league auditing, and compliance, and with reporting of injuries into an EMR by trained medical personnel treating players. Due to this database, this study is able to report reliable, comprehensive epidemiologic analysis of all injuries reported in the NBA from 2013-2014 through 2018-2019. Accordingly, the denominator of athlete-exposures is from official NBA game-day sources, thereby providing more accurate calculations of injury rates compared with publicly available databases that have been referenced previously and utilized in the literature. The stratification of acute and nonacute groups, and the assessment at the various phases of the season can guide player health priorities for NBA players. Furthermore, subsequent studies that rely on this epidemiological analysis will provide insights to improve treatment of injuries, assist in league policies to promote player health and guide rules to prioritize safety and reduce injury.
This study has limitations. As defined here, missed time includes only games missed, and does not reflect shortened, modified, or limited player participation while managing injury or minutes of game-play limited by injury. In addition, for the 2017-2018 season, the NBA implemented a player-resting policy, which may have affected the manner in which instances of nonparticipation (typically not exceeding 1 game consecutively) were reported. Although definitions and standardized reporting practices are provided to all teams at the beginning of each season, there may be some ambiguity in reporting games missed due to rest or load management versus games missed due to an ongoing or chronic injury, for example. Clinical management and return-to-play time may be variable based on treatment modalities and differences in team decision-making and is influenced by factors such as timing and within-season team standings. Reporting of nonacute conditions may be limited, given that they are prevalent conditions that may impact participation in some seasons but not in others. The classification of contact versus noncontact injury may be confounded by the subjectivity of reporting and potential for a mixed injury mechanism. Finally, injury risk during the study period may have been impacted by changes to the style of play (eg, faster pace, more dynamic defensive strategies), as the game has continued to evolve, as well as minor and annual changes to the schedule (including efforts to reduce instances of back-to-back games).
Injury data reported by NBA team medical staff in a standardized, audited system provide fundamental injury data to guide evidence-based injury reduction strategies and inform NBA player health priorities. The observed injury rates described here underscore the importance of rigorous injury reporting methodology and monitoring to inform league-wide and team-driven strategies that attempt to mitigate the incidence and impact of injuries in the NBA.
Footnotes
Acknowledgements
The authors thank Rebecca Lee (IQVIA), Kelly Hogan (NBA), Taylor Walden (NBA), Helen Zhang (IQVIA), Gabe Farkas (IQVIA), and Kristin Shiue (IQVIA) for curation of data and analytics; Tom Kwon (IQVIA) and Linda Jones (Campbell Clinic) for manuscript support; and NBA team medical personnel, especially athletic trainers, for their daily diligence.
The following authors declared potential conflicts of interest: J.M. has received consulting fees from the NBA. J.D. has received consulting fees from the NBA. A.M has received consulting fees and royalties from Arthrex. F.M.A. has received royalties from Elsevier and Wolters Kluwer, and consulting fees from Zimmer Biomet and 98point6. C.D.M., M.M.H., and R.G. are employed by IQVIA, a human data science company that is funded for NBA injury surveillance and analytics efforts.