
Abstract
Background:
Youth populations benefit from neuromuscular training; however, the extent to which training frequency, baseline fitness, and maturity status moderate the response to long-term neuromuscular training in male youth remains unclear.
Hypothesis:
Twice-weekly training (G2x) would induce larger improvements in movement competency and strength and power kinetics compared with once-weekly training (G1x). Maturity status and baseline fitness would also moderate the training response in strength and power kinetics.
Study Design:
Nonrandomized, repeated-measures design.
Level of Evidence:
Level 3
Methods:
Ninety-five male athletes of varying maturity status (pre– or post–peak height velocity) were divided into G2x, G1x, or control (CON) groups. Training groups received G2x or G1x for 28 weeks. Back squat assessment (BSA) movement competency and isometric mid-thigh pull (IMTP), squat jump (SJ), and countermovement jump (CMJ) kinetics were measured pre- and postintervention.
Results:
The G2x achieved significantly greater adaptations in BSA total score, IMTP allometrically scaled peak force (PFallo), IMTP peak rate-of-force development (PRFD), SJ PFallo and PRFD compared with G1x and CON (P < 0.05; d = 0.3-0.9). Baseline fitness, training frequency and maturity status were significant predictors of IMTP PFallo (R2 = 27.5%) and PRFD (R2 = 42.9%), while a combination of training frequency and baseline fitness explained a small amount of variance in SJ PFallo (R2 = 12.2%) and SJ PRFD (R2 = 6.5%). There were no significant predictors of CMJ kinetics.
Conclusion:
G2x achieved significantly larger improvements in movement competency, isometric strength and concentric jump variables compared with G1x, with the training response greater in those youth with lower baseline fitness and more advanced maturity status.
Clinical Relevance:
Exposure to neuromuscular training twice-weekly elicits a greater response than G1x in young male athletes. Practitioners should take maturity status, training frequency, and baseline fitness levels of young male athletes into account when interpreting testing data, as these variables appear to moderate training responsiveness.
Leading position and consensus statements have highlighted the importance of youth regularly engaging with strength and conditioning programs as part of a long-term athletic development strategy.5,24 This is predicated on the existing literature that clearly shows the benefits of neuromuscular training interventions, inclusive of coordination, dynamic stability, strength training, and plyometrics on improving physical fitness.15,18,35 For example, meta-analytical data have shown that exposure to resistance training can result in meaningful improvements in fundamental movement skills, 8 muscle strength, power, and speed in youth populations,2,23 with strength training serving as a key foundation of subsequent speed and power development. 2 Similarly, a recent umbrella review highlighted the effectiveness of resistance training on improving a range of athletic qualities (ie, strength, power, linear and change-of-direction speed) and sport-specific performance measures (eg, throwing distance and kicking velocity) in youth populations. 22 Notably, the review identified larger effects for strength-related outcome variables compared with power, speed, or sport-specific performance measures. 22
Training adaptations are sensitive to the nature of exercise prescription. Programming often involves the manipulation of variables such as volume, intensity, frequency, and duration of the program. 25 Existing pediatric literature examining the influence of training frequency has focused on the effects of once-weekly (G1x) versus twice-weekly (G2x) sessions on various measures of physical performance, with data indicating equivocal findings.11,14,23,29 For example, an 8-week resistance training program showed both once- and twice-weekly training frequencies improved strength in 7- to 12-year-old children, but a significantly greater response was observed from a twice-weekly dosage. 17 In support, recent meta-analyses have reported that engaging in resistance training on 2 to 3 nonconsecutive days is optimal for increasing both strength and power in youth athletes.4,34 Alternatively, similar changes in strength have been reported from both once- and twice-weekly, in-season maintenance resistance training programs in male pubescent baseball players. 11 Similarly, no differences were observed in power-related variables in adolescent male soccer players after 6-week, once- or twice-weekly complex training interventions. 29
Certain limitations are evident within the existing pediatric research examining the effects of different training frequencies on measures of physical fitness. First, research has only compared the effects of training frequency within a single chronological age-group and has not accounted for the maturity status of participants.11,17 Consequently, the influence of maturity on the responsiveness to different training frequencies remains unknown, despite research indicating that maturity status moderates the response to neuromuscular training because of the different underlying physiology of children and adolescents.4,28,37 Second, the current evidence base relies almost exclusively on performance measures of athleticism (eg, jump height, repetition maximum strength) and does not typically include assessments of movement competency. Therefore, the effects of different training frequencies on the kinetics underpinning such changes in physical performance remain unclear. Relying solely on performance measures can often mask alterations in movement strategies that occur as a result of neuromuscular training, ultimately compromising practitioners’ ability to prescribe more individualized training programs. Finally, most studies have typically been short-term in nature (~6-12 weeks) despite recent meta-analytical data indicating that young athletes experience greater strength and power adaptations when training programs exceed >23 weeks. 23 It is likely that shorter term interventions typically fail to provide sufficient training dosage to enable all youth to realize meaningful changes in function, particularly in less mature cohorts. 26 Longer term training interventions have shown that physical qualities such as muscle strength, 20 sprint speed, 39 change-of-direction speed, 21 high-intensity intermittent endurance, and motor skill competency 19 can be improved; however, these studies (1) did not typically examine the effects of maturity status on training responsiveness, (2) relied solely on performance measures, and (3) crucially did not examine the effects of different training frequencies on subsequent adaptations.
Given the limitations in existing pediatric training literature, we aimed to (1) investigate the effects of once- versus twice-weekly training frequencies on measures of movement competency and strength and power kinetics in young male athletes of various maturity status over the course of a 28-week neuromuscular training program and (2) determine the influence of training frequency, maturity status, and baseline fitness on changes in strength and power kinetics. We hypothesized (1) that a twice-weekly training frequency would induce larger improvements in all measures in comparison to the once-weekly frequency and (2) that training frequency, maturity status, and baseline fitness would significantly moderate the training response in strength and power kinetics.
Methods
Participants
Ninety-five young male athletes aged 9 to 17 years from a professional county cricket academy in the United Kingdom agreed to participate in the study. Individuals were randomly assigned to either a twice-weekly (G2x), a once-weekly (G1x), or a control (CON) group. Before the intervention, no participants in either of the training groups had participated in a formalized strength and conditioning program during their off-season (≥5 months). Anthropometrics and biological maturity status for each group are presented in Table 1. Maturity status was estimated using a previously published sex-specific regression equation. 30 Written informed consent and assent were obtained from parents and participants, respectively, after ethical approval from the university’s institutional research ethics committee in accordance with the Declaration of Helsinki (ref: 16/8/01S).
Anthropometrics and biological maturity status of each group pre- and postintervention
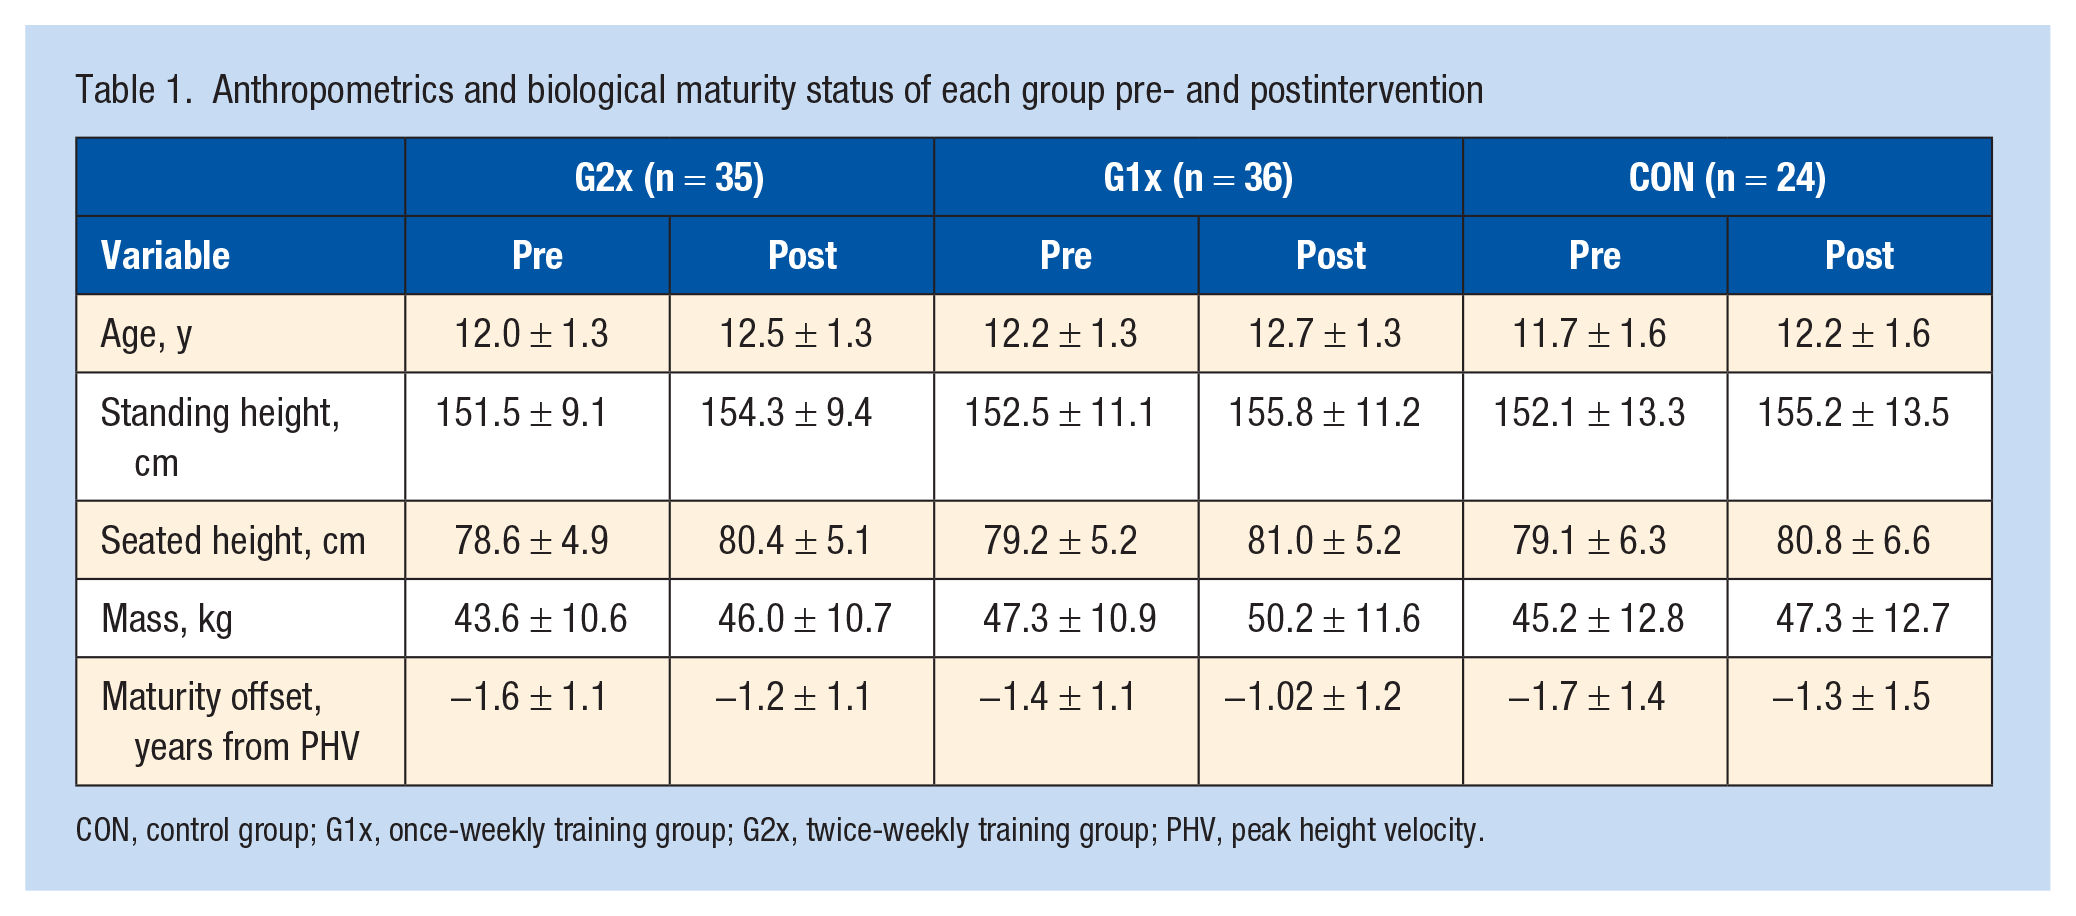
CON, control group; G1x, once-weekly training group; G2x, twice-weekly training group; PHV, peak height velocity.
Procedures
This study used a repeated-measures design to determine the effects of 2 different training frequencies on movement competency, strength, and power kinetics after 28 weeks of neuromuscular training in young male athletes. Pre- and postintervention testing consisted of completing the back squat assessment (BSA) and 3 trials of the isometric mid-thigh pull, (IMTP), squat jump (SJ), and countermovement jump (CMJ) tests. Testing was conducted 1 week before and immediately after the 28-week training program. To be included in the final analyses, participants from both training groups were required to complete ≥75% of their total training sessions. Participants that failed to attend the requisite number of training sessions, or did not complete all testing sessions, were excluded from the final analyses.
Back Squat Assessment
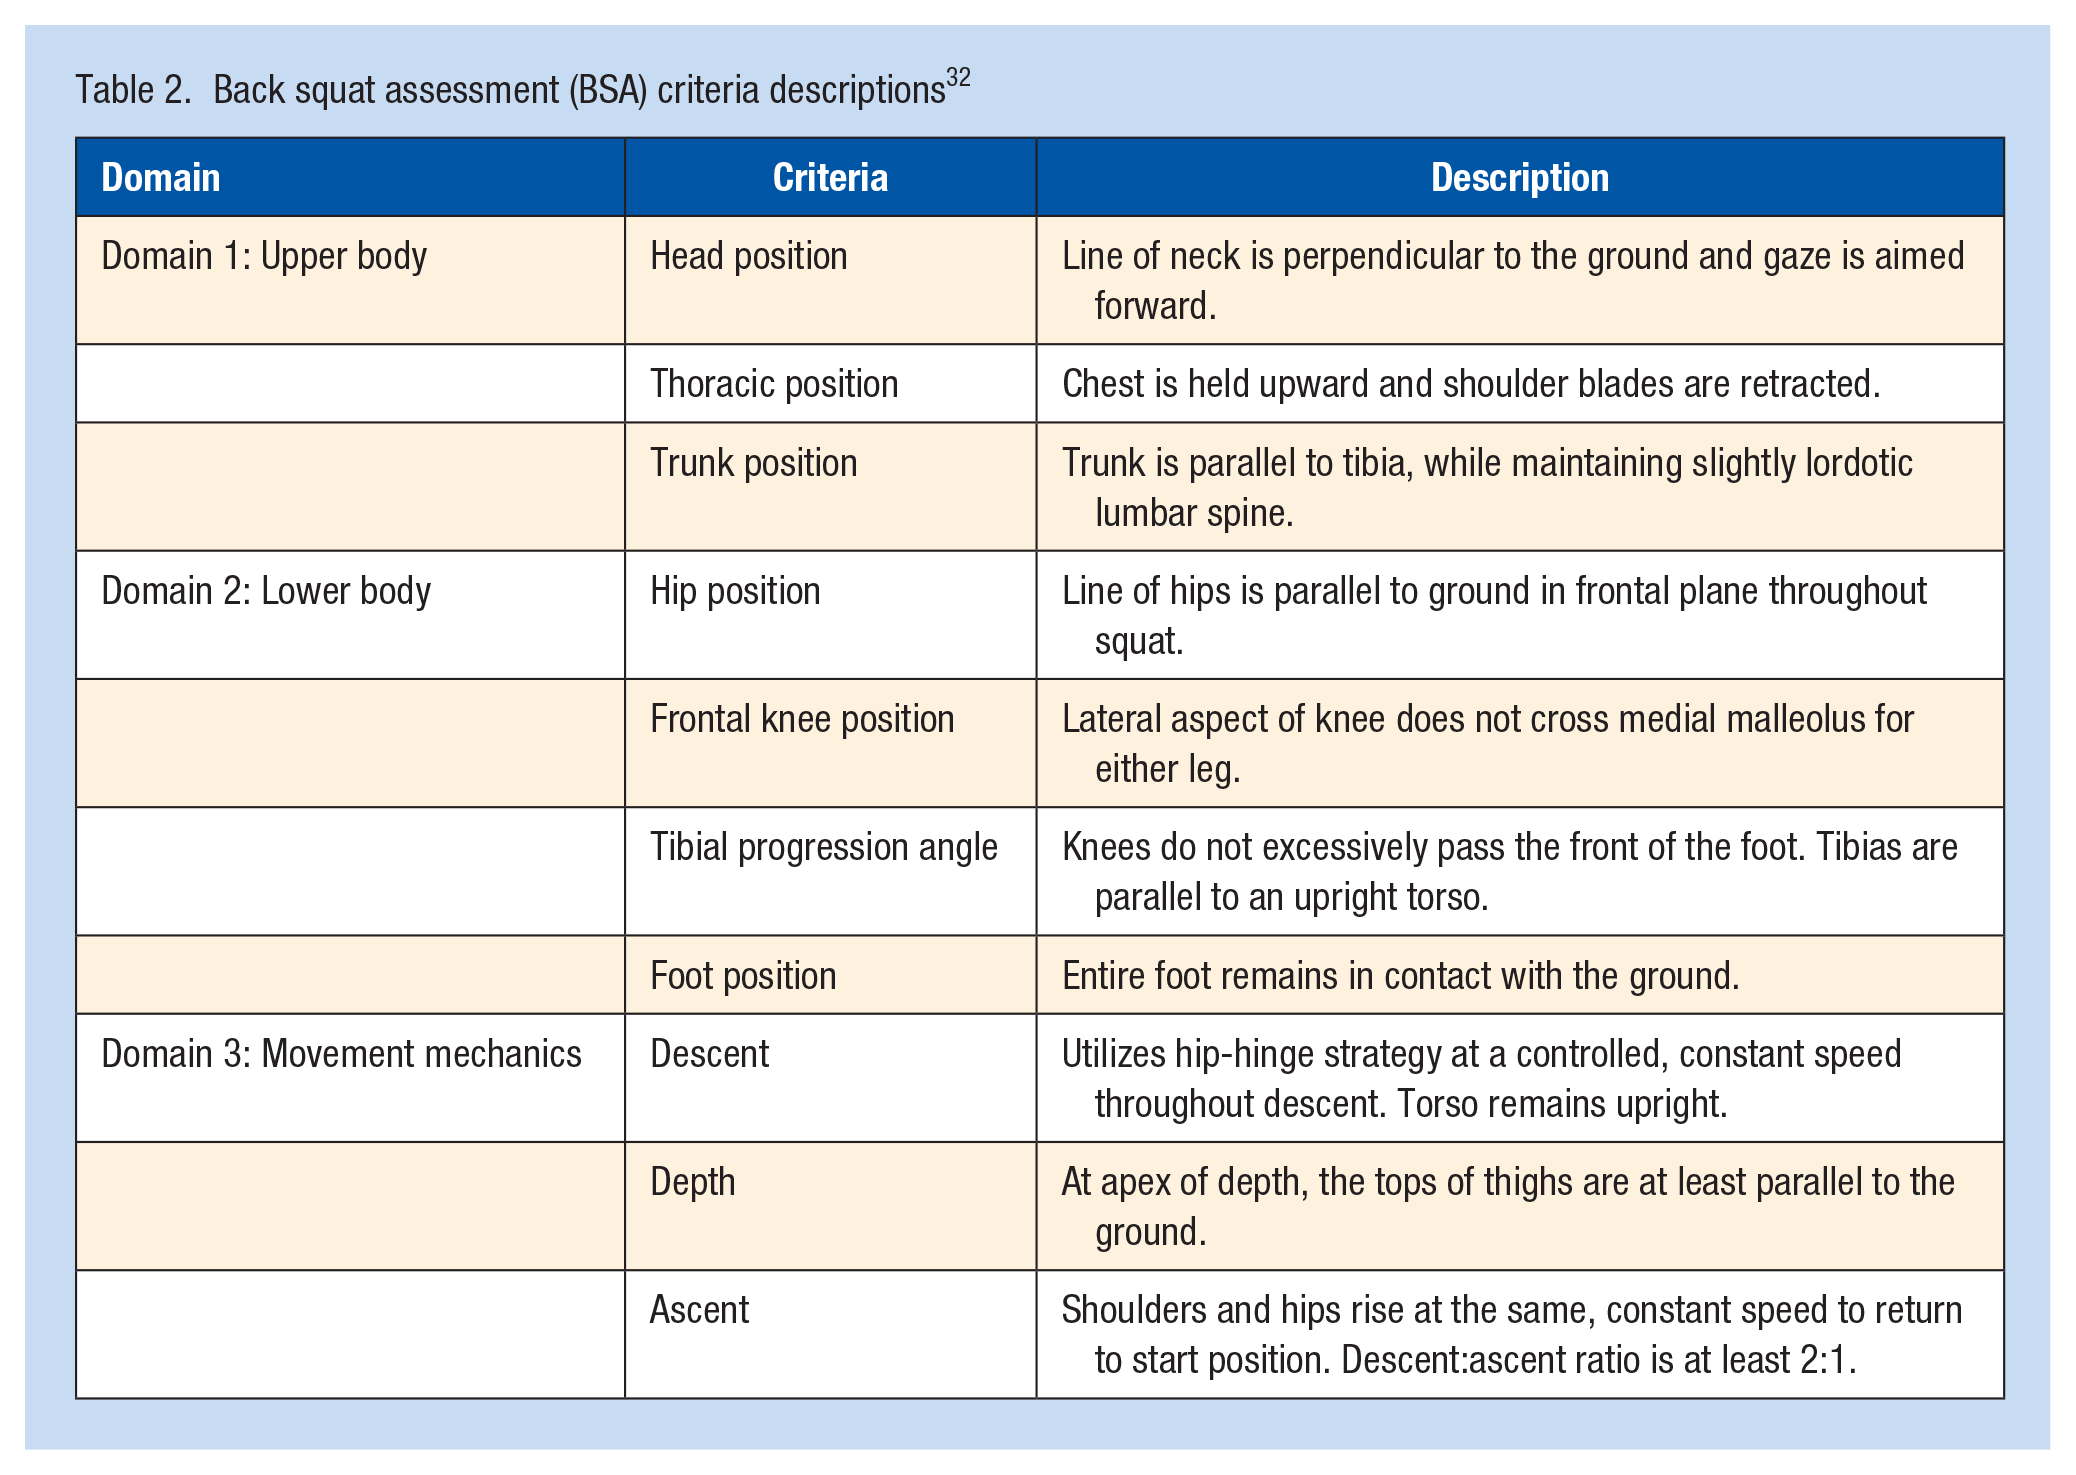
Participants were instructed to perform ten continuous squat repetitions in place with a wooden dowel on their back as per previously published guidelines for assessing the BSA. 32 All 10 repetitions were recorded at 30 Hz using two 2D high-definition cameras (Apple iPad) positioned at a height of 0.70 m and at a distance of 5 m from the center of the capture area in both frontal and sagittal planes. Scoring of BSA performance was conducted retrospectively by the same person using a 10-point criteria based on a score of 1 or 0 for each of the following: head position, thoracic position, trunk position, hip position, frontal knee position, tibial progression angle, foot position, descent, depth, and ascent. 32 The descriptors for each criterion are presented in Table 2. The individual scoring the BSA in the current study has previously shown excellent intrarater reliability (intraclass correlation coefficient [ICC] > 0.9) when scoring the screen in adolescent boys. 13 Deficits for each criterion were summed to provide a total score, with higher total scores indicative of poorer movement competency. Each participant completed 2 trials, with the highest BSA total score being used for statistical analysis. No verbal cues or advice were given to participants before or during testing apart from the published standardized script. 32
Back squat assessment (BSA) criteria descriptions 32
Isometric Mid-Thigh Pull
The IMTP test was performed on a custom-built testing device atop dual Kistler force plates sampling at a frequency of 1000 Hz (type 9287BA, Kistler Instruments AG). Testing was conducted using previous guidelines where participants were positioned with: feet hip-width apart, the bar positioned at mid-thigh, the torso upright with a neutral spine, and knee and hip angles at approximately 140°. 31 After familiarization, 3 maximal effort trials were recorded from each participant with a minimum of 90 seconds rest between each trial. All successful trials and data were analyzed on a customized LabView program. Force-time variables calculated included: absolute peak force (PFabs), peak force relative to body mass (kg) (PFrel), peak force allometrically scaled to body mass (kg0.67; PFallo), time to peak force (tPF), peak rate-of-force development (PRFD), and peak force at time periods of 0 to 50 ms (PF50), 0 to 90 ms (PF90), 0 to 150 ms (PF150), 0 to 200 ms (PF200), and 0 to 250 ms (PF250). Acceptable within- and between-session reliability (coefficient of variation [CV] ≤ 9.4%, ICC ≥ 0.87) has previously been reported for this IMTP protocol using youth athletes. 31
SJ and CMJ
Both the SJ and CMJ tests were recorded on an AMTI force plate with a sampling rate of 1000 Hz (Accupower, AMTI). Acceptable reliability for the SJ (CV ≤ 9% and ICC ≥ 0.85) and CMJ (CV ≤ 9.4%, ICC ≥ 0.82) have previously been reported for young male athletes. 27 After familiarization, participants performed 3 maximal trials of each test with 60 seconds rest between jumps. Hands remained on hips throughout each trial for both jump protocols. Participants completed 3 consecutive trials of the SJ before the CMJ and did not alternate between tests.
For the SJ, participants were required to assume a squat position with 90° of knee flexion, which was visually observed by the researcher. 27 Once in the squat position, participants were instructed to remain still for 3 seconds and to not perform a countermovement prior to jumping. Trials were discounted and repeated if individuals failed to complete all instructions during the test. Successful trials and data were analyzed using a customized LabView program and the variables measured were PFabs, PFallo, peak velocity, peak power (PP), relative peak power, impulse, PRFD, and PRFD relative to body mass (PRFDrel).
For the CMJ, after initially remaining still for 3 seconds on the force plate, participants performed a maximal effort jump using a self-selected depth during the eccentric phase of the jump. All successful trials and data were exported from the Accupower software (Accupower 3.0, Accupower Solutions) and analyzed using a validated custom built automated CMJ spreadsheet. 6 The variables measured for CMJ analyses were PFabs, PFallo eccentric impulse, concentric impulse, PP, relative PP, eccentric power, and concentric power.
Training Intervention
After preintervention testing, the G2x and G1x groups commenced their respective 28-week training interventions. An overview of the 28-week training intervention is provided in Figure 1. The G2x group received G2x, which included a ~60-minute field-based neuromuscular training session and a ~60-minute gym-based resistance training session. Both field- and gym-based sessions used various forms of resistance, including body weight, resistance bands, medicine balls, kettlebells, and dumbbells. 25 The G1x group only received the field-based neuromuscular training sessions.
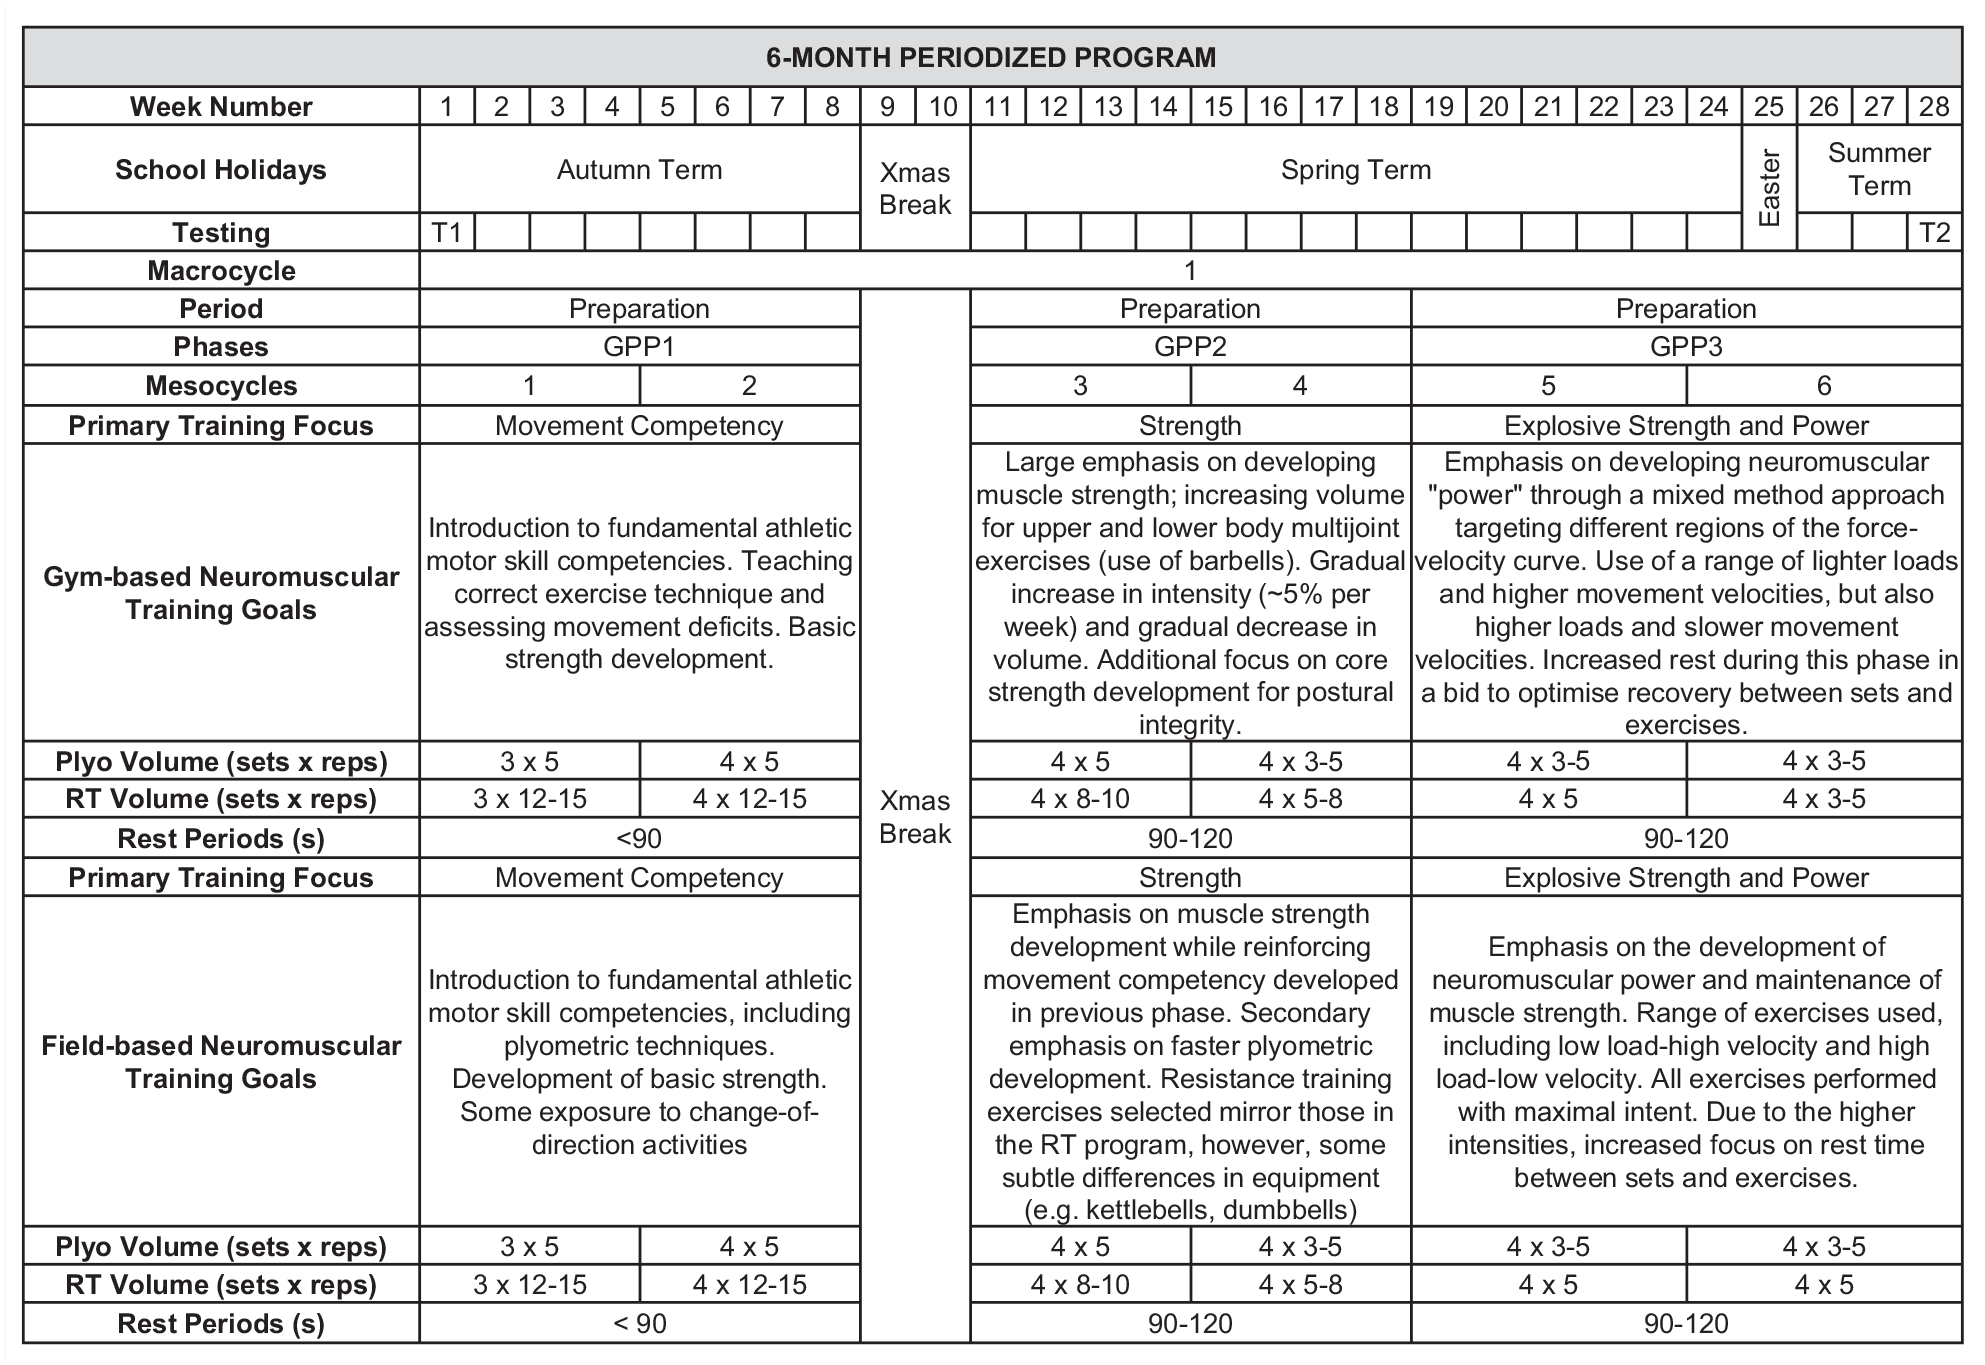
Organization of the 6-month training intervention for the gym-based and field-based training sessions. Information regarding the volume, intensity, and rest periods are provided. Pre- (T1) and postintervention (T2) test sessions are denoted in the “testing” row. Plyo, plyometrics; RT = resistance training.
Both the gym and field-based neuromuscular training sessions followed a similar structure, with each session consisting of a ~10-minute warm-up, followed by ~50 minutes of a variety of neuromuscular training exercises. Exercises were similar across both sessions, using a variety of fundamental and multijoint dynamic movements such as squatting, hinging, pushing, pulling, jumping, and landing that targeted lower and upper body strength and power development, in addition to core strengthening. Where equipment restrictions necessitated, the source of resistance for some exercises in the field-based sessions differed to the gym-based exercises (eg, dumbbells instead of a barbell, or a high-velocity exercise). Participants were familiarized with each exercise within the program and performed at least 1 warm-up set for each given exercise. Technical proficiency was of high priority during the sessions and load was never increased at the expense of technical execution. If technique was not displayed to a satisfactory standard during a set, and relevant cueing failed to remedy the technical error(s), participants ceased the set and were instructed to decrease load or regress the exercise. When participants displayed appropriate, robust technique they were instructed to increase load by ~5% the subsequent week. 1
Periodized Program
The 28-week neuromuscular training program focused on general preparatory phase (GPP) training and was divided into 3 phases (GPP1, 8 weeks; GPP2, 8 weeks; and GPP3, 9 weeks) for both the G2x and G1x groups. Each phase was subdivided into 2 mesocycles and the program was briefly interspersed with transition weeks around Christmas and Easter holidays. In phase 1, the first mesocycle primarily focused on learning correct exercise technique and developing a range of athletic motor skills. 38 During the second mesocycle, sets and repetitions were increased providing participants displayed satisfactory competency in the exercises to further build movement competency and basic strength. The sessions primarily consisted of multijoint dynamic exercises with relatively low load; however, participants were also exposed to some higher velocity movements, which involved lower volumes. The focus of the second training phase was to develop muscle strength and participants were instructed to appropriately increase resistance for each exercise providing technical competency was maintained. 16 For plyometric exercises, focus was on developing stretch-shortening cycle (SSC) capabilities by prescribing bilateral multiple rebounding and multidirectional jumps. The primary training emphasis of the final phase was to develop higher rates of force production, while maintaining strength levels. Resistance training loads were again increased by ~5%, with a gradual reduction in volume. The focus of the plyometric exercises was to develop reactive-strength qualities through a combination of unilateral and bilateral plyometric exercises.
Statistical Analyses
Normal distribution of data was assessed using the Shapiro-Wilk test. BSA total score for each group was deemed nonparametric; therefore, median scores were reported for the BSA and a Kruskal-Wallis H-test was used to observe between-group differences and multiple Wilcoxon signed-rank tests were used to determine within-group differences. Post hoc analyses for pairwise comparisons were conducted using a Bonferroni correction for multiple between- and within-group comparisons. Wilcoxon r effect sizes were subsequently reported. All variables within the IMTP, SJ, and CMJ tests were parametric; therefore, data were presented as means ± standard deviations (SDs). A series of 2 × 3 (time × group) repeated measures analysis of covariance (ANCOVA) tests were conducted to determine within- and between-group effects, where “time” denotes PRE and POST intervention and “group” refers to the G2x, G1x, or CON cohorts. Maturity offset was included as the covariate to control for its influence on each dependent variable; therefore, adjusted means (Madj) ± SDs were reported for each variable. Homogeneity of variances were determined using the Levene’s test, with a Greenhouse-Geisser adjustment used when violated. To identify the training effects of one group over and above the training effects in a different group, the magnitude of change after training was calculated as the standardised difference between groups using Cohen’s d value 7 :

where group A was entered as the group with the higher training frequency and group B as the group with a lower training frequency or control. This yielded effect comparisons of G2x versus G1x, G2x versus CON, and G1x versus CON. Effect sizes were interpreted using the following thresholds: <0.20 (trivial), 0.20 to 0.59 (small), 0.60 to 1.19 (moderate), 1.20 to 1.69 (large), and >1.70 (very large).
Multiple stepwise linear regression models were used to determine predictors for significant mean changes in key dependent variables from the isometric strength and dynamic jump tests. The key dependent variables chosen for linear regression analyses were IMTP PFallo, IMTP pRFD, SJ PFallo, SJ pRFD, and CMJ peak power because of their significant group × time interaction effects from each test. Training frequency, maturity status, growth rate, and baseline fitness were chosen as independent variables to determine their influence on changes within the isometric and dynamic tests. Baseline fitness refers to the mean value at pretesting of the dependent variables, while growth rate (cm/month) was calculated by subtracting stature (cm) at posttesting from pretesting stature (cm), divided by the duration of the intervention in months. All statistical analyses were computed using SPSS (Version 24; IBM Corp), with statistical significance for all tests set at an alpha level of P < 0.05.
Results
At pretesting, there were no significant differences between groups for any of the IMTP, SJ, and CMJ variables (P > 0.05). At pre- and posttesting, there were also no differences between any groups for anthropometric and maturity status measures (P > 0.05). The mean adherence rate for the G2x group and G1x group was 82% and 84%, respectively.
Back Squat Assessment
BSA total score at pre- and posttesting are displayed in Table 3. The G2x group made a significant, moderate within-group improvement in median BSA total score from pre to posttesting (4.0-2.0, r = 0.68), whereas neither the G1x nor the CON group improved after the intervention (P > 0.05). At posttesting, the G2x group had a small and significantly lower median BSA total score (2.0) than the G1x group (4.0) (r = 0.70, P < 0.05) and CON group (4.0) (r = 0.69, P < 0.05). There were no differences between the G1x and CON groups at postintervention (P > 0.05).
Median BSA total score with interquartile ranges (25th-75th percentiles), between-group differences and within-group changes after the 6-month training intervention
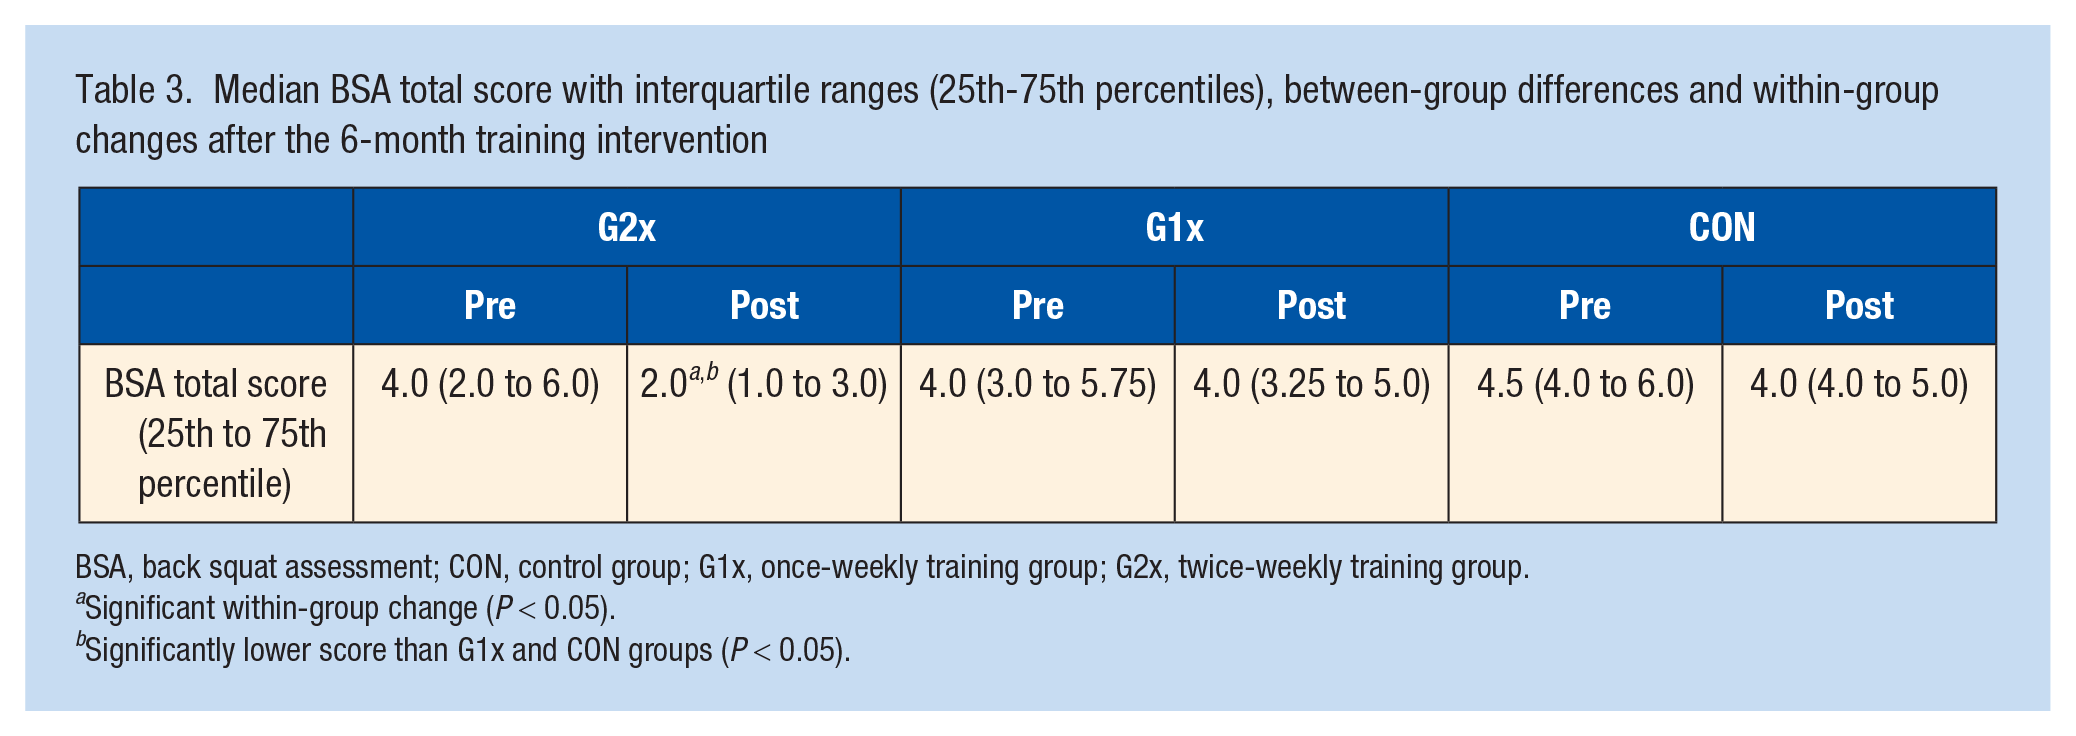
BSA, back squat assessment; CON, control group; G1x, once-weekly training group; G2x, twice-weekly training group.
Significant within-group change (P < 0.05).
Significantly lower score than G1x and CON groups (P < 0.05).
Isometric Mid-Thigh Pull
Pre- and postintervention data for all IMTP kinetics (Madj ± SD) are displayed in Table 4. Significant time × group interactions were observed in PFabs, PFallo, and PRFD, with the G2x group experiencing moderate to large worthwhile training effects above the other groups (P < 0.05; d = 0.78-1.00; Figure 2). Differences in responses between G1x and CON groups were mostly small or trivial; however, the G1x experienced a significant training effect over the CON group for PFallo (P < 0.05, d = 0.52). Results showed a main effect for time in PFabs and PFallo as well as significant within-group effects for the G2x and G1x groups (Table 3). There were no significant main effects for time or group, or any interaction effects for PF50-250, with trivial differences noted for all between-group comparisons (P > 0.05).
Adjusted means with standard deviations for all IMTP kinetics pre- and postintervention along with significance values for time main effects and time × group interactions
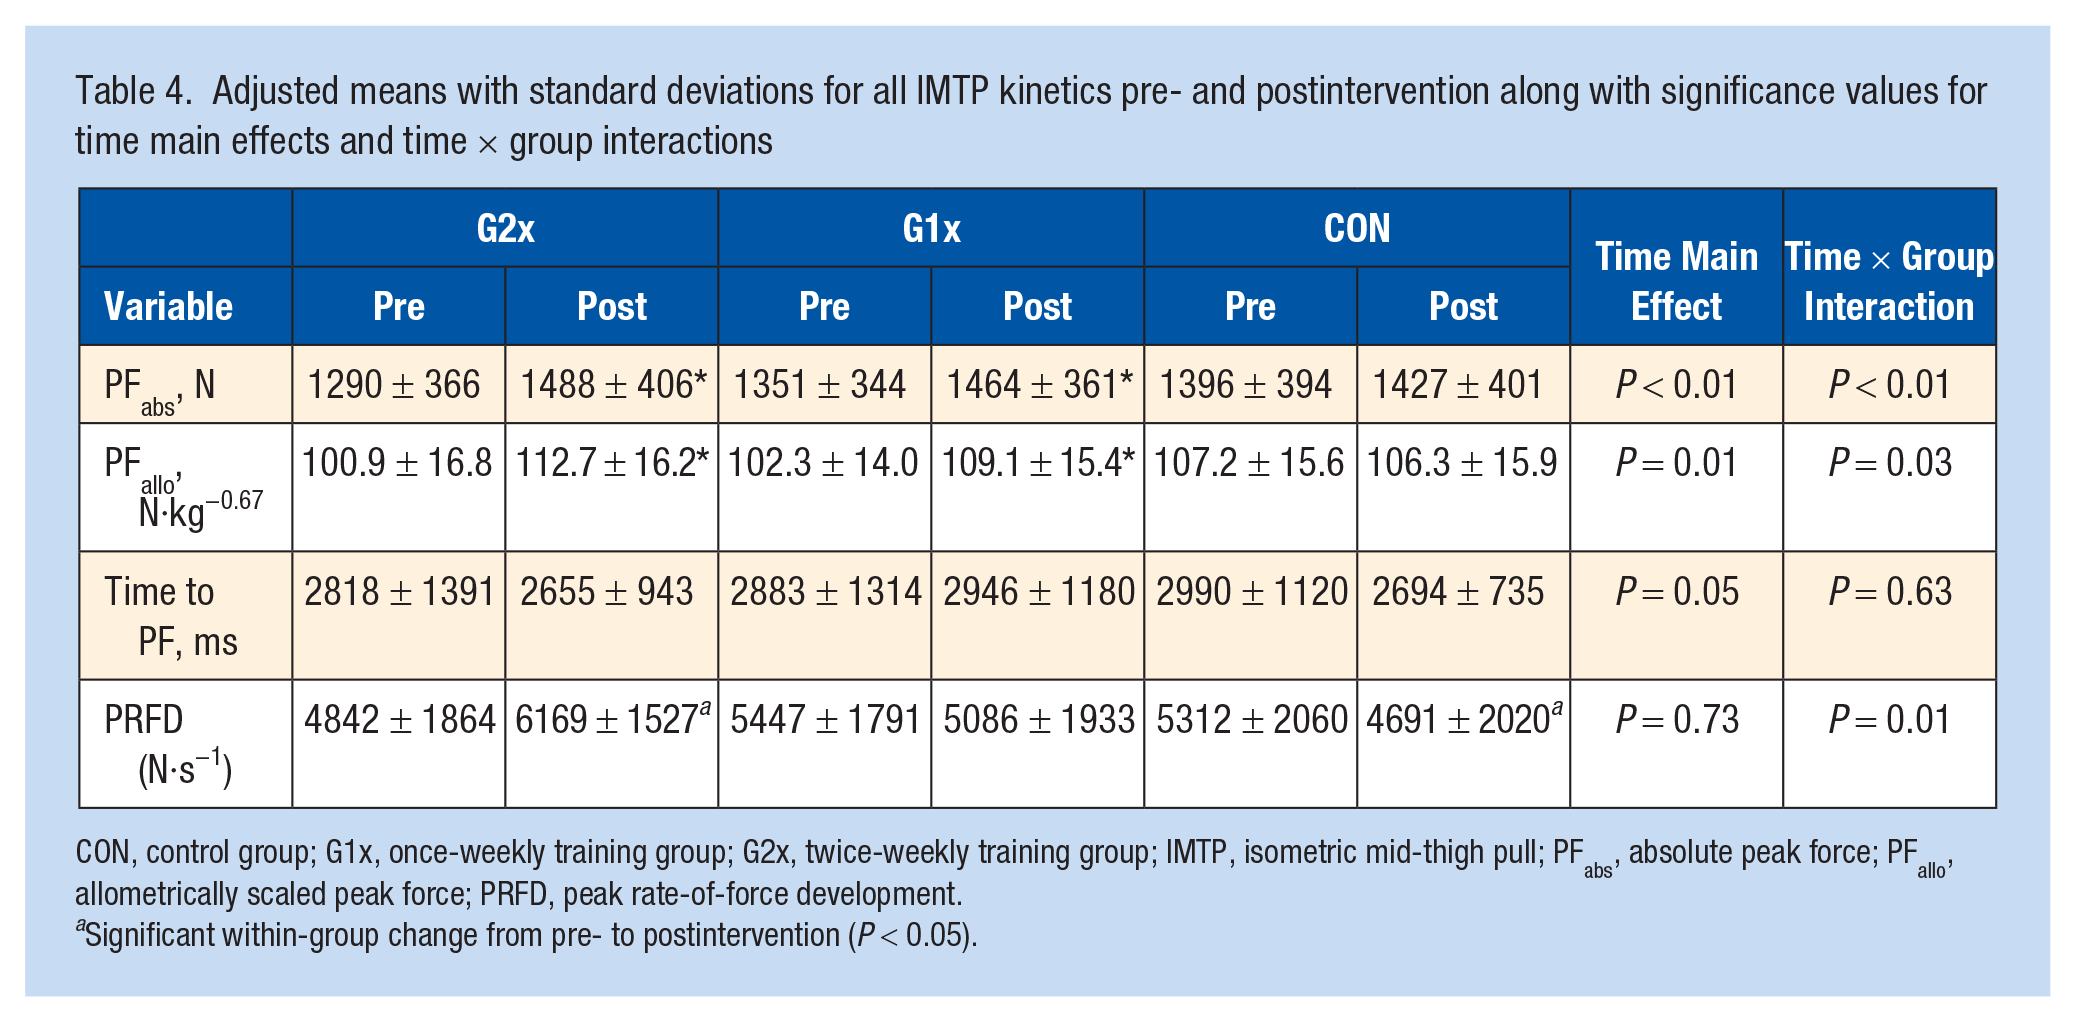
CON, control group; G1x, once-weekly training group; G2x, twice-weekly training group; IMTP, isometric mid-thigh pull; PFabs, absolute peak force; PFallo, allometrically scaled peak force; PRFD, peak rate-of-force development.
Significant within-group change from pre- to postintervention (P < 0.05).
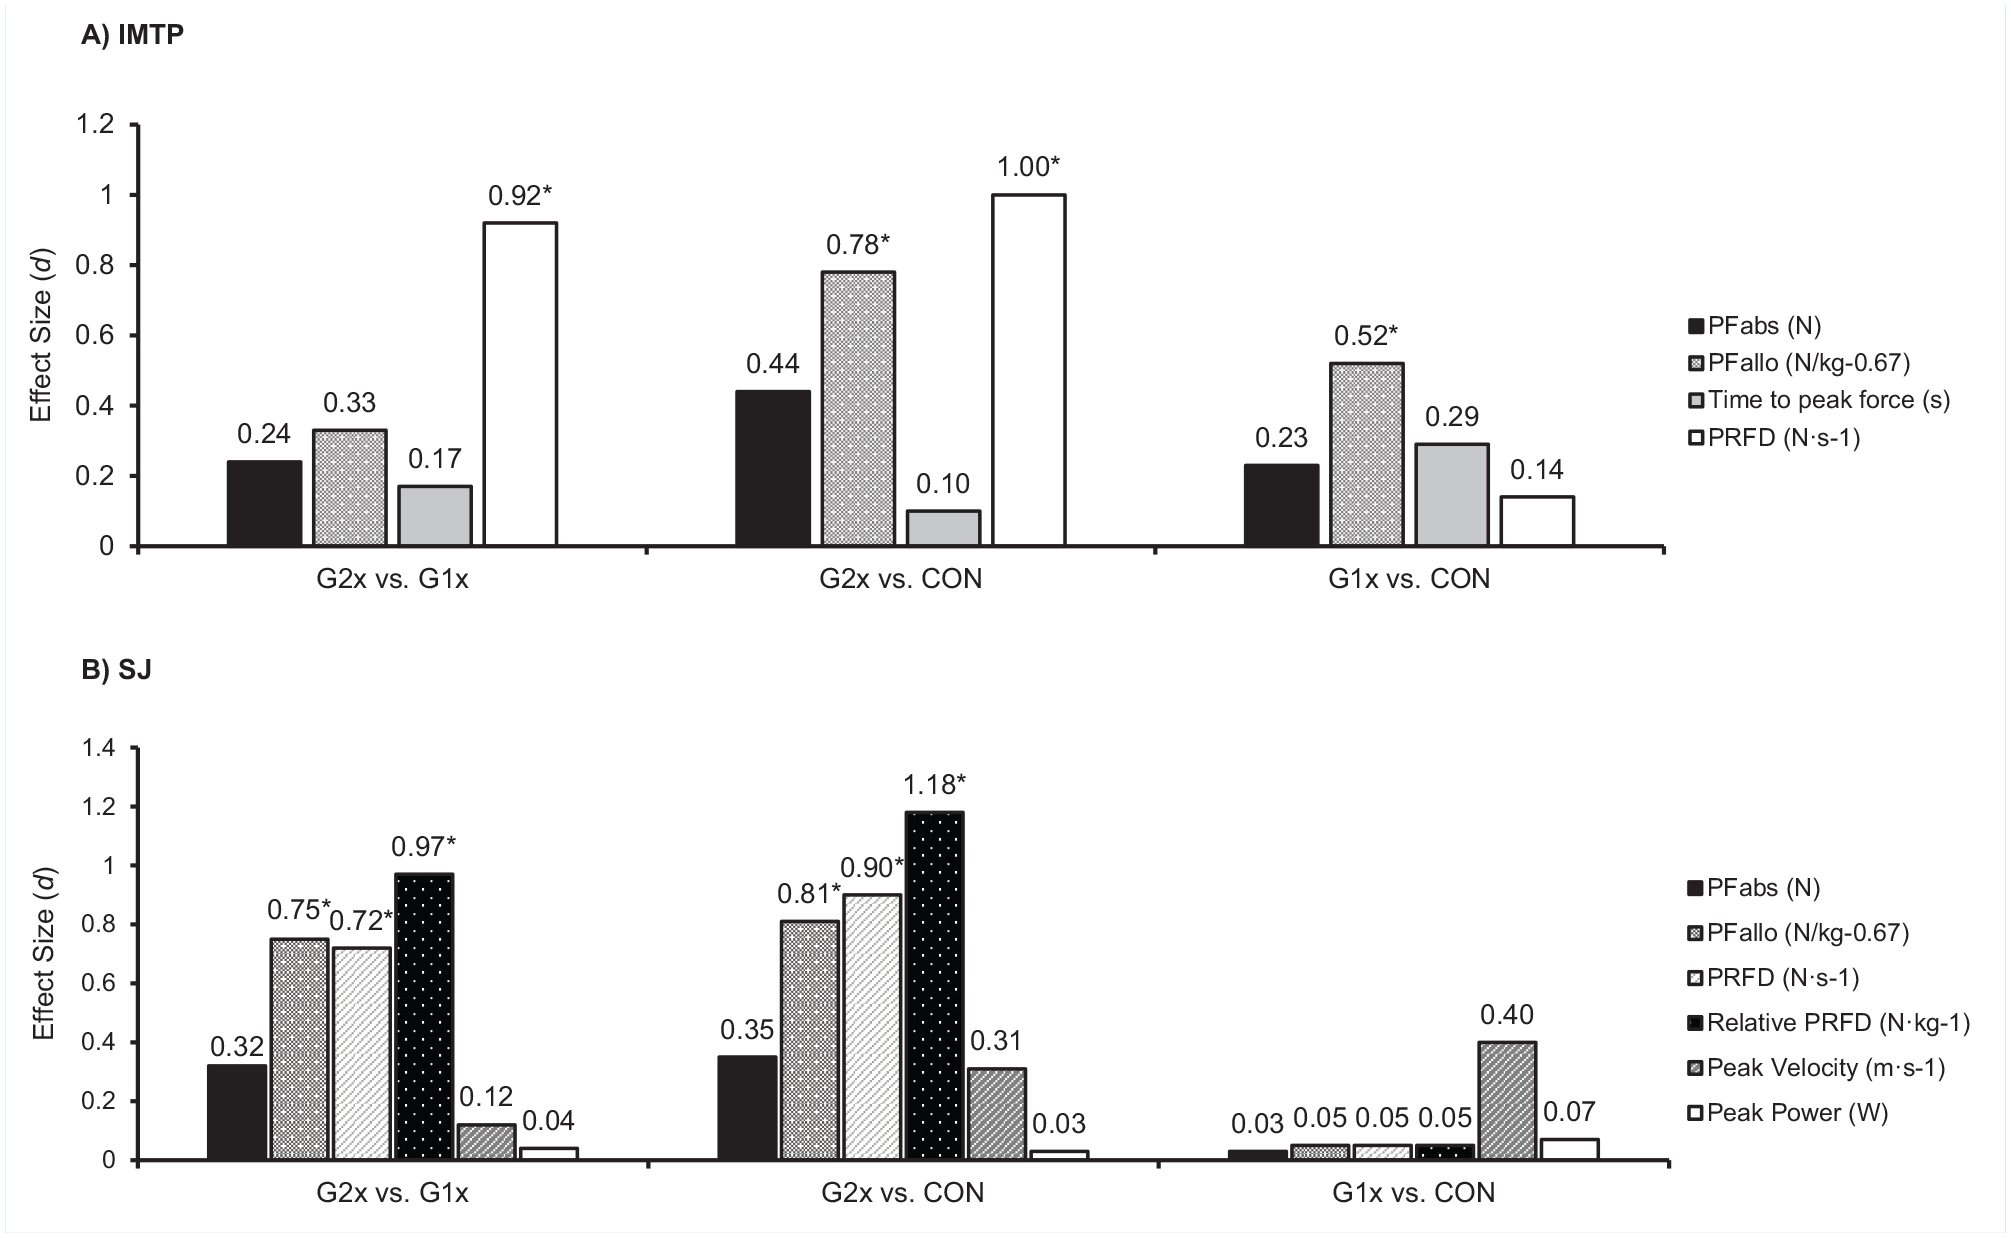
Effect sizes (d) comparing the effectiveness of one training condition over another for the (a) IMTP and (b) SJ kinetics. Training frequency groups are presented as twice-weekly (G2x), once-weekly (G1x), and control (CON) groups. *Denotes significantly larger change observed by G2x group (P < 0.05). IMTP, isometric mid-thigh pull; SJ, squat jump.
SJ and CMJ
Pre- and postintervention data for all SJ kinetics (Madj ± SD) are displayed in Table 5. Results indicated main effects for time for most variables and a number of significant within-group effects were observed. Most variables also reported significant time × group interaction effects, with G2x often experiencing greater training effects than those of the other groups (Figure 2). Comparisons between the G1x and CON groups were nearly always trivial, apart from a small difference in peak velocity in favor of G1x. Conversely, G2x experienced moderate positive training effects above those of both G1x and CON for PFallo, PRFD and PRFDrel (d > 0.7), and small positive effects for PFabs (d > 0.3).
Adjusted means with standard deviation for all SJ and CMJ kinetics pre- and postintervention along with significance values for time main effects and time × group interactions
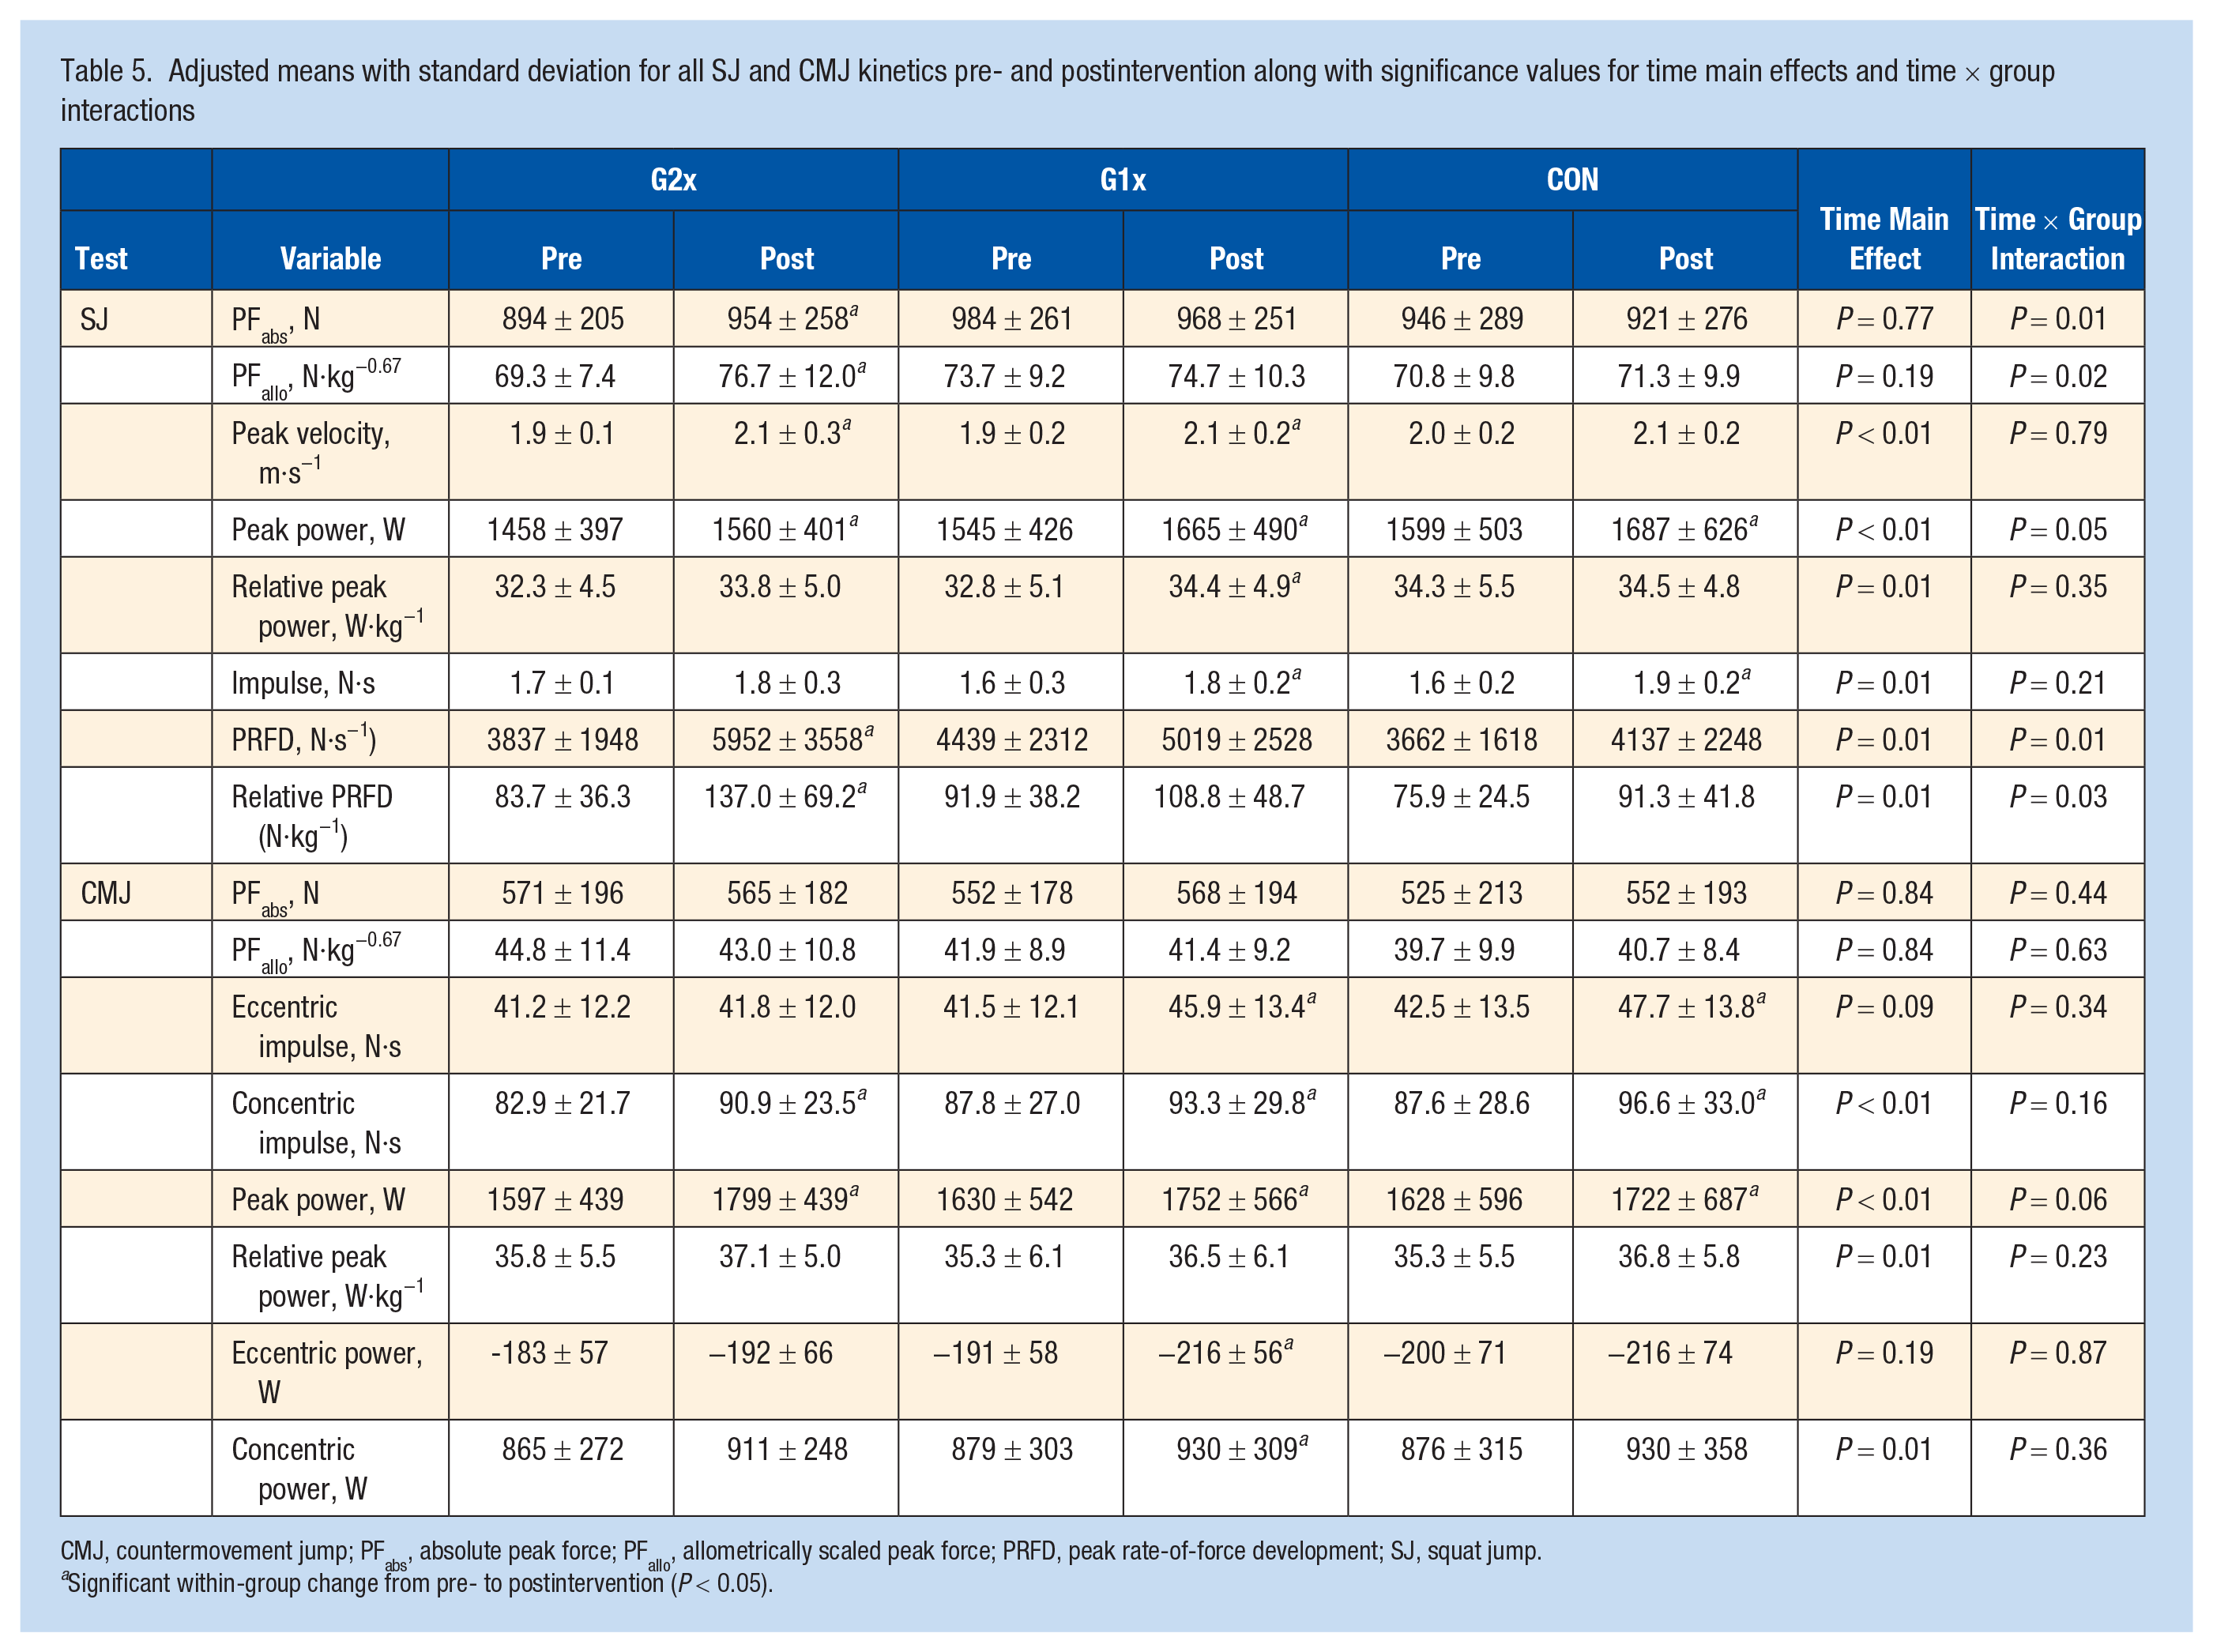
CMJ, countermovement jump; PFabs, absolute peak force; PFallo, allometrically scaled peak force; PRFD, peak rate-of-force development; SJ, squat jump.
Significant within-group change from pre- to postintervention (P < 0.05).
Pre- and postintervention data for all CMJ kinetics (Madj ± SD) are displayed in Table 5. There was a main effect for time for concentric impulse, peak power, relative peak power, and concentric power (P < 0.05). Significant within-group improvements for concentric impulse and peak power were observed in the G2x and G1x groups. Nearly all between-group comparisons for the effect of training for CMJ variables were trivial (d < 0.20), with the exception of a small effect in favor of the G2x over the CON group for PFallo (d = 0.26) and peak power (d = 0.21). No time × group interactions were observed for any CMJ variables (p < 0.05).
Regression Analyses
Results of the stepwise linear regression analyses are shown in Table 6. Baseline fitness, training frequency, and maturity status were significant predictors of both IMTP PFallo and PRFD, explaining 27.5% and 42.9% of variance, respectively. Training frequency and baseline fitness combined to explain a small amount of variance in SJ PFallo (12.2%), while baseline fitness was the only significant predictor for SJ PRFD and explained a small amount of variance (6.5%). The independent variables were unable to significantly predict CMJ peak power (P > 0.05).
Standardized beta (β) and adjusted R2 values for predicting the change in performance in IMTP and SJ kinetics
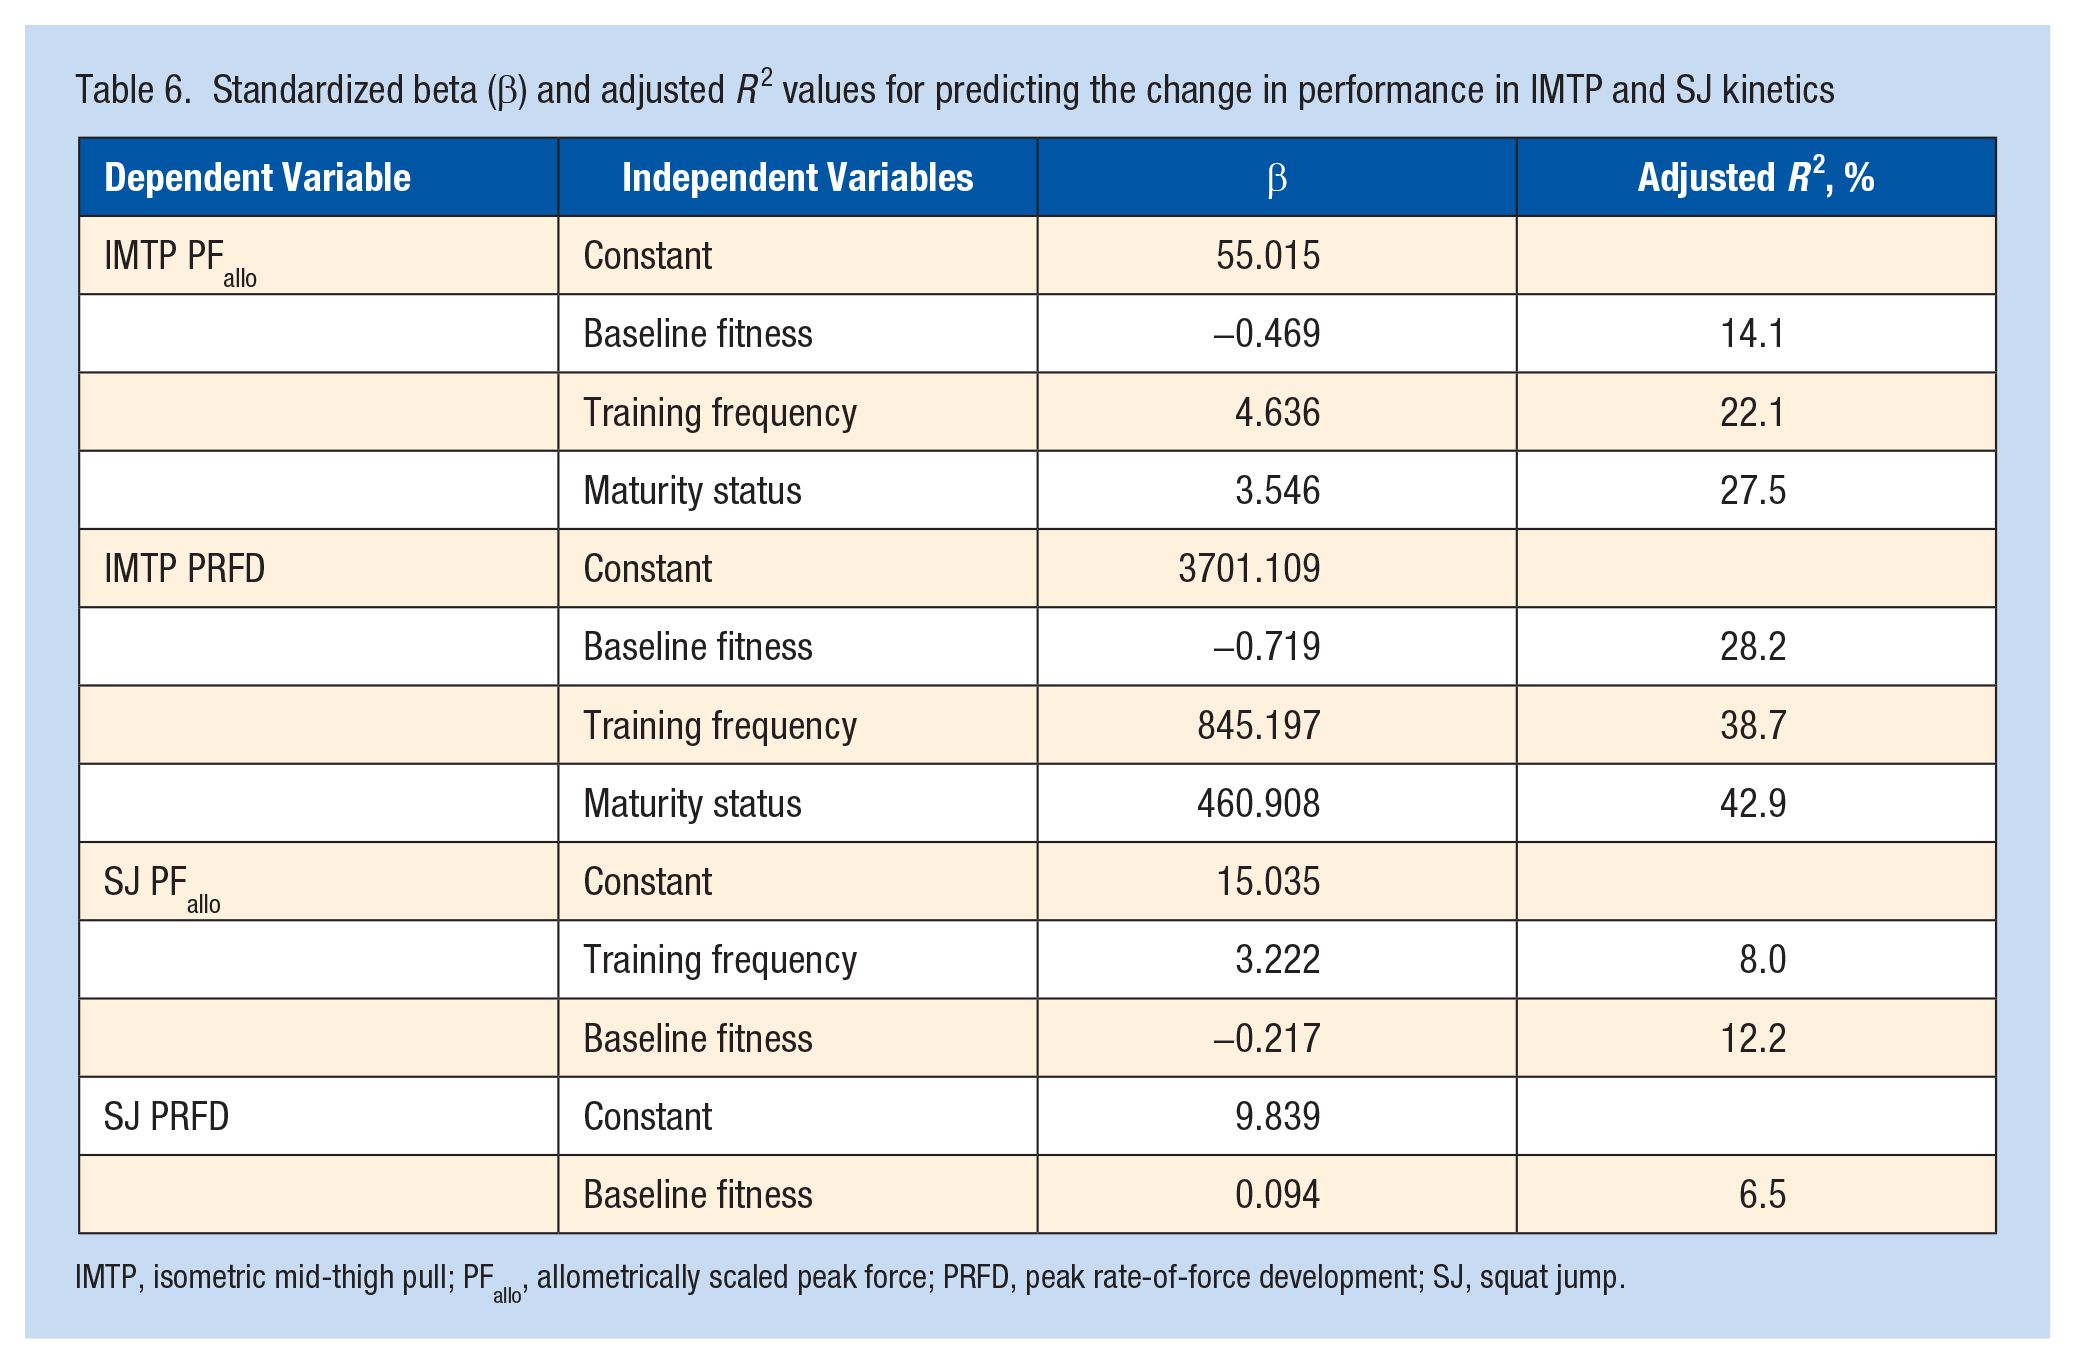
IMTP, isometric mid-thigh pull; PFallo, allometrically scaled peak force; PRFD, peak rate-of-force development; SJ, squat jump.
Discussion
The main aim of this study was to compare the effects of different training frequencies on movement competency and strength and power kinetics in young athletes. Results indicated that a twice-weekly training frequency elicited superior adaptations in BSA movement competency, isometric strength and SJ kinetics compared with once-weekly training over the course of a 28-week intervention. These findings indicate that a higher training frequency was more effective at improving movement control and slower velocity force production, but not explosive force qualities. Significant interaction effects across the IMTP and SJ tests revealed that the G2x group consistently experienced larger training effects above the G1x and CON groups. Comparisons for the training effects from the G1x and CON groups were often in favor of the G1x group, but nearly always trivial. Baseline fitness and training frequency explained the greatest amount of variance in IMTP PFallo, IMTP PRFD, and SJ PFallo, indicating that reduced levels of baseline fitness and a higher training frequency resulted in a greater training response. Maturity status was a significant predictor of IMTP PFallo and IMTP PRFD, indicating that advanced maturity status enhanced training responsiveness in isometric strength. Cumulatively, a 28-week, G2x program resulted in significantly larger improvements in movement competency, isometric strength, and concentric jump performance in young athletes compared with G1x, with the training response moderated by baseline fitness, training frequency, and maturity status. In light of these findings, both of the proposed hypotheses in this study are accepted.
The present study identified that the G2x group displayed an improvement in BSA total score after the training intervention, whereas no changes were observed in either the G1x or CON group. While exercise technique was emphasized in all sessions for both training groups, it is likely that the additional weekly session provided the G2x group additional opportunities to enhance their movement competency. Meta-analytical data have shown that resistance training is an effective method for enhancing motor performance in children and adolescents when prescribing loads of at least 50% of an individual 1RM (repetition maximum). 3 However, a 50% 1RM training intensity was also reported to be the “minimal threshold” for improving motor skills and that greater exercise intensities may be more conducive to enhancing motor competency. 3 Since the G1x group performed low-load resistance training during the field-based sessions, it is likely the “minimal threshold” was not consistently met and may explain why BSA movement competency did not change. Therefore, the improved BSA movement competency by the G2x group can be partially attributed to the training effects of consistently performing resistance training at higher intensities while maintaining proper movement technique. Similarly, enhanced movement competency has been associated with greater athletic performance,33,36 and therefore it is likely that improving squat movement competency transferred over to force producing abilities in the IMTP and SJ by the G2x group. Therefore, positive adaptations in isometric strength and dynamic jump performance by the G2x group may be associated with the improved squat movement competency.
While previous long-term training studies have used changes in 1RM as a measure of muscle strength,20,39 the current study examined the effects of different training frequencies on kinetics underpinning changes in strength and power. Data from the IMTP revealed significant time × group interactions in IMTP PFabs and PFallo, which reflected significant increases in both the G2x and G1x groups after the intervention, while no changes were observed in the CON group. The significant increases in both PFabs and PFallo by both training groups indicate that G2x and G1x frequencies successfully elicited increases in isometric force production, albeit with larger gains experienced by the G2x group. The changes in PFallo indicate that when normalized relative to body mass, significant differences in isometric peak force remained, indicating the potential contribution of neural mechanisms to the ongoing kinetic adaptations. Advanced motor unit recruitment and synchronization positively influence the production of maximal voluntary force in youth10,41 and these mechanisms are likely responsible for the improvements in the PFabs and PFallo evidenced by the G2x group over the 28 weeks. There were small training effects in favor of the G2x over the G1x group (d ≤ 0.33) in most IMTP RFD variables, with the only significant training effect observed in PRFD (d = 0.92). Similar findings were reported in a 12-week, twice-weekly training study where very large changes in IMTP PRFD were observed in post–peak height velocity (post-PHV) male athletes (d = 2.60) and moderate changes in pre-PHV male athletes (d = 0.64). 12 The increase in PRFD by the G2x group supports the use of combined strength training and plyometric training strategies, which previous research has shown to be more effective than plyometric or strength training alone for improving force producing capabilities in young male athletes.19,28,37
The current study reported significant main effects for time across nearly all SJ kinetics, indicating that all groups improved in SJ performance over the 28-week intervention. However, significant time × group interactions were also revealed for PFabs, PFallo, peak power, PRFD, and relative PRFD, with the G2x group showing moderate-to-larger increases in PFallo, pRFD, and relative pRFD over both the G1x and CON groups. Keiner et al 21 reported no changes in SJ height after the first year of a twice-weekly training program; however, significant increases in SJ height were observed in the subsequent year of the intervention. The authors hypothesized that the delayed adaptations in the first year were likely because of the low volume (4 exercises, 10-15 repetitions) and intensity of training, along with the training sessions only lasting 20 minutes. 21 Comparatively, the twice-weekly program in the current study used higher volumes, intensities and session durations, which likely provided a greater stimulus to elicit adaptations in SJ kinetics within a shorter time frame (ie, 24 weeks). Considering the force-velocity relationship, 9 it is conceivable that the more frequent higher resistance training intensities within the additional gym-based session gave an opportunity to develop slower velocity, higher force producing qualities in the G2x group as opposed to the G1x group.
Young athletes performing resistance training has been supported by previous meta-analyses as an effective method for improving CMJ performance.23,34,40 In this study, there were significant main effects for CMJ concentric impulse times, peak power, relative peak power, and concentric power, which indicate that both G2x and G1x programs significantly improved CMJ performance. There were no time × group interactions (P > 0.05), and most comparisons of between-group training effects were trivial. The lack of changes in CMJ kinetics in both the G2x and G1x groups may be due to the principle of training specificity. Notably, the plyometric content of the first 2 training blocks focused on jumping and landing mechanics and slow-SSC exercises, before transitioning to higher-velocity, fast-SSC exercises in the final training block. Intuitively, the participants may have required greater exposure to faster SSC activities to potentially realize the supercompensation effects in CMJ kinetics. Similar adaptation time courses were evident in a 28-week combined training program, in which adolescent male athletes realized larger gains in movement competency and isometric strength, which preceded small to moderate increases in CMJ. 35 Thus, much in line with previous training theory, it is important to establish foundation levels of muscle strength and movement competency to subsequently develop muscular power in young athletes.2,35
Notwithstanding the between-group comparisons, regression analyses showed that training frequency was also a significant predictor to the mean changes in IMTP PFallo, IMTP PRFD, and SJ PFallo. While only explaining a small amount of variance (~8%-11%), these findings indicate that a higher training frequency positively influences the magnitude of adaptation in isometric and dynamic kinetics after exposure to neuromuscular training, For example, G1x led to an increase in PFallo of ~4.6 N·kg−0.67, whereas G2x resulted in a relative strength gain of ~9.2 N·kg−0.67. Our findings corroborate with previously published meta-analytical data that noted the beneficial effects of a higher weekly training frequency. 4 Of note, baseline fitness explained the most variance in IMTP PFallo (R2 = 14.1%) and IMTP PRFD (R2 = 28.2%) and contributed a small amount of variance to SJ PFallo (4.2%). The negative beta coefficients denote those individuals with lower levels of baseline fitness were more likely to experience greater adaptations from the training intervention. These findings are consistent with previous meta-analytical data examining strength and power training responsiveness of trained versus untrained youth populations. 2 Regression analyses also showed that maturity status was a significant predictor of changes in the IMTP dependent variables, with more mature individuals experiencing a greater training response. For example, when considering the maturity offset groupings, our data indicate that a young athlete 1 year post-PHV is likely to experience double the increase in isometric strength (~7.2 N·kg−0.67) compared with an athlete 1 year pre-PHV (~3.6 N·kg−0.67). These findings align with previous research that has highlighted the ability to enhance muscular strength from resistance training increases with maturity status. 4
There are certain limitations within the current study that warrant consideration. First, not all training sessions were gym based, which meant that there were subtle differences in the programs followed by the G2x and G1x groups. For example, certain resistance training exercises were modified in the field-based sessions because of equipment constraints (eg, use of dumbbells instead of a barbell). However, the intended movement pattern (eg, hip hinge) loads used and desired adaptation (eg, increased muscle strength) were relatively consistent across training sessions, albeit with the use of slightly different exercises. Similarly, irrespective of the resistance training equipment and exercises selected, participants were encouraged to perform the ballistic, plyometric, and resistance exercises in the field-based sessions with maximal intent to maximize neural drive. While a more controlled research design would have been desirable, the current study reflects the real-world demands of coaching youth populations and our flexible approach to program design reflects leading international consensus on long-term athletic development. 24
Second, the sample size did not allow for participants to be grouped according to maturity status. To account for the potential influence of maturation, maturity status and growth rate were included as covariates in the analyses.
Third, the maturity offset possesses a standard error of approximately 6 months, which is accentuated in early and late maturing individuals. However, the maturity offset is recognized as a viable tool for estimating maturity status, especially for cases where parental heights cannot be obtained.
Finally, the current study only included kinetics and the addition of kinematic data would have enabled a better understanding of specific joint loadings. Nevertheless, there has been on over-reliance on performance outcome measures in previous pediatric training interventions and therefore the use of kinetics in this longitudinal study is deemed novel.
Cumulatively, the current study makes an original and significant contribution to the pediatric literature and has helped better understand the role of training frequency on strength and power adaptations in male youth. Of note, this study was also conducted in a manner that reflects the realities and logistical challenges of delivering to a large-scale cohort of young athletes within a real-world, long-term athletic development pathway.
Conclusion
A twice-weekly training frequency resulted in young athletes experiencing superior gains in movement competency, isometric strength, and concentric jump performance when compared to a once-weekly frequency over a 28-week training intervention. These findings provide yet more evidence to support the utilization of strength and conditioning to develop movement competency and strength and power in youth populations and that a higher training exposure will likely result in greater adaptations. The current study also highlighted that the training response is likely to be greater in youth with lower baseline levels of fitness and advanced maturity. In addition, interpretation of any training intervention involving young athletes should consider the likely influence of baseline fitness and maturity status to better understand the training response.
Footnotes
The authors report no potential conflicts of interest in the development and publication of this article.