
Abstract
Successful community-based wildlife monitoring necessitates a high degree of local participation during sampling design and data collection. Here, we describe a community-based monitoring framework to estimate density and habitat use of the threatened jaguar (Panthera onca) in tropical montane forests in the Chinantla region of Oaxaca, Mexico. Community-based monitoring was completed involving integration with local communities, local governmental agencies, nongovernmental organizations, and academic institutions. In a camera-trap survey (37 stations, 2,553 trap-days), we recorded eight adult jaguars across 182.7 km2 of montane forest. Spatially explicit capture–recapture models estimated a density of 1.15 jaguars per 100 km2 (CI = 0.55–2.38) using a more traditional likelihood-based method and 1.16 jaguars per 100 km2 (CI = 0.89–1.57) using Bayesian methods. The locations of jaguar captures and their habitat use appeared to be influenced by normalized vegetation index and capture rate of prey. Density estimates in the Chinantla region were lower than recorded for other lowland populations in Mexico but were consistent with elevation-based and latitudinal gradients across the range of the species. The community-based monitoring of jaguars increased the communication and interaction of local community groups, stakeholders, and academic institutions. It also provided participants with an increased knowledge of wildlife identification, transferable skills, wildlife appreciation, and an interest in reaching compromises to achieve habitat conservation. Our study provides a framework for the execution of community-based monitoring for large carnivores in Mexico and can be readily replicated and applied to other threatened species.
Keywords
Overall, jaguars are considered a near-threatened species (International Union for Conservation of Nature, 2018) due to the fragmentation and loss of their habitat, reduction in the availability of their prey, and illegal hunting (Quigley et al., 2017). Mexico holds the northernmost populations in their range, and several of these populations qualify as critically endangered in the red list categories of the International Union for Conservation of Nature (de la Torre et al., 2017). In Mexico, the jaguar is considered endangered (SEMARNAT, 2010). To protect the species, the government promotes specific programs for its conservation, in which community-based wildlife monitoring is a key component (Ceballos et al., 2016; SEMARNAT, 2012).
Community-based wildlife monitoring has important benefits such as the local appropriation of conservation initiatives and projects, increasing the probabilities of success, due to the high involvement of local communities (Conrad & Hilchey, 2011; Danielsen et al., 2007; Dickinson et al., 2012). Moreover, community-based wildlife monitoring generates employment, high social motivation (Burton, 2012), and a higher tolerance for human and wildlife conflicts (Treves et al., 2009). Some authors, however, have criticized community-based wildlife monitoring by identifying shortcomings in poor method protocols, biases in compiling information, lack of robust data analysis, and poor effectiveness of the wildlife monitoring system (Burton, 2012; Conrad & Hilchey, 2011). These challenges for community-based wildlife monitoring can be overcome by increasing the training of local people and by having closer participation and collaboration with academic institutions (Chandler et al., 2016; Conrad & Hilchey, 2011). Ultimately, the community-based wildlife monitoring process could be a great asset to large carnivore governance and management (Danielsen et al., 2003; De Angelo et al., 2011), because it requires coordination with local communities and supports the development of trust between interest groups, representation of stakeholders, acknowledgment of the different knowledge spheres, communication among groups, and leadership (Danielsen et al., 2003; Sjölander-Lindqvist et al., 2015).
Community-based wildlife monitoring efforts conducted with appropriate research objectives and that use camera trapping protocols linked to robust data analyses can provide valuable information regarding the populations of target species. Camera trapping reduces errors in taxonomic identification by producing a permanent image of an organism and allowing for detailed observation (Burton, 2012). In addition, expert knowledge of local communities combined with that of trained scientists can significantly increase the detection rates through camera trapping of target species (Danielsen et al., 2014). For example, in a tri-national survey of pumas (Puma concolor) and jaguars (Panthera onca) in the Atlantic forest, trained volunteers looked for felids’ sign, providing scientific evidence of their presence, improving the knowledge of these felids across extensive areas (De Angelo et al., 2011). In Botswana, Africa, nonrandom surveys based on local knowledge for estimating the abundance of the cheetah (Acinonyx jubatus) increased sampling success to 53 photographs, compared to 9 obtained by using the traditional random method, thus improving the estimate of abundance (Brassine & Parker, 2015).
The Chinantla region, located in the State of Oaxaca, is an important link for connectivity of jaguar populations in southern Mexico (Rabinowitz & Zeller, 2010; Rodríguez-Soto et al., 2013) and has also been identified as an area with a jaguar population (de la Torre et al., 2017; Jędrzejewski et al., 2018; Wultsch et al., 2016). However, few studies of jaguars have been conducted in this region and virtually no data exist on their density or habitat use (Figel et al., 2011). We established a community-based wildlife monitoring program in the Chinantla region using camera trapping and field protocols with high local participation and collaboration among communities, academic institutions, and governmental and nongovernmental agencies (Danielsen et al., 2007). Specifically, we aimed to estimate jaguar density and habitat use in the Chinantla region, through the implementation of a community-based wildlife monitoring program.
Methods
Study Area
The Chinantla region is located in the Sierra Madre del Sur physiographic province in Oaxaca, southern Mexico (Figure 1). The climate is warm and humid in the lowlands, and cool and humid in the highlands with a mean annual temperature between 16°C and 25°C (Meave et al., 2006). The Chinantla is considered a hyperhumid region with annual precipitation ranging from 3,600 to 5,800 mm. It has a steep elevation gradient ranging from 60 to 3 000 m asl. The area is characterized by the ruggedness of the terrain, with slopes between 6° and 45° in 80% of the territory (Meave et al., 2006). Large areas of well-conserved forest, including tropical montane cloud forest and tropical rainforests, are typical habitats of this region (INEGI, 2013). This region is considered a priority conservation area of Mesoamerica for its exceptional tree biodiversity and endemic species (Albuquerque et al., 2015).

The Study Area Is Shown in the Black Box, and the Gray Area Is the State of Oaxaca, Mexico (Map in the Upper Right). The figure also shows the camera-trap stations set (white circles), community conservation areas (gray polygons), human settlements (gray triangles), rivers (blue lines), as well as the different types of vegetation and land use.
Social Approach
We established a community-based monitoring program for the jaguar in the five local communities that have actively participated in projects of forest conservation and sustainable management of Santa Cruz Tepetotutla, San Antonio del Barrio, San Antonio Analco, San Pedro Tlatepusco (Municipality of San Felipe Usila), and Nopalera del Rosario (Municipality of Valle Nacional; Méndez-López et al., 2015). These local communities belong to the Chinanteco ethnic group, holding almost 28,000 ha of social property (Figure 1), and they form a regional organization of communities (Bray et al., 2008). A total of six meetings between community members, experts, and governmental representatives were held between June and December of 2015 to define objectives, goals, monitoring protocols, analyses of results, discussion of results, and conservation actions (Table 1).
Activities and Achievements of the Meetings Carried Out to Establish the Operativity From a Community-Based Monitoring Program for the Jaguar in the Chinantla Region, Mexico.

In the first meeting, community stakeholders shared their understanding and knowledge of jaguars in the region, and we (as a group of experts) explained and discussed the importance of jaguar presence in the ecosystems and the necessity of counting their numbers and gaining basic ecological knowledge of the species. We also presented the objectives of the monitoring program and planned the training schedule. Each monitoring team was trained by an expert in the use of camera traps, including their manipulation, setting camera-trap stations, assumptions in the monitoring protocol, global positioning system (GPS units), field data recording, and the protocols for potential livestock predation events.
In the second meeting, we explained the protocol for estimating jaguar abundance, and specifically explained the schedule for field trips, identification of individuals, the distance among cameras, and data collection and management. In this meeting, we showed monitors a land use and vegetation map of the study area with sampling areas of 9 km2, which is the minimal home range of a jaguar female in Mexico (Ceballos et al., 2016; Chávez et al., 2013). Then, we discussed the suitability of the sampling areas with the monitoring teams, based on empirical knowledge of jaguar signs, terrain roughness of site, and accessibility. Ultimately, the monitors decided to monitor 21 out of 30 potential sampling areas (Figure 2). Immediately after this meeting, the monitors and the professional staff set the camera traps in the sampling areas. In the third, fourth, and fifth meetings, we accompanied the monitoring teams in the field to confirm that camera traps were correctly placed to record coordinates and to download data. We held a final meeting with stakeholders (local people, governmental agencies, and experts) to discuss the current state of knowledge and conservation of jaguars in the region. We emphasized a proactive attitude toward sharing monitoring experiences in the field, using the monitoring protocol, and discussing human–wildlife conflicts involving possible livestock predation (Table 1; Figure 2).

Monitor Brigades and the Experts Discussing Sampling Design for the Camera-Trap Stations During the Meetings in the Chinantla Region, Mexico.
We held a final meeting in December 2015, when the monitoring teams and experts presented and shared their results, and exchanged their experiences. This meeting was attended by close to 100 members of the participating local communities, two neighboring communities, and representatives of local governmental agencies and nongovernmental organizations.
Data Collection
We used 38 camera traps, including 18 Cuddeback Black Flash® and 20 Wildgame FZ12 ®. The monitoring teams placed each camera trap in a grid of 3 km by 3 km in places with animal trails or in sites showing evidence of tracks or jaguar scats. Cameras were set on trees at 0.4 to 1 m above the ground, depending on slope, and 1–1.5 m from the focal area. Teams cleaned the area and performed trials to ensure the functionally of cameras; each camera trap was georeferenced. The camera traps were separated between 0.5 km and 2.8 km, covering a convex minimal polygon of 182.7 km2. Single camera-trap stations were preferred over double stations to reach a larger and elongated area suitable for jaguar density studies (Tobler & Powell, 2013). Together, the monitoring teams and the experts checked camera traps every 15 days to verify their correct functioning, change batteries if necessary, and collect data. Digital copies of photographs were recorded to build a database of the wildlife species records and their associated data, such as the name of the station, community, monitor team, coordinates, and elevation of the camera-trap station, and the time and date of the records. Species were identified with the guides of Aranda (2000) and Reid (2009). Jaguar photographs were enlarged, cropped, and adjusted for brightness to observe differences and similarities in spot patterns (Figure 3) and allow individual identification (Silver et al., 2004; Soisalo & Cavalcanti, 2006;Wallace et al., 2003). Given that we used a single camera trap per station, identification of single individuals was follows: (a) we separated two groups of photographs: Group 1 included photographs of the left flank, and Group 2 included photographs of the right flank; (b) in each group of photographs, we identify individuals through their pattern of spots; (c) we obtained photographs of both jaguar flanks that moved immediately in both directions in front of the camera; (d) we compared photographs obtained previously, with Group 2 to detect matching spot patterns; (e) jaguars photographed by the left-back flank were compared with Group 2 to identify similarities; and (f) jaguars photographed by the left and head-front were compared with Group 2 to detect matching spot patterns.

Examples of Identification of Individuals of Jaguars From the Chinantla Region, Mexico. (A) and (B) are photographs of the individual named Hieh Li 6, whereas (C) and (D) are photographs of the individual named Hieh Li I4. (E) and (F) photographs show two different jaguars (Hieh Li 7 and Hieh Li 8, respectively). The black boxes are enlarged images showing spot patterns that allowed us to find differences/commonalities (white dash lines).
Data Analyses
Jaguar density was estimated using spatially explicit capture–recapture (SCR) modeling methods. SCR models are less biased by the edge effects and they do not require an ad hoc estimation of the effective area surveyed, as is necessary with the traditional capture–recapture models (Efford, 2004; Efford et al., 2009; Royle et al., 2009). SCR methods work under a conceptual model in which an animal’s probability of being captured by any particular trap is a decreasing function of the distance between the animal’s home range center and the trap (Royle et al., 2013). It is assumed that each individual occupies a fixed home range whose center is an unknown point and it is dispersed randomly, and successive trapping occasions are independent. In SCR methods, two processes are recognized in individual trap encounter histories: distribution of individuals across the landscape and an encounter/detection process that describes whether or not individuals are encountered by traps as a function of their location (Efford et al., 2013; Noss et al., 2012; Royle & Young, 2008; Royle et al., 2009). Therefore, two models are fitted separately, one for the distribution of animals (a spatial point process) and another for the observation process (Efford et al., 2009; Royle & Young, 2008).
To ensure consistent results with our SCR models, we applied two approaches to estimate derived parameters: (a) a likelihood-based method in the SECR package (Efford, 2019b) and (b) a Bayesian inference method in the SPACECAP package (Gopalaswamy et al., 2011). Both approaches were performed in the R environment (R Development Core Team, 2017). SECR and SPACECAP work in a slightly similar way: both fit a state model and an observation model with imperfect spatial detection (Efford et al., 2009; Royle et al., 2009).
The SECR package fits the field data with an inverted model of a simulation. The capture process is described with parameters and statistics based on a linear model of the spatial detection function. In the model, the animal home-range centers are distributed across the study area as a spatial point process with intensity (density) D. The state-model is a spatial-Poisson process for the animal’s home-range centers describing their distribution in the landscape (Efford, 2019a, 2019b; Efford & Hunter, 2018). In SECR, the observation model (a spatial detection model) is based on a distance-dependent detection function with parameters g0 and σ that relates the probability of detecting an individual at a particular detector (camera-trap station) to the distance of the detector from a central point in each animal’s home range, that is, it describes the decline in detection probability with distance (d) from the home-range center. Parameter g0 is the overall magnitude and σ is the spatial scale over which capture probability declines; g0 is constant across animals, occasions, and detectors (Efford, 2019b). The encounter rate at the home-range center (g0) using a scale parameter (σ) is estimated as a specific function of auxiliary spatial information collected in the survey and describes the animal movements (Efford, 2004).
SPACECAP implements a hierarchical model composed of two components: a point process model describing the distribution of individuals in space (or their home-range centers) and a model describing the observation of individuals in detectors (Royle et al., 2009). Unknown locations of marked individuals are treated as numerous latent variables, augmented by an arbitrary number of locations for unmarked and potentially existent individuals (Efford & Hunter, 2018; Royle & Young, 2008). The model is a type of binary regression model, similar to a logistic regression with parameters β0 and β1 indicating the initial capture probability (for a new individual) and recapture probability, respectively. The rate of decline in detection probability is associated with distance from an animal’s home-range center and is indicated by the parameter β2. SPACECAP uses the Markov chain Monte Carlo sampling in the estimation processes (Gopalaswamy et al., 2012). In addition, SPACECAP provides derived parameter p1 which is the encounter probability for individuals that have not previously been encountered and p2 describing the encounter probability for individuals subsequent to their initial encounter (Royle et al., 2009).
Both approaches work with same data input: (a) information about spatial location of detectors (geographical coordinates); (b) detection histories of marked animals, including re-sightings at each detector in each sampling occasion; and (c) information of habitat in an area surrounding the trap array, composed of equally distributed points of known coordinates and a binary data (habitat/no habitat). The surrounding area should be large enough for animals at the edge to have zero chance of appearing in the sample and large enough to account for all detected animals (Efford, 2019a). From the capture–recapture history of individuals of jaguars, a presence–absence matrix was constructed with 1-day sampling periods based on the dates of the photographs (Silver et al., 2004). For the area surrounding the trap array (mask) input, we used 2*σ following Royle et al. (2013) recommendations, which were also used previously in a jaguar density study in Marismas Nacionales, Nayarit, Mexico (Figel et al., 2016). Within that area, we used pixels of 0.266 km2 representing a potential home-range center. In SECR, a SCR model was fitted with a half-normal detection function and 95% confidence interval was calculated at α = .05. In SPACECAP, we selected the model without trap response, but with a spatial capture–recapture estimation, a half-normal detection function, and a Bernoulli detection process. For simulations in MCMC, we used 50,000 iterations, of which 10,000 was as burn-in period (to be discarded), a thinning rate of 1, and 40 animals as the maximum possible in the state-space. SPACECAP also calculates an accuracy test of the model using a Bayesian p-value estimate, where values near .50 indicate that the model provides an adequate description of the data, but values close to 0 or 1 imply model inadequacy (Gopalaswamy et al., 2012; Royle et al., 2009). Bayesian confidence intervals were also estimated. Raw data and codes to run the models are provided as online Supplementary material.
We estimated the jaguar occupancy using single-season occupancy-detection models in a maximum-likelihood framework (Mackenzie et al., 2002, 2018). These models estimate the probability of occupancy of species in a site while accounting for imperfect detection. When the home range of a target species is larger than the area covered by the sampling sites, probabilities of occupancy are interpreted as habitat use (Figel et al., 2019; Steenweg et al., 2018). To estimate the jaguar occupancy-detection, the capture–recapture histories of the species at each camera-trap station were combined into five15-day sample units (occasions), following Mackenzie et al.’s (2018) recommendations for rare species. Probabilities of occupancy and detection can be related to extrinsic factors, such as characteristics of the sites or survey technique employed, respectively; to take this into account in the occupancy-detection models, it is feasible to include covariates with a logit function (Fiske & Chandler, 2019; Mackenzie et al., 2018). We tested the percentage of forest cover, elevation, mean normalized vegetation index (NDVI), capture rate of prey, Euclidian distance to settlements, human population density, and Euclidian distance to roads as possible covariates influencing presence or absence of jaguars (Dueñas-López et al., 2015; Jędrzejewski et al., 2018; Paviolo et al., 2016; Rodríguez-Soto et al., 2011). The survey effort (i.e., the number of camera traps working in every occasion), brand of camera-traps, percentage of forest cover, distance to settlements, and coordinates were used as detection covariates. Settlements and roads data were obtained from INEGI (2010, 2011) maps. Mean NDVI and percentage of forest cover were calculated from monthly images from the last 10 years obtained from EarthExplorer (https://earthexplorer.usgs.gov/). The capture rates of prey was calculated with the quotient of the sum of the number of independent photographs of nine-banded armadillo (Dasypus novemcinctus), Mexican agouti (Dasyprocta mexicana), paca (Cuniculus paca), Central American brocket deer (Mazama temama), and coati (Nasua narica) and the survey effort (Santos et al., 2019). Elevation was recorded directly in the field. All the spatial analyses were done in QGIS (QGIS Development Team, 2018). Prior to occupancy-detection analysis, continuous variables were standardized (Fiske & Chandler, 2019).
To fit models, we follow a two-step procedure (Edwards et al., 2018). The species occupancy probabilities were held constant and the detection probability covariates were tested. Next, the best model explaining detection was included in occupancy model, testing variables. In both steps, covariates were assessed separately and in combination. The best model was selected according to the lower Akaike’s Information Criterion (AIC) and delta AIC values. Occupancy-detection models were fitted in the package unmarked (Fiske & Chandler, 2019) in the R environment (R Development Core Team, 2017). For those models with the best empirical support, based on differences <2 between the AIC and delta AIC (Burnham & Anderson, 2004), the importance of covariates was calculated with the sum of the model weights (AIC weight) for the model where covariate is present (Rovero & Zimmermann, 2016). Finally, the goodness-of-fit of the best occupancy-detection model was tested using a chi-squared statistic based on a parametric bootstrap with 1,000 simulations of randomized detections; also, the c-hat, a measure of overdispersion, was estimated. Both analyses were performed in the AICcmodavg package (Mazerolle, 2017).
Results
This community-based jaguar monitoring project meant that 50 people were trained with new skills in biodiversity monitoring. They were certified by the Federal Attorney for the Protection of the Environment of Mexico as Community Monitors. Also, in the regional meeting, a document containing comments, proposals, and initiatives regarding community-based jaguar conservation in the region was drafted by all the participants. The implementation of this community-based jaguar monitoring project led to the reaffirmation and strengthening of conservation agreements.
Jaguar Density
In 65 days of sampling effort (2,553 camera-trap days), we obtained 34 photographs of adult jaguars. We recorded jaguars at 67.56% of 37 camera stations. In 26 photographs (76.5%), 8 individual jaguars were clearly identified with 20 capture–recaptures (Figure 3), resulting in a capture rate of 13.31 photographs per 1,000 camera-trap/days. The remaining photographs, mainly overexposed pictures, could not be associated with any previously identified individual and were excluded from the jaguar abundance analysis. Overall, individual jaguars were captured-recaptured on average 3.12 times (minimum of one and a maximum of eight times). We recorded a mean maximum distance moved of 7,518 m (±3,181 m).
Both methods, likelihood-based and Bayesian inference, produced similar estimates of jaguar density: 1.15 jaguars per 100 km2 and 1.16 jaguars per 100 km2, respectively (Table 2). We found a larger value for σ with the likelihood-based method (5,996 m) than for Bayesian inference (5,400 m). Conversely, the encounter rate was higher for the Bayesian inference (0.0072) than the likelihood-based method (0.0046; Table 2). The Bayesian p-value based on individual encounters was 0.57 suggesting the accuracy of the model. A map depicted density estimates in home-range centers (number of jaguars per 0.226 km2) show the highest values at southeaster of the area sampled and moderate values at another area at western, with a range from 0.11 to 20.68 jaguars per 100 km2 (Figure 4).
Derived Parameters for Jaguar Camera Trapping Data From Chinantla Region, Mexico.
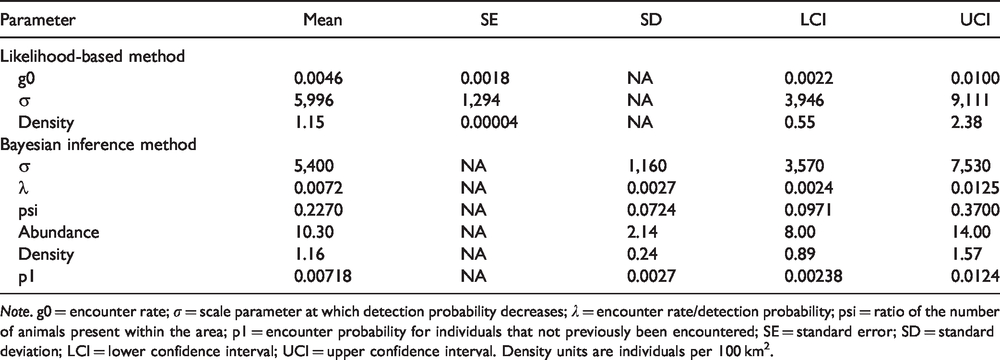
Note. g0 = encounter rate; σ = scale parameter at which detection probability decreases; λ = encounter rate/detection probability; psi = ratio of the number of animals present within the area; p1 = encounter probability for individuals that not previously been encountered; SE = standard error; SD = standard deviation; LCI = lower confidence interval; UCI = upper confidence interval. Density units are individuals per 100 km2.

Estimated Posterior Density of Jaguars in the Chinantla Region, Mexico. The blank dots are the camera-trap stations. Colored dots show the density estimated at each home-range center.
Jaguar Habitat Use
Given that some covariates were correlated >|0.6|, we removed human population density, Euclidian distance to roads, and elevation from further analyses. When occupancy was constant, we found the best model for detection function was the one that included the survey effort and percentage of forest cover (AIC 148.59; Table 3). The survey effort and percentage of forest cover were positively associated with jaguar probability detection, with a β value = 0.002 and β value = 0.538, respectively. Therefore, for occupancy-detection models, we kept these covariates in the detection function. Among the occupancy-detection models, the selection procedure showed two models with a substantial level of support (differences <2 of delta AIC with respect to AIC). The model with the lower AIC had prey and NDVI has covariates having a moderate weight (AIC weight 0.37), and it was followed by a model with NDVI as the only covariate (AIC weight 0.21). In fact, NDVI stands out as the most important explanatory variable with a score of 0.58 (the sum of all model weights including NDVI as a covariate). Prey, on the other hand, was only in one model with a score of 0.37 (Table 3). The test of goodness-of-fit for the best occupancy-detection model shows the model fit well (p = .69) and there is no evidence of overdispersion (c-hat = 0.89).
Summary of Model Selection Results in Determining Jaguar Detection and Habitat Use in the Chinantla Region, Mexico.
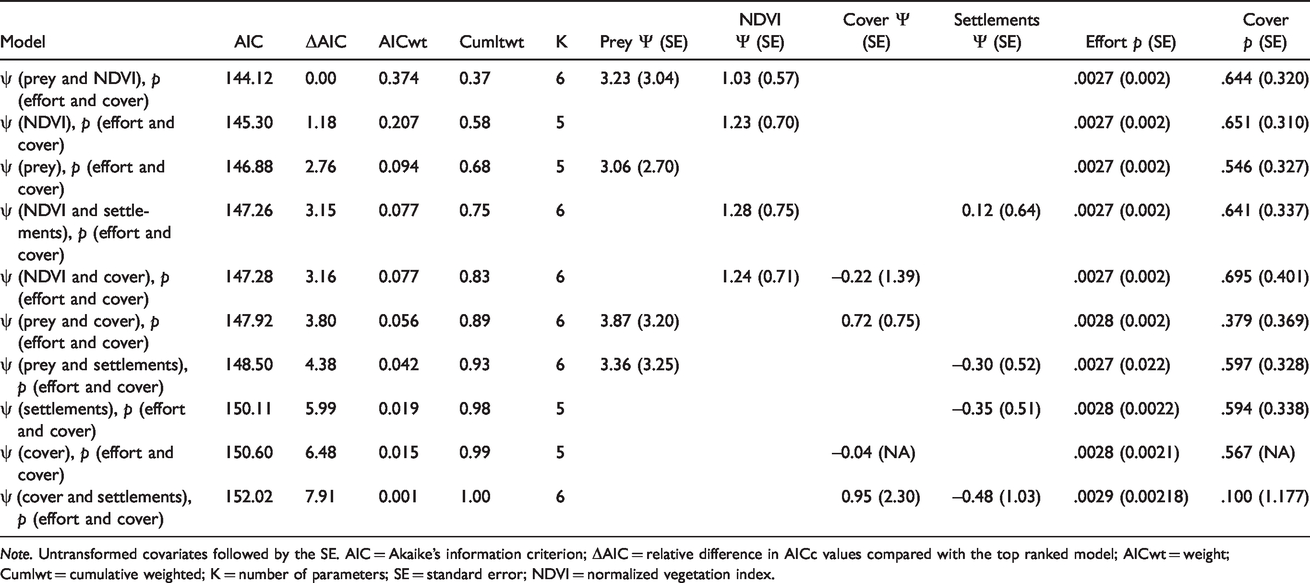
Note. Untransformed covariates followed by the SE. AIC = Akaike’s information criterion; ΔAIC = relative difference in AICc values compared with the top ranked model; AICwt = weight; Cumlwt = cumulative weighted; K = number of parameters; SE = standard error; NDVI = normalized vegetation index.
Discussion
This community-based jaguar monitoring study in the Chinantla Region, Mexico provides the first density estimates and examination of jaguar habitat use in tropical montane forests. The high local participation in partnership with external expertise was instrumental to obtaining enough data to achieve useful results.
Using spatially explicit models, we estimated a jaguar density of 1.15–1.16 jaguars per 100 km2 in the Chinantla region, which contains wide areas of montane forest habitat. These estimates are in the first quartile of estimates produced by 27 studies using camera trapping and spatially explicit models throughout the species range (Jędrzejewski et al., 2018) possibly indicating that jaguar density in this area is somewhat low. The highest densities estimated with spatially explicit models (>3 jaguars per 100 km2) were observed in Madre de Dios, Perú (Tobler et al., 2013), Hill Bank, Belize (Kelly & Rowe, 2014), Magdalena river, Colombia (Boron et al., 2016), and Hato Piñero, Venezuela (Jędrzejewski et al., 2018). Other estimates from areas of tropical forest in Mexico are consistent with the low density observed in Chinantla: For example, a mean density = 1.9 jaguars per 100 km2 was observed in the tropical rainforest of Quintana Roo (Ávila-Nájera et al., 2015), a density = 2.0 jaguars per 100 km2 was observed in the tropical deciduous and mangrove forest protected area Marismas Nacionales of Nayarit (Figel et al., 2016), and a mean density = 1.93 jaguars per 100 km2 was estimated in the Laguna de Términos, Tabasco (Hidalgo-Mihart et al., 2019). Our density estimation fits the pattern observed in studies with traditional capture–recapture models showing lower jaguar densities in tropical montane forests than in tropical lowlands (Maffei et al., 2011). Low population density may be due to the fact jaguars preferring habitats at low elevations with moderate slopes and where prey availability is potentially higher (Dueñas-López et al., 2015; Jędrzejewski et al., 2018; Rodríguez-Soto et al., 2011).
The Chinantla region’s complex topography, which consists of mostly montane cloud forest habitats characterized by steep slopes, mountainsides, and canyons, can hinder jaguar mobility and may present lower prey availability (Figel et al., 2011). In this area, the relative abundance of jaguar prey, measured as the detection rate per 1,000 (Jenks et al., 2011), showed that some species recorded during the survey had lower numbers in comparison to Chimalapas, the nearest tropical rainforest in southern Mexico (Nasua narica, 2.3 in the Chinantla and 4.1 in the Chimalapas; Cuniculus paca, 6.9 and 26.9, respectively). Conversely, the relative abundance was higher in the Chinantla (Dasypus novemcinctus, 13.3 and 5.8; Mazama temama, 6.1 and 3.1, respectively). Interestingly, other typical jaguar prey species with higher biomass, such as Tapirella bairdii, Dycotiles sp., or Tayassu pecari were not recorded in the Chinantla region. Whereas in the Chimalapas region, these species had a high relative abundance with 8.2, 17.5, and 25.1, respectively (Lira-Torres & Briones-Salas, 2012). Although there are no formal jaguar abundance studies in the Chimalapas region, the capture rate of jaguar and prey suggests a high jaguar density (Lira-Torres & Briones-Salas, 2012).
The length of our survey (65 days) was appropriate to ensure that occupancy (occupied or not occupied) would not change throughout the survey period (Edwards et al., 2018; Mackenzie et al., 2018; Wang et al., 2019). We found the percentage of forest cover, the survey effort, the capture rate of prey, and NDVI were the variables that best explained the jaguar habitat use. For the best model, the percentage of forest cover was the most important variable and was positively correlated with the probabilities of detection of jaguar. Likely, the highest probabilities for jaguar detections in sites with the highest forest cover were caused by jaguars expending most of their time in these areas, probably while searching for prey. Instead, less forested areas might be crossed by jaguars only occasionally, and therefore, the probabilities of detection there are low (Conde et al., 2010; Cullen-Junior et al., 2013). We found, for occupancy, NDVI was the most important variable followed by the capture rate of prey, with AIC weight of 0.58 and 0.37, respectively. These findings contrast with scores of model weights in occupancy models for jaguar in eight sites of Central America and Southern America, where, prey, and particularly large prey species, had a higher AIC weight (>0.90) and NDVI was of minor importance (Santos et al., 2019). NDVI is an indicator of the amount of photosynthetically active biomass in an area (Tucker, 1979), has a strong relationship with primary productivity, and has been associated with the abundance of herbivores (Borowik et al., 2013; Pettorelli et al., 2011). The temporal and spatial scale of NDVI data used in this study (MODIS images at 1 km of resolution) means that this index could indicate the potential availability of prey across a long time span in wider area surrounding camera-trap stations (Pettorelli et al., 2011). The capture rate of prey, on the other hand, could be a proxy for the availability of prey at a shorter timescale and directly at the site of camera traps. Therefore, both variables, NDVI and capture rate of prey, could reflect the potential availability of prey, but at different temporal and spatial scales. It is worth noting that prey abundance ranked as the most important variable impacting the habitat use of jaguars here and other regions (Gutiérrez-González & López-González, 2017; Santos et al., 2019).
This short-term study is the first to incorporate a community-based wildlife monitoring approach to obtain population information of a threatened large carnivore such as the jaguar (Danielsen et al., 2014). This community-based wildlife monitoring program was organized by involving the active participation of local communities, governmental agencies, nongovernmental organizations, and academic institutions. According to the classification system for monitoring proposed by Danielsen et al. (2009), the study presented here fits in category 3 “Collaborative monitoring with external data interpretation” because the primary data were gathered by local people with direction by professional researchers, and because the primary users of the data were local people and researchers. Furthermore, this study coincides with other characteristics of this category such as having an intermediate cost to local stakeholders and others (outsiders), intermediate requirement for local expertise, a high requirement for external expertise, high accuracy and precision in the sampling strategy and survey methods, and an intermediate potential for enhancing local stakeholders capacity (Danielsen et al., 2009). To achieve autonomous local monitoring wildlife, there should be a high involvement of local people, high transmission of knowledge among the population, and use of biodiversity data for decisions making in an immediate link to management. The enhancement of local stakeholder capacity should be fostered through the implementation of training courses for biodiversity monitoring, the use of data management and analysis programs, and through “experience exchange” trips on sites with local people who have experience from similar projects. Moreover, similar to forestry community projects in the region, the leadership of community members with professional training should be encouraged so that they can lead wildlife monitoring projects (Klooster & Masera, 2000).
A setback for continuing the project is the reduction of governmental financial support for studying populations of endangered species such as the jaguar. There is no other national program with similar objectives. However, local communities are already involved in conservation and uphold rules to protect wildlife habitats (Murguía et al., 2014). Currently, some local communities are developing actions to restore degraded areas, and all five communities receive incentives through ecosystem services programs (Denham, 2017) and are developing a broad study of biodiversity in coffee systems with national financial support and guidance of ONG and academy. As part of these projects, wildlife monitoring with camera-trapping is being conducted in each community. Future actions to ensure the continuation of the community-based jaguar monitoring must be provided with national and international financial support.
“Before” and “after” attitudes within monitoring teams regarding community-based wildlife monitoring of jaguar were not quantitatively assessed. However, comments from participants showed significant shifts in attitudes. For example, during the meetings, local participants expressed proactive comments such as: “the use of cameras with sensors have provided field experience. We were not aware that there would be so many photographs of animals in the region,” “conservation is a common task because if we allow these species to disappear, our families will never know them,” and “we learned how to use camera traps, and it was a very good experience since it allowed us to know a little more about what exists on our mountains.” Specifically, during the last meeting, the monitoring teams discussed their experience of community-based wildlife monitoring of jaguars and expressed the need to implement workshops on training, equipment, and security for future biodiversity monitoring projects. The monitoring teams recognized that the jaguar and other species are an important part of the regional wildlife and solving human-wildlife conflicts must involve collaborative agreements among local communities and organizations. At the conclusion of the study, the attitude of all participants was proactive, positive and enthusiastic, reinforcing the commitment of forest conservation (Bray et al., 2008). Our study represents not only a reference for future studies in montane habitats using spatially explicit capture–recapture models for jaguars but also an opportunity to continue collaborating with local communities and consolidating conservation programs.
Implications for Conservation
Although, at first, the cost of community-based monitoring for jaguar in the present study was moderately high due to the acquisition of necessary equipment, the subsequent cost per month was low ($1,578.00). Importantly, the community-based monitoring of the jaguar could be functioning as a surrogate for biodiversity conservation (Sergio et al., 2008), because of the demonstrated role of the jaguar as an umbrella species that provides additional benefits to other species of flora and fauna (Figel et al., 2018; Thornton et al., 2016). Furthermore, the ecological information obtained through community-based wildlife monitoring is a public asset (Danielsen et al., 2014; Dickinson et al., 2012) and can provide a baseline for species monitoring (Campos-Silva et al., 2018; Chandler et al., 2016; Gaidet et al., 2003). Although the continuation of community-based wildlife monitoring projects is less dependent on substantial funding resources, some external funding is necessary (Burton, 2012; Campos-Silva et al., 2018; Conrad & Hilchey, 2011; Dickinson et al., 2012). To maintain the investment of effort in the monitoring of jaguars in the region, there should be incentives for the teams such as supplies and field basics to surveys.
Community-based monitoring of jaguars is crucial given that the Chinantla region is located in the area of conservation and management of species known as the Sierras Norte and Mixe of Oaxaca, connecting populations of the Isthmus of Tehuantepec and the Sierra Madre Oriental (de la Torre et al., 2017; Rodríguez-Soto et al., 2013). Within the framework of governance and management of large carnivores, the relationship between humans and the jaguar in the Chinantla region is not yet firmly established. This project provides an example of the many human benefits to be had from community-based monitoring programs including increased interactions of local communities interested in conservation and management of wildlife, recognition of different knowledge approaches (academic and local), and communication between stakeholders and training to provide technical skills (Sjölander-Lindqvist et al., 2015).
Supplemental Material
TRC917825 Supplemental Material - Supplemental material for Community-Based Monitoring of Jaguar (Panthera onca) in the Chinantla Region, Mexico
Supplemental material, TRC917825 Supplemental Material for Community-Based Monitoring of Jaguar (Panthera onca) in the Chinantla Region, Mexico by Mario C. Lavariega, Jesús Alejandro Ríos-Solís, José Juan Flores-Martínez, Rosa Elena Galindo-Aguilar, Víctor Sánchez-Cordero, Silvano Juan-Albino and Ixchel Soriano-Martínez in Tropical Conservation Science
Footnotes
Acknowledgments
We thank the local communities and authorities of Santa Cruz Tepetotutla, San Antonio Analco, Nopalera del Rosario, San Antonio del Barrio, and San Pedro Tlatepusco. Miranda Davis, Natalia Martín-Regalado, two anonymous reviewers, and editors provided valuable comments and suggestions that improved this manuscript. Ma. del Sagrario Velasco, Andrea López Arteaga, Melissa Sue Ferrin, and Cuezpallin Rodriguez reviewed the English version of the manuscript. We also thank the Instituto de Biología, UNAM for financial support. MCL thanks EDI and SIP, Instituto Politécnico Nacional for their support.
Declaration of Conflicting Interests
The author(s) declared no potential conflicts of interest with respect to the research, authorship, and/or publication of this article.
Funding
The author(s) disclosed receipt of the following financial support for the research, authorship, and/or publication of this article: Commission of Natural Protected Areas (CONANP) financially supported this study through the Program of Conservation of Endangered Species (PROCER/RFSIPS/15/2015).
References
Supplementary Material
Please find the following supplemental material available below.
For Open Access articles published under a Creative Commons License, all supplemental material carries the same license as the article it is associated with.
For non-Open Access articles published, all supplemental material carries a non-exclusive license, and permission requests for re-use of supplemental material or any part of supplemental material shall be sent directly to the copyright owner as specified in the copyright notice associated with the article.