
Abstract
Damages by the Asian elephant (Elephas maximus) range from crop raiding to loss of human lives, and understanding the underlying causes thereof could help reduce such incidents. Land-use change could be among the major causes of elephant incidents since they are long-lived and tend to have particular home ranges. To test this hypothesis, we assessed deforestation rates in sites between the Nilgiris Biosphere Reserve and the Bhadra Tiger Reserve, Western Ghats of India between the 1960s and 2000s. Deforestation was calculated in windows of varying sizes to account for spatial scale responses. The locations of 624 incidents between April 2008 and March 2011 were used, and a database of 20,000 random locations provided contrasts. We used sets of 250 logistic regressions at each scale of deforestation to ensure that the significance of deforestation was independent of the randomly sampled contrast locations. A total of 6,761 km2 of forest and scrubland have disappeared from private forests in 50 years, with an average deforestation rate of –0.85%⋅y−1. The distribution of incidents followed an exponential decay with increasing distance from protected areas and a beta distribution against deforestation. Logistic regressions indicated a significant effect of deforestation at the small scale (1 km2 particularly and 4 km2). These results show that (a) incidents occur mostly near protected areas, and barriers or adaptation of livelihoods could address this problem and (b) deforestation is associated with increasing incidents with elephants. Avoiding deforestation and maintaining elephant population connectivity may help avoid incidents.
Introduction
Deforestation is a major threat to biodiversity (Newbold et al., 2015). It results in the destruction and fragmentation of natural habitats (Laurance et al., 2001) which increases the extinction risk of species through a cascade of demographic and genetic effects (Andren, 1994; Fahrig, 2003; Frankham, 1996; Saccheri et al., 1998; Young, Boyle, & Brown, 1996). Large mammals such as the elephant or the tiger search for mates or resources and sometimes disperse through the human-dominated landscape matrix (Douglas-Hamilton, Krink, & Vollrath, 2005; Reddy, Cushman, Srivastava, Sarkar, & Shivaji, 2017). Loss of human lives, injuries, and economical damages can ensue from these dispersal events (Gubbi, 2012; Gubbi, Swaminath, Poornesha, Bhat, & Raghunath, 2014). These negative interactions with elephants most often inappropriately referred to as conflicts (Davidar, 2018) are called incidents in this study.
Reported incidents with wildlife are increasing with time: Treves (2008) carried out an online search based on the keywords “human AND wildlife AND conflict OR depredation OR damage,” and the search engine returned 3,140 hits between 1992 and 1999, and 8,060 between 2000 and 2007. Incidents with elephants have a multiplicity of causes such as preference for crops (Chen et al., 2016; Sukumar, 1990), dispersal, chance, and so forth. Options to limit the number of wandering elephants or other animals out of protected areas can range from total exclusion with fences (Chang’a et al., 2016; Kalam, Kumar Baishya, & Smith, 2018) to landscape organization (Kremen & Merenlender, 2018; Santiapillai et al., 2010).
Elephants are increasingly found in human-dominated landscapes (Leimgruber et al., 2003). This happens in particular when private forests get transformed into plantations. Elephants are long-lived (Wiese & Willis, 2004), intelligent (Plotnik, de Waal, & Reiss, 2006), social (Nandini, Keerthipriya, & Vidya, 2017), and attached to a home range (Baskaran, Balasubramanian, Swaminathan, & Desai, 1993; Cushman, Chase, & Griffin, 2005). When elephants remain within their shrinking habitat eventually becoming disconnected from protected areas, deforestation forces them to come in contact with humans, thereby increasing the risk of incidents (e.g., Okello, 2005; Tan, 2017). To our knowledge, a relationship between the historical intensity of deforestation and the number of incidents has not been demonstrated yet.
In this study, we attempted to correlate the occurrence of incidents caused by Asian elephants (Elephas maximus) with the intensity of deforestation. Our study area (Figure 1) spanned over the Nilgiris Biosphere Reserve (India) in the south to the Bhadra Tiger Reserve in the north, where the world’s largest population of Asian elephant is found (Baskaran, 2013). We used the records of incidents (Figure 1) collated by the Karnataka Forest Department for the time period between April 1, 2008 and March 31, 2011 (details in Gubbi et al., 2014). We calculated deforestation based on the maps of Gaussen et al. (1961), Gaussen, Legris, Viart, Meher-Homji, and Labroue (1964), and Roy et al. (2015). Even though deforestation was calculated over a long period, the long average lifespan of elephants and fidelity to their range (Fernando et al., 2008) may allow for the correlation of some behavioral attributes with relatively long-term landscape dynamics. The study area, apart from being an important conservation hub in India, is the home of communities that economically relied mostly on agroforestry (see Study Area section) in private forests that were progressively transformed into plantations (Ambinakudige & Choi, 2009). Coffee and spice gardens were interspersed with private forests till recently. Hunting was widespread, a source of pride to the point of being a community tradition. Hunting possibly ensured food supply when agriculture output may not have been sufficiently reliable because of wildlife depredations.

Study area, reserves, incident locations, and deforestation.
We tested the hypothesis that incidents with elephants correlated with the intensity of deforestation measured over a 50-year period.
Methods
Study Area
Our study area (45,710 km2) extends from the Bhadra Tiger Reserve in the north to the Nilgiris Biosphere Reserve in the south, spanning parts of the states of Karnataka, Tamil Nadu, and Kerala, India (Figure 1). The main features of the landform are the coast, from the shore of the Arabian Sea to the Western Ghats, the escarpment of the Western Ghats and the Deccan Plateau (ca. 1,000 m above mean sea level). In the south, the Nilgiri Mountains or Nilgiris are a residual Precambrian charnockites massif reaching more than 2,000 m asl.
The climate is at the confluence of four climatic types: tropical monsoon, tropical savannah, temperate dry winter warm summer, and temperate dry winter hot summer (Kottek, Grieser, Beck, Rudolf, & Rubel, 2006; Peel, Finlayson, & McMahon, 2007). Rainfall occurs mostly during the south-west (May—August) and north-east (September—December) monsoons. The variety of landforms and climate types contribute to the existence of a diversity of ecosystems from rainforest to scrub jungles, montane forests, and grasslands (Roy et al., 2015).
The study region largely overlaps with the Western Ghats—Sri Lanka biodiversity hotspot (Myers, Mittermeier, Mittermeier, da Fonseca, & Kent, 2000) and harbors five major protected areas (Bhadra, Nagarhole, Bandipur, Mudumalai, and Sathyamangalam Tiger Reserves—Figure 1). The elephant population is the largest in the world, with approximately 6,000 individuals (Baskaran, 2013).
Our database of incidents attributed to elephants (Figure 1) was concentrated in south-east Karnataka. Silviculture is widespread, notably coffee production. Communities, such as the Kodavas, were attached to a tradition of hunting, and the population density is above 135⋅km−2 (Census of India, 2011). The juxtaposition of a dense human population and large animals creates problems affecting both humans and wildlife (Gubbi, 2009; Krishnan, Kumar, Raghunathan, & Vijayakrishnan, 2019).
Land Use
Our recent land-use raster map was based on the Roy et al. (2015) vegetation map of India. This reference map was prepared with 23.5-m satellite remote sensing data and was based on multiple images spanning one and a half decade from 1997 to 2012 with a medial year in 2004. Roy et al. (2015) represented the vegetation with 100 different classes. Only 31 classes were in our area of interest. These classes were merged into (a) forest, (b) scrub, (c) grassland, (d) forest plantation, (e) agricultural village mosaic, (f) urban area, and (g) water bodies. Our simplified land-use map was coarsened to 100-m spatial resolution with the r.resamp.stats module of GRASS GIS (GRASS Development Team, 2017), allocating the modal value of the moving window to the new pixels.
Two 1/1.000.000 land-use maps (Gaussen et al., 1961; Gaussen et al., 1964) were digitized. The field work for mapping started in 1959 (Gaussen, Legris, & Viart, 1961) and was over in 1961. The Cape Comorin map (Gaussen et al., 1961) was ready first, followed by the Mysore map (Gaussen et al., 1964). The maps consequently represent the 1960 land use on average. The two maps were merged into a single-vector land-use map referred to as the past land use in the rest of this study. It was imported in GRASS GIS and transformed to a raster with a 100-m spatial resolution. The land-use categories did not contain water bodies or urban areas. The past land-use map contained 558 patches where Roy et al. (2015) identified 86,817 patches at the spatial resolution of 100 m. All forest types (closed canopy forests and open canopy forests) were merged in order to avoid artificial thematic differences. The recent land-use map categorized urban areas (723 km2) and water bodies (1,115 km2) which represented 4% of the study area. Even though these land uses probably changed in five decades, they were ignored because of the small overall impact on calculated deforestation. The amount of grassland (i.e., high elevation grassland) in the 1960s (440 km2) and in the 2000s (1,214 km2) was not considered to be a process of expansion. The comparison of both maps revealed that the past land-use analysis failed to detect large extents of grassland that existed along the crest of the Western Ghats, in the Madikeri Region particularly. The grassland increase was therefore discarded as an artifact. Less than 0.5% of the study area was transformed into tree plantations outside protected areas. This effect was also discarded as impossible to ascertain with sufficient confidence. Water bodies, urban areas, grasslands, and forest plantations measured by satellite were copied in the past land-use maps to cancel artificial variations in these categories.
Deforestation and Elephant Impact
A deforestation map was obtained with the GRASS-GIS module r.mapcal by contrasting the past forest and scrub categories to the recent agricultural village mosaic. The areas of the different land-use categories were calculated with the r.stats module of GRASS-GIS and compared. From the deforestation map, we produced several maps aimed at calculating the average deforestation around a given pixel in 1, 2, 4, and 10 km2 moving square windows. This helped estimating the intensity of deforestation around every pixel, at different scales. The intensity of deforestation consequently represented the average destruction of forests in 1, 2, 4, and 10 km2 around each pixel. The annual rate of deforestation was calculated as in Puyravaud (2002). We finally produced a raster map to indicate the distance to reserves with the r.grow.distance module of GRASS-GIS. Records of individual incidents were rendered in a points vector layer in QGIS 3.4.2 (Quantum GIS Development Team, 2018). Incidents less than 10 km from the outer limit of the area of interest were deleted in order to avoid edge effect. We also removed 98 records of incidents within protected areas since these incidents were not related to land-use change from forest to agriculture. In total, 624 incidents were included in the analysis. At each incident location, we collected the distance to protected areas and averaged deforestation at various scales (1, 2, 4, and 10 km2). We generated 10 km buffers around the incident locations, merged the buffers into a single polygon, and removed protected areas whenever the polygon covered reserves. The difference polygon was supposed to represent the part of the landscape that was immediately close to the incidents. We generated 20,000 points at random within this polygon and extracted the same information as was collected in each incident locations, that is, the distance to protected areas, and averaged deforestation at various scales (1, 2, 4, and 10 km2). The data collected in the random locations (or contrast database) constituted unbiased samples of the landscape attributes of interest that could be contrasted with the data obtained at incident locations. To visualize the distributions of variables, we produced bivariate histograms with distance to protected areas and deforestation in 1 km2. We then fitted distance and deforestation to known statistical distributions and lastly we compared the fittest distributions with the Kolmogorov–Smirnov test.
We also tested whether distance to protected areas and deforestation could correlate with the occurrence of incidents. Incidents are presence-only data, and the absence of record of incident cannot be equated to absence of incident since historically incidents were less properly recorded. Consequently, our objective here was not to predict the occurrence of incident but simply to compare the landscape locations where an incident occurred against the rest of the landscape. To do so, we employed multiple logistic regressions with distance and deforestation as explanatory variables.
For each logistic regression, we clubbed together the 624 incidents and 624 sample points taken at random in the contrast database without replacement. Since several scales of deforestation were considered, we needed to ensure that locations were far enough from each other not to fall within the same deforestation window to avoid autocorrelation. Consequently, we applied different thinning thresholds (1.414, 2.828, 5.657, and 14.142 km) for each deforestation scale, which resulted in a smaller database of variable size (due to random sampling without replacement) used for the regression. Since contrast points were taken at random, their effect on the regression outputs could affect the value of the coefficients and their probabilities. To make sure we captured potentially significant effects, we ran 250 regressions per deforestation scale and examined the distributions of coefficients and probabilities. Since in some instances the residual deviance was higher than the degrees of freedom, we systematically applied a quasi-binomial distribution model. At each deforestation scale, we ran 250 regressions in order to obtain the distribution of the regression coefficients and their associated probabilities (Figure 5(a) to (f)). Since sample and incident databases were thinned with increasing window size, the number of locations taken into consideration ranged from the minimum of 48 in the 10 km window to the maximum of 748 in the 1 km window.
Statistical tests were done with R (R Core Team, 2018). We ignored the autocorrelation that may have ensued from incidents created by the same elephant since elephant individuals had not been identified. The incident locations were thinned once, and therefore, we also ignored the effect of randomizing incident locations before thinning. Bivariate distributions were done with the MASS R package (Venables & Ripley, 2002), and the choice of candidate distributions was done with the R package fitdistrplus (Delignette-Muller & Dutang, 2015).
Results
The comparison of the past and recent land cover indicated that a total of 4,023 km2 of forest and 2,738 km2 of scrub amounting to 6,761 km2 of elephant habitat (Table 1) have been destroyed. The agricultural village mosaic increased by 7,123 km2 (Figure 2), mostly in nonprotected areas 6,266 km2 (88%) and also in protected areas (857 km2 or 12%), mostly in the State of Kerala and in the Gudalur Region of Tamil Nadu. If we accept 1960 and 2004 as the average dates at which images and field data were gathered for the past and the recent maps, the annual rate of deforestation was approximately –0.85%⋅y−1overall.
Areas Per Land Use Categories.

Grassland, forest plantation, urban area, and water body categories were copied from the 2012 land-use classification map into the 1960s land-use classification map in order to minimize differences (see Methods section). When differences exist, this is due to an excess of the category in the 1960s land-use map.

Past and recent land uses.
Deforestation severed the link between the Tiger Reserves of the Nilgiris Biosphere Reserve and the Bhadra Tiger Reserve most notably in the west (Kodagu District) and in the north of the Nagarhole Tiger Reserve (Hassan District). The extensive forest cover that existed in these regions in the 1960s, mostly in private lands, has been severely transformed.
The bivariate histogram over distance and deforestation (Figure 3(a)) obtained from the set of 20,000 random locations represents a reference against which the bivariate histogram drawn from the points of incident locations can be interpreted. It showed that most sampled points and deforestation occurred near protected areas. Neither distance nor deforestation could be normalized.

Bivariate histograms against distance from protected areas and deforestation in 1 km2 moving window for (a) 20,000 random locations and (b) 624 elephant incidents.
The bivariate histogram derived from the 624 locations of incidents (Figure 3(b)) suggested that incidents occurred mostly at short distances from protected areas but also in places where deforestation was high (data shown only for 1 km2 moving windows). The difference between the two bivariate histograms and the relationship between distance and deforestation pointed to the possibility that incidents did not occur at random in the landscape.
The distributions of distance of random points and incidents followed best an exponential distribution (Figure 4; Table 2). The exponential decay was less intense in the case of incidents: Incidents happened on average further from protected areas than predicted by chance. The observed distributions were significantly different (Kolmogorov–Smirnov test D = 0.20, p < .001).
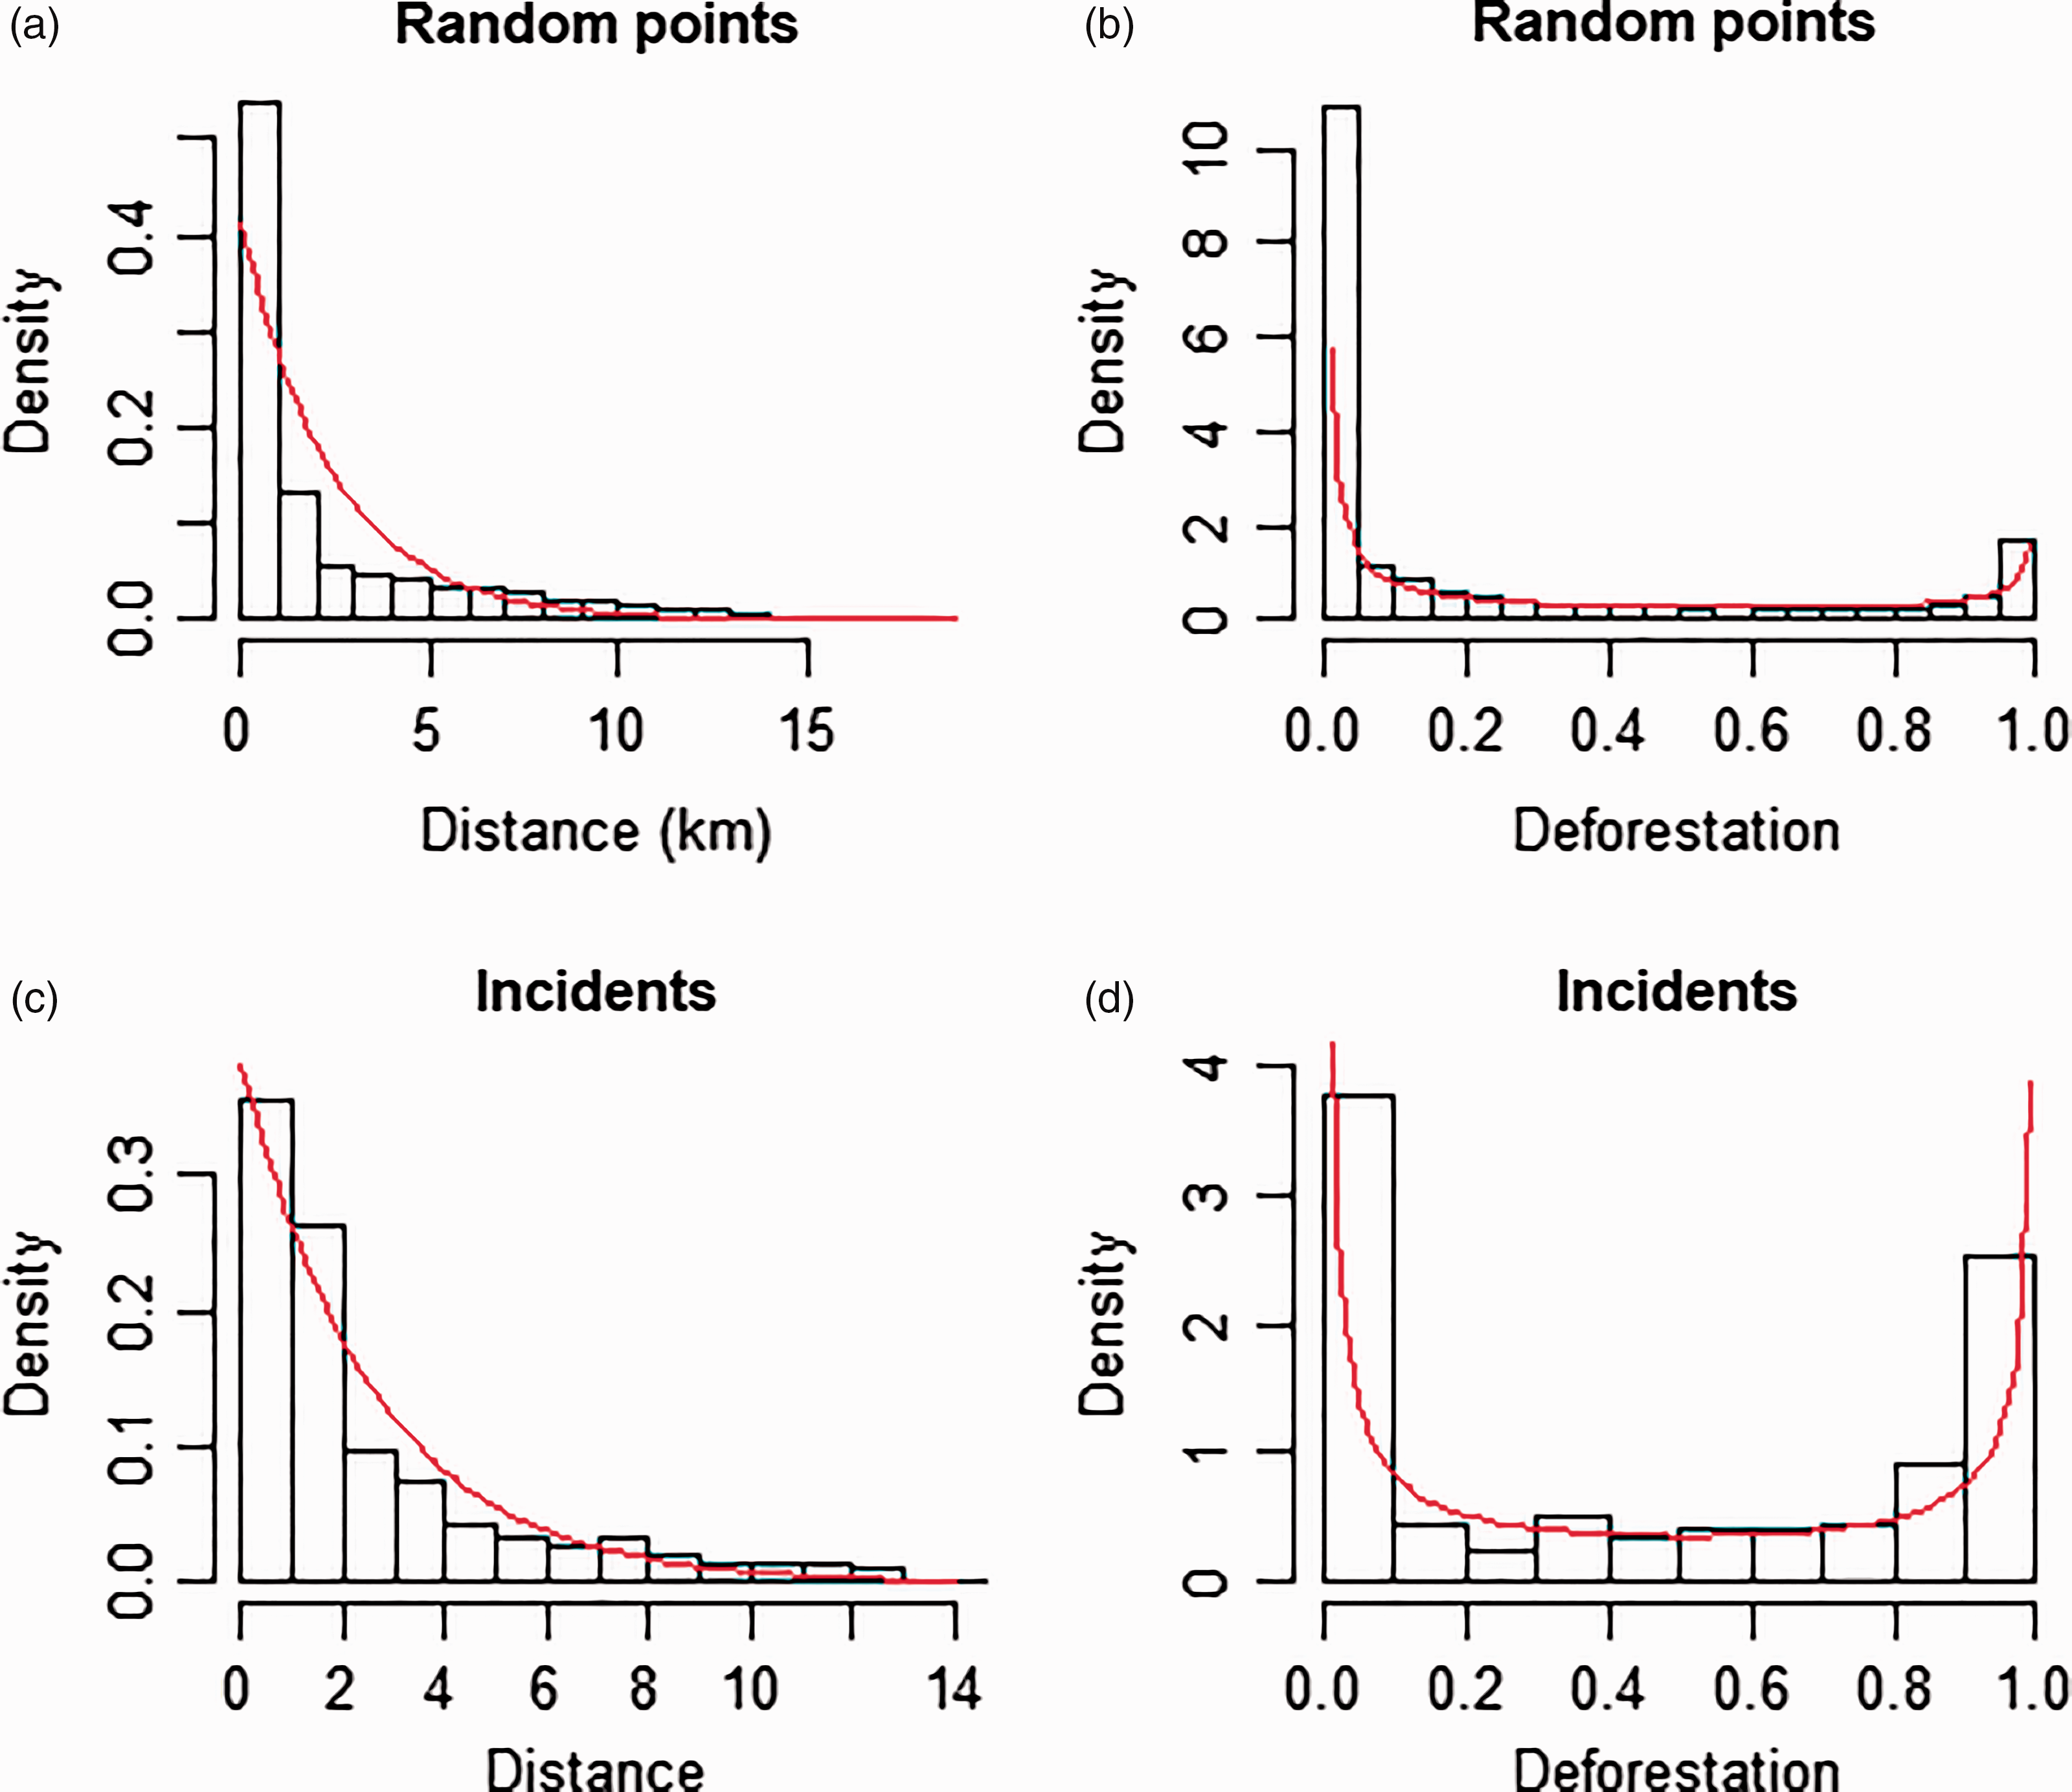
Univariate histograms of (a) random points against distance from protected areas, (b) random points against deforestation in 1 km2 moving window, (c) incidents against distance from protected areas, and (d) incidents against deforestation in 1 km2 moving window.
Fitted Distributions to Observed Distributions of Distance and Deforestation in a 1-km Window, Methods of Fitting, and Parameters.

The distributions of deforestation in a 1 km window of random points and incidents were best described by beta distributions (Figure 4; Table 2). Incidents, however, systematically occurred in places where deforestation was higher or very high. The observed distributions were also significantly different (Kolmogorov–Smirnov test D = 0.27, p < .001).
Deforestation in 1 km window was significantly correlated to the occurrence of incidents with an average coefficient of 1.305 and all probabilities below .005 (Figure 5). Distance was never found to be significantly related to incidents at any scale. There was a quasi-null negative interaction effect between distance and deforestation in a 1 km window. Deforestation was also correlated with incidents in a 2 km window (average deforestation coefficient = 1.412, average probability = 0.01 but maximum probability = 0.30). Regressions at other scales did not detect significant effects of distance or deforestation on incidents.

Outputs of 250 logistic regressions with deforestation in 1 km2 moving window, distance from protected areas and interaction between deforestation and distance as predictor variables. The estimate of deforestation (a) averaged approximately 1.3 with all probabilities (b) below 0.01. The estimate of distance (c) was near zero, and most probabilities (d) above 0.05. The estimate of the interaction between deforestation and distance was negative, but quasi null (e) and probabilities (f) mostly significant.
Discussion
Understanding the cause of incidents with large wildlife is important to be able to preserve human lives or livelihoods and at the same time reduce negative attitudes toward wildlife conservation (Madden & McQueen, 2014). In this study, we showed that a region covered with private forests was transformed in approximately 50 years to the point of severing the landscape connectivity between two major protected areas of the Western Ghats. We also observed that (a) incidents with elephants decreased exponentially with distance from protected areas and (b) incidents were correlated with historic deforestation at small spatial scales.
The entire study area and in particular the region in between the Nilgiris Biosphere Reserve and Bhadra Tiger Reserve have witnessed extensive land-use changes between the 1960s and the 2010s. Around 7,123 km2 of natural ecosystems had been transformed into agricultural mosaics. The technologies used to measure the forest cover differed widely, ranging from field surveys in the 1960s to satellite imagery in the 2010s, but the deforestation rate of –0.85%⋅y−1 measured here was within the range of deforestation (–0.73% to –1.84%⋅y−1) calculated by Jha, Dutt & Bawa (2000) over the Western Ghats.
Gubbi (2012) observed with the same database of incidents, that croplands less than 5 km from a national park suffered more losses to elephants than farmlands beyond this distance. Here we additionally found that the number of incidents with elephants decreased with distance from protected areas following a simple exponential decay model (Figure 4).
This exponential decay model of incidents may not be generalizable to other landscapes. Hoare (1999) found an irregular and unpredictable pattern of incidents. Elephants moreover do not move at random (Douglas-Hamilton et al., 2005; Kumar, Mudappa, & Raman, 2010) and may target particular crops (Sukumar, 1990). The distribution of random points was also an exponential decrease with distance and from this we can expect an exponential decrease of incidents with distance from protected areas. The random distribution depends on the shape of reserves and their location within the landscape. If for example, the landscape consisted of a single reserve separated by a straight limit from the matrix, the random distribution with distance would be constant: The number of points would be the same on average further and further away from the reserve. It is thus possible that the results observed here depend on some landscape features such as the shape and relative positions of reserves, and it cannot be ascertained that we observe a homogeneous phenomenon akin to diffusion outside protected areas. The spatial distribution of incidents (Figure 1) actually appears to be aggregated in places that are remote from reserves.
The exponential decay of incidents is still interesting for the management of this region. Living near a protected area represents a risk. This risk can be mitigated with sealed barriers around reserves or with economic activities that can be less impacted by elephants such as some tree monocultures (Santiapillai et al., 2010). Approximately 80% of the incidents occur within 4,000 m of the protected areas. Consequently, the surrounding or buffer zone of reserves should be given particular attention in terms of incident management, awareness, agricultural practices, and activities that are inimical to wildlife conservation. This zone, called the transition zone in Biosphere Reserve, has not been planned for coexistence between humans and wildlife, therefore forfeiting opportunities to reduce impacts to both parties (Puyravaud & Davidar, 2013).
We also observed that incidents occurred more frequently in places where deforestation was historically high (Figure 4) as compared with a random distribution of locations in the landscape. High levels of conflict were observed in the districts of Kodagu and Hassan in Karnataka that face large-scale negative interactions between elephants and humans (Gubbi et al., 2014). The present study suggests that high levels of deforestation might be the reason for a higher probability of incidents with elephants.
Only local deforestation estimated in 1 km2 and to a lesser extent in 4 km2 windows was significantly associated with the number of incidents. This effect was not significant beyond this window size. It is not clear whether deforestation at a larger scale had no effect or whether the thinning of points (to avoid autocorrelation) diminished the power of the tests.
Two nonexclusive situations could explain the relatively higher number of incidents in deforested areas. Elephants temporarily ranging out of the protected areas may prefer remnants of forests for refuge (Kumar et al., 2010). Or alternatively, elephants originally present in the now deforested habitat may still occupy forest remnants within the landscape matrix. This last situation cannot be excluded because Asian elephants tend to face competition from other elephants from other ranges. For this reason they are philopatric (Fernando et al., 2008), which is known to make translocation problematic (Fernando, Leimgruber, Prasad, & Pastorini, 2012).
The incidents provoked by elephants in the studied region are to some extent related to the transformation of the landscape to intensive agriculture. The change seemed to have left isolated elephant populations struggling with the transformation. Despite landmark legislation for preserving tree cover such as the Indian Forest Act 1927, the Forest Conservation Act 1980, or the Preservation of Trees Act 1984, the landscape connectivity of the largest Asian elephant population and the largest Bengal tiger population (Jhala, Qureshi, Gopal, & Sinha, 2011) in the world have been severed. The local communities have not been able to rein in the land-use changes brought about by the market economy. No mitigation measure had been taken by the Administration either, when in the late 1970s fragmentation of elephant population started to become an issue (Davidar, 1981).
Historical records in pre-British ruled India (Shresth, 2009) show state organization in the same region to address elephant incidents: Approximately seven to eight thousand retired soldiers, called Cundachars, were given land near the forests border of the studied region by regional royalty to repel elephants preferably without capturing or killing them. Farmers also took great care not to interfere with elephants and considered taboo to cross the paths of elephants.
History provides models where society chose to develop its economy with some tolerance toward wildlife and a large participation of farmers. With incomparable scientific knowledge and economic power, today’s society needs to find means and methods to maintain ecological wealth and processes. The future of the Asian elephant will become more precarious in the coming decades. Anthropogenic global warming may destroy half of its range in India (Kanagaraj et al., 2019). Efforts to maintain population connectivity, forest cover, and ecosystem services outside protected areas must be pursued eagerly.
Implications for Conservation
The high deforestation rate measured mostly in private lands in between the Nilgiris Biosphere Reserve and the Bhadra Tiger Reserve (–0.85%⋅y−1) in almost 50 years shows that private forests were destroyed in spite of the existence of stringent laws. Without realizing the ecological importance of their region, locals have lost elephant population connectivity between major reserves. Precautions should be taken immediately with stakeholders to salvage what can be salvaged and the cost of maintenance of the essential ecological functions should be evaluated for conservation outside protected areas.
There is an exponential decay of the number of incidents with distance from protected areas. It may depend on the particular landscape organization, but clearly shows that there is a risk associated in living close to a protected area. This risk is often not realized and even less accepted by new settlers. The area less than 4 km away from the reserves has the largest number of incidents (approximately 80%) and must receive systematic and particular attention in terms of public awareness, livelihood strategies, and protection.
Deforestation at small scale (1 km2 around the incidents particularly) correlated with incidents. Land-use change itself seems to be provoking incidents and may expose the population to hazards. This can be the consequence of elephant dispersal from protected areas, but it can also be the consequence of elephant attachment to their shrinking range. In both cases, it is ill-advised to adopt a laissez-faire attitude in landscape management with large wildlife. Large-scale consequences of quantum changes must be understood in order to protect the public from dangerous land-use changes.
Footnotes
Acknowledgments
The second and the third authors thank the Integrated Tiger Habitat Conservation Project (ITHCP), IUCN, and KfW for funding support. We thank the Forest Departments of Karnataka for the data on incidents, permits, and logistical support. The authors thank Mr. Dharmalingam Venugopal for bringing to our knowledge the reference to the Cundachars. We thank the anonymous reviewer for his valuable comments and we are grateful to TCS for their invitation to contribute this paper.
Declaration of Conflicting Interests
The author(s) declared no potential conflicts of interest with respect to the research, authorship, and/or publication of this article.
Funding
The author(s) disclosed receipt of the following financial support for the research, authorship, and/or publication of this article: This work was funded by a Grant No/96200-1-G016 from the U.S. Fish and Wildlife Service Asian Elephant project titled Elephant habitats of the Nilgiri Biosphere Reserve: Location, threats and management.