
Abstract
Monitoring is a key step for achieving restoration success. Despite increasing advances for selecting ecological indicators, monitoring sampling designs are not always available. We investigated how tree richness and the most used forest structure indicators vary spatially in restoration sites, aiming to provide evidence-based guidance for future monitoring protocols. We collected data from eight forest restoration sites covering overall 1,000 ha in four Brazilian Atlantic Forest regions. Canopy cover, tree density, vegetation height, and species richness were assessed in 18.2 ha of plots ranging from 60 to 300 m2 in size, in restoration sites aged 1 to 5 years old. Using resampling techniques, we calculated the sampling error for the indicators and compared them with original sampling results, and then estimated the number of plots needed to reach a 20% sampling error. The ecological indicators assessed showed high variability among restoration sites. Canopy cover and height required less plots to reach the targeted sampling error than density of trees. The number of species does not stabilize even when more than 90% of the total number of plots was resampled, indicating high spatial variation. The use of the sampling error approach for defining how much to monitor, associated to appropriate sampling methods, could increase the reliability of monitoring. In addition, they will reduce operational costs, thus providing a key contribution to the effectiveness of large-scale restoration programs expected to be implemented globally in the coming years. Thus, we recommend the incorporation of this in the forest restoration monitoring protocols being discussed worldwide.
Keywords
Introduction
Monitoring is a key step for achieving restoration success (Clewell & Aronson, 2007; McDonald, Gann, Jonson, & Dixon, 2016). Besides, monitoring provide insights on how to avoid or overcome the causes of failure and to strengthen causes of success for future restoration projects (Campoe et al., 2014; Cooke & Sushi, 2008; Wortley, Hero, & Howes, 2013). In fact, most of the conceptual and practical advances in restoration in different ecosystems have been a direct consequence of the monitoring of pioneer projects (Rodrigues, Lima, Gandolfi, & Nave, 2009). By assessing the drivers of failures, monitoring also supports the adoption of adaptive management, which are active interventions to correct the ecological trajectory of an ongoing restoration project (DeLuca, Aplet, Wilmer, & Burchfield, 2010; Herrick, Schuman, & Rango, 2006; Hobbs, Hallett, Ehrlich, & Mooney, 2011).
Beyond the practitioner perspective, restoration monitoring is also relevant for policy and business. It allows the assessment and communication of restoration benefits to society (Brancalion, Cardozo, Camatta, Aronson, & Rodrigues, 2014; Rey Benayas, Newton, Diaz, & Bullock, 2009). Furthermore, it is a powerful instrument for governments to decide which projects can be approved or not when restoration is a mandatory activity for mitigating or compensating environmental damages (Aronson et al., 2011; Maron et al., 2012; Ruiz-Jaen & Aide, 2005). Monitoring is also necessary for assessing if both private and public financial resources funding restoration were adequately applied and if the goals initially set were met (Chaves, Durigan, Brancalion, & Aronson, 2015; Koch & Hobbs 2007; Melo et al., 2013; Rodrigues et al., 2011). Finally, monitoring may be remarkably relevant in the next decades for increasing the reliability of restoration in the face of the growing investments—estimated in US$ 18 billion per year (Menz, Dixon, & Hobbs, 2013)—for supporting programs at global scale (Aronson & Alexander, 2013; Suding et al., 2015).
The usefulness of restoration monitoring for supporting decision-making is determined by the appropriate selection and use of ecological indicators, the right interpretation of results provided by their use, and the reliability of sampling design and effort. Despite efforts to assess how restoration success can be measured (Gatica-Saavedra, Echeverria, & Nelson, 2017; Viani et al., 2017; Wortley et al., 2013), monitoring sampling designs are not validated so far. Sampling design and effort have an utmost importance for monitoring. Spatial variability of the ecological indicators should be used to define the best effective sampling design for monitoring. However, little is known about the spatial variability of vegetation structure, richness, and composition in forest restoration sites. Consequently, current decision-making process in restoration projects may be biased because of the use of unreliable monitoring results.
Sampling effort has also direct effect in monitoring costs and, consequently, in the whole cost of restoration projects. It is fairly impossible to have accurate estimates of monitoring costs if the sampling effort to be used cannot be accurately determined. Consequently, project managers may not consider the necessary resources in a project budget for conducting adequate monitoring, which ultimately may compromise restoration success. At the same time, practitioners have to face a trade-off between sampling effort and monitoring costs, that is, at the same time they may use a higher number of plots to improve the representation of the inherent variability of selected ecological indicators and they may also prefer a lower sampling effort to reduce monitoring costs.
On one hand, if practitioners establish a reduced number of plots to assess some ecological indicators in restoration sites, as an alternative to reduce monitoring costs, decision-making can be compromised and lead to unnecessary or unappropriated interventions or to the absence of truly needed ones. On the other hand, if an excessive number of monitoring plots are implemented, scarce resources of restoration projects can be wasted without resulting in effective advances to manage the project. However, we poorly know how the most assessed ecological indicators vary in restoration sites, and thus, the trade-off between sampling efforts and monitoring costs is still far from being solved. Therefore, in this study, we sought to investigate how some of the most commonly used ecological indicators to assess forest structure and composition vary spatially in several Atlantic Forest restoration sites, in order to provide evidence-based guidance to future monitoring protocols being discussed globally.
Methods
Study Areas
We selected four large-scale forest restoration programs located in Southern, Southeastern, or Northeastern Brazil, where restoration plantations and assisted natural regeneration (without any tree seedling artificially introduced) were the main methods adopted (Figure 1 and Table 1). Those restoration programs are a set of restoration projects designed to deliver a central objective, sought either by a single or by a set of partner institutions that operate within a specific region. The study sites represented three vegetation types included in the Atlantic Forest biome (Table 1). Restoration plantings were implemented with a high diversity (>50 species) of native trees, with alternate planting lines of fast-growing and wide canopy species, with slow-growing and narrow canopy species, in a 3 × 2 m spacing. To favor understanding of the restoration methods, we namely assisted natural regeneration only restoration sites without any artificial introduction of propagules, although we recognize plantations may assist natural regeneration. In assisted natural regeneration sites, restoration was implemented by manual or chemical control of invasive grasses around spontaneously regenerating saplings to speed up the successional process (for details, see Rodrigues et al., 2011).
Location of the four forest restoration programs evaluated in the Atlantic Forest, Brazil. Description of the Forest Restoration Programs Where Ecological Indicators Were Collected in the Field, Atlantic Forest Biome, Brazil. Note. Sampled area is the result of multiplying the sampling unit number by the plot size. NI: no information available.

Monitoring Method
In each forest restoration program, monitoring focused on the assessment of vegetation structure and diversity. Plots ranging from 60 to 300 m2 in size were randomly placed in restoration sites that varied in age from 1 to 5 years (Table 1). Practitioners who monitored the restoration programs previously defined the size of the plot. However, the range of the plots size used in the study includes the sizes being actually recommended for monitoring Atlantic Forest restoration (Chaves et al., 2015; Viani et al., 2017). We measured the same ecological indicators in all sites: (a) canopy cover, (b) vegetation height, (c) native trees density, and (d) native tree species richness. These are key indicators used to evaluate vegetation structure and composition in tropical forest restoration projects (Chaves et al., 2015; Suganuma & Durigan, 2015; Viani et al., 2017).
Canopy cover was estimated by an adaptation of the line interception method (Canfield, 1941). A 25 -m line was randomly placed in the forest floor and the portions of this line covered by the vertical projection of the tree canopies were measured. The sum of the portions of the line covered by canopies projection was then converted to the percentage of canopy cover in each plot based on line length. This method was chosen because it is being recommended in Atlantic Forest monitoring protocols (Chaves et al., 2015; Viani et al., 2017). Mean vegetation height was obtained by measuring the height of the overstory trees in each plot, except in the case of the Medium Paranapanema Basin project, where vegetation height was expressed by the mean height of each native tree > 50 cm height. Since we did not compare sites, we did not consider this variation in height measure between sites as a limitation. Native tree density was obtained counting the number of tree species > 50 cm height within each plot and then generating the number of trees per hectare considering plot area. In all the cases mentioned earlier, we calculated the mean value of the indicator per restoration program in each area. For species richness, we counted the total number of native trees > 50 cm height per restoration program in each age.
Data Analysis
We were mainly interested in evaluating how the reduction in sampling effort within a site would affect sampling error for the indicators we selected. Thus, within each site, data collected in the field were resampled using the bootstrap method. Bootstrap is a resampling method based on the construction of several subsamples (samples with a lower number of sample units) from an initial sample, using a great number of random simulations (Efron, 1979). We used the bootstrap with reposition method. To assure that during the resampling the selected samples were not the same, we activated the seed component in the R statistical package (R Core Team, 2013). For each ecological indicator, we performed bootstrap resampling with 50 different seeds in order to have an unbiased selection. For each seed, we performed 1,000 simulations, totalizing 50,000 simulations per resampling intensity. For each resampling intensity, we calculated the relative sampling error (E%) based on the total number of simulations as:

Resampling was always performed separately by restoration program and, in each restoration program, by forest restoration age. We used different number of plots when resampling in each program because they differed in the original number of sampling units. However, we used at least six resampling intensities in each case. Once we obtained the sampling error of each resampling intensity, we generated graphs by ecological indicators illustrating the variation in the sampling error according to the resampling intensity. For species richness, instead of calculating sampling error, we obtained the statistical mode (most observed value) for each resampling intensity. We also calculated for the forest structure indicators, the number of samples necessary to reach a sampling error of 20% for each parameter measured using the following equation:

In commercial tree plantations, 10% is assumed as a critical sampling error. However, tropical forest restoration sites are in general much more diverse in species and structurally complex than commercial tree plantations (Barlow et al., 2007), which results in a higher spatial heterogeneity of vegetation structure and composition. Thus, we arbitrarily considered in this study a sampling error of up to 20% as acceptable for the ecological indicators measured.
Results
Mean Vegetation Structure Values (±standard Deviation) and Total Tree Richness Found in Atlantic Forest Restoration Programs, Brazil.
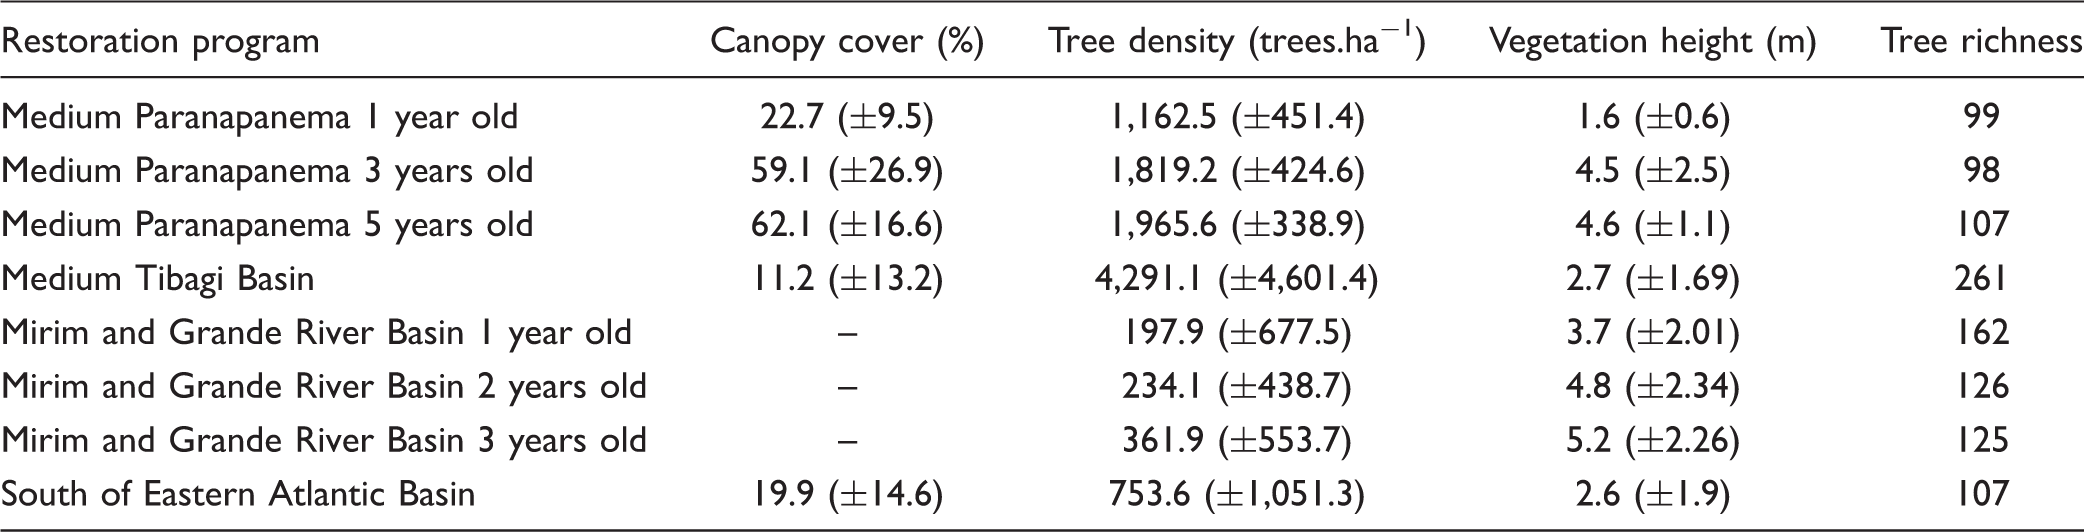
Note. To see details on each restoration site, their plot size, and sampling effort, see Table 1.
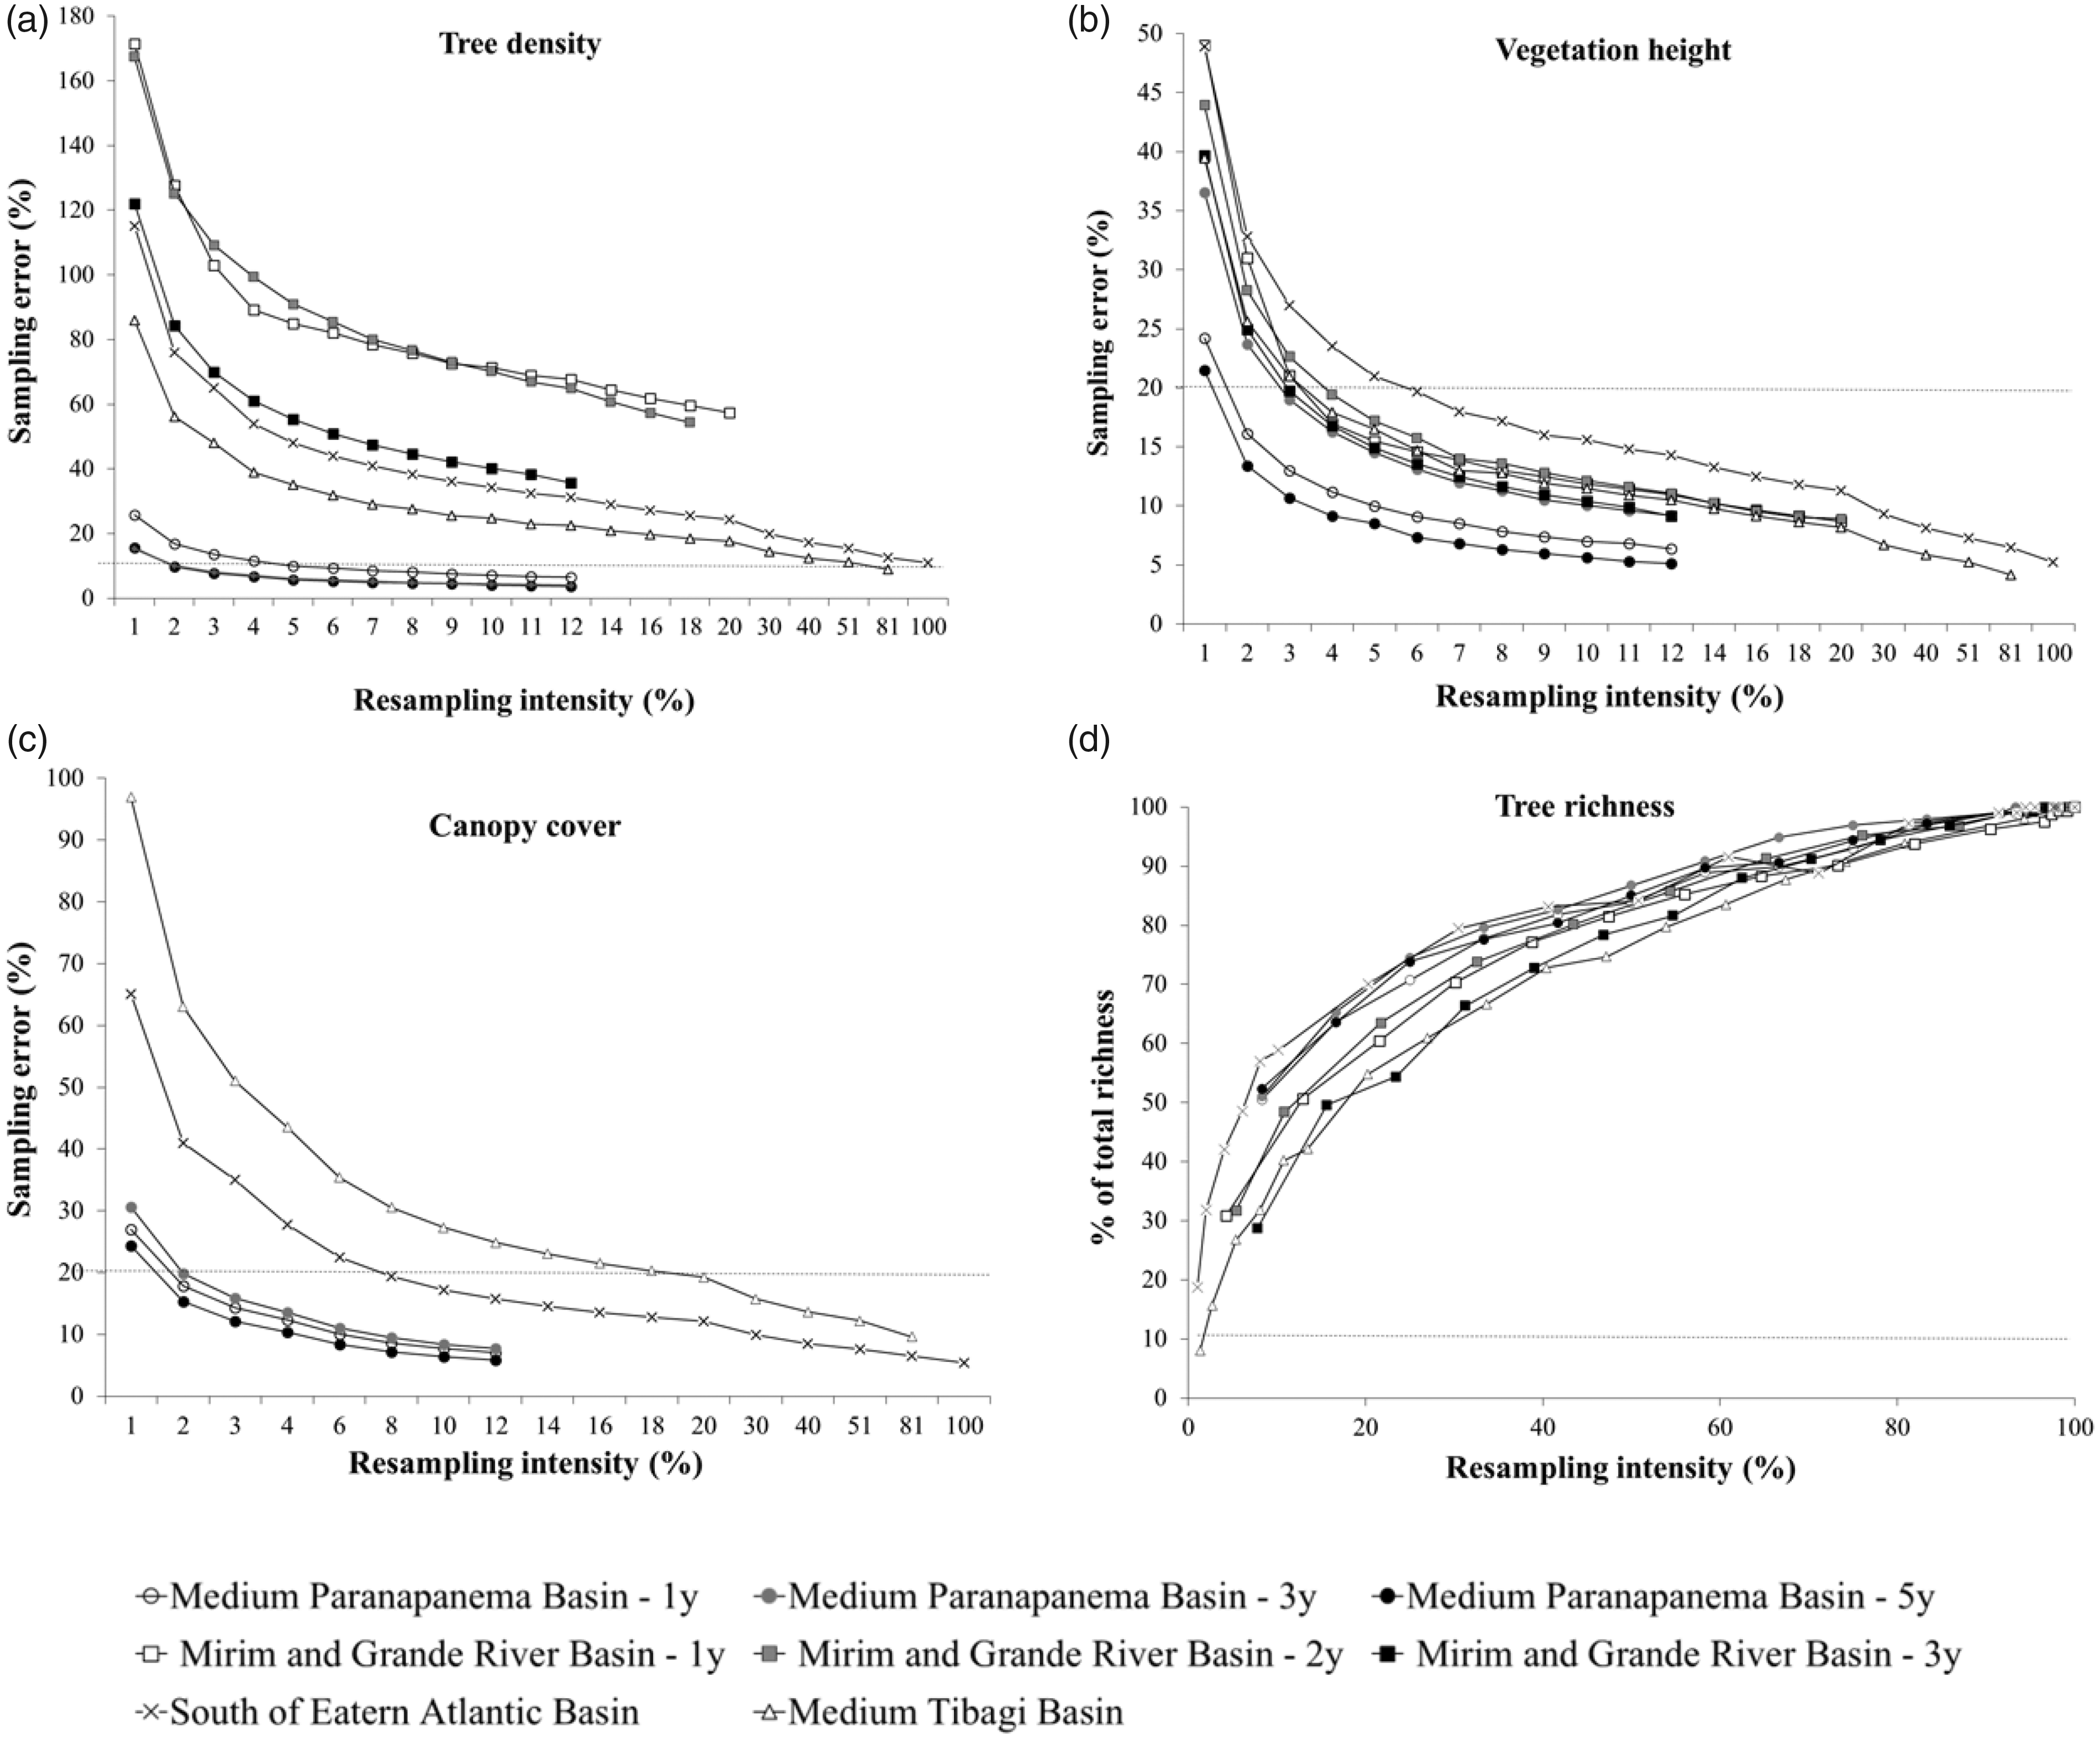
Sampling error (%) of tree density (a), vegetation height (b), and canopy cover (c) and tree richness found according to resampling intensity (d) related to original sampling, in monitored Atlantic Forest restoration sites, Brazil. Canopy cover was not evaluated at the Mirim and Grande River Basin sites. The dashed line ((a) and (c)) represents the limit of 20% of sampling error.
Sampling Error and Number of Samples to Achieve a Sampling Error ≤ 20% of the Several Ecological Indicators Surveyed in Atlantic Forest Restoration Programs, Brazil.

Note. To see details on each restoration site, their plot size, and sampling effort, see Table 1.
The number of plots necessary to achieve a sampling error of ≤20% was higher than 100 for five of the eight restoration sites for tree density, while for the other two indicators (canopy cover and vegetation height), the number of plots was always lower than 100, except for one site for canopy cover (Table 3). Besides, a resampling intensity of less than 10% for vegetation height and 20% for canopy cover were enough to achieve a sampling error lower than 20% for all restoration sites.
The sampling effort for achieving an acceptable error for species richness would be much higher than for the other indicators of structure. The number of species does not stabilize even when more than 90% of the total number of plots was resampled (Figure 2(d)).
Discussion
The necessary sampling intensity to reach an acceptable error was highly variable among the ecological indicators evaluated. Overall, a lower sampling intensity could be used for monitoring canopy cover and vegetation height, while for tree density the number of plots would have to be higher. Considering that most of the projects were implemented through plantation and the same density of seedlings was used, seedling mortality, development, and recruitment are the main drivers of variation in the ecological indicators. Tree density in restoration plantings is expected to be directly influenced by seedling mortality, which can be caused by transplant shock (Close, Beadle, & Brown, 2013; Guzmán-Luna & Martínez-Garza, 2016). Seedling mortality shows a remarkable spatial heterogeneity in restoration plantings due to local variations in competition with invasive grasses, soil nutrient and water availability, and herbivory (Martínez-Garza, Bongers, & Poorter, 2013; van Breugel et al., 2011). In addition, seedling recruitment may also account for such heterogeneity, since the process of seedling recruitment is highly heterogeneous in a short space scale (Viani & Rodrigues, 2009) and influenced by the formation of regeneration nuclei. However, canopy cover and height are less influenced by seedling mortality compared to density. There is a density effect on growth of individual plants (Martínez-Garza, Saha, Torres, Brown, & Howe, 2004; Weiner, 1985) and each established tree can grow better if more resources are available because of the death of a neighboring seedling, thus compensating variations in density. A higher sampling error would be expected in sites where assisted natural regeneration was used, since the spatial variation of spontaneously regenerating seedlings is nested to the inherent environmental heterogeneity of restoration sites (Chazdon, 2014), while restoration plantings artificially homogenize seedling distribution independently of site variations. However, this assumption was not corroborated by our results, because we did not find the highest sampling error in tree density for the assisted natural regeneration method (Tables 2 and 3). It is more likely that the high spatial variation in seedling mortality and recruitment in some programs increased seedling density heterogeneity at similar or higher levels found in assisted natural regeneration.
Such differences in sampling error among ecological indicators mean that for our case studies, the same results could be obtained for canopy cover and vegetation height spending less money and time, while for tree density, more sampling units would be necessary to achieve an acceptable sampling error. This indicates that more cost-effective monitoring could be achieved if the sampling design for one specific indicator was decoupled from others. For instance, canopy cover, vegetation height, and density could be assessed in the same plots in the beginning of the fieldwork. When the targeted sampling error is reached for a specific indicator, it no longer has to be measured in the following plots, reducing the time and cost spent to complete their evaluation. This approach could be used for many other quantitative indicators being collected in plots at forest restoration sites, such as for measures of biomass, seedling regeneration, and so forth. However, it requires that sampling plots be randomly or systematic distributed through the whole area from the beginning of monitoring, in order to have an adequate spatial representation of the indicators that require less intensive sampling efforts.
For richness, we found that a reduction in sampling area or units would lead to a relevant decrease in the number of species surveyed. If we had more sample units in the original sampling, more species would certainly be found, since richness is highly sensitive to sample area. Tropical forests, as the Atlantic Forest patches we studied, are biodiversity-rich ecosystems with over 100 species per hectare (Putz & Redford, 2010), with a great contribution of rare species in richness levels (Caiafa & Martins, 2010; Phillips & Miller, 2002). Therefore, reaching an acceptable sampling error for species richness would require the use of a high number of plots, which would imply spending more resources in monitoring. In this case, increasing sampling effort is certainly not the solution. A possibility is assessing richness and other diversity indicators by sampling methods not based in plot use but instead by random walks through the restoration site to count different species. In this case, sampling effort could be based on the number of new species identified in a given period; when no new species is found after a predefined period, sampling effort is achieved (Walter & Guarino, 2006). Thus, sampling effort would be a function of time, not of area or plots number. However, since it was not tested here, we suggest this to be tested prior to its recommendation. Another possibility is to search for and better investigate sampling error for other diversity indicators instead of tree richness, such as those of functional composition, which balance ecological relevance and practical viability (Brancalion & Holl, 2016).
Although we recognized we worked with a limited number of sites in a specific tropical region, our results can be used to advance forest restoration monitoring protocols, a priority for large-scale and global forest restoration programs. Tropical forest restoration monitoring protocols are being discussed and implemented. For instance, a protocol was developed by the Atlantic Forest Restoration Pact in Brazil (Viani et al., 2017). Based on the Pact’s monitoring protocol, the São Paulo State environmental agency in Brazil developed its own monitoring protocol to be officially used to attest restoration success for projects in which restoration mandatory (Chaves et al., 2015), like those implemented to comply with the new Forest Code in Brazil (Soares-Filho et al., 2014). In these two examples, the sampling intensity (number of monitoring plots) is defined based on forest restoration site area (i.e., the number of 25 × 4 m plots is 4 + area of the projects in hectare, with a maximum of 50 plots). However, our results demonstrated that a previous definition of sampling units per hectare of restoration project might not be the best strategy because it can lead to either over or subsampling according to the ecological indicator selected and restoration site characteristics.
The use of the sampling error to define how much to measure in restoration monitoring has the advantage of providing an estimate of the confidence of the data monitored, which minimize misleading adaptive management interventions. However, the use of sampling error does not allow for knowing or predicting the number of plots to be assessed before the fieldwork, which is a limitation for organizing monitoring logistics and to predetermine its costs, an essential issue for private companies selling monitoring services. In addition, if sampling error is calculated in the office, practitioners cannot define if they have reached the targeted sampling error while in the field. Consequently, they may have to return to the restoration site over and over again until the targeted sampling error is reached. To alleviate this feedback loop, it is necessary to develop sampling error calculator tools, which allow for a fast estimation of sampling error during fieldwork. We strongly recommend and endorse the development of a restoration monitoring application for tablets and smartphones, designed for supporting data entry and run real-time analysis, including the estimation of sampling error.
Overall, the ecological indicators assessed were highly variable in restoration sites, revealing markable differences among indicators regarding the sampling effort required. Furthermore, the number of plots to reach a reliable sampling error for species richness assessment was unviable. Hence, the question “How to measure?” does not have a simple answer in restoration monitoring, which is a limitation for achieving cost-effective monitoring protocols. However, we believe that the use of the sampling error approach, associated to appropriate sampling methods (plots or random walks, for instance) and the use of new technologies, such as tablets and smartphones apps, will increase the reliability of monitoring results worldwide. Consequently, this will reduce monitoring operational costs and provide a key contribution to the effectiveness of the large-scale forest restoration programs expected to be implemented globally in the coming years.
Implications for Conservation
We found that the density of trees requires a higher number of plots to be assessed in tropical forest restoration projects than canopy cover and vegetation height. However, the assessment of species richness in plots does not allow a reliable value to be obtained even after intense sampling; thus, other methods such as random walks to count different species should be tested. The use of the sampling error to guide forest restoration monitoring worldwide would be greatly favored by the development of an application for tablets and smartphones for supporting data entry and run analysis of sampling error. Finally, we recommend the incorporation of the sampling error approach in the forest restoration monitoring protocols, as done for inventory of commercial tree plantations and for monitoring carbon stocks in forests. The use of this approach in ecological restoration monitoring would help reducing program costs and obtaining reliable results to guide further adaptive management interventions.
Footnotes
Acknowledgments
The authors thank Amelia Elgar for language checking.
Declaration of Conflicting of Interests
The author(s) declared no potential conflicts of interest with respect to the research, authorship, and/or publication of this article.
Funding
The author(s) disclosed receipt of the following financial support for the research, authorship, and/or publication of this article: Ricardo A. G. Viani, Fabiano T. Farah, Ricardo R. Rodrigues, and Pedro H. S. Brancalion are supported by grant #2013/50718-5, São Paulo Research Foundation (FAPESP).