
Abstract
The distribution and endemicity patterns of Gomphales in Mexico are analyzed here for the first time. Richness and corrected endemism were obtained from a dataset of 3,483 records for 97 species, using a cell-grid system of one degree per side. The central region of Mexico (Tlaxcala, Veracruz, Hidalgo and Estado de México states), which includes most of the Trans-Mexican Volcanic Belt and Sierra Madre Oriental biogeographic provinces, had the highest richness values, but Mexican areas in the Pacific Coast (Jalisco and Michoacán states) and southeastern Mexico (Oaxaca and Chiapas states) had the most distinctive composition, as measured by the corrected endemism index. Two main distributional patterns were recovered: a) montane: at elevations above 1000 m on coniferous, pine-oak, oak and cloud forests, typified by the presence of species of Ramaria and Clavariadelphus, b) lowlands: at elevations below 1000 m mainly in evergreen, rainforest and deciduous tropical forests characterized by the presence of four tropical species of Lentaria, two tropical species of Gomphus endemic to Mexico, and four tropical species of Phaeoclavulina. The eight species of Gomphales endemic to Mexico have very restricted distribution, mostly in non-protected areas, and are not considered under special protection programs. The present contribution delineates general patterns of distribution for the Gomphales, and documents its diversity and endemism in Mexico.
Introduction
Mexico is one of the most biologically diverse countries in the world (Flores-Villela & Gerez, 1994; Martínez-Meyer, Sosa-Escalante, & Álvarez Noguera, 2014; Mittermeier & Goettsch de Mittermeier, 1992; Ramamoorthy, Bye, Lot, & Fa, 1993), due to factors such as its geographical position, geological history, climate and orography. It is also a transition zone between the Nearctic and Neotropical biogeographic regions (Halffter, 1987). The geographic distribution of the elements comprising Mexican biota is the result of vicariance, local dispersion and extinction events as well as Pleistocene climatic changes and in situ speciation processes (Salinas-Moreno et al., 2004).
A relevant, but often neglected, part of this biodiversity is fungi. Mexican fungal diversity has been estimated at between seven thousand (Guzmán, 1998a, 1998b) and almost eleven thousand species (Aguirre-Acosta, Ulloa, Aguilar, Cifuentes, & Valenzuela, 2014). A preliminary catalogue of the Mexican fungi commissioned by the Comisión Nacional para el Conocimiento y Uso de la Biodiversidad (CONABIO, www.conabio.gob.mx) has documented more than 4,700 species for the main fungal groups (García-Sandoval et al. unpublished data). So far, a comprehensive catalogue of Mexican fungal diversity is not available, but some estimates and preliminary catalogues exist for specific groups (i.e., González-Ávila, Luna-Vega, Villegas-Ríos, Saade, & Cifuentes, 2013; González-Ávila, Torres-Miranda, Luna-Vega, & Villegas-Ríos, 2013; Herrera-Campos et al., 2014).
Some studies on fungal distribution have been conducted in Mexico, although drawing on incomplete data. For example, Cifuentes et al. (2004) and Gónzalez-Ávila, Luna-Vega, et al. (2013) analyzed the distributional data of 214 species in the Sierra Madre Oriental in Mexico applying a parsimony analysis of endemicity or PAE (Rosen, 1988). Their study did not find a significant correlation between fungal and plant distributions, instead, they reported a more significant relation between fungal composition and physiographic features. Similar findings relating fungal distributions to non biological parameters were reported by Tedersoo et al. (2014).
The Gomphales is one of the fungal orders with high relevance in Mexico, where edible mycorrhizical and saprophytic species are reported frequently (González-Ávila, Luna-Vega, et al., 2013). Most of these species have great traditional and economic importance as foodstuff in some states of Mexico. The members of this group can be found in several vegetation types, including tropical, subtropical and temperate forests, from sea level to 3900 m (González-Ávila, Luna-Vega, et al., 2013; González-Ávila, Torres-Miranda, et al., 2013). The three families considered in the order, following Kirk, Cannon, Minter, and Stalpers (2008), are present in Mexico, and 10 out of 18 genera have been reported in the country (González-Ávila, Luna-Vega, et al., 2013; González-Ávila, Torres-Miranda, et al., 2013). Ramaria is the genus with most species (55) recorded in Mexico, followed by Phaeoclavulina (16), Clavariadelphus (8), Gomphus (5), Gautieria, Gloeocantharellus, Lentaria and Turbinellus (2 each), and Beenakia and Kavinia with only one species each. Until 2013, a total of 92 species were reported from Mexico, which corresponds to 27% of the total known diversity of the group in the world (González-Ávila, Luna-Vega, et al., 2013).
In Mexico, the species of Gomphales are mainly found in coniferous forests, where Abies, Pseudotsuga, Picea and Pinus are the dominant genera (Estrada-Torres, 1994). However, some species have also been reported in tropical forests, and even some endemic species are distributed in these types of vegetation (Villegas-Rios, Cifuentes, Estrada-Torres, & Kong-Luz, 2010). From an anthropocentric point of view, these fungi are relevant because several ethnic groups use them as part of their diet and some taxa are ectomycorrhizal species related mainly to coniferous genera (Aguilar, & Villegas-Ríos, 2010; González-Ávila, Luna-Vega, et al., 2013).
In some countries the inclusion of plant and animal (and fungi) species in protection programs or on Red Lists usually requires information about population structure and dynamics (IUCN, www.iucn.org). In the specific case of fungi, and due to the difficulties inherent in obtaining information regarding, for example, population size or generation length, their conservation mostly relies on evidence of their distribution (Dahlberg, & Mueller, 2011; Molina, Horton, Trappe, & Marcot, 2011).
In the case of Mexico, Norma Oficial Mexicana 059 (NOM-059, www.profepa.gob.mx, SEMARNAT, 2010) represents the Mexican Red List of endangered species. This list incorporates 49 species of fungi, all of them lacking proper justification for their status because, in Mexico, there is no formal protocol for the risk evaluation of fungal species. This situation produces uncertainty about the real status of the species on the list, and results in a high possibility of these species not being considered as really at risk. In Mexico, Red Lists are used as complementary criteria for the delimitation of protected areas (Urquiza-Haas, Tobón, & Koleff, 2011). It is therefore necessary to have appropriate protocols and criteria for the inclusion of fungal species on those lists, and to have reliable information on distribution, richness and endemicity of endangered species.
The present study intends to: a) provide a first formal analysis on the distribution of species of Gomphales in Mexico, identifying areas with the highest species richness and endemism, and b) provide the first evaluation of the conservation status for the group in Mexico, identifying species with restricted distribution and their relation to protected areas.
Methods
Distributional data
Distributional records of the Gomphales species in Mexico were obtained from four main sources: a) Specialized literature: papers published in peer-reviewed journals with an emphasis on taxonomic studies; b) Public databases of government environmental agencies (i.e. www.conabio.gob.mx), or databases associated with mycological collections, both private and public; c) Field work: a series of field trips were conducted to collect specimens in areas identified as poorly sampled; d) Mycological collections: distributional records were obtained directly from specimens deposited in the main Mexican herbaria.
The main bibliographic sources for distributional data were: González-Ávila, Luna-Vega, et al. (2013); González-Ávila, Torres-Miranda, et al. (2013); Estrada-Torres (1994); Villegas-Ríos et al. (2010); Aguilar y Villegas-Ríos and Villegas-Ríos (2010); Castillo, García, and San Martín (1979); León and Guzmán (1980); Martínez, Pérez-Silva, and Aguirre-Acosta (1983); Guzmán (1983); Zarco (1986); Díaz-Barriga, Fefer, and Valenzuela (1988); Villegas-Ríos and Cifuentes (1988); Cifuentes et al. (1990); Montoya (1997); Nava and Valenzuela (1997); Montoya, Estrada-Torres, Kong-Luz, and Juárez (2001); Montoya, Hernández-Totomoch, Estrada-Torres, Kong-Luz, and Caballero (2003); Montoya, Kong-Luz, Estrada-Torres, Cifuentes, and Caballero (2004); Herrera, Guzmán-Dávalos, and Rodríguez (2002); Valenzuela-Garza, Pérez-Ramírez, and Morales-Torres (2004); Garibay-Orijel (2006); González-Ávila (2006, 2010); Landeros Castillo, Guzmán, and Cifuentes (2006); Chanona-Gómez, Andrade-Gallegos, Castellanos-Albores, and Sánchez (2007); Villarruel-Ordaz and Cifuentes (2007); González-Ávila, Villegas-Ríos, and Estrada-Torres (2013).
The following mycological collections were consulted: The Mycology Herbarium at the Universidad Autónoma of the state of México, CHIP, ENCB, EBUM, FCME, FEZA, The Mycology Herbarium at the Universidad Autónoma of Morelos, IBUG, IZTA, MEXU, TLXM, UJAD, CIAD, ITCV and XAL (Index Herbariorum: http://sweetgum.nybg.org/).
Fieldwork was carried out in the Mexican states of Chiapas, Distrito Federal, Durango, México, Guerrero, Hidalgo, Michoacán, Oaxaca and Tabasco. The herbarium specimens from mycological collections and our field samples were identified at species level, with the exception of several specimens of the genus Ramaria, which were only identified at subgenus level, mainly due to a lack of morphological data, particularly coloring, which is necessary for correct taxonomic identification.
Distribution analyses on richness and endemism
Richness and endemism analyses were conducted on three datasets: a) Core dataset (CDS) of 987 records for 56 species. Records in this dataset correspond to specimens identified at species level or specimens recognized as putative independent species, either because they may correspond to species not formally described or because specimens were poorly documented in the field (i.e. lacking color notes, which was the case for most of the specimens from Ramaria). B) Extended core dataset (ExCDS): the core dataset was extended to include records of Ramaria identified at the subgenus level following Marr and Stuntz (1973). Records were coded as absence or presence of the subgenera in the grid-cell. C) Genera dataset (GDT): this set includes records from the previous datasets, but the basic units for analysis were genera following Giachini and Castellano (2011).
The analyses based on the datasets were conducted with a grid of one degree per side dividing the Mexican territory (Figure 1). We decide to use this grid size because it facilitated data manipulation, reducing sampling artifact effects (such as mapping errors and grid-cells where sampling did not take place in sparsely inhabited areas), and because it has been reported that smaller sizes may disaggregate the patterns of richness and endemism (Crisp et al., 2001; Laffan and Crisp, 2003; Linder, 2001).
Grid-cells in which at least one taxon of Gomphales was recorded in Mexico.
Species endemism was calculated on the grid-cell analysis following the proposal of Crisp et al. (2001) and Linder (2001), using weighted endemism and the corrected weighed endemism indexes. In the case of the first index, the value of each species was obtained and weighted according to the inverse of its distribution, so that if a taxon is only present in one grid-cell, it is given a value of 1, whereas if a taxon is registered in two grid-cells its value is 0.5 and so on. To obtain the value of each grid-cell, the values of all the species in the grid-cell were added together. Therefore, grid-cells containing many species showing restricted distribution are expected to have higher values than those grid-cells with many widely-distributed species. To obtain the corrected weighted endemism index, the weighted endemism value of each grid-cell was divided by the total number of species in that grid-cell. This operation “corrects” species richness (Crisp et al., 2001) so that grid-cells containing relatively few species, but showing restricted distribution, should register higher values than those grid-cells with high richness, but containing relatively few species with restricted distribution. Although the total number of species in each grid-cell was also taken into consideration for corrected weighted endemism, unlike weighted endemism, this should not be dependent on richness, and a low correlation between the two variables was expected (Crisp et al., 2001; Linder, 2001; Santa Anna del Conde, Contreras-Medina, & Luna-Vega, 2009).
Grid-cell analysis, maps and index calculations were performed using Biodiverse software v. 0.99 (Laffan, Lubarsky, & Rosauer, 2010). In order to evaluate the level of correlation between weighted endemism and corrected weighted endemism values with species richness, we estimated the r2 using a simple linear model, and a simple Pearson coefficient. Even if this method is not appropriate for this kind of data, we decided to include the results to enable better comparability with previous studies (Crisp et al., 2001; Linder, 2001; Santa Anna del Conde, Contreras-Medina, & Luna-Vega, 2009). Results from the richness analysis were clustered in Biodiverse 0.99 (Laffan et al., 2010) using Sorensen’s index, and results were plotted on a map according to the groups recovered.
Additionally, an analysis of the number of species and genera present was done using biogeographic provinces (Arriaga, Aguilar, Espinosa, & Jiménez, 1997) and Mexican states as geographic units (Figure 2). We decided to use states as units because in Mexico, as well as in other countries, conservation policies are generally conceptualized taking political boundaries into consideration, rather than natural criteria (Contreras-Medina & Luna-Vega, 2007; Dávila-Aranda, Lira-Saade, & Valdés-Reyna, 2004).
(a) The 32 Mexican states; b. The 19 biogeographic provinces of Mexico according to Arriaga et al. (1997). Abbreviations are: AGS = Aguascalientes, BC = Baja California, BCS = Baja California Sur, CAMP = Campeche, CHI = Chiapas, CHIH = Chihuahua, COA = Coahuila, COL = Colima, DF = Distrito Federal, DUR = Durango, GTO = Guanajuato, GRO = Guerrero, HGO = Hidalgo, JAL = Jalisco, MEX = México, MICH = Michoacán, MOR = Morelos, NAY = Nayarit, NL = Nuevo León, OAX = Oaxaca, PUE = Puebla, QR = Quintana Roo, QRO = Querétaro, SLP = San Luis Potosí, SIN = Sinaloa, SON = Sonora, TAB = Tabasco, TAMP = Tamaulipas, TLA = Tlaxcala, VER = Veracruz, YUC = Yucatán, ZAC = Zacatecas; (b) the 19 biogeographic provinces of Mexico according to Arriaga et al. (1997). Abbreviations are: apn = Altiplano Norte, aps = Altiplano Sur, bal = Depresión del Balsas (Balsas Depression), bc = Baja California, clf = California, cab = Del Cabo, chi = Los Altos de Chiapas (Chiapas Highlands), gm = Golfo de México (Gulf of Mexico), nus = Soconusco, oax = Oaxaca, pac = Costa del Pacifico (Pacific coast), ptn = Petén, sme = Sierra Madre Oriental, smo = Sierra Madre Occidental, sms = Sierra Madre del Sur, son = Sonorense, tam = Tamaulipeca, vol = Eje Volcánico (Trans-Mexican Volcanic Belt), yuc = Yucatán.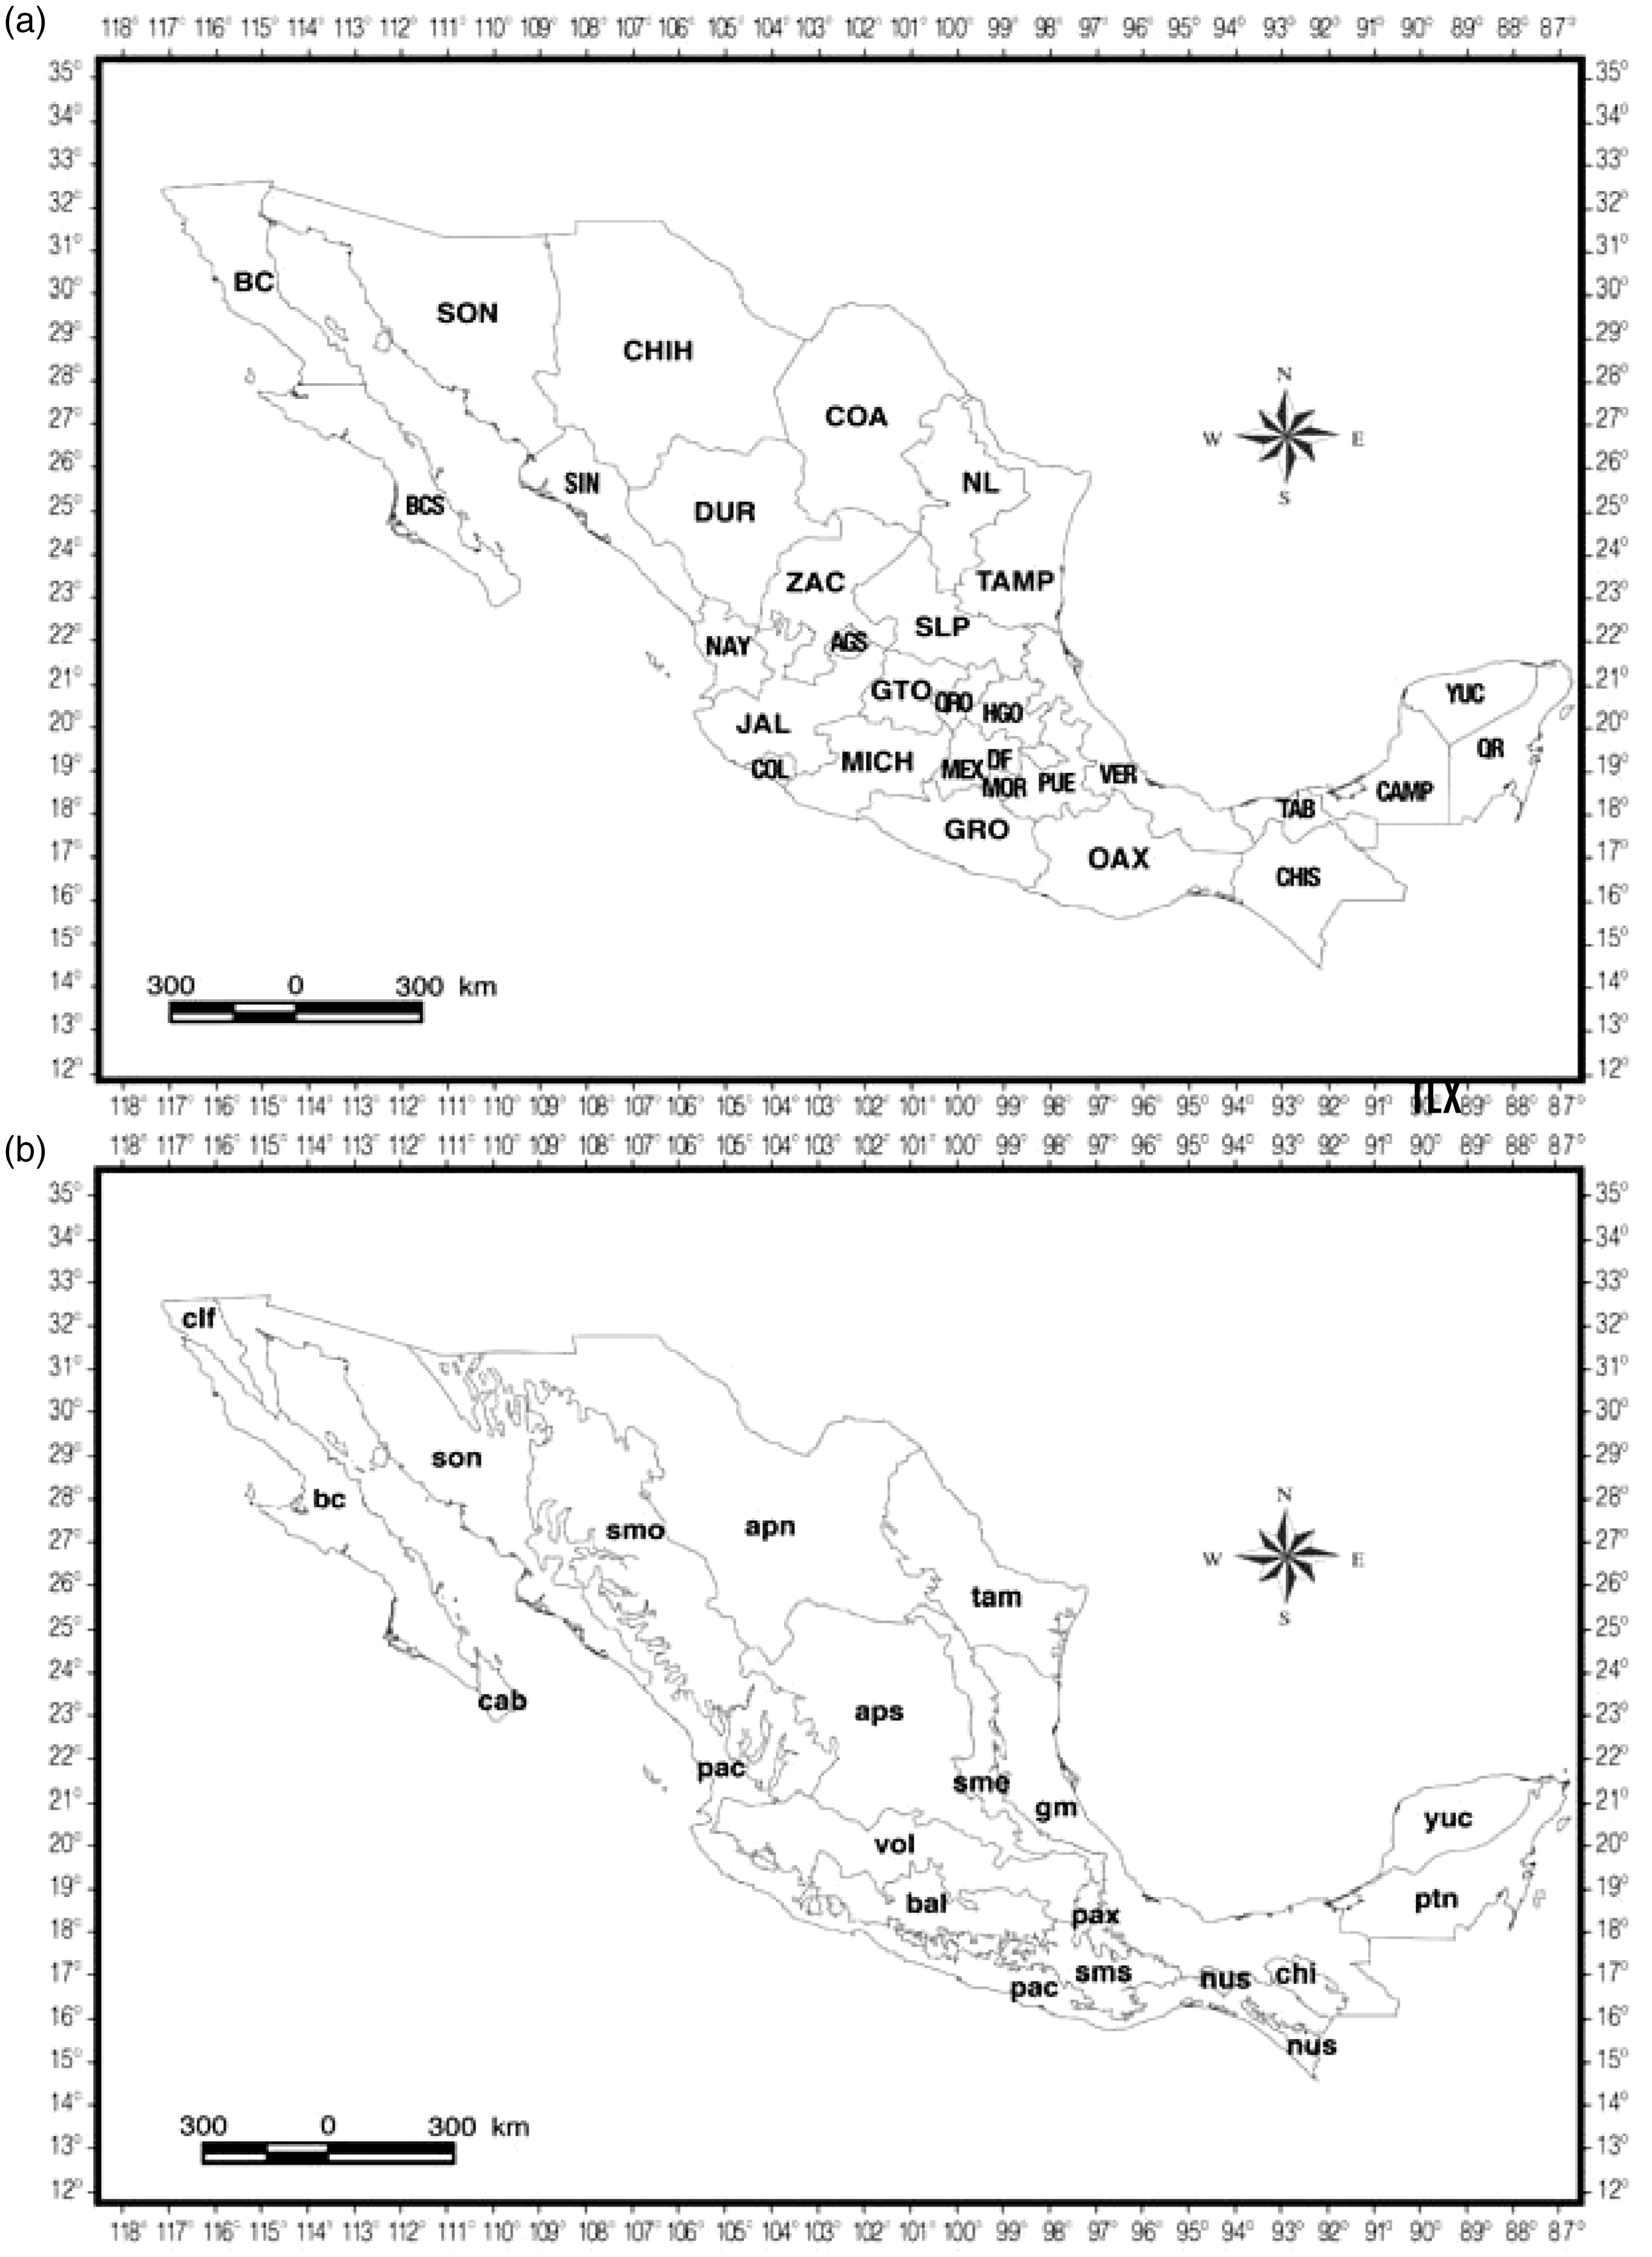
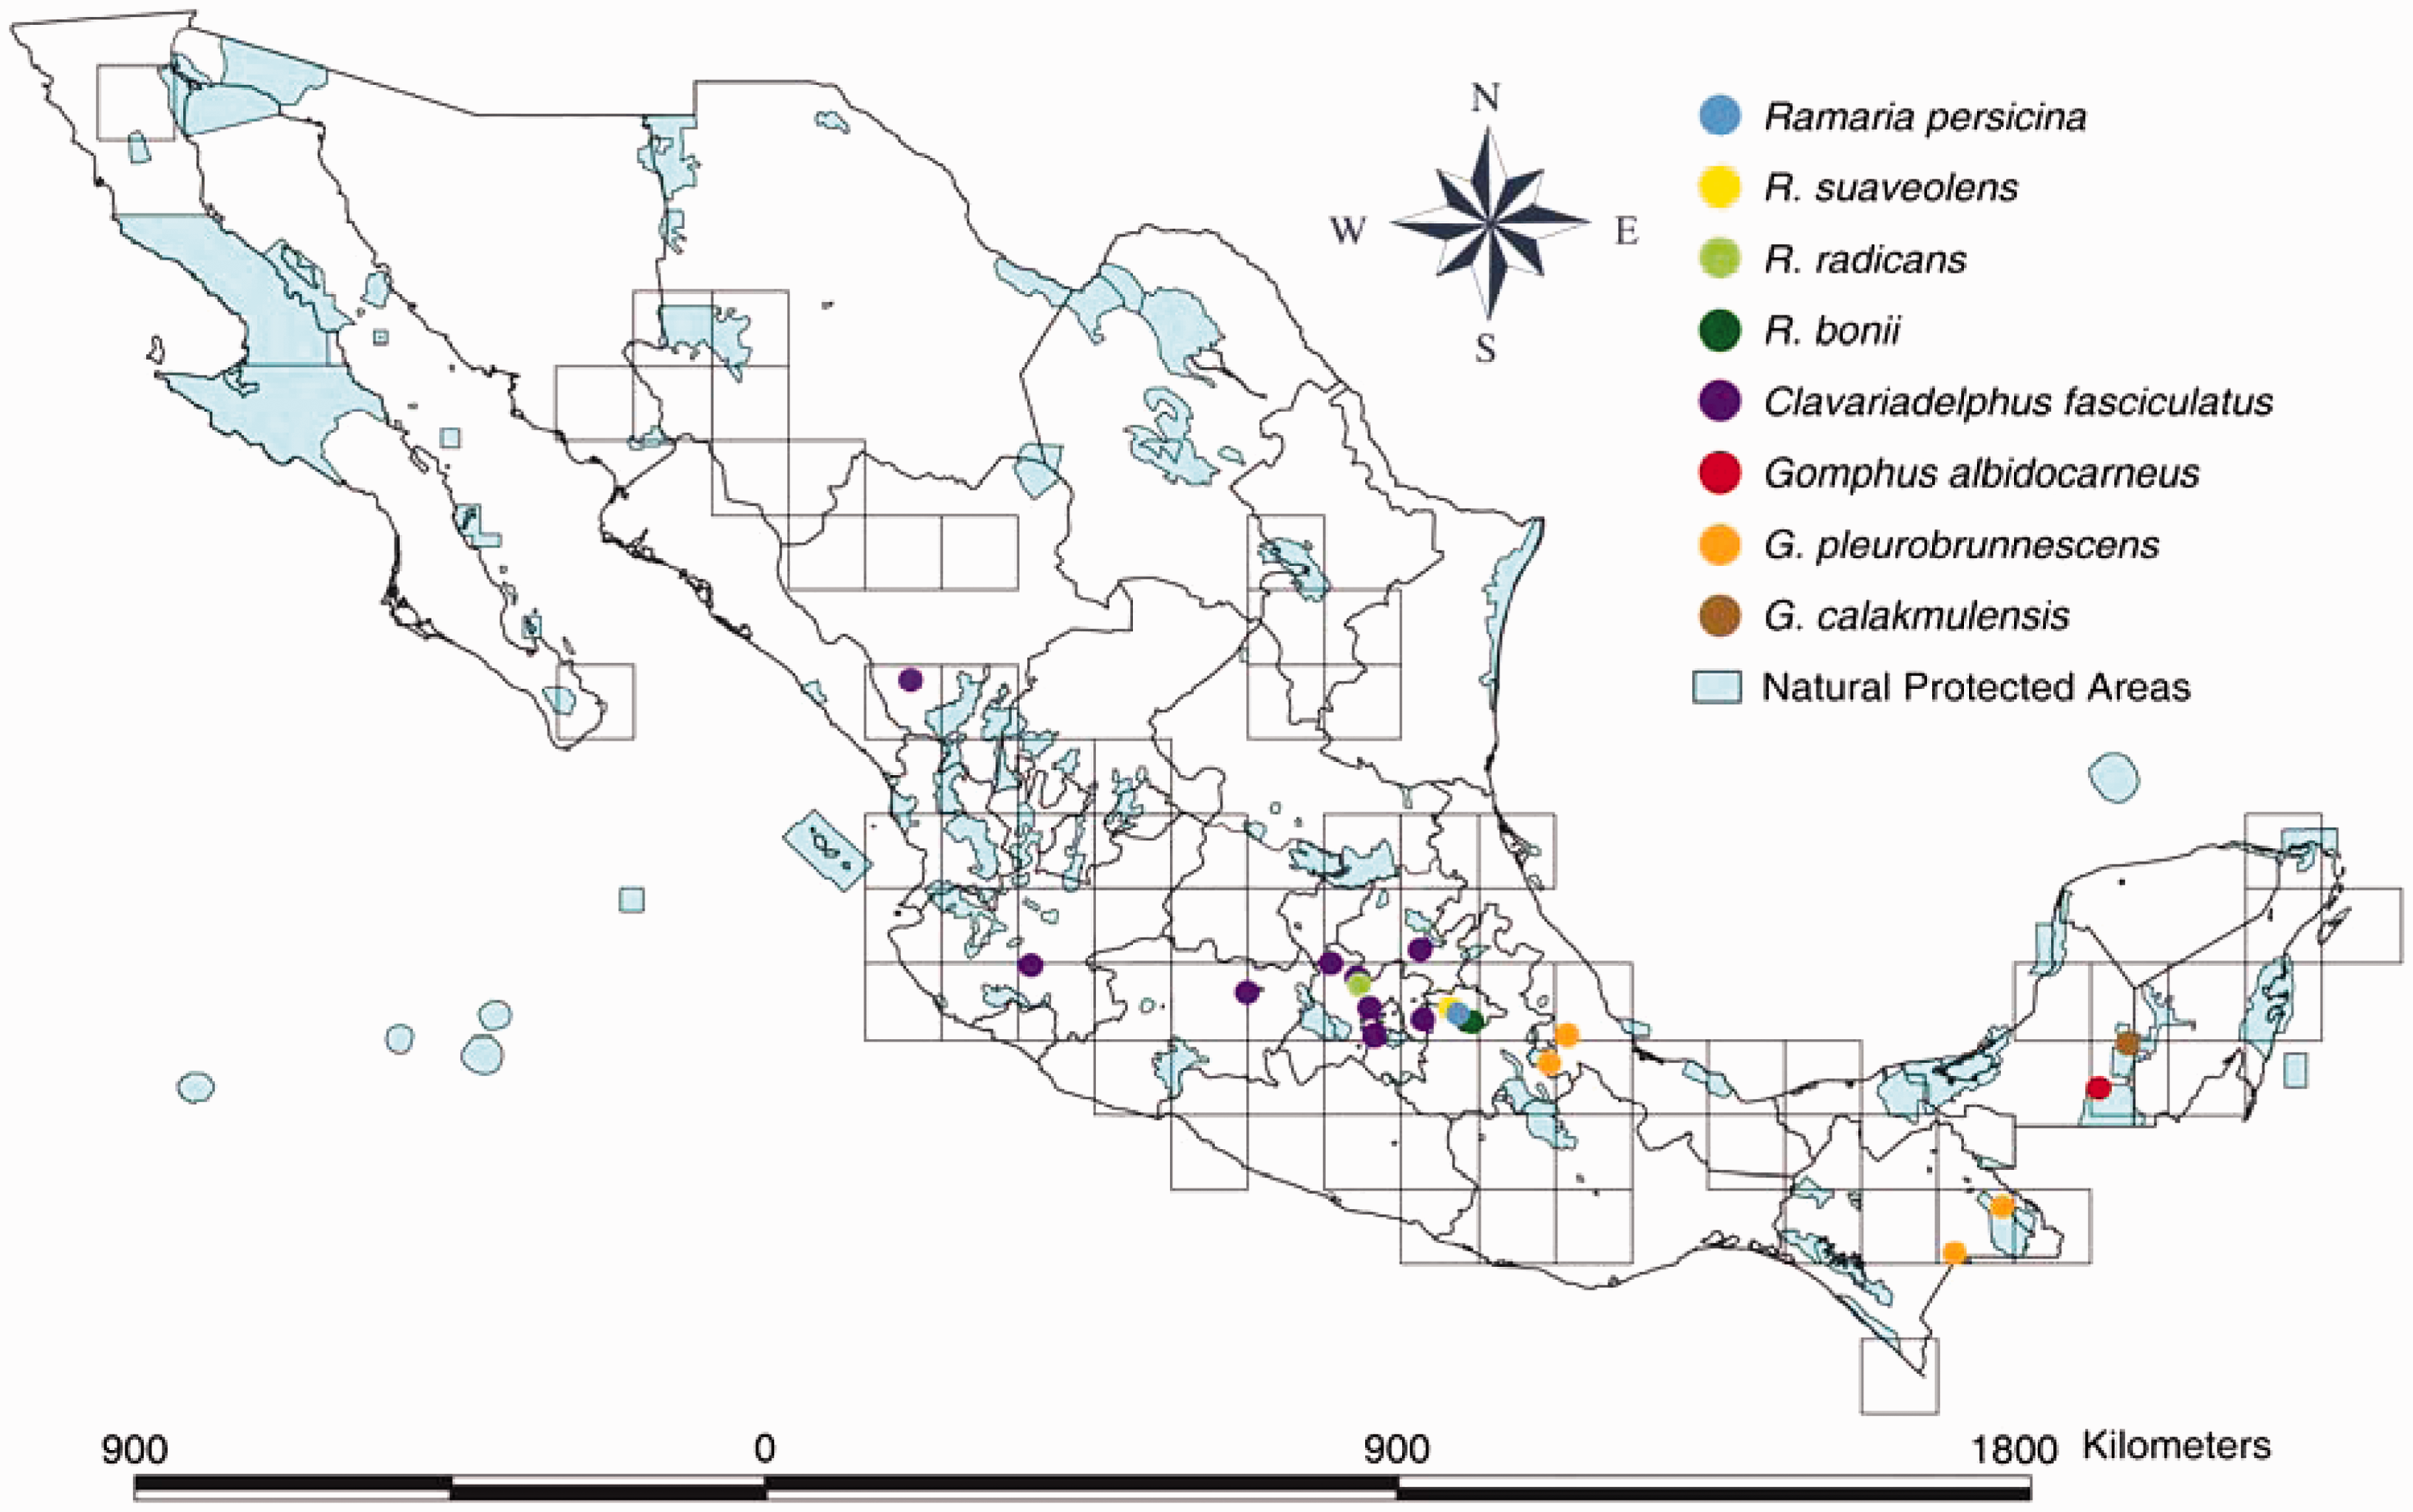
Species and genera were categorized as Nearctic, Neotropical, Holarctic, Pantropical, endemic and Cosmopolitan depending on their known distribution. An additional map was generated using a digital layer of the Protected Natural Areas of Mexico (CONABIO, www.conabio.gob.mx). Distribution records for species restricted to Mexico or first described in Mexico were plotted on the map in order to visually inspect their representation in the National network of Protected Natural Areas.
Results
Distributional datasets and general patterns
The database assembled included a total of 3,483 records, comprising 10 genera and 97 species of the order Gomphales (Figure S1), distributed in 81 grid-cells (Figure 1). The core dataset (CDS) included 56 species and it was the only one considered for endemism analysis, because the units of comparison are similar, which enabled us to avoid potential distortions resulting from the subjectivity of taxonomic ranking (Bertrand, Pleijel, & Rouse, 2006), or from considering non monophyletic taxa (Szumik & Goloboff, 2015). Distributional patterns for the genera dataset (Figure S1) showed a high concentration of species in central and southeastern Mexico (with the exception of Lentaria), broadly in agreement with the Mexican mountain ranges (mostly in the center of the country, where the Trans-Mexican Volcanic Belt is located, Figure 2b).
Global patterns of distribution
The elevational patterns described in the analysis support the previously reported relationship between distribution of ectomycorrhizal species and elevation (Bahram, Polme, Kõljalg, Zarre, & Tedersoo, 2012). Our results also support a relationship with vegetation types, but this may also be related to the distributional patterns of the associated plants (Miyamoto, Nakano, Hattori, & Nara, 2014). The present study represents the first attempt to categorize the country with reference to fungal distributions, particularly with Gomphales species.
Patterns recovered by the CWE index are less sensitive to distortions produced by richness patterns or bias in the sampling effort (Figure 3). Notwithstanding, they remain sensitive to under-sampled taxa and operational endemics. To our knowledge this is the first time that the use of the CWE has been documented for correcting sampling bias.
Map of Mexico and dendrogram showing two main clusters of Mexican Gomphales, a montane and a lowland group.
Some Mexican states with coniferous and oak forests, such as Aguascalientes, San Luis Potosí and Sinaloa, have few or no records of Gomphales. This is probably due to poor sampling rather than a real absence of Gomphales in those forests. Unfortunately, there are no institutions in these states where mycology research has been developed, and this has led to gaps in knowledge about the fungal diversity of the country.
The differential sampling problem results in areas with apparently different richness patterns, regardless of their similarity in vegetation types. This situation needs to be considered before arriving to final conclusions concerning diversity patterns in the country.
We detected at least six general distribution patterns in the Mexican species of Gomphales. These were: Holarctic (38 species), Nearctic (31 species), Cosmopolitan (9 species), Pantropical (6 species), Neotropical (5 species), and endemic to Mexico (8 species). These general patterns of distribution confirm their association with temperate vegetation, mainly with northern affinities (Table S1).
The Sorensen's index-based dendogram supported a clear distinction between montane and lowland regions (Figure 3). These patterns are partially related to the vegetation types and the elevation with which that particular fungal species is associated.
The montane group included grid-cells related to coniferous, pine-oak, oak and cloud forests, on elevations above 1000 m, and located mainly in the Trans-Mexican Volcanic Belt and the Sierra Madre Oriental. Prevalent species in this group are those of Ramaria and Clavariadelphus.
The lowland group included grid-cells related to tropical vegetation types, such as evergreen and deciduous forests (but not necessarily the same across the grid-cells). The corresponding grid-cells are distinguished by the presence of four tropical species of Lentaria (L. surculus and three additional species that have not been described, which are endemic to Mexico), two species of Gomphus endemic to Mexico (G. albidocarneus and G. calakmulensis), and four species of Phaeoclavulina (P. articulotela, P. gigantea, P. insignis and P. zippelli).
Two non-contiguous grid-cells were distinctly dissimilar to the rest (AAA and FFF). These grid-cells were located in lowlands (one on the Pacific coast and the other on the Gulf of Mexico). The first included parts of the states Michoacán and Guerrero, and the second parts of the states of Veracruz, Oaxaca and Puebla. These grid-cells do not share fungal species and do not seem to be associated with any recognizable pattern.
Distributional analyses
Species level core dataset (CDS)
The richest grid-cell was the TT (19 species), located in the central region of the country, comprising most of the state of Tlaxcala, including La Malinche National Park (Figure 4a). The second richest grid-cell was the KK (16 species), which partially includes two states and two National Protected Areas (Table 1). The following grid-cells with the highest values are located in the central and southeastern parts of the country, and are associated with Protected Natural Areas (Figures 4a and 5).
Highest richness, weighted endemism and corrected weighted endemism values of grid-cells based on the distribution of species of Gomphales. Number of species of Gomphales reported from some of the Mexican Protected Natural Areas (PNAs). Distribution of endemic species of Gomphales and their relationships with Mexican ANPs.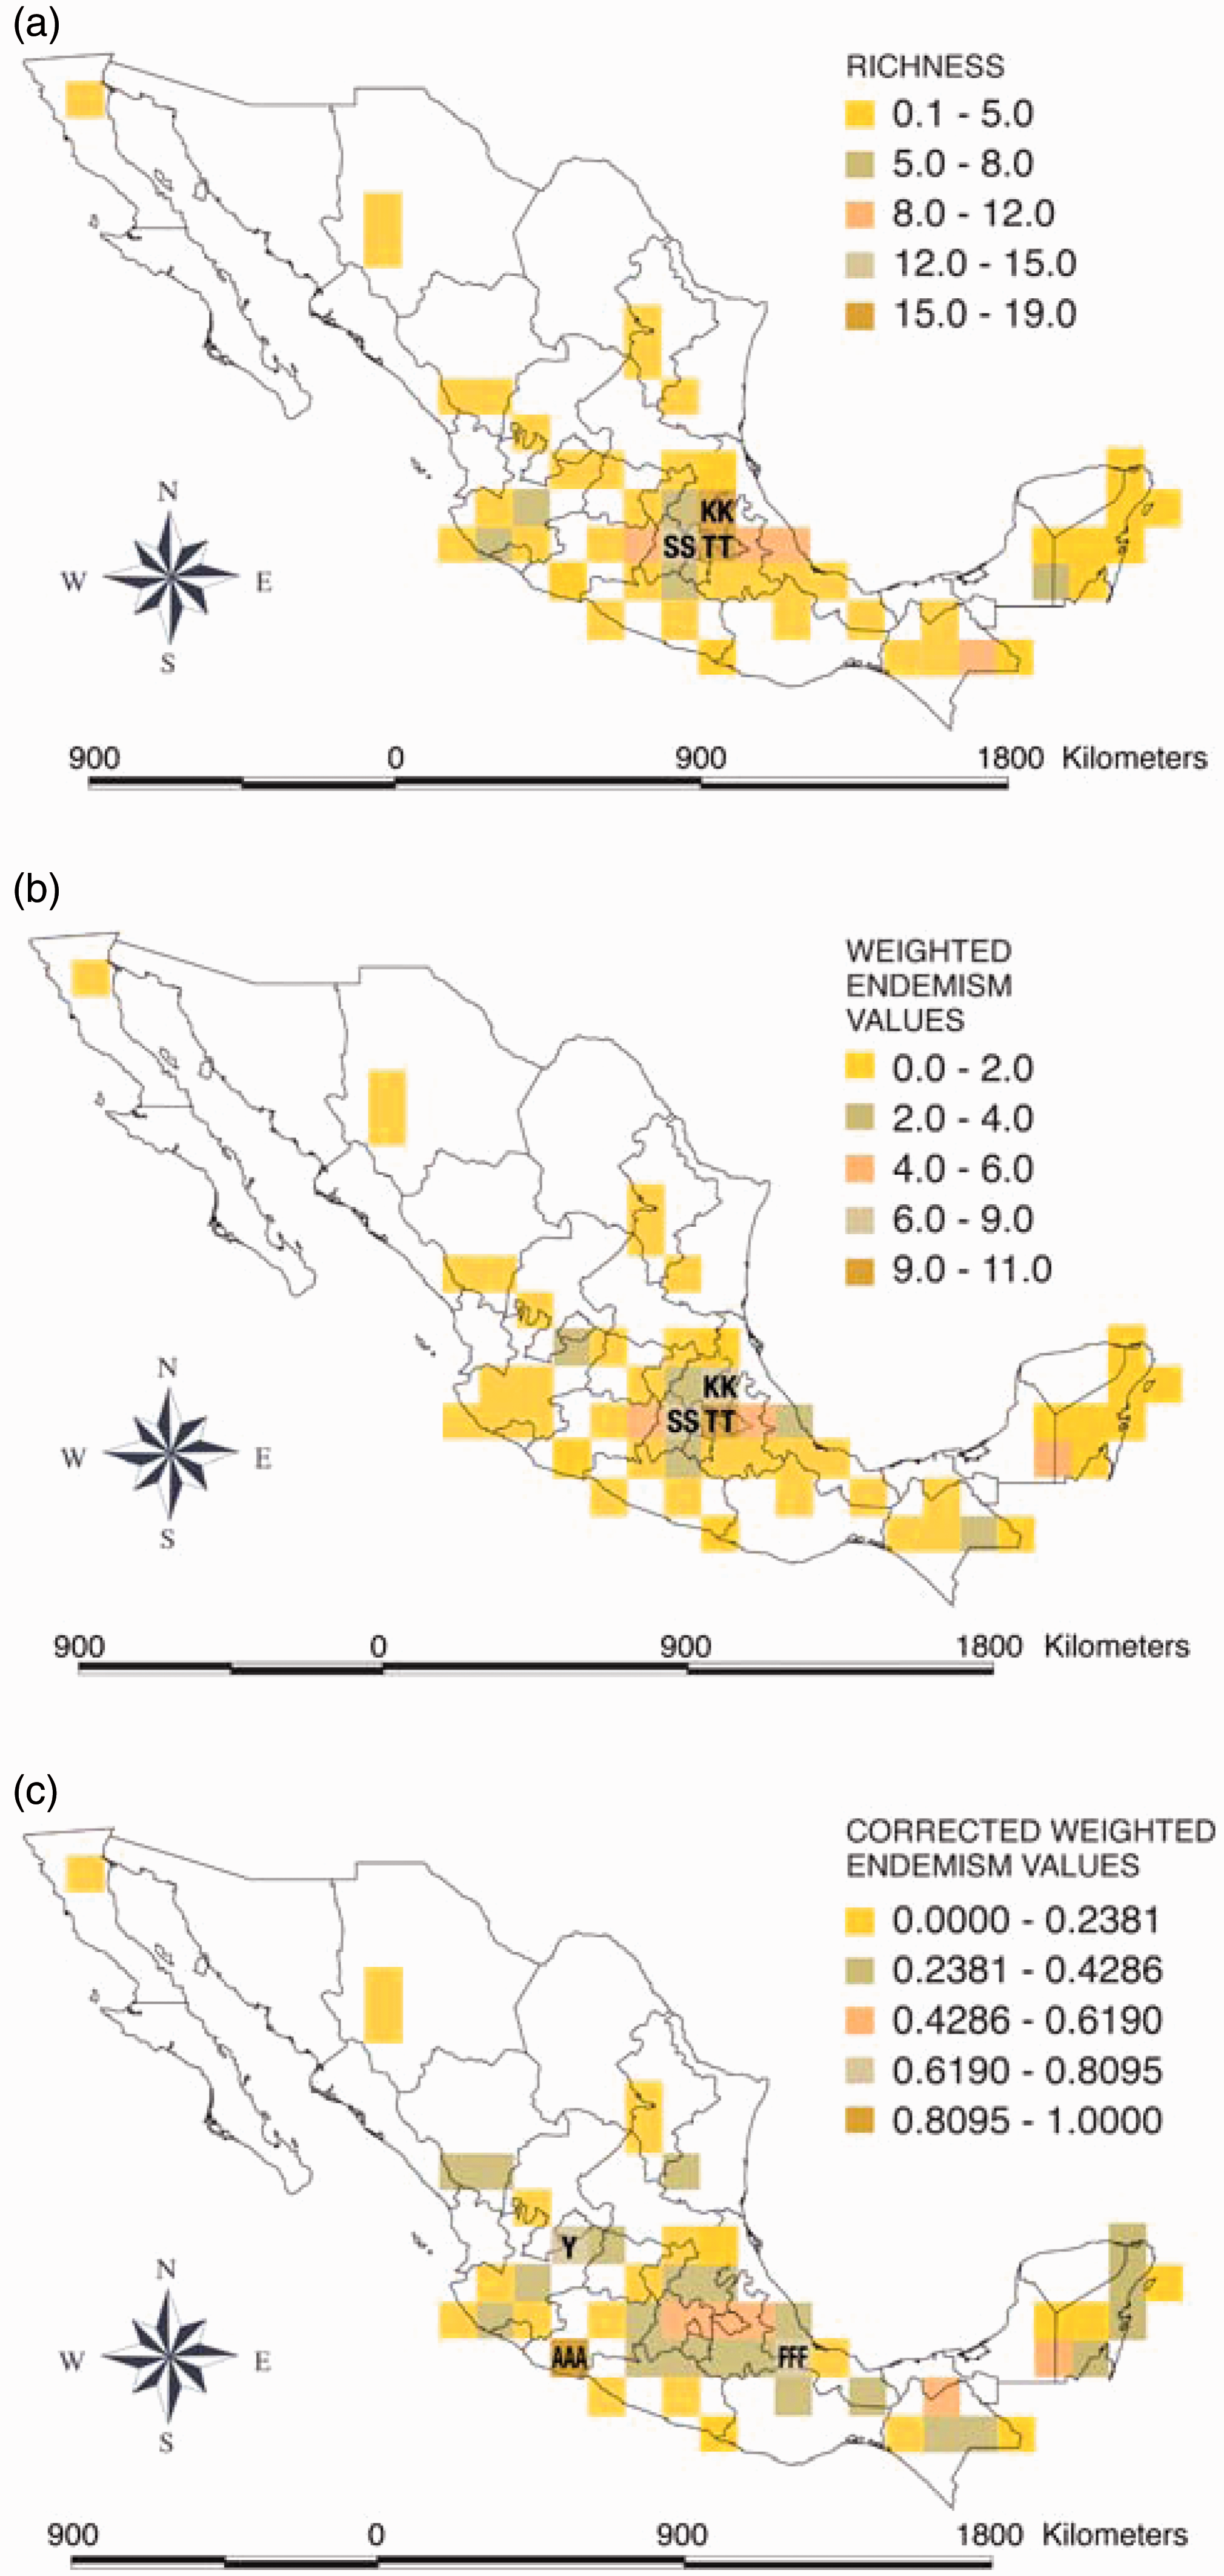

Patterns recovered from the weighted endemism index (WE) were similar to richness patterns, as reported previously (Crisp et al., 2001). The grid-cell with the highest value was TT (10.705), followed by grid-cells SS (6.7165) and KK (6.4596). These three grid-cells had the greatest richness as well (Figure 4a,b).
On the other hand, the corrected weighted endemism index (CWE) showed a different pattern compared to either richness or weighted endemism (Figure 4c). Grid-cells showing the highest values are AAA (1.0) located in the south of Michoacán, Y (0.69) located in Jalisco and Aguascalientes, and FFF (0.75) covering parts of Veracruz, Oaxaca and Puebla.
Grid-cell AAA includes only one record corresponding to a species of Phaeoclavulina which has not been described. The grid-cell FFF includes the only record of Beenakia fricta in Mexico and one of only two records of P. roellinii. The grid-cell Y (on the border of Aguascalientes and Jalisco) includes records of two species of Phaeoclavulina and one of Clavariadelphus truncatus, neither of which are formaly described (i.e. the species has not been described and properly published according with the code of nomenclature). The latter species has a wide distribution.
Richness and WE showed a very strong correlation (r2 = 0.9215, p-value: <2.2e-16), while richness had a low correlation with CWE (r2 = 0.0483, p-value: 0.1174). Correlations on these indexes in the Gomphales datasets (Figure S2) are similar to those reported previously for other taxa in Mexico (Santa Anna del Conde et al., 2009).
Number of genera and species of Gomphales in the Mexican biogeographic provinces.

Number of species of Gomphales in the Mexican states.

Analysis of the extended dataset (ExCDS)
Richness and endemism patterns recovered from the analysis of the ExCDS were highly congruent with results from CDS (results not shown). This could be because the information from the records of subgenera of Ramaria may be outnumbered by the records of the species level dataset. Ramaria represents the most species-rich genus of Gomphales in the country (58 species).
We assembled a database of 2,775 records, many of which were identified only to the subgenus level due to missing information, because fresh specimens were poorly documented in the field. The most diverse zones in terms of number of subgenera, species and/or subspecies of this genus were grid-cells SS and NNN (Figure S3), located in the center of the country, corresponding with montane localities in elevations from 1,000 to 3,900 m, in coniferous, oak and cloud forests (Table 1). Records for Ramaria subgenera have a richness pattern similar to other species of Gomphales, with the highest values concentrated in the center of the country. Edible and mycorrhizal species (Table S2 and Table S3).
Analysis of the genera dataset (GDT)
The grid-cell containing the highest number of genera was UU, containing seven out of ten of the genera recorded for Mexico (Figure S4). This grid-cell included Cofre de Perote National Park, on the border of Veracruz and Puebla (Table 1). The second richest cell was the TT with six genera, which covers most of the state of Tlaxcala, including most of La Malinche National Park. The following richest grid-cells had a pattern of distribution congruent with that observed in the core dataset, with the highest values in the center and in some areas of southeastern Mexico, and a strong association with protected areas.
A similar pattern was recovered with states and biogeographic provinces as geographic units of comparison. The provinces of the Trans-Mexican Volcanic Belt and the southern part of the Sierra Madre Oriental (Figure 2) had the highest values of richness of genera (Tables 2 and 3). The regions with fewer records are located in the northern part of Mexico, most likely because of a poor sampling effort rather than a real absence of Gomphales in the area.
Endemic species and their conservation status
The eight species of Gomphales described for Mexico were located in the center and southeastern part of the country (Figure 5), consistent with the overall pattern of richness previously described (Figure 4a). One species was originally described from La Malinche National Park (Ramaria bonii), and the protologue is the only available record. Four of the species have been recorded more than once in Protected Natural Areas, but four species have one or no records in protected areas (R. persicina, R. radicans, R. suaveolens have no records and Clavariadelphus fasciculatus have one record).
Discussion
Distributional data and general patterns of richness
The central and southeastern parts of Mexico have the highest values of richness in the country (Figure 4a), corresponding to the Trans-Mexican Volcanic Belt and the Sierra Madre Oriental (Figure 2b). This may be partially the result of the extensive sampling effort in these regions over several decades (Aguirre-Acosta et al., 2014). In general, this pattern of richness follows that reported for other fungal groups in Mexico (Aguirre-Acosta et al., 2014).
Overall distributional patterns
Most of the species (69 species) of Gomphales known to be found in Mexico are concentrated in two global patterns of distribution, Holarctic and Nearctic, representing 71% of the species. These two general patterns of distribution confirm their association with temperate vegetation types such as fir, pine and oak forests. Halffter (1987) noted that the Nearctic and Holarctic patterns in insects are related to the mountainous systems of Mexico and northern Central America, which have also been observed in species of Gomphales. In the case of the Trans-Mexican Volcanic Belt, this mountain chain has been considered a diversification center for animals (Halffter, 1987) and plants (Styles, 1993); if this situation is also confirmed for the Gomphales, many more endemic species are still to be discovered.
The altitudinal zones recovered with Sorensen's index (Figure 3) are congruent with patterns previously reported for ectomycorrhizal fungi (Jarvis, Woodward, & Taylor, 2015), where distribution is closely related to elevation, more than to other parameters, and the greatest richness is found above 1000 m.a.s.l. (Miyamoto et al., 2014).
Cifuentes et al. (2004) analyzed the distribution of 220 species of macrofungi of the Sierra Madre Oriental mountain chain through a PAE (Rosen, 1988). These authors found a closer relationship between species distribution and elevation, rather than with vegetation type; unfortunately, they could not recover a clear pattern of locations. Our results support a closer relationship between elevation and fungal composition. We were also able to recover a clearer pattern of distribution, probably because our analysis was conducted on a larger geographical scale.
Finally, the presence of Beenakia fricta in Mexico could be indicative of a cryptic speciation phenomenon in this taxon. This species has been reported in Africa, Europe and Mexico (Borgarino, Moreau, & Richard, 2005; Nuñez & Ryvarden, 1994). Such a wide distribution is usually associated with lineages composed of multiple phylogenetic species and low morphological differentiation (known as cryptic species). Hawksworth (2012) argued that this phenomenon is more frequent in taxa with tropical distributions.
Richness and endemicity in the core dataset (CDS)
Grid-cells with the highest richness values (TT, KK and SS) included Protected Natural Areas (Table 1, Figure 5), which have traditionally been studied by mycologists (Aguirre-Acosta et al., 2014). Among the Protected Natural Areas of Mexico, the Natural Parks and Biosphere Reserves have been extensively sampled due to the interest in having a comprehensive inventory of the species present there. This may have led to a bias in the richness data, resulting in a distorted pattern of high richness in areas where there has been extensive sampling and low richness in poorly sampled areas. These factors need to be taken into account when considering the richness patterns recorded for Mexican Gomphales.
Tlaxcala had the most species (21) of Gomphales, despite being the smallest state in surface area in the country. The states with the next largest numbers of species of Gomphales recorded were Veracruz (20 species) and Estado de Mexico (19 species) (see supplementary material). These data partially follow the pattern of being the states where most sampling occurred, as reported by Aguirre-Acosta et al. (2014).
The results showed that the central and southeastern Mexican states have the highest values for richness. These values may reflect the sampling efforts made in certain states for macroscopic fungi in particular, as mentioned above. These results may change in the future and are congruent with patterns of other biological groups of Mexican biota. Other studies (Flores-Villela & Gerez, 1994; Mittermeier et al., 1992; Ramamoorthy et al., 1993) have found that the states of Oaxaca, Chiapas and Veracruz have the greatest biodiversity in the country and have recently been recognized as megadiverse Mexican states (Luna-Vega, Espinosa, Rivas, & Contreras-Medina, 2013).
The biogeographical provinces showing the greatest diversity of species and genera are the Trans-Mexican Volcanic Belt and the southern portion of the Sierra Madre Oriental (Figure 2b). The Trans-Mexican Volcanic Belt is the richest province for Gomphales. This result is not surprising, since the Trans-Mexican Volcanic Belt is one of the most biodiverse zones, where extensive sampling has occurred, as is corroborated by other groups of organisms such as Boletaceae fungi (García Jiménez J & Garza Ocañas, 2001), Ternstroemiaceae (Luna-Vega, Alcántara-Ayala, & Contreras-Medina, 2004) and other groups of Mexican plants (Contreras-Medina & Luna-Vega, 2007; Styles, 1993; Villaseñor, 2004; Luna-Vega, Alcántara-Ayala, Contreras-Medina, & Vargas, 2006), as well as animals (Fa & Morales, 1993; García-Trejo & Navarro, 2004; Navarro-Siguenza, Lira-Noriega, Peterson, Oliveras de Ita, & Gordillo-Martínez, 2007; Ochoa-Ochoa & Flores-Villela, 2006).
Biogeographic provinces with no available records are Baja California, Sonorense and Soconusco. The Baja California peninsula deserves a special mention because there are some records available in its distal portions (California and Del Cabo provinces) which are associated with coniferous forests (Styles, 1993). Most likely the low richness values reported for this area are due to poor sampling rather than a real absence of Gomphales in the area. This may be especially true for regions where there is a high richness of pine, fir and oak species. However, in regions such as the Baja California desert, the lack of proper biotic conditions may be the reason of the absence of records for Gomphales.
Corrected weighted endemism (CWE) showed a different pattern to richness. The main objective for calculating this index was to avoid the potential distortion produced by richness values, allowing us to easily recognize areas where there was a unique or distinctive composition (that may constitute potential areas of endemism) and that may be difficult to recognize with other indices. Non corrected endemism index may be very sensitive to an under-sampling of common species (Crisp et al., 2001), and that is another reason because of the use of CWE. This index also allows us to avoid, up to certain level, the distortion resulting from sampling biases, even when the index may be sensitive to the under-sampling of common species (Crisp et al., 2001).
The richness values in Mexican Gomphales showed a strong correlation with the corrected endemism index and a low correlation with the CWE. Correlation values between richness and CWE for Mexican Gomphales were similar to previous studies with plants, i.e. Crisp et al. (2001) and Santa Anna del Conde et al. (2009) and support the use of the CWE as an index relatively unaffected by richness patterns.
The grid-cell with the highest CWE value was AAA (1.0), located on the Pacific Coast, on the border between the states of Michoacán and Guerrero. This grid-cell includes only one Phaeoclavulina species that has not been formally described and which is endemic to Mexico. It inhabits coniferous forest at an elevation of 2,400 m, and was collected from only one locality. Because this grid-cell has only one record of a species collected from this locality, the CWE value for the grid-cell is 1, indicating that the species is restricted to that single grid-cell (Giachini & Castellano, 2011; González-Ávila et al., 2013).
This CWE index produces misleadingly high values when only uncommon species are collected (Crisp et al., 2001). In our study, high values most likely represent an absence of data, rather than the relative abundance of characteristic species. This fact has been reported previously by Santa Anna del Conde et al. (2009), suggesting that high values CWE need to be carefully examined to give accurate results.
The grid-cell FFF (CWE = 0.75), located on the Gulf Coast, includes two records: the only record of Beenakia fricta in Mexico and Phaeoclavulina roellinii, also distributed in Chiapas (grid-cell WWW). The FFF grid-cell has a very high value due to the presence of B. fricta, even when it is a “false” endemic species. B. fricta has been reported from two other continents (Africa and Europe; Nuñez & Ryvarden, 1994; Borgarino, Moreau, & Richard, 2005). The same occurs with P. roellinii restricted to two Mexican grid-cells, which is also not endemic to Mexico (it is also distributed in North America and Europe, according to Petersen (1981)). The FFF grid-cell contains two records of non-endemic but highly restricted species in our dataset, producing an unusually high value. This behavior for the index has been reported previously (Dávila-Aranda et al., 2004), but there has been no further discussion.
On the other hand, the grid-cell Y (CWE = 0.68) includes the only records of two non formally described species of Phaeoclavulina (potentially endemic to Mexico), and one record of the widely distributed Clavaridelphus truncatus. The high value of this grid-cell is the result of the existence of two restricted and potentially endemic species.
The high CWE values of grid-cells AAA, FFF and Y are the result of different factors. AAA and Y grid-cells include endemic species and their values reflect, to some extent, the aim of the index for recognizing the “uniqueness” of the grid-cell, but the FFF grid-cell includes what we call “operational endemics”, which are species widely distributed outside the area of study, but very restricted in the dataset under analysis.
The presence of “operational endemics” in our distributional data reflects the absence or scarceness of geographic records or taxonomic studies based on species of Gomphales in Mexico. In the future, with advances in Mexican mycological studies, some of the species we have recorded as false endemics or “operational endemics” (because they are also distributed in other countries, whereas in Mexico they have only been found in one grid-cell) are likely to be recorded in other areas or states of Mexico.
In most of the contributions related to the taxonomy and biogeography of fungi, the species concept is morphological. However, some studies using microanatomy or molecular data have shown that some fungi taxa based on morphology may represent different cryptic species (Giachini, 2004). In this sense, future studies should modify the taxonomic status of some of the taxa considered herein.
Richness and endemicity in the genera dataset (GDS)
When genera were used as basic units for comparison, the richness patterns were highly congruent with the previous ones. All the genera (with the exception of Lentaria and Beenakia as mentioned before) were distributed in the central and southeastern parts of Mexico, mainly in the Trans-Mexican Volcanic Belt and in the southern part of the Sierra Madre Oriental (Figure 2b). Most of the species were recorded at elevations up to 3900 m, corresponding with montane areas. These elevations may partially contribute to the pattern recovered when applying Sorensen's index to the richness data (see above, Figure 3).
Species included in genera as Ramaria, Clavariadelphus and Gautieria are distributed at the highest elevations (1000 m - 3900 m), while Lentaria and Beenakia have the lowest range (10 m-1860 m). Overall, the only pattern that can be recognized at genera rank indicates that the highest richness is associated with higher elevations. Additionally, there may be some uncertainty if genera are used as units of comparison, because of the potential distortions that may result if taxa recognized and formally described under different criteria are compared (Bertrand et al., 2006), or if non-monophyletic taxa are considered (Szumik & Goloboff, 2015), which is the case with Ramaria and Clavaridelphus.
Species with restricted distribution
At least eight species of Gomphales are endemic to Mexico (Figure 5). Most of the species are distributed in the Trans-Mexican Volcanic Belt. Three species of Gomphus have been described from tropical regions in the states of Campeche, Veracruz and Chiapas, at elevations from 300 to 1500 m.a.s.l. (Figure 5). It is likely that more field work sampling at low elevations will discover more endemic species.
The percentage of endemic species is around 8% (of a total of 97 species of Gomphales in Mexico). This value is twice that reported for lichens, according to Herrera Campos et al. (2014). Building on these authors’ findings, we can suggest that if the proportion of endemic species is similar, the number of species of Gomphales in Mexico could reach 200 species, 59% of the total number of species reported by Kirk et al. (2008), or even higher if more endemic species are discovered.
Implications for conservation
Special protection and conservation programs usually rely on data from Red Lists. For fungi, those lists are often based on less information than is available for plants or animals. Field data for population dynamics or size is difficult to obtain for most fungal species, but distributional records are less problematic. Because of this, conservation policies and programs for fungi usually rely on distributional records only (Dahlberg & Mueller, 2011). Usually, species with very few records are considered to have a highly restricted distribution area and to be more susceptible to extinction. For this reason they are more likely to be included in special protection programs.
Our paper provides the basic data required to inform conservation policies for the Mexican Gomphales. These species meet most of the requirements to be protected and included on Red Lists and special conservation programs (Figure 5). There have been very few reports of Ramaria and Gomphus species in Mexico, and most of those are from the protologue. A clear example of this is the Clavariadelphus fasciculatus, a species restricted almost exclusively to Central Mexico, and which mainly occurs outside protected areas.
Biogeographical studies, such as the present one, are especially relevant because, rather than merely generating data, they provide insights which can inform biology conservation policies and programs (Hawksworth, 2012; Merckx et al., 2014). They also promote a recognition of centers of richness and endemism (Contreras-Medina & Luna-Vega, 2007; Crisp et al., 2001).
Another example of unprotected species are those lineages of Gomphales potentially endemic to Mexico. The eight species described from Mexico are known only in Mexico, and so far they have not been included in any protection program (i.e. International Red Lists or Mexican Norm NOM-059).
Overall, most of the species of Gomphales reported to have been found in Mexico are distributed in areas without any protection or conservation status. The species distributed in Protected Natural Areas are present in just 10% of the total area under protection in the country, mainly in Central Mexico. Izta-Popo and La Malinche National Parks, located in the Trans-Mexican Volcanic Belt, together harbor 19 species.
The apparent high number of species of Gomphales in National Parks and Biosphere Reserves can be explained by the extensive sampling that has been carried out in these categories of Protected Natural Areas. Most of the Mexican Protected Natural Areas are National Parks, but the Biosphere Reserves have the biggest area under protection in Mexico (Flores-Villela & Gerez, 1994).
Some initiatives for conservation of fungal species in Europe take into account the management and protection of the habitat (i.e. the forest) as part of a comprehensive approach to conservation. The careful preparation of Red Lists and special programs for endemic species with restricted distribution represents an essential element of any successful conservation program (Dahlberg, Genney, & Heilmann-Clausen, 2010; Dahlberg & Mueller, 2011; Heilmann-Clausen & Vesterholt, 2008; Molina et al., 2011; Moore, Nauta, Evans, & Rotheroe, 2008; Senn-Irlet, Heilmann-Clausen, Genney, & Danhlberg, 2007; Venter et al., 2014). A comprehensive approach which includes multiple data sources may be most effective for protecting Mexican Gomphales. Combining the current program of Protected Areas with a properly elaborated list of species at risk may be the most effective approach. Our contribution represents a step in that direction of conservation biology.
Mexico harbors almost 27% of the known diversity in the order Gomphales, and probably could reach up to 59% of the known species, if the northern and tropical regions of the country were more widely explored. The presence of several potentially endemic taxa has been documented in temperate areas of Mexico, for example, in the genus Ramaria subgenus Laeticolora (see Estrada-Torres, 1994), and the same situation occurs in the tropics where three species of Gomphus have been described in recent years (Giachini, 2004).
This region is the most populated and urbanized in the country and, because of the reduced amount of well conserved forest, a low richness of fungal species can be expected. It is likely that the high richness reported is related to the extensive sampling effort over several decades. For this reason there is an urgent need to implement conservation strategies for species known in localities outside protected areas, such as R. persicina and R. suaveolens, as well as those growing in protected natural areas such as Popo-Izta and La Malinche National Parks.
Footnotes
Acknowledgements
To the people in charge of the collections mentioned in the text for their courtesy during the review of their specimens; to Adriana Lomelí (UNAM, Mexico) for providing valuable technical assistance; to the Posgrado en Ciencias Biológicas at the Universidad Nacional Autónoma de México; to Consejo Nacional de Ciencia y Tecnología (CONACYT), Mexico (the National Science and Technology Council) for the grant (number 207211) awarded to the first author. The financial resources for field trips and herbaria visits came from PAPIIT projects IV201015 and IN215914.