
Abstract
Many individuals are exposed to multiple toxic chemicals that contribute to the same adverse health impacts. However, these co-exposures and community vulnerability to exposures are not often considered in chemical assessments and regulations. In this study, we develop an approach to identify the potential co-exposures of chemicals causing similar adverse health effects and community vulnerability where these exposures occur. Co-releases of toxic chemical pairs in the same health endpoint groups were assessed from the U.S. Environmental Protection Agency’s Toxics Release Inventory (TRI). Comparative impacts from toxic chemical releases that occur in overburdened communities were conducted using the Climate Vulnerability Index (CVI). Analysis of variance (ANOVA) was used to determine if the magnitude of releases was significantly different between facilities releasing one or multiple chemicals, and ANOVAs with post hoc Tukey’s Honestly Significant Difference were performed to determine if CVI scores were significantly different depending on endpoint group or chemicals. This study found the occurrence of TRI co-releases of chemical pairs causing similar health effects ranges from 0% to 72%, with high co-releases in similar volatile organic compounds and metals. Facilities releasing multiple chemicals released statistically significantly higher amounts of these chemicals from 2017 to 2022 than facilities that release only one chemical—over 285,000 lbs. more on average (p < 0.0001). Additionally, chemicals such as vinyl chloride and hexachlorobutadiene are released frequently in more vulnerable communities, with the CVI of communities near these chemical-releasing facilities being 8%–16% greater on average. This study provides an approach for identifying toxic chemical co-releases and community vulnerability where chemicals are released, which can aid state and federal agencies in prioritizing chemicals for assessment and regulation based on their potential for cumulative risks in overburdened communities, scoping for cumulative risk assessments, and identifying opportunities for co-benefits to at-risk communities.
Keywords
INTRODUCTION
Many individuals, including industrial workers, communities at the fenceline of industry, and consumers, are exposed to multiple toxic chemicals that contribute to the same adverse health effects—often defined as cumulative exposures or cumulative risk. Further, low-income communities of color bearing these cumulative exposures are often overburdened by historic disinvestment that has led to exposure to greater chemical and nonchemical stressors, also referred to as cumulative impacts. 1 These communities face disproportionate health risks from exposure to multiple toxic chemicals in their environments, such as from high numbers of legacy pollution sites (e.g., Superfund sites), 2 numerous and concentrated chemical storage and industrial facilities, 3 air pollution from traffic or ports, 4 and multiple other consumer or environmental exposures. 5 Much of this spatial clustering of toxic chemical burdens and the associated health disparities has occurred directly as a result of historical racial practices, such as redlining. 6 Community and environmental advocates have long called for federal and state agencies to consider the cumulative burdens in regulatory and policy decisions, 7 and researchers have continued to develop assessments of multiple chemical and nonchemical exposures into risk assessments. 8 Notably, the recent 2025 National Academies of Sciences, Engineering, and Medicine (NASEM) report on the State of the Science and Future of Cumulative Impact Assessment highlights many of these methodologies that have been developed to address cumulative impacts—such as composite indexes, matrix-based approaches, and concepts from toxicology, epidemiology, life-course approaches, and economics. NASEM particularly emphasizes the need to design approaches tailored to the policy or regulatory decisions the approaches are designed to answer—termed “fit-for-purpose.” 9
Despite this mounting evidence, developing approaches to assess the complex real-world exposure scenarios that consist of numerous chemicals, cumulative risks, and impacts—particularly in overburdened communities—is often not considered in federal- and state-driven risk assessments or when prioritizing chemicals to undergo assessment and regulation. Rather, assessments are typically conducted on a chemical-by-chemical basis, which fails to capture the multiple, overlapping chemical and nonchemical exposures that contribute to overall health and well-being.
Consideration and quantification of cumulative risk from exposures to multiple toxic chemicals that cause the same adverse health effects begins first with understanding (1) which chemicals contribute to the same health harms and (2) identifying the chemicals that individuals are co-exposed to either from the same source or multiple nearby sources. To address the former, toxicological and epidemiological data from existing assessments (i.e., Integrated Risk Information System [IRIS], Agency for Toxic Substances and Disease Registry [ATSDR] ToxProfiles, and the published literature) have been used to determine which chemicals contribute to the same adverse health effects. 10 Understanding co-exposure to toxic chemicals that cause the same health effects can also be done through existing data, such as the U.S. Environmental Protection Agency’s (EPA) Toxics Release Inventory (TRI), 11 National Emissions Inventory (NEI) data, 12 Chemical Data Reporting (CDR) data, 13 or testing of consumer products. Although considerations of cumulative risk have not been typically incorporated in federal risk assessments used for decision-making, with a few notable exceptions and published guidance, 14 the current state of federal and state policies presents an opportunity to incorporate quantitative considerations of cumulative risk and community vulnerability into chemical prioritization. This could be done as a screening step prior to a risk assessment or when considering co-management of toxic chemicals to inform more real-world and equitable estimates of risk and aid in prioritization and management of risks. For example, states like Colorado that aim to set health-based standards for select priority toxic air contaminants (PTACs) can implement this approach to co-manage exposures to chemicals that occur along with state-selected PTACs and that cause the same health harms. 15
Additionally, the passage of the 2016 amendments to the Toxic Substances Control Act (TSCA) required the prioritization, assessment, and management of chemicals. 16 The amendments include a mandate to consider risks to susceptible populations—including overburdened communities (e.g., historically marginalized neighborhoods located near multiple polluting industries). 17 However, methods for considering the multiple overlapping exposures to overburdened communities have not been applied in prioritization and regulation under TSCA and only sparingly in assessment. 18 The methods presented in this article can help identify health-relevant co-exposures for use in cumulative risk assessments as well as the release of chemicals in overburdened communities to guide the permitting process for regulated industries and industrial chemical manufacturing and use.
In this study, we develop a screening analysis that identifies both the potential co-exposures of toxic chemicals causing similar health effects as well as the comparative impacts from chemical releases that occur in overburdened communities through the use of a vulnerability index. We used data from the TRI and the Climate Vulnerability Index (CVI) to assess the co-releases and community vulnerability of TSCA Work Plan chemicals. The TSCA Work Plan represents a list of 90 chemicals that have the highest combined hazard, exposure, and persistent, bioaccumulative, and toxic (PBT) scores. EPA is required to give preference to chemicals on this list as candidates for assessment under TSCA over the next several years. 19 EPA’s TRI tracks the management and releases of over 800 chemicals and chemical categories that may pose a threat to human health and the environment from facilities involved in manufacturing, metal mining, electric power generation, and hazardous waste treatment. 20 As such, it is one of the most comprehensive resources of industrial releases of toxic chemicals that is publicly available and widely used.
The CVI, created by the Environmental Defense Fund and Texas A&M University, is a vulnerability index of Census tracts across the United States based on over 180 indicators of health, infrastructure, environmental, social and economic, extreme events, and climate change risks to health and socioeconomics. 21 This index allows for an understanding of nationally relevant determinants of health at a neighborhood scale, which can be used to assess how community vulnerability to chemical exposures—such as those from TRI facilities and other stressors such as climate change—varies across neighborhoods. The Baseline Vulnerability Index from the CVI is also informative, as it includes data on baseline community health and infrastructure without the consideration of vulnerability to climate disasters. For both indices, a higher value indicates higher vulnerability. In this study, the CVI is used as a screening index to understand which toxic chemicals are released into more vulnerable communities—giving policymakers an approach to further prioritize chemicals of concern by considering nonchemical stressors in addition to the potential cumulative risks from multiple co-exposures.
METHODS
Selection of chemicals and health endpoints
Chemicals investigated in this study include those determined by the U.S. EPA as TSCA Work Plan Chemicals that have not undergone or are not currently undergoing risk assessment under TSCA as of 2024 and are reported in EPA’s TRI. We chose to use the TSCA Work Plan chemicals in our analysis due to the employed screening methodology and relevancy, as the EPA is required to give preference to chemicals on this list when selecting chemicals for further assessment. 22 Hydrogen fluoride and bisphenol A were also included, although not TSCA Work Plan chemicals, due to the EPA listing these as part of its “pre-prioritization” chemicals that were considered for its annual initiation of TSCA prioritization. 23 Chemicals from the TSCA Work Plan that cause only aquatic toxicity were not included in the analysis.
Chemicals were grouped into health endpoint categories based on the health effects that they have been found to contribute to. The endpoint groups chosen for this study were central nervous system (CNS); cancer; cardiological and respiratory; liver, kidney, and thyroid (LKT); and developmental and reproductive. The chosen endpoints represent the most common and most severe health endpoints from exposure to the chemicals included in this study. Cardiological and respiratory endpoints, developmental and reproductive, and LKT effects were grouped due to many of the chemicals in these groups having these effects and for efficiency in demonstrating the analysis. Although the endpoints considered were grouped into five categories for purposes of demonstrating the analysis, the health endpoints should be considered individually for more specific analysis, such as in later stages of prioritization and in risk assessment planning and implementation.
The health endpoints for each chemical were determined by the potential for the chemical to cause adverse health effects, which were typically gathered from U.S. EPA IRIS assessments, ATSDR ToxProfiles, European Chemicals Agency (ECHA) assessments, or supplemented by the scientific literature when information from other agencies was not available. Chemicals were noted to contribute to primary health endpoints if more than one study reviewed by EPA IRIS, ATSDR, ECHA, or the literature indicated the chemical contributes to those effects. All chemicals used in this study, the endpoints associated with exposure, and the information source are listed in Supplementary Excel Table S1.
Identifying co-releases
Releases of chemicals within each endpoint group were assessed using TRI on-site release data from 2017 to 2022 to cover multiple, recent years of releases.
24
If a single facility releases multiple chemicals, the facility is required to submit an individual report for each chemical, and therefore, there are separate entries in TRI for each chemical. Equation (1) was used to calculate the overall percentage of releases in each endpoint group that are co-releases (CRg). Here, each facility–chemical combination was counted as a release.
Equation (2) was used to calculate the percentage of co-releases (CRp) of chemical pairs (C1 and C2) within endpoint groups.
Facilities were assumed to include co-releases of chemicals if the facility released both chemicals within the 6-year period, regardless of which year the release was reported. This assumption was made to consider historical and chronic exposures that can potentially lead to the health effects included.
Magnitude of single- and multiple-chemical releases
To better understand the magnitude of releases for single (e.g., a facility releasing only benzene) and multiple (e.g., a facility that releases benzene, toluene, ethylbenzene, and xylenes) chemical-releasing facilities, the average sum of TRI releases for each TSCA Work Plan chemical from 2017 to 2022 was calculated and compared for each chemical between facilities releasing the singular chemical and facilities that release other chemicals in addition to the chemical of interest. The percent difference between the chemical releases was calculated using Equation (3), where R1 is the average 6-year sum of releases of a chemical from facilities releasing only that chemical, and R2 is the average 6-year sum of releases of the chemical from facilities releasing that chemical and at least one other chemical.
Vulnerability of communities near releases
To integrate considerations of community vulnerability from multiple different stressors into chemical policy decision-making, we combined data on TRI releases of the subject chemicals from 2017 to 2022 with the CVI and Baseline Vulnerability Index of the Census tract in which the chemicals are being released. 25 Census tracts were matched to TRI facilities based on the longitude/latitude data for the facility using the tigris and sf packages in R. 26 This results in the inclusion of only one tract for each facility. Although releases from some TRI facilities can affect communities in multiple neighboring tracts, only one tract for each facility was included to streamline analysis. This resulted in the following numbers of release–tract combinations: 10,659 unique carcinogen releases in 5,164 tracts; 13,260 cardiorespiratory toxicant releases in 5,393 tracts; 10,985 CNS toxicant releases in 5,051 tracts; 8,928 developmental and reproductive toxicant releases in 4,913 tracts; and 11,093 LKT toxicant releases in 5,280 tracts.
The CVI and Baseline Vulnerability Index data for each tract corresponding to each chemical release from TRI were merged to associate the tract’s two different vulnerability indices (overall CVI and Baseline Vulnerability Index) with a specific facility–chemical release combination (Fig. 1). The overall CVI was then compared between chemicals within each endpoint group to determine if certain toxic chemicals are being released more frequently into vulnerable communities.
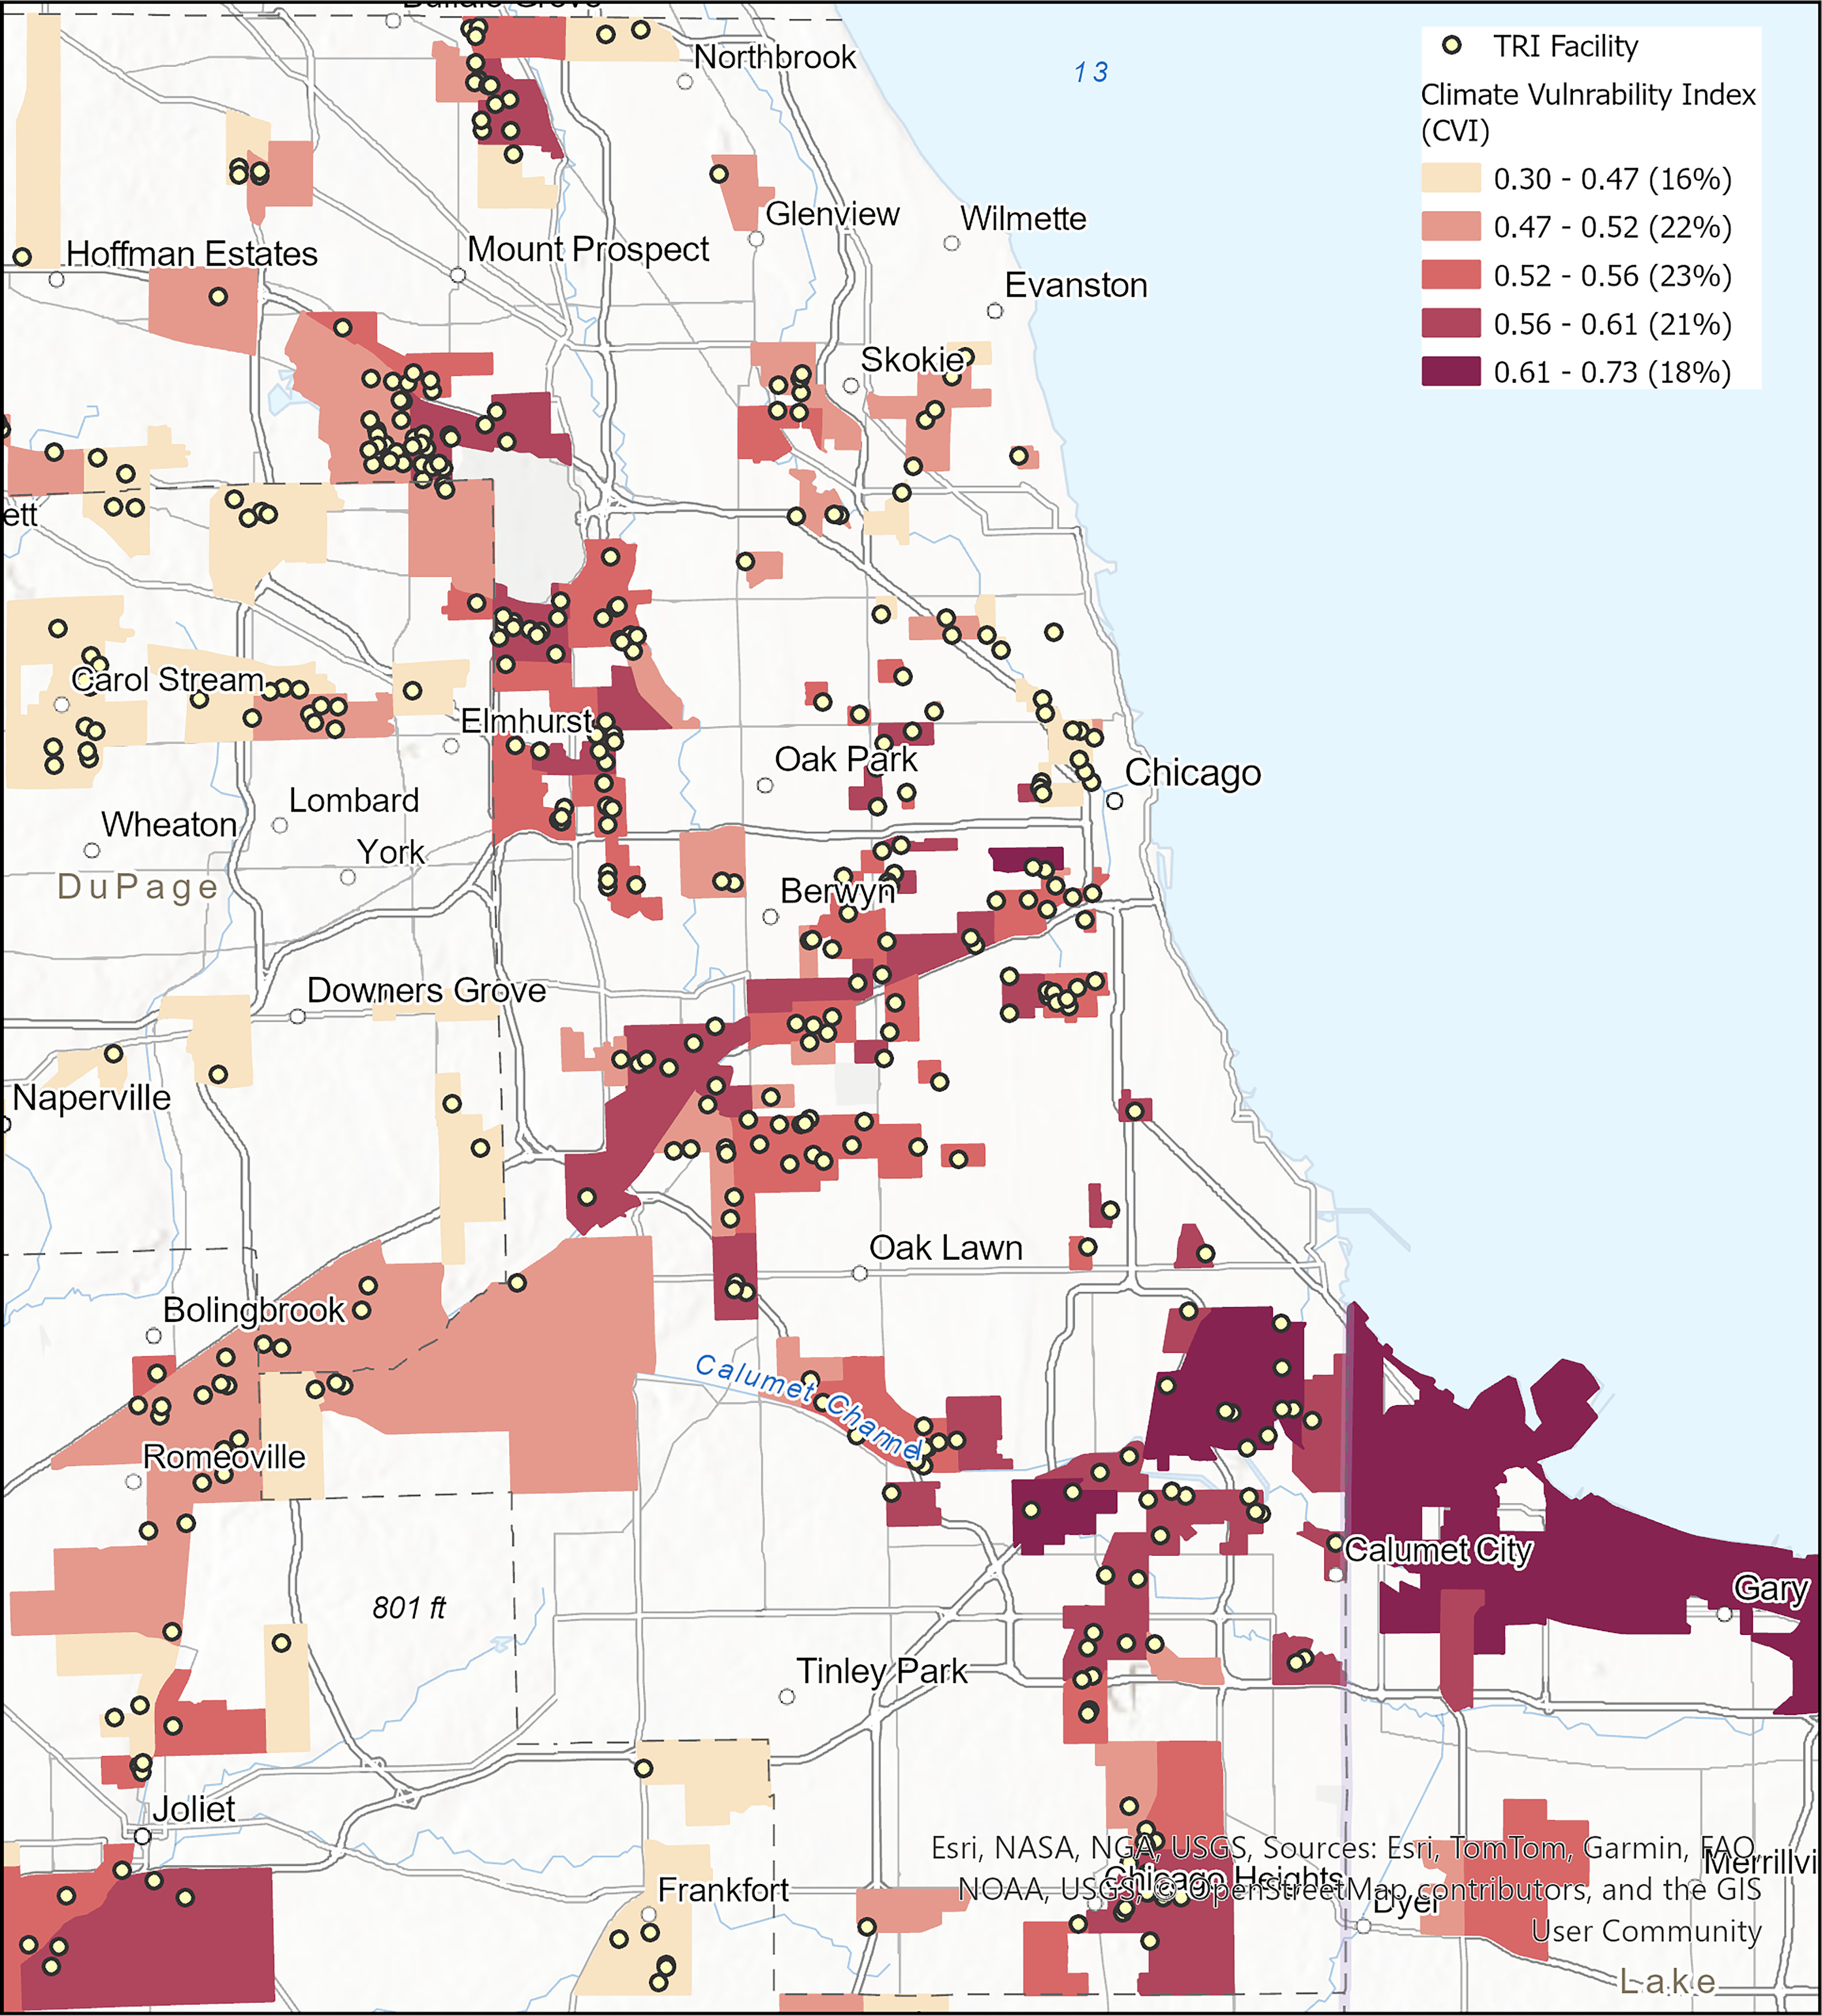
Snapshot of the Climate Vulnerability Index (CVI) of Census tracts with Toxics Release Inventory (TRI) facilities in Chicago, IL, and surrounding cities. Values represent CVI, with the higher number equaling higher vulnerability. Percentages in parentheses are the fraction of TRI facilities in each quantile. For the vulnerability analysis, the CVI of Census tracts was associated with each TRI facility across the United States to compare CVI between chemicals released from TRI facilities.
To understand which toxic chemicals are being released in the highest magnitudes in some of the most vulnerable communities, analysis was performed for the total on-site releases from 2017 to 2022 from TRI facilities located in the top 25% most overburdened Census tracts as defined by the Baseline Vulnerability Index. All releases for each chemical were summed from facilities in these Census tracts to determine which chemicals have the highest sum of releases in these communities.
Statistical analysis
All statistical analyses and visualizations were run using RStudio v. 4.2.3. Multifactor analysis of variance (ANOVA) was used to determine if releases were significantly different between facilities releasing one or multiple chemicals. Releases were log-transformed before running ANOVAs to normalize data. To determine if CVI scores were significantly different depending on endpoint group or chemicals, multifactor ANOVAs with post hoc Tukey’s Honestly Significant Difference (HSD) were performed. Statistical significance was determined with a 95% confidence interval (p < 0.05). The code used for this analysis can be found at https://github.com/bippuspm/CRA_Prioritization.
RESULTS
Chemical co-releases and magnitude
To determine which group of toxic chemicals in the same endpoint group are released together most frequently, the overall number of co-releases—calculated by determining how many chemical releases there are in each endpoint group compared to the number of TRI facilities—was evaluated for each endpoint group. Overall, cardiorespiratory toxicants, or chemicals that adversely impact the cardiological and/or respiratory systems, are released together most frequently, with 68% (7,914 out of 11,706) of the TRI releases of these chemicals being co-releases. Chemicals that cause developmental and/or reproductive harm are released together with other chemicals in the same endpoint group the least frequently, with 28% (2,905 out of 10,426) of their TRI releases being co-releases with other developmental and/or reproductive toxicants. The overall co-release percentage for carcinogens is 42% (4,675 out of 11,005), for CNS toxicants is 52% (5,626 out of 10,750), and for LKT toxicants is 43% (4,992 out of 11,486).
To further determine which Work Plan chemicals in the same endpoint group are typically released together, the percentage of facilities releasing chemical pairs within endpoint groups was calculated (Fig. 2 and Supplementary Excel Tables S2–S6). For example, volatile organic compounds (VOCs) like benzene, ethylbenzene, xylenes, naphthalene, and styrene are released together in pairs between 15% and 72% of the time. These compounds all cause neurological effects, with many causing other shared effects such as cancer, respiratory, developmental, and other systemic effects (Supplementary Excel Table S1). Another VOC, hexachlorobutadiene, is released together with vinyl chloride 36% of the time. Both chemicals cause developmental effects. Metals are another example of groups of chemicals that are commonly released together and cause the same health harms. For example, chromium and nickel are released together 66% of the time, and both cause cancer and respiratory effects. Cobalt, another toxic metal, is released together with arsenic, cadmium, chromium, molybdenum, or nickel anywhere from 11% to 27% of the time. Many of these metals cause the same toxic effects as cobalt, such as cardiological, respiratory, neurological, reproductive, and other systemic effects.
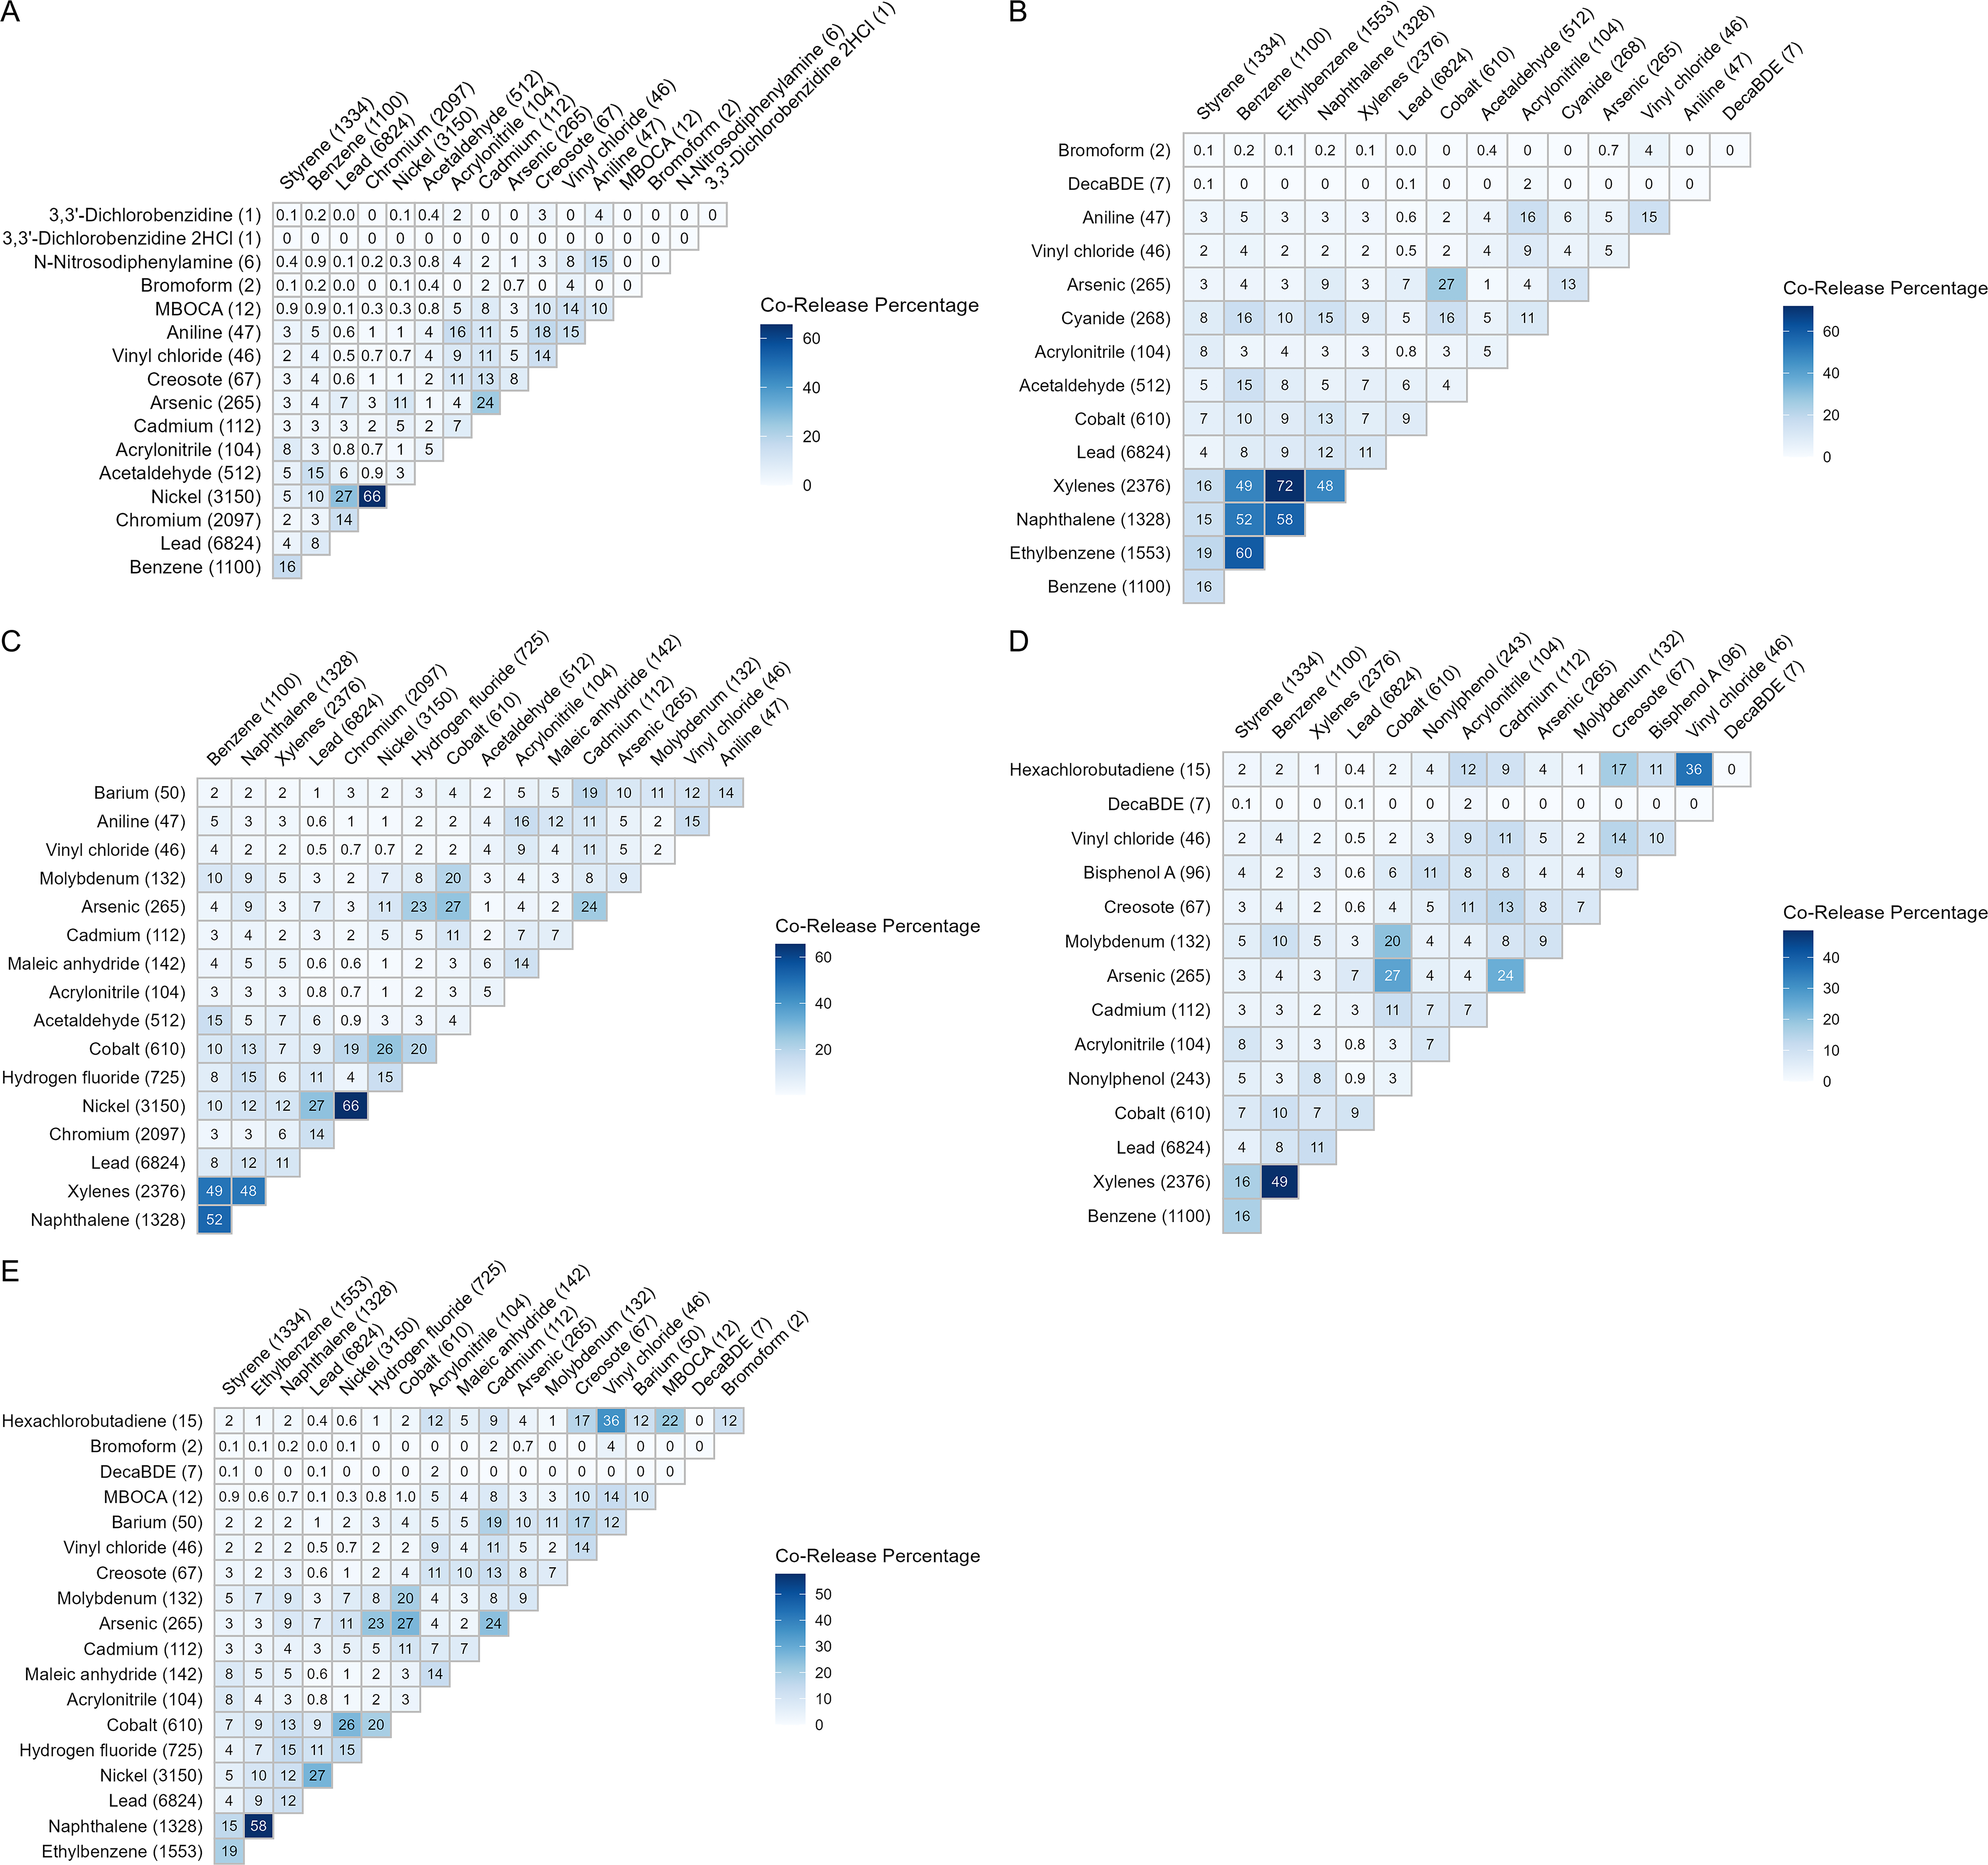
Heatmap of co-releases of
To evaluate the magnitude of co-releases of the TSCA Work Plan chemicals, the average sum of TRI releases for each TSCA Work Plan chemical was calculated and compared for each chemical between facilities releasing only the singular chemical and facilities that release other chemicals in addition to the chemical of interest (Supplementary Table S1). Facilities releasing two or more TSCA Work Plan chemicals were found to release significantly higher amounts of the same chemicals than facilities that release only one chemical (p < 0.0001). On average, facilities releasing a single chemical released a 2017–2022 sum of 33,102 lbs. of a single chemical, whereas facilities releasing two or more chemicals released an average sum of 319,809 lbs. of a single chemical.
Community vulnerability near releases
The CVI of Census tracts with TRI facilities releasing chemicals in each endpoint group were compared to determine if toxic chemicals potentially contributing to these health effects are being released in more vulnerable communities (Table 1). The CVI of communities near CNS and developmental and/or reproductive chemical-releasing facilities was highest and was significantly greater than the CVI of communities near carcinogen- and cardiorespiratory-releasing facilities (p < 0.01, Supplementary Table S2). The CVI of tracts near carcinogen-releasing facilities was the lowest on average and was significantly lower than CNS; developmental and/or reproductive; and liver, kidney, and/or thyroid chemical-releasing facilities (p < 0.05, Supplementary Table S2). However, overall, the CVI of tracts with TRI facilities releasing all chemicals in this analysis are on average higher than tracts without facilities present.
Median Climate Vulnerability Index (CVI) Score and Summary Statistics of Census Tracts Where Chemicals in Each Endpoint Group Are Released
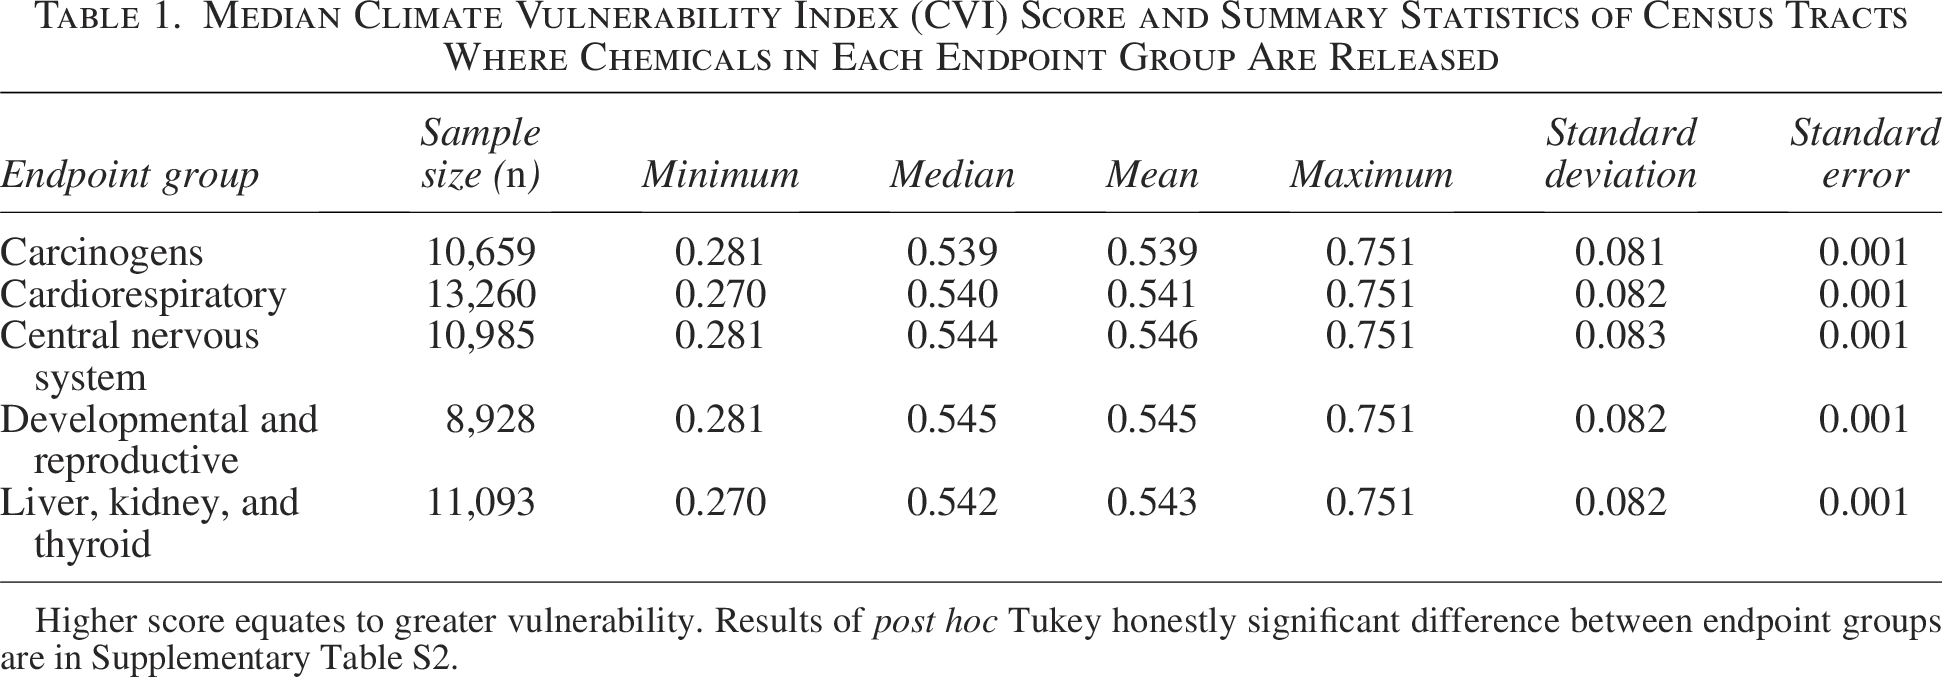
Higher score equates to greater vulnerability. Results of post hoc Tukey honestly significant difference between endpoint groups are in Supplementary Table S2.
The CVI of Census tracts of individual chemical TRI releases was also compared between chemicals within the same health endpoint groups to understand the potential differences in community vulnerability to different toxic chemical releases (Fig. 3 and Supplementary Table S3). This analysis highlights a few notable patterns. First, vinyl chloride is released, on average, into communities with higher vulnerability than other chemicals analyzed. For example, the CVI of communities near vinyl chloride-releasing facilities is 8%–10% higher than the average for other carcinogenic chemicals, liver, kidney, and/or thyroid; developmental and/or reproductive; and CNS toxicants. Other toxic chemicals that are released into more highly vulnerable communities than average, among others in this analysis, are acrylonitrile, aniline, maleic anhydride, creosote, and hexachlorobutadiene. Most strikingly, communities near hexachlorobutadiene-releasing facilities have 15%–16% higher CVI than communities near other liver, kidney, and/or thyroid and developmental and/or reproductive chemical-releasing facilities.
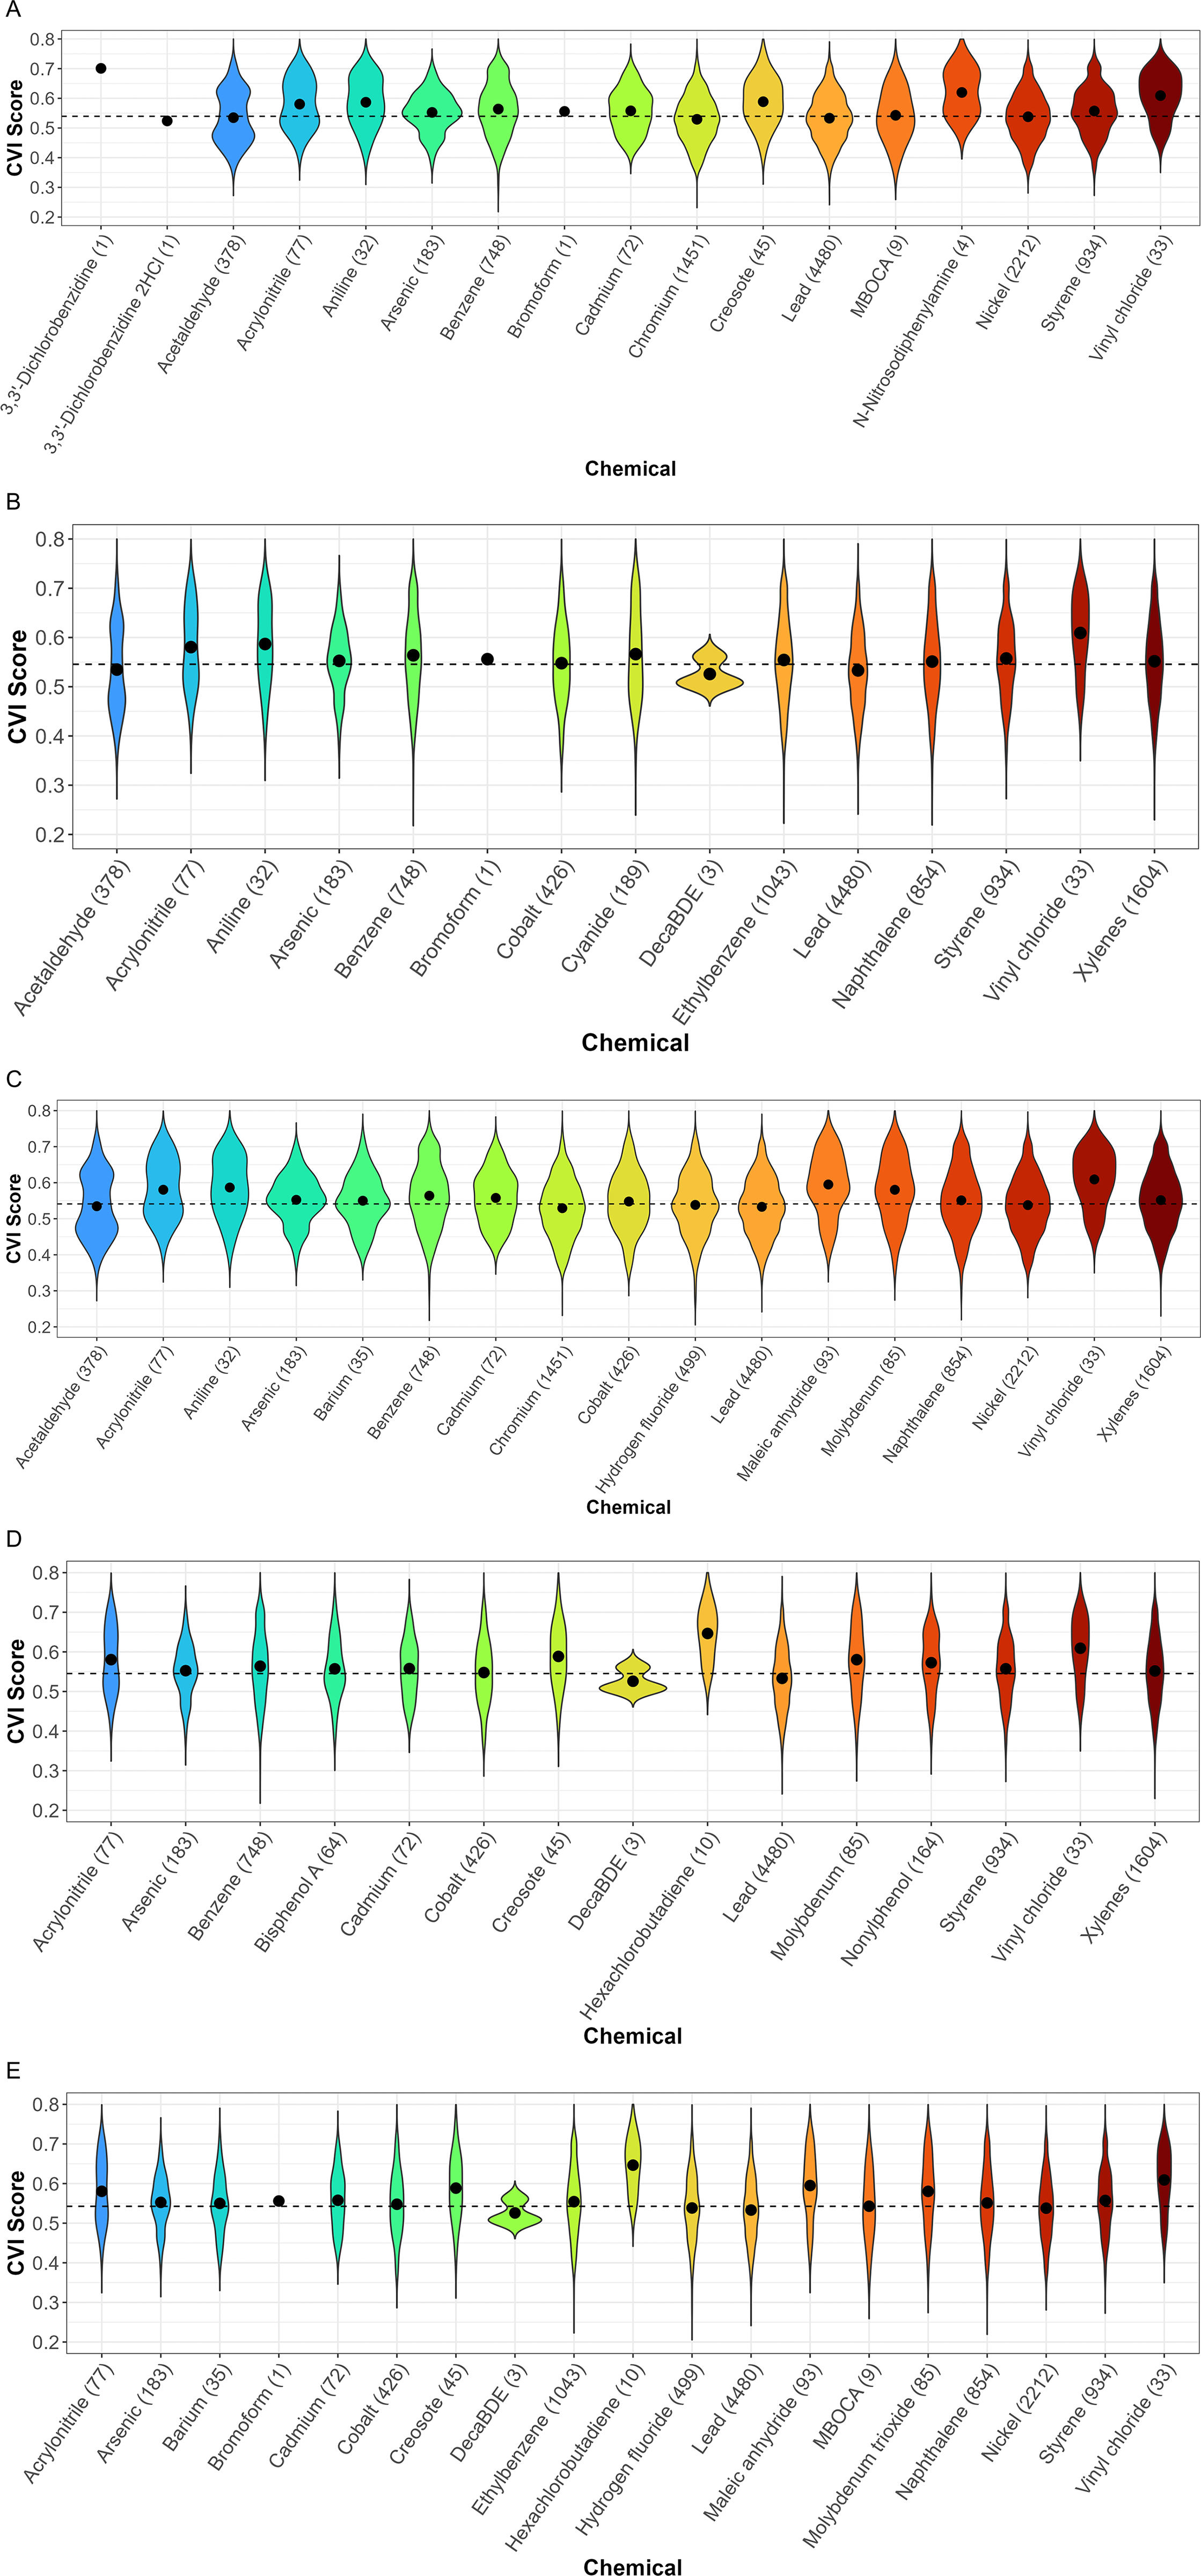
Average CVI score of Census tracts where
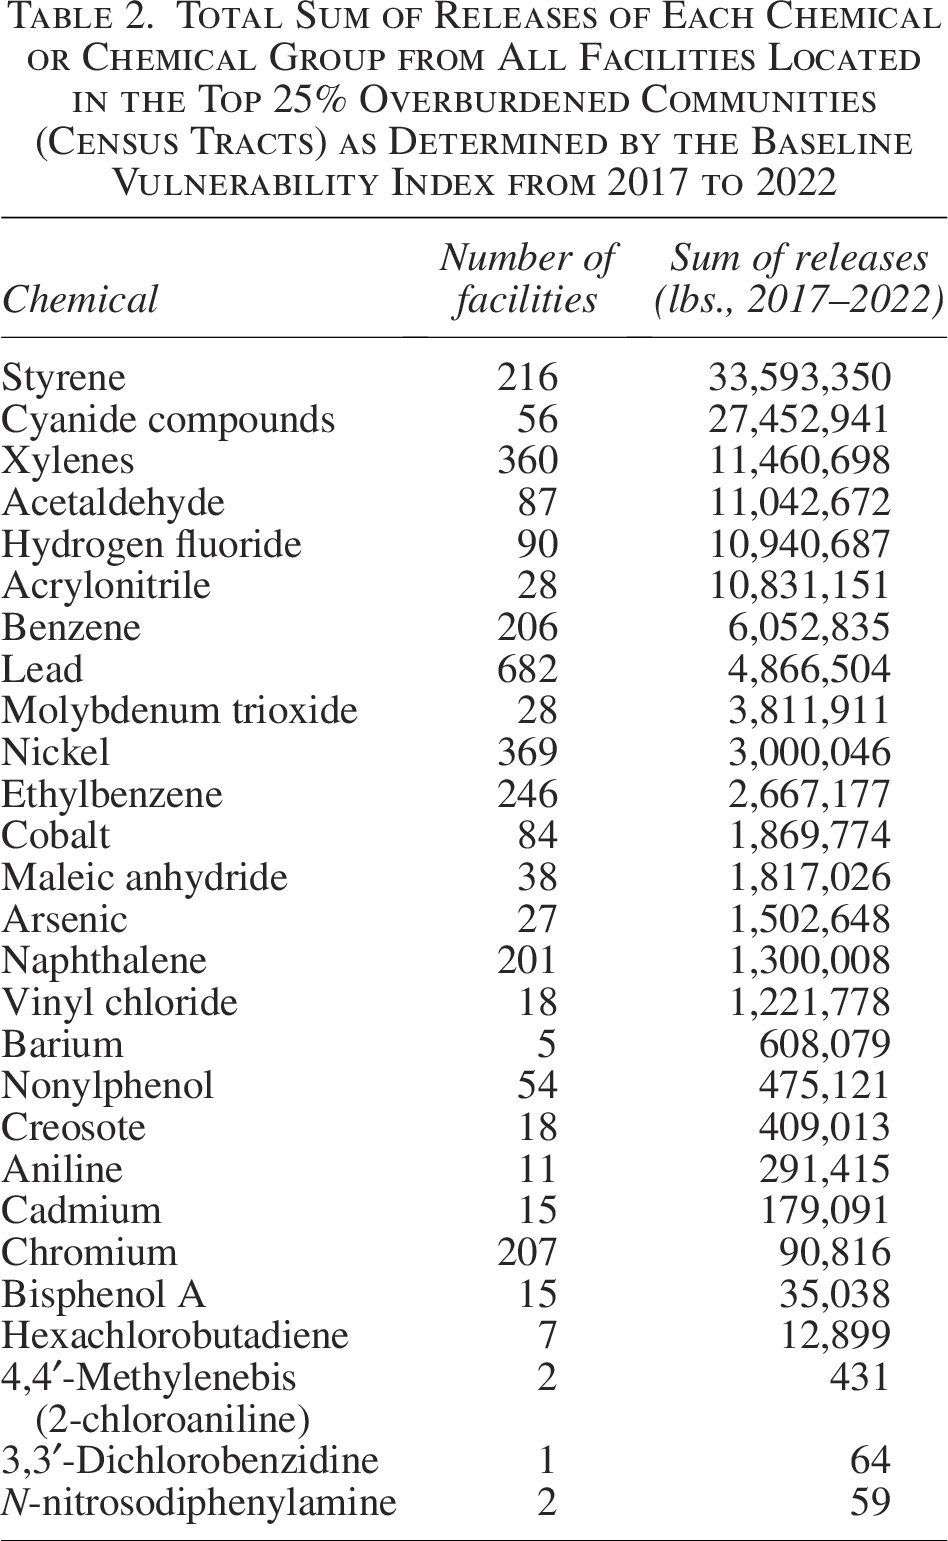
Analyses were also conducted looking at the total on-site releases from 2017 to 2022 from TRI facilities located in the top 25% most overburdened communities as defined by the Baseline Vulnerability Index from CVI (Supplementary Excel Supplementary Table S7). The chemical with the highest amount released in the top 25% of overburdened Census tracts is styrene, with the total releases of all facilities located in these census tracts from 2017 to 2022 equaling over 33 million pounds of styrene (Table 2). When looking at releases from individual facilities for each chemical, results show that acrylonitrile, cyanide, hydrogen fluoride, and styrene are the chemicals released from the top 10 highest releases from individual facilities (Supplementary Excel Supplementary Table S7). The largest sum of releases of a chemical from one facility is from a facility in Brazoria, TX, that released a total sum of over 10 million pounds of acrylonitrile from 2017 to 2022, mostly via injection into Class I wells. This facility in particular produces acrylonitrile, which is then used as the base for their production of nylon. 27
Total Sum of Releases of Each Chemical or Chemical Group from All Facilities Located in the Top 25% Overburdened Communities (Census Tracts) as Determined by the Baseline Vulnerability Index from 2017 to 2022
DISCUSSION
This study provides methodology for identifying toxic chemicals that are co-released in vulnerable communities that can aid decision-makers in prioritizing chemicals for assessment, scoping risk assessments, and identifying opportunities for co-beneficial regulations. Further, the results from this analysis, which includes some of the most toxic chemicals that have the potential to undergo assessment and regulation under TSCA, illuminate important co-releases and releases into vulnerable communities.
First, high co-releases, up to 72%, were found for groups of chemicals such as specific VOCs and metals that cause the same health effects. These co-exposures and shared health effects should be considered by regulators and policymakers when making decisions on which chemicals to prioritize and assess and which chemicals should be considered in a cumulative risk assessment. For example, when regulatory agencies consider air quality and health impacts that may result from newly permitted facilities, such as is required from the Public Protections from Toxic Air Contaminants bill in Colorado, 28 these methods can be used to identify which priority air toxics should be considered for regulatory purposes. By prioritizing chemicals that are frequently co-released with other chemicals that impact the same systems in the body, emissions control regulations may offer even greater health protection and co-benefits to public health, even when one chemical is prioritized.
Further, understanding and prioritizing toxic chemicals that could contribute to cumulative health risks includes characterizing the magnitude of releases as well as the frequency. We found that facilities releasing two or more TSCA Work Plan chemicals released significantly higher amounts of the same chemicals from 2017 to 2022 than facilities that release only one chemical—over 285,000 pounds more on average. It is possible that facilities using and releasing only one chemical are smaller and/or have a smaller scope of operation that requires the use of only one chemical. This could potentially be assessed using CDR data, though much of this data are unavailable to the public. 29 It is clear from this analysis, however, that facilities that are releasing multiple toxic chemicals are also releasing a larger amount of these chemicals compared to facilities releasing only one toxic chemical. Therefore, communities living at the fenceline of these industries are likely to experience increased health effects from both the level of exposure to single chemicals as well as the exacerbation of health effects from exposure to multiple chemicals, causing similar effects.
It is also important to consider existing environmental injustice and community vulnerability to adverse health effects when making policy, assessment, and regulatory decisions. Therefore, we investigated the vulnerability of communities where TSCA Workplan chemicals are released using the CVI. 30 The CVI is an example of a composite index-based approach to assessing cumulative impacts, as highlighted in the NASEM State of the Science and the Future of Cumulative Impact Assessment report. 31 This analysis found that toxic chemicals such as vinyl chloride, hexachlorobutadiene, acrylonitrile, aniline, maleic anhydride, and creosote are released into communities with the highest overall CVI. Further, many of these chemicals share common health effects and have notable co-releases. For example, creosote is released with vinyl chloride and hexachlorobutadiene in 14% and 17% of releases, respectively, and vinyl chloride and hexachlorobutadiene are released together in 36% of releases. In some of the Census tracts that have the highest CVI, such as communities in Jefferson and Orange Counties in Texas and in Orleans and St. John the Baptist Parishes in Louisiana, the main drivers of vulnerability are infrastructure (essential structures, services, and resources that affect community resilience) and health (factors reflecting the baseline or overall state of population health). Particularly in communities where vinyl chloride and hexachlorobutadiene are released, infrastructure and health are also common drivers of vulnerability, as well as the social and economic costs and impacts associated with a change in climate. 32 These common disparities in chemical releases and nonchemical stressors that adversely affect health are likely due to the nature of historically racialized practices that have favored the permitting of toxic industries in communities of color. 33
In addition to the frequency of releases of toxic chemicals in vulnerable communities, we investigated the magnitude of chemical releases in the most vulnerable communities. These results indicate that toxic chemicals such as styrene, acetaldehyde, and cyanide are released in the highest amounts in the top 25% of Census tracts based on their baseline health vulnerability. Facilities specifically releasing styrene are typically listed under the industry sector “Plastics and Rubber” in TRI, as styrene is primarily used in the production of polystyrene plastics and resins as well as other polymer materials such as rubber. 34 Further, styrene is a probable carcinogen and contributes to CNS, developmental, and liver effects. This information can be used to prioritize chemicals for assessment and regulation to mitigate disparate health impacts from toxic chemical exposures to the most vulnerable communities in the United States. These results—comparing a community vulnerability metric and magnitude of releases between communities near TRI facilities—do not highlight the differences in community vulnerability between these communities and those without TRI facilities nearby. However, it is well documented that there are racial, socioeconomic, health, and climate disparities in residential proximity to industrial pollution. 35 These methods go beyond identifying disparities between communities with and without facilities but rather are intended to more deeply understand where communities are experiencing overlapping co-exposures, how intense these exposures are, and what other disparate nonchemical stressors are present in order to inform subsequent assessments. Moving forward, it is imperative to identify and prioritize real-world cumulative exposures and consider overlapping burdens to address these disproportionate impacts that continue to exist nationwide.
Screening analyses like the methods presented here can provide decision-makers with meaningful information about the existing level of burden a community faces prior to the permitting or modification of new or existing sources of pollution. Particularly, this approach utilizes multiple cumulative risk and impact approaches, including composite index and toxicological-based methods as presented in the NASEM report, in a fit-for-purpose manner to aid in decision-making. 36 In turn, agencies can reduce inefficiencies and create more real-world, equitable processes and decision-making to reduce the cumulative exposures in vulnerable communities. The methodology and results from this analysis could be used widely across U.S. policy at federal, state, and local levels. Particularly, these methods can be used to prioritize chemicals for assessment and regulation, understand co-benefits of actions, and scope out assessments of cumulative risk. For example, results from this study could be used in the TSCA’s pre-prioritization and prioritization processes, which are used to decide which chemicals will be up for assessment and regulation and whether those chemicals are of high or low priority. Co-exposure and community vulnerability considerations can also be integrated into TSCA’s risk management to inform what regulatory activities could result in co-benefits to multiple chemicals and to prioritize regulations that most benefit overburdened communities.
Further, these results can be used to inform the state-level chemical prioritization and regulation. For example, identifying co-exposures and releases in vulnerable communities that result in increased adverse health effects with this methodology equips states like Colorado, which sets health-based standards for select PTACs, to manage and regulate chemicals efficiently and with co-benefits to community health.
This study goes beyond typical considerations for chemical prioritization and risk assessment; however, there are a few limitations. First, although TRI data are comprehensive and publicly available, they contain limited-sector coverage, are self-reported by industrial facilities, and potentially underestimate chemical releases. The use of other publicly available data such as NEI and Ambient Monitoring Technology Information Center (AMTIC) data could aid in filling sector and data gaps of TRI, though these sources contain similar limitations. Additionally, this methodology fails to consider co-exposures from multiple neighboring facilities and rather only looks at exposures from single facilities. Particularly in highly industrialized areas, many facilities are often geographically clustered and can contribute to aggregate exposures of multiple toxic chemicals in nearby communities. Much of this spatial clustering of toxic chemical burdens and the associated health disparities has occurred directly because of historical racial practices, such as redlining. 37 In future analyses and chemical prioritization, consideration of co-exposures from multiple facilities and other sources of chemical exposures should be taken into account.
CONCLUSION
Our results show that there are significant levels of co-exposures to many toxic chemicals that cause similar toxic cancer and noncancer effects, such as VOCs and metals, and which of these chemicals are released in overburdened communities. These exposures occur not only in high frequencies but also in high magnitudes. Therefore, living near facilities releasing multiple toxic chemicals is not the only risk communities face—they also face higher levels of exposures from these facilities due to greater releases. Additionally, this analysis helps identify which chemicals are released most frequently and in the highest amounts in the most overburdened communities. However, this study does not take into account the chemical exposures from multiple sources and multiple routes of exposure. Further studies or subsequent analyses should integrate considerations of all exposure routes and pathways. Overall, considering these co-exposures and community vulnerability is one of the first steps in conducting a quantitative cumulative risk assessment and potentially a cumulative impacts assessment. 38 These considerations are necessary to address environmental injustices exacerbated by the release of multiple toxic chemicals into already overburdened communities.
Footnotes
ACKNOWLEDGMENTS
The authors extend their gratitude to Maria Doa for advising on TSCA and application of this work to policy.
AUTHORS’ CONTRIBUTIONS
P.M.V.: Conceptualization, formal analysis (lead), methodology, visualization (lead), writing—original draft (lead), and writing—review and editing (lead). G.T.B.: Formal analysis (supporting), visualization (supporting), and writing—review and editing (supporting). M.L.W.: Supervision, writing—original draft (supporting), and writing—review and editing (supporting).
ETHICAL APPROVAL
This research did not involve human subjects, and the institutional review board approval was not required.
DATA AVAILABILITY STATEMENT
The datasets used and/or analyzed during the current study are publicly available datasets gathered from EPA’s TRI, https://www.epa.gov/toxics-release-inventory-tri-program/tri-basic-data-files-calendar-years-1987-present, and the CVI, ![]() .
.
AUTHOR DISCLOSURE STATEMENT
The authors declare that they have no competing interests.
FUNDING INFORMATION
This research was supported by a grant from the Catena Foundation. The funders had no role in study design, data collection and analysis, the decision to publish, or the preparation of the article.
Supplemental Material
Supplemental Material
Supplementary Material
Please find the following supplemental material available below.
For Open Access articles published under a Creative Commons License, all supplemental material carries the same license as the article it is associated with.
For non-Open Access articles published, all supplemental material carries a non-exclusive license, and permission requests for re-use of supplemental material or any part of supplemental material shall be sent directly to the copyright owner as specified in the copyright notice associated with the article.