
Abstract
This article discusses matrix approaches for cumulative impact assessments in decision-making. Matrix approaches are described and contrasted with the more traditional, single-scoring methods, such as CalEnviroScreen and the Centers for Disease Control and Prevention's Environmental Justice Index. In doing so, the explicit advantages of matrix approaches are highlighted. In addition, this article explains how new generation tools, such as the the White House Council on Environmental Quality’s Climate and Economic Justice Screening Tool and New Jersey’s Environmental Justice Mapping, Assessment, and Protection tool are examples of matrix approaches and how these tools can be expanded beyond their current uses in order to address other decision-making contexts where cumulative impacts are a concern.
Keywords
INTRODUCTION
This article explains what matrix approaches are and discusses their feasibility and advantages for decision-making that takes into account cumulative environmental burdens.1,2 In doing so, matrix approaches are contrasted with the more traditional single-scoring methods, the most prominent of which are CalEnviroScreen 3 and the Centers for Disease Control and Prevention's (CDC) Environmental Justice Index (EJI), 4 which are further discussed by Ranjbar et al. 5 in this special issue. Whether single-scoring or matrix-based, tools that lead to a decision, such as CalEnviroScreen and the White House Council on Environmental Quality’s (CEQ) Climate and Economic Justice Screening Tool (CEJST), 6 are typically “binary” in that they distinguish communities that are “disadvantaged” from those that are “not disadvantaged” so that actions can be taken to address the disparities. Nonbinary tools, such as the U.S. Environmental Protection Agency’s (EPA) EJScreen 7 and the CDC’s EJI, assess communities for their relative disadvantage along a continuum and are primarily evaluative and informational rather than decision-focused. 8
Briefly, single-scoring methods, such as CalEnviroScreen and the CDC’s EJI, combine the values of a wide array of environmental burden and social vulnerability characteristics, typically measured in diverse units, into a single score. These scores are then used to compare and rank communities for their relative “disadvantage.” In contrast to single scoring, matrix approaches keep indicator values separate and independent from each other to compare and rank communities. These values can be presented in a two-dimensional table or matrix, for example, with environmental indicator values represented as rows and social vulnerability indicator values represented as columns. Criteria and thresholds for those values can then be set to identify “disadvantaged” communities and to inform regulatory or nonregulatory decisions.
Although not recognized as such at the time of their creation, it is demonstrated in this article that CEQ’s CEJST 9 and New Jersey’s Environmental Justice Mapping, Assessment, and Protection (EJMAP) 10 tool are both examples of matrix approaches. Furthermore, the advantages of matrix approaches are discussed. How such tools could be expanded to address a broad array of decision-making contexts where cumulative environmental burdens and impacts are involved is also discussed. The ultimate goal of this article is to expand the available toolkit for conducting cumulative impact assessments in regulatory and nonregulatory decision-making.
SINGLE SCORING METHODS
As mentioned, single scoring methods involve combining the values of diverse geographic indicators that measure environmental burdens and social vulnerability into a single score. Because of their varying units, these indicators are often first standardized by converting the raw indicator values into percentiles. Typically, the geographic units involved are census tracts, but these can also be applied to other geographic units, such as census block groups and zip code areas. Prominent examples of single scoring methods include CalEnviroScreen and the CDC's EJI.
CalEnviroScreen 1.0 11 was first released in April 2013, making it the oldest and perhaps best known of all existing EJ screening and cumulative impact assessment tools. Since its release, it has served as a model for a number of state-level, and even city-level, tools around the nation, including HGBEnviroScreen, 12 Chicago EJ Index, 13 MiEJScreen, 14 MDEnviroScreen, 15 Texas EJ Explorer, 16 Washington Environmental Health Disparities Map, 17 and others.18,19 CalEnviroScreen has been updated several times since its inception, with its fourth and most recent version, CalEnviroScreen 4.0, 20 released in October 2021. Figure 1 below, taken from the CalEnviroScreen 4.0 technical documentation, displays the 13 Pollution Burden and eight Population Characteristics indicators currently included in CalEnviroScreen. These 21 indicators are grouped into four components: (a) exposures, (b) environmental effects, (c) sensitive populations, and (d) socioeconomic factors. The values of each of the indicators are standardized into percentiles and these percentiles are then averaged within each of the four components. Resulting Exposures and Environmental Effects scores are then averaged into a Pollution Burden score (with the Environmental Effects score given half the weight of the Environmental Exposures score), while Sensitive Populations and Socioeconomic Factors are averaged into a Population Characteristics score. The Pollution Burden and Population Characteristics scores are then scaled and multiplied together to arrive at a final single “CalEnviroScreen” score for each tract that ranges up to 100. A tract whose CalEnviroScreen score reaches the 75th percentile or higher is identified as a “disadvantaged community” and prioritized for special funding.
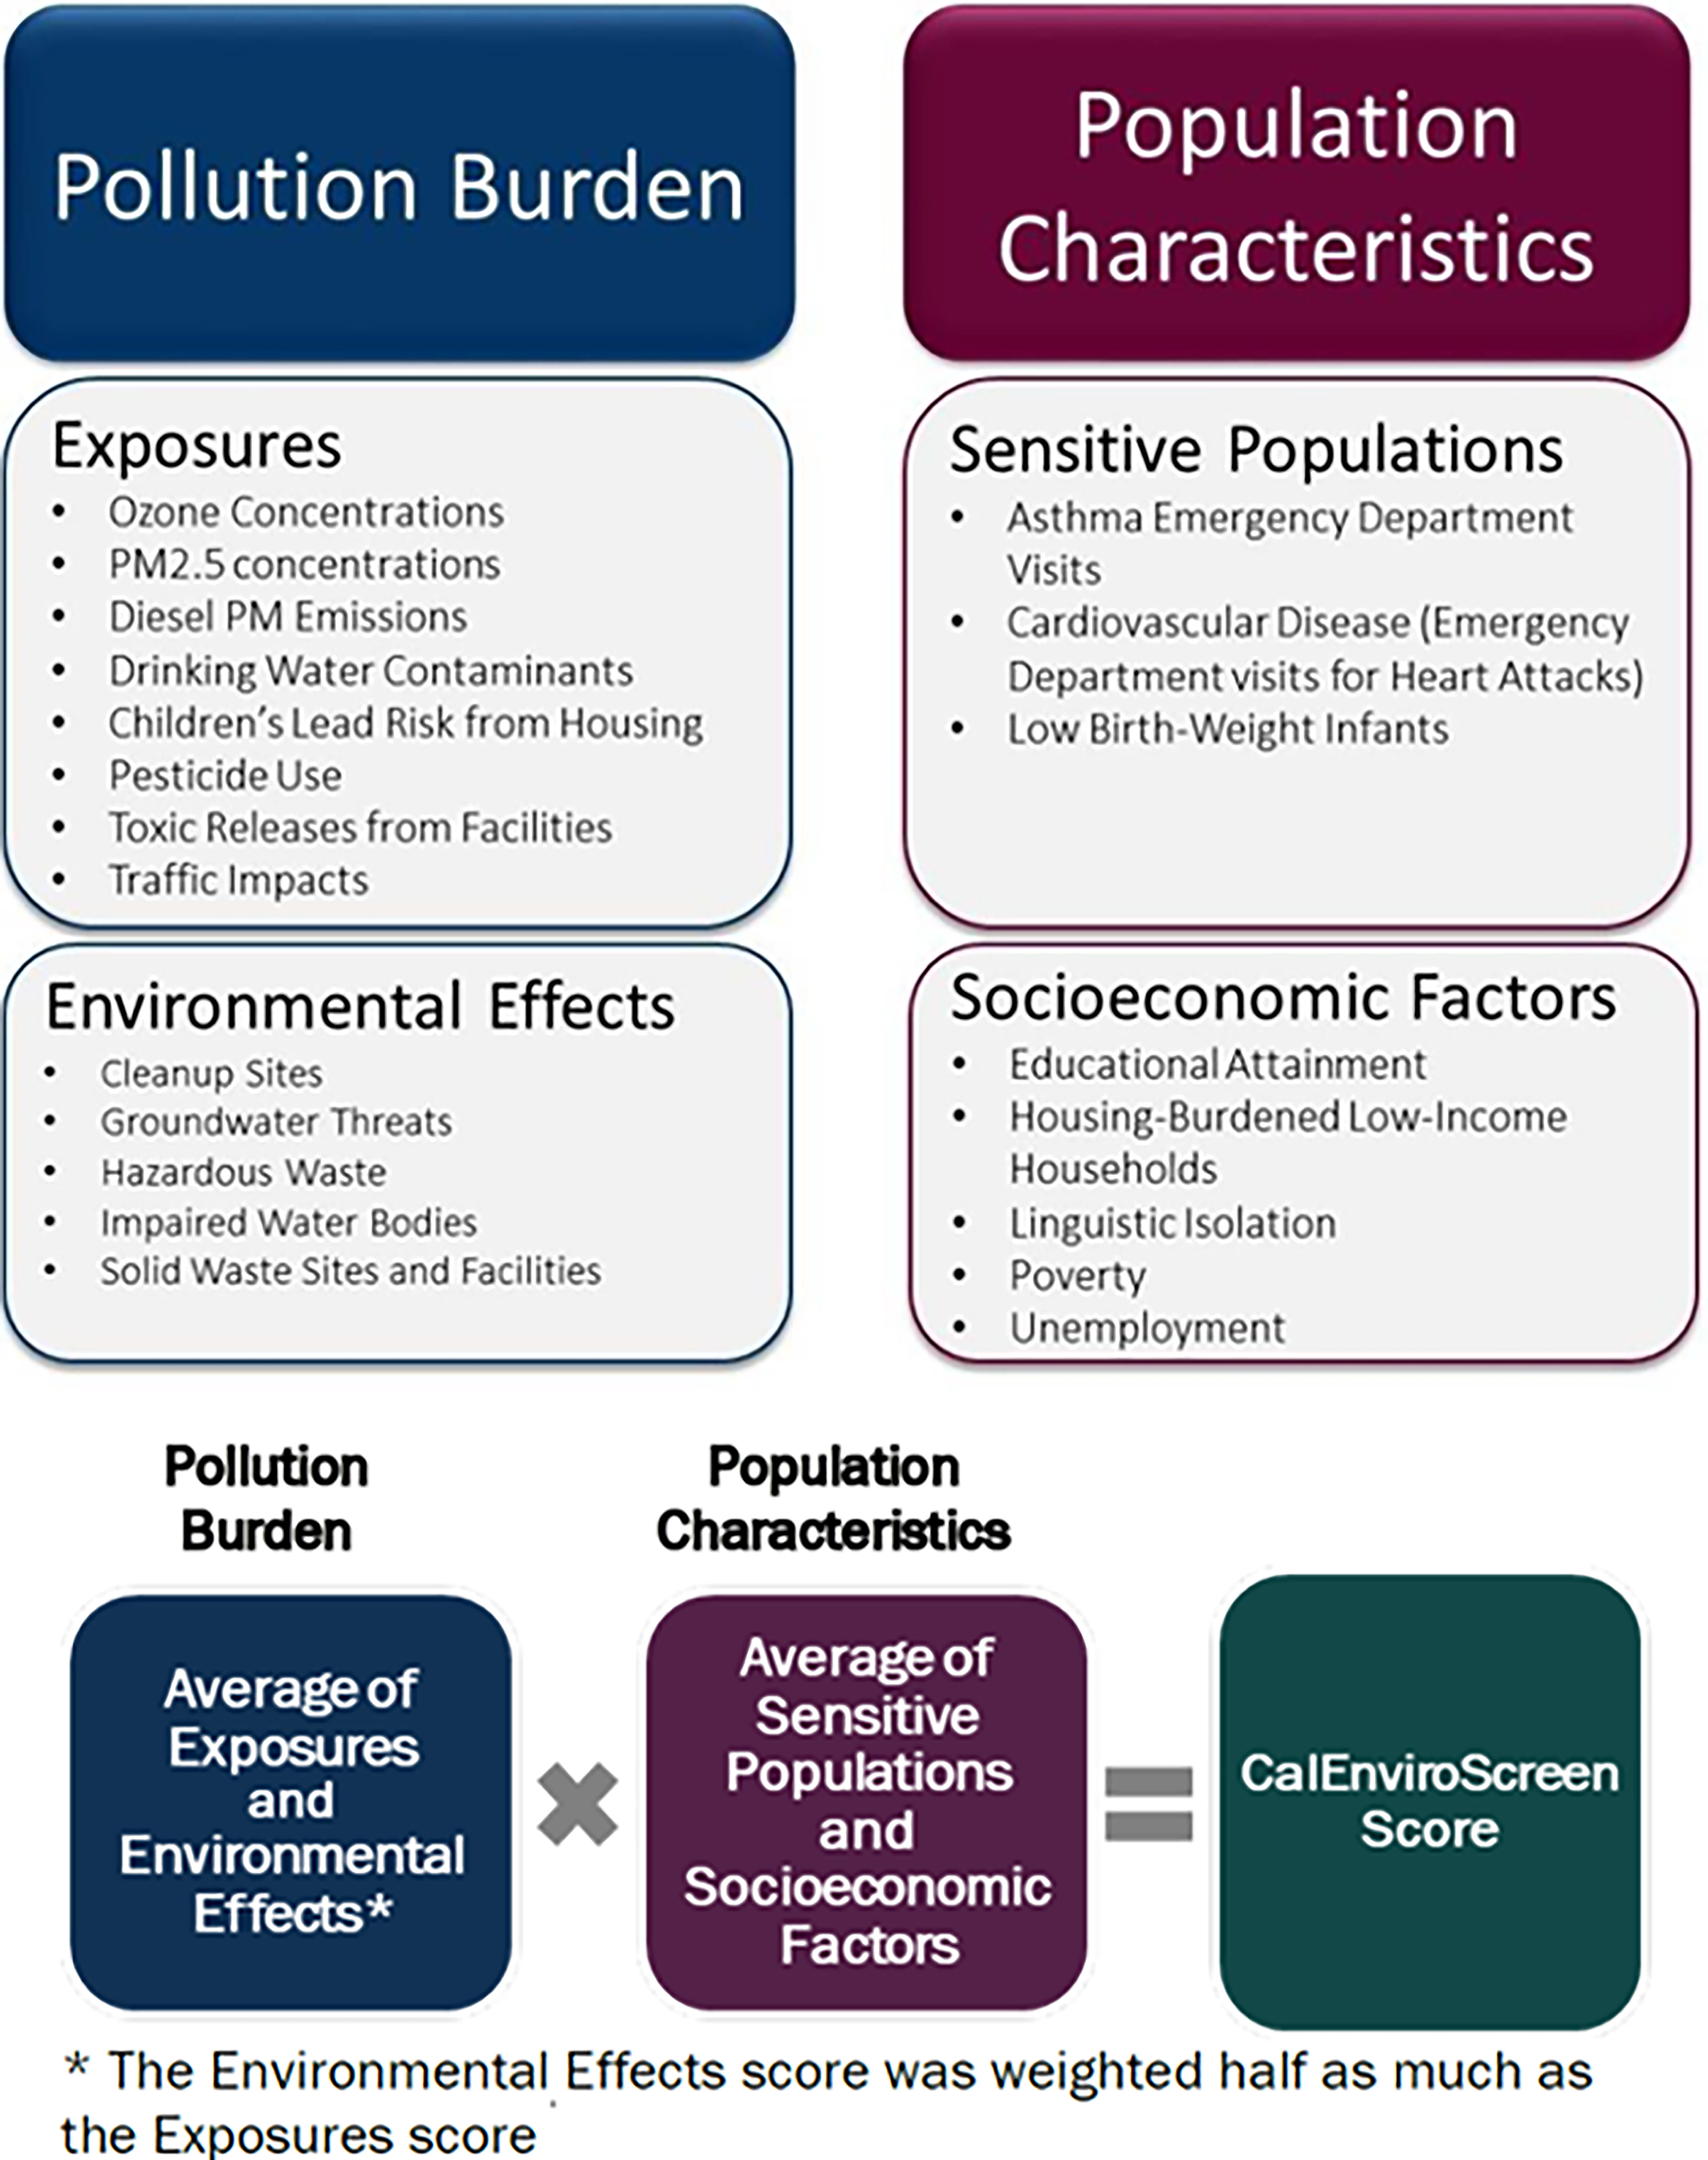
Formula for producing CalEnviroScreen scores for California Census Tracts. Above figures are from Pages 12 and 21 in CalEnviroScreen 4.0 technical guidance document. https://oehha.ca.gov/media/downloads/calenviroscreen/report/calenviroscreen40reportf2021.pdf.
Released in August 2022, the CDC's EJI 21 serves as CDC’s national-level EJ screening and cumulative impact assessment tool. Employing 36 indicators, the EJI uses a similar approach to CalEnviroScreen in scoring census tracts for their relative disadvantage. However, there are also some differences. For example, in contrast with CalEnviroScreen, the scores of the EJI’s three principal components (Environmental Burden, Social Vulnerability, and Health Vulnerability) are added rather than multiplied. Furthermore, although the resulting EJI scores can be used to compare and rank census tracts nationally for their relative disadvantage, the CDC does not provide a single threshold, as does California, to identify a “disadvantaged” category of communities. Further details about CalenviroScreen and the EJI can be found in their technical documentation. 22
MATRIX APPROACHES
As mentioned above, rather than combining all indicator values into a single score, matrix approaches keep environmental burdens and social vulnerability characteristics distinct and explicit and evaluate them independently from each other in order to compare and rank communities for their relative “disadvantage.” These rankings can be presented in a two-dimensional table consisting of rows and columns. Matrix approaches for conducting cumulative impact assessments were suggested as early as 2004 in a report by the National Environmental Justice Advisory Council (NEJAC) to the U.S. EPA. 23 They were also considered in 2013 by the California Environmental Protection Agency (Cal EPA) in its early development of CalEnviroScreen. 24 Most recently, a report submitted by Mohai et al. to the U.S. EPA in May/June 2022 entitled Advancing EJScreen 25 also recommended the consideration of matrix approaches.
In their 2022 report, Mohai et al. provide a conceptual model for such an approach. In the model (see Fig. 2 below), all individual environmental burden and social vulnerability indicators are made explicit and tracked separately rather than combined into a single score. In this model, minimum thresholds for the environmental burden indicators and the social vulnerability indicators can be set independently from each other, and the number of instances where the thresholds are met can be counted. These counts form the basis of measuring cumulative impacts.
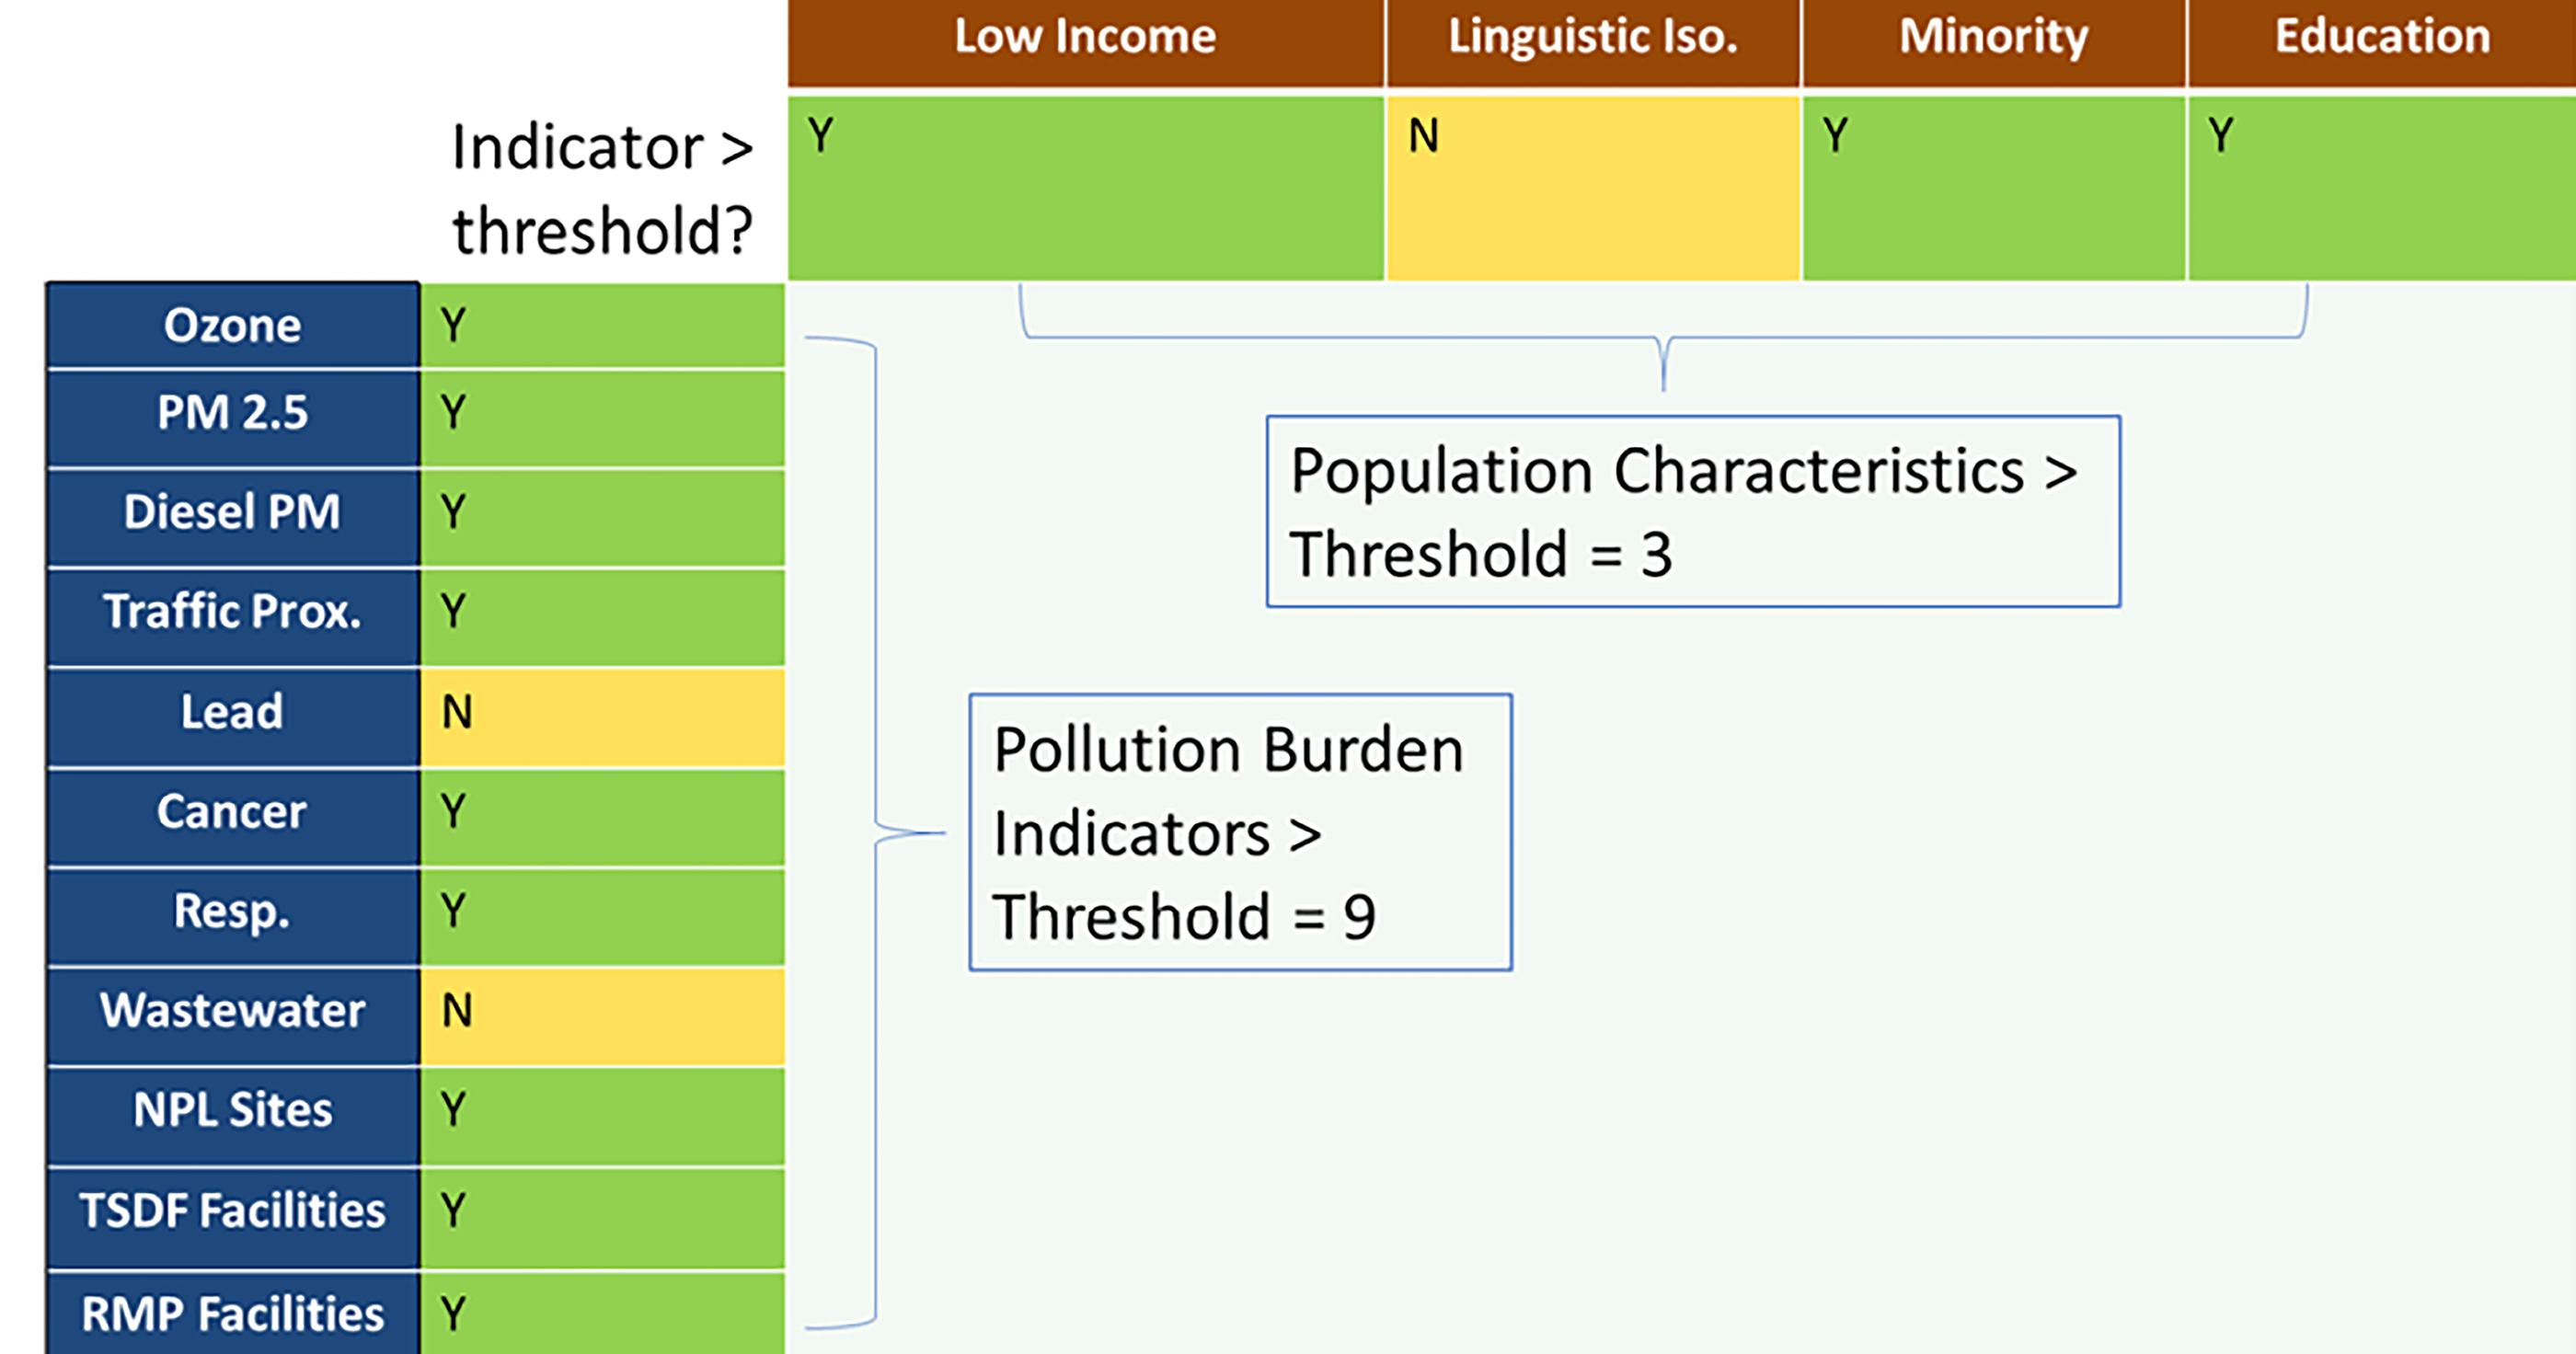
Illustration of matrix model organization of individual EJScreen Indicators within environmental burden and social vulnerability categories. Illustration is from Exhibit 13 of “Memorandum: Review of Cumulative Scoring Methods Using EJScreen Data” in Advancing EJ Screen (Mohai et al., 2022). https://sab.epa.gov/ords/sab/f?p=100:0:9589289648267:APPLICATION_PROCESS=MEETING_FILE:::MM_ID:6234.
As mentioned, two tools emerged in 2022 that exhibit many of the key features of matrix models and approaches. These include the CEQ’s CEJST, 26 released November 2022, and New Jersey’s EJMAP 27 tool, released June 2022. 28 At the time of their creation, neither CEJST nor EJMAP were referred to or recognized as matrix approaches. The key features of CEJST and EJMAP are highlighted and explained below. It is argued here that both CEJST and EJMAP represent the first national-level and state-level decision-making tools to employ matrix approaches and provide models that can be built upon and expanded to address a broad array of decision-making contexts where cumulative impacts are involved.
CEQ’S CEJST
Although CEQ’s CEJST was discontinued with the change in administrations in 2025, 29 CEJST provides the first example of a national-level decision-making tool applying a matrix approach. CEJST was created to implement President Biden’s Justice40 Initiative contained in Executive Order 14008 (Tackling the Climate Crisis at Home and Abroad). The Justice40 Initiative was intended to deliver 40% of overall benefits of federal government investments to “disadvantaged” communities in the areas of “clean energy and energy efficiency; clean transit; affordable and sustainable housing; training and workforce development; the remediation and reduction of legacy pollution; and the development of critical clean water infrastructure.” CEJST was used to identify which census tracts in the United States are” disadvantaged” and should receive the benefits of these investments. Although CEJST was not originally intended to assess cumulative impacts, it is argued that CEJST had the key features of a matrix model that could be readily adapted for cumulative impact assessments.
First, as a brief description, CEJST included 30 criteria to determine whether census tracts are “disadvantaged.” In most cases, a criterion was met if one of the “environmental, climate, or other burden” indicator values reached the 90th percentile and the principal socioeconomic indicator, low-income, reached the 65th. For three burden indicators (historical underinvestment, presence of abandoned mine lands, and presence of formerly used defense sites), the threshold was a “yes” versus “no.” Note that only one of the 30 criteria needed to be met for a tract to be identified as “disadvantaged.” The CEJST technical support document provides more details. 30
Although CEJST did not take into account cumulative burdens, its decision criteria can nevertheless be represented as a matrix (see Fig. 3). Specifically, each of the 30 environmental, climate, and other burdens is represented in one of the rows of the matrix and the principal social vulnerability indicator, low-income percentage, is represented in a column. Furthermore, the minimum thresholds for the two categories of indicators are set independently and are different from each other, with the 90th percentile set for most of the 30 burdens and the 65th percentile set for the low-income percentage. The matrix arrangement of the burden and socioeconomic indicators in Figure 3 reflects that of the model presented in Figure 2 above.
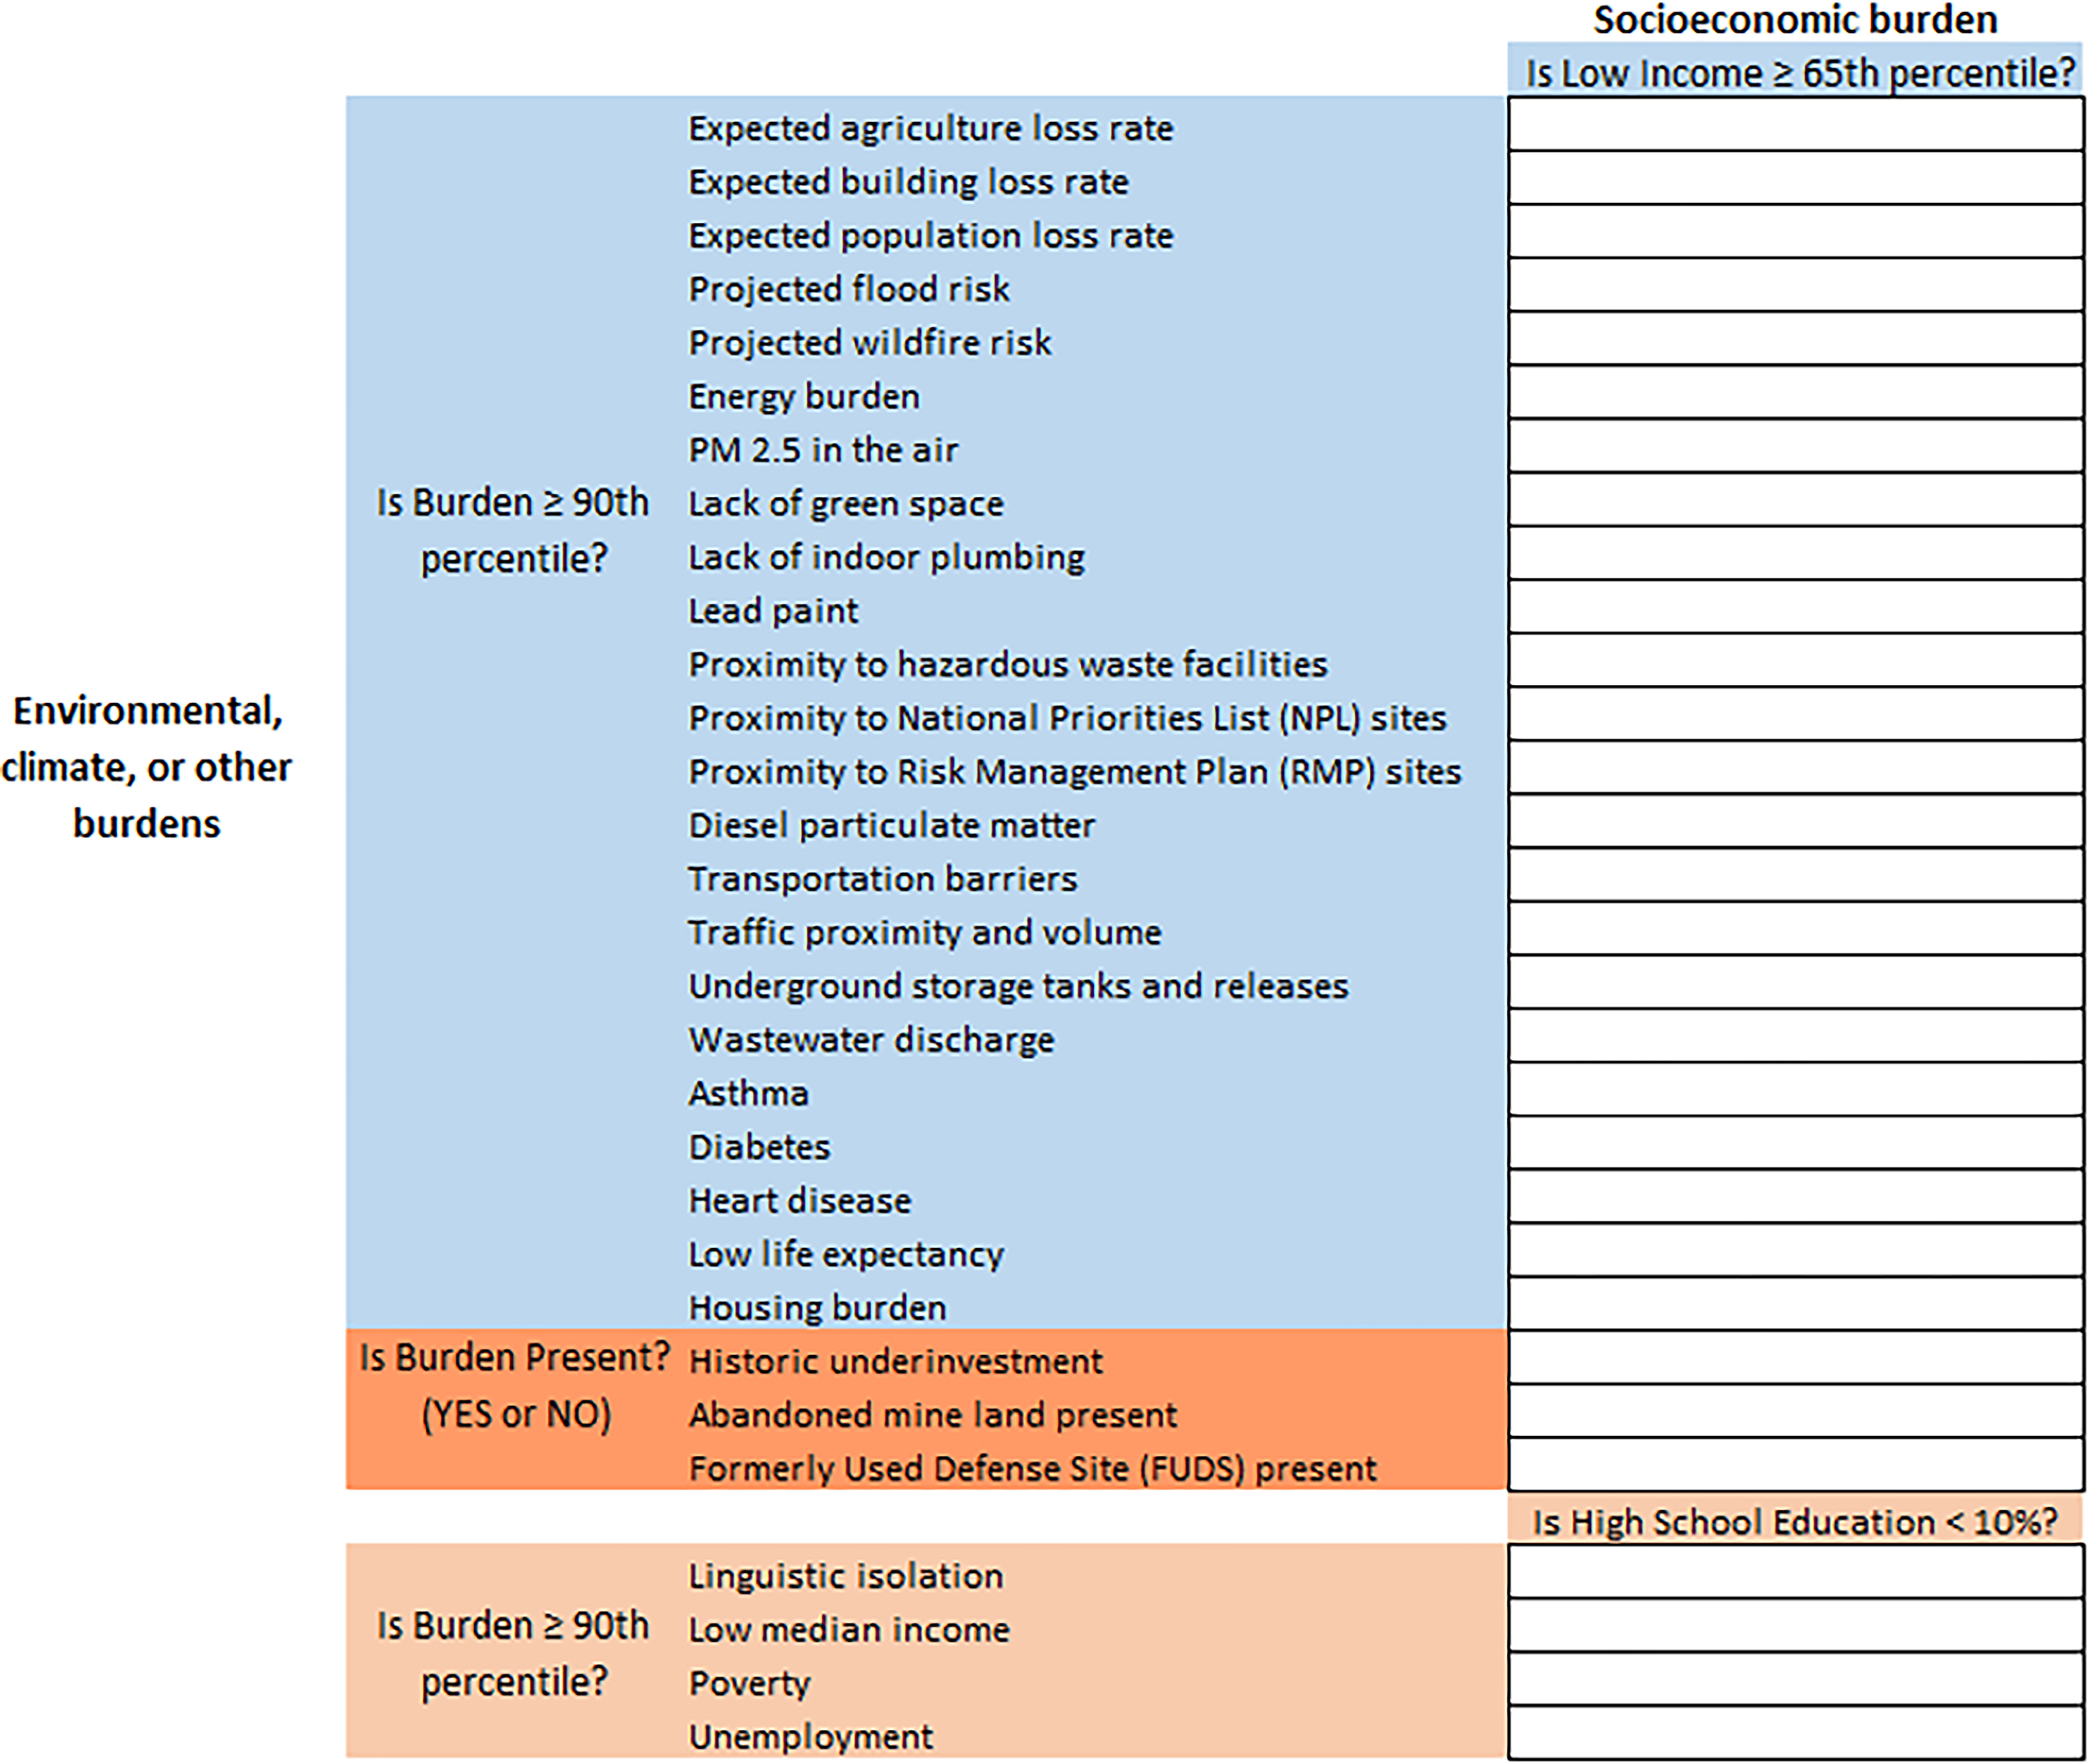
The Climate and Economic Justice Screening Tool (CEJST) Displayed as a Matrix.
The CEQ did not refer to or recognize its approach as a “matrix model” or approach. The matrix in Figure 3 was constructed by the author from the description of the CEJST methodology discussed in its technical support document. 31 Although only one of the 30 criteria needed to be met for a census tract to be considered “disadvantaged,” CEJST could be adapted for cumulative impact assessments.
To illustrate how CEJST could be used in a cumulative impact assessment, the example in Figure 4 uses the nine CEJST indicators pertaining to proximity to environmental burdens. These include (a) lack of greenspace, (b) proximity to risk management plan (RMP) facilities, (c) proximity to superfund (NPL) sites, (d) proximity to hazardous waste facilities, (e) traffic proximity and volume, (f) underground storage tanks and releases, (g) wastewater discharge, (h) abandoned mine land, and (i) formerly used defense sites (FUDS). 32
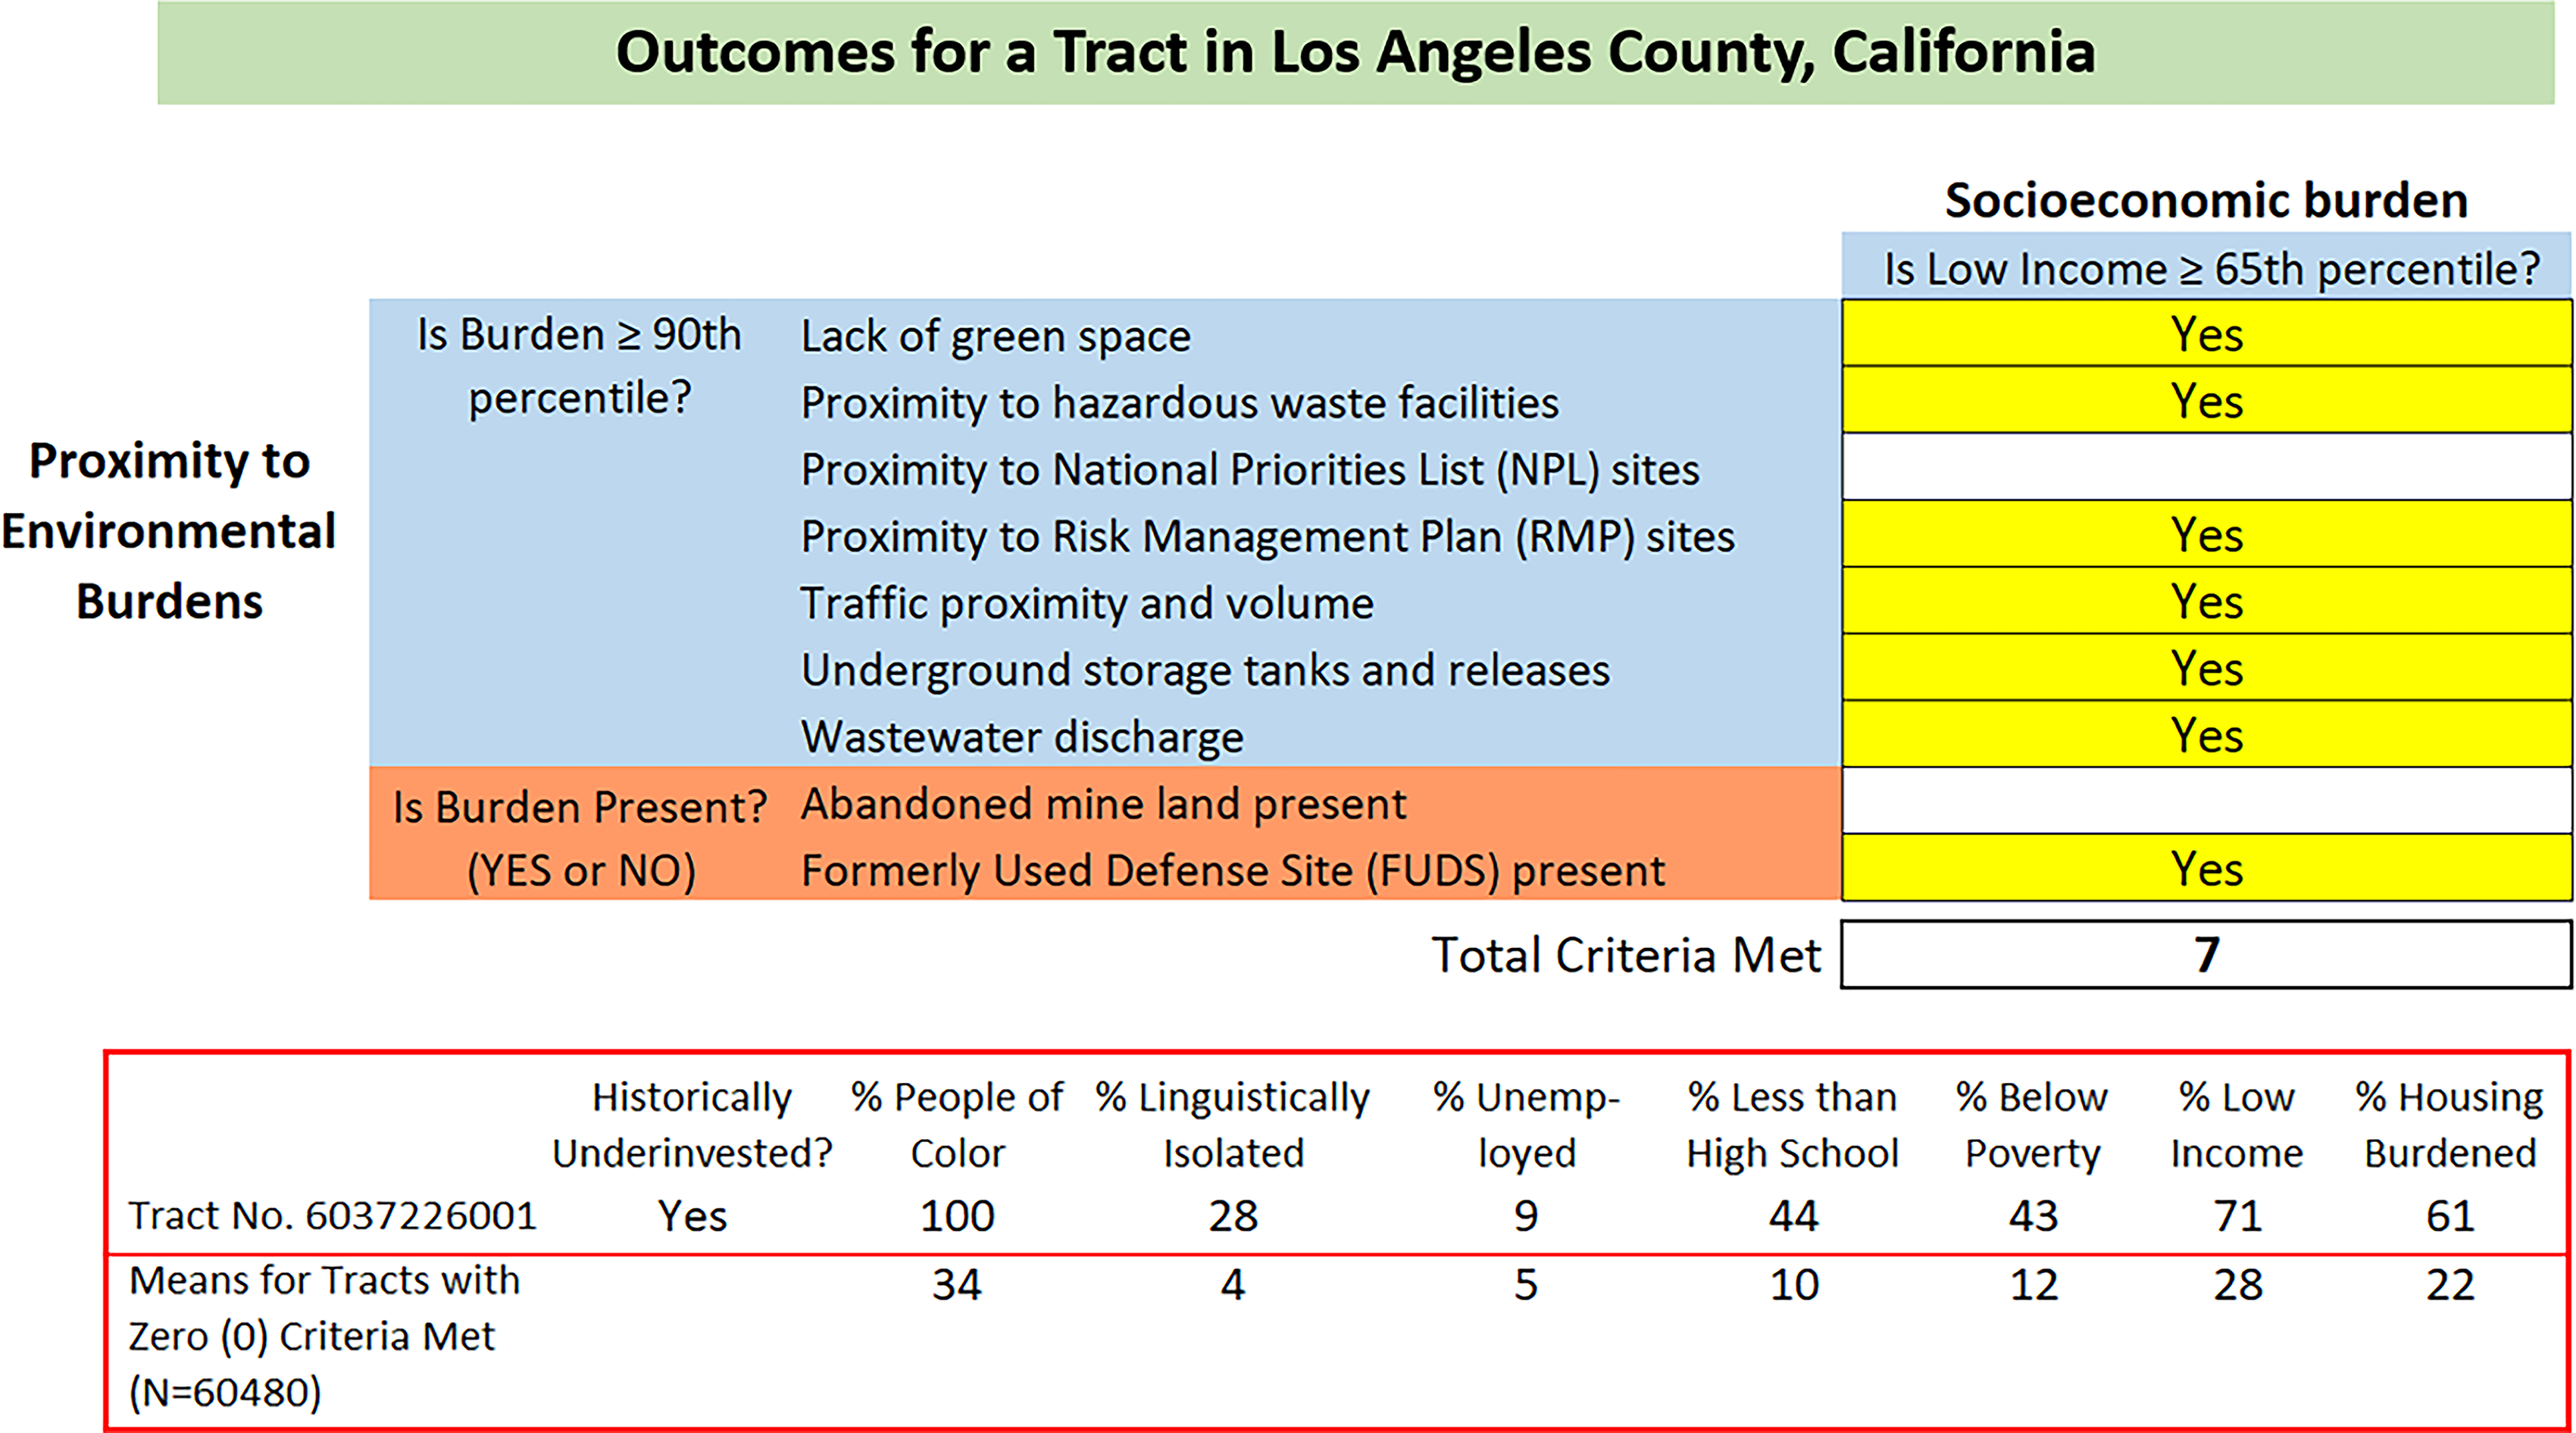
Taking into account cumulative impacts: What if the number of CEJST environmental burden indicators reaching the thresholds were counted?
The results in Figure 4 below are given for a census tract in Los Angeles County. Note that for this tract, seven of the nine criteria are met (i.e., seven proximity indicators reach either the 90th percentile or “yes” thresholds at the same time the low-income percentage reaches the 65th percentile threshold). Furthermore, the summary table (bordered in red) shows that this tract was historically underinvested in and that the people of color percentage, percent linguistically isolated, percent unemployed, percent with less than a high school education, percent living below poverty, percent low-income, and percent housing burdened are all considerably higher than the respective mean percentages for the 60,480 U.S. tracts in which none of these nine proximity indicators reach their thresholds.
Taking the above example one step further, the relationship between the number of criteria met and the size of resulting racial and socioeconomic disparities was examined for all 74,134 census tracts in CEJST. In Figure 5 below, the low-income percentage threshold was kept at the 65th percentile and the number of proximity indicators reaching their thresholds was counted. This count ranged from zero (0) to seven (7), as there were no tracts in which eight or all nine proximity indicators met their thresholds. Note in Figure 5 that as that number/count increases, so do concentrations of vulnerable populations. The average percentage of tracts that were historically underinvested in, the average people of color percentage, and the average percentages for all socioeconomic indicators are all lowest when the count = 0. These percentages rise as the number/count of proximity indicators that meet their thresholds increases. Note, however, that in the case of percent unemployed, percent living below poverty, percent low-income, and percent housing burdened the percentages tend to plateau between count = 1 and count = 6. This is likely the result of constraining the low-income threshold at the 65th percentile. That racial and socioeconomic disparities among census tracts demonstrably increase as the number of environmental burdens reaching their thresholds increases illustrates the potential of converting the CEJST into a cumulative impact assessment tool.
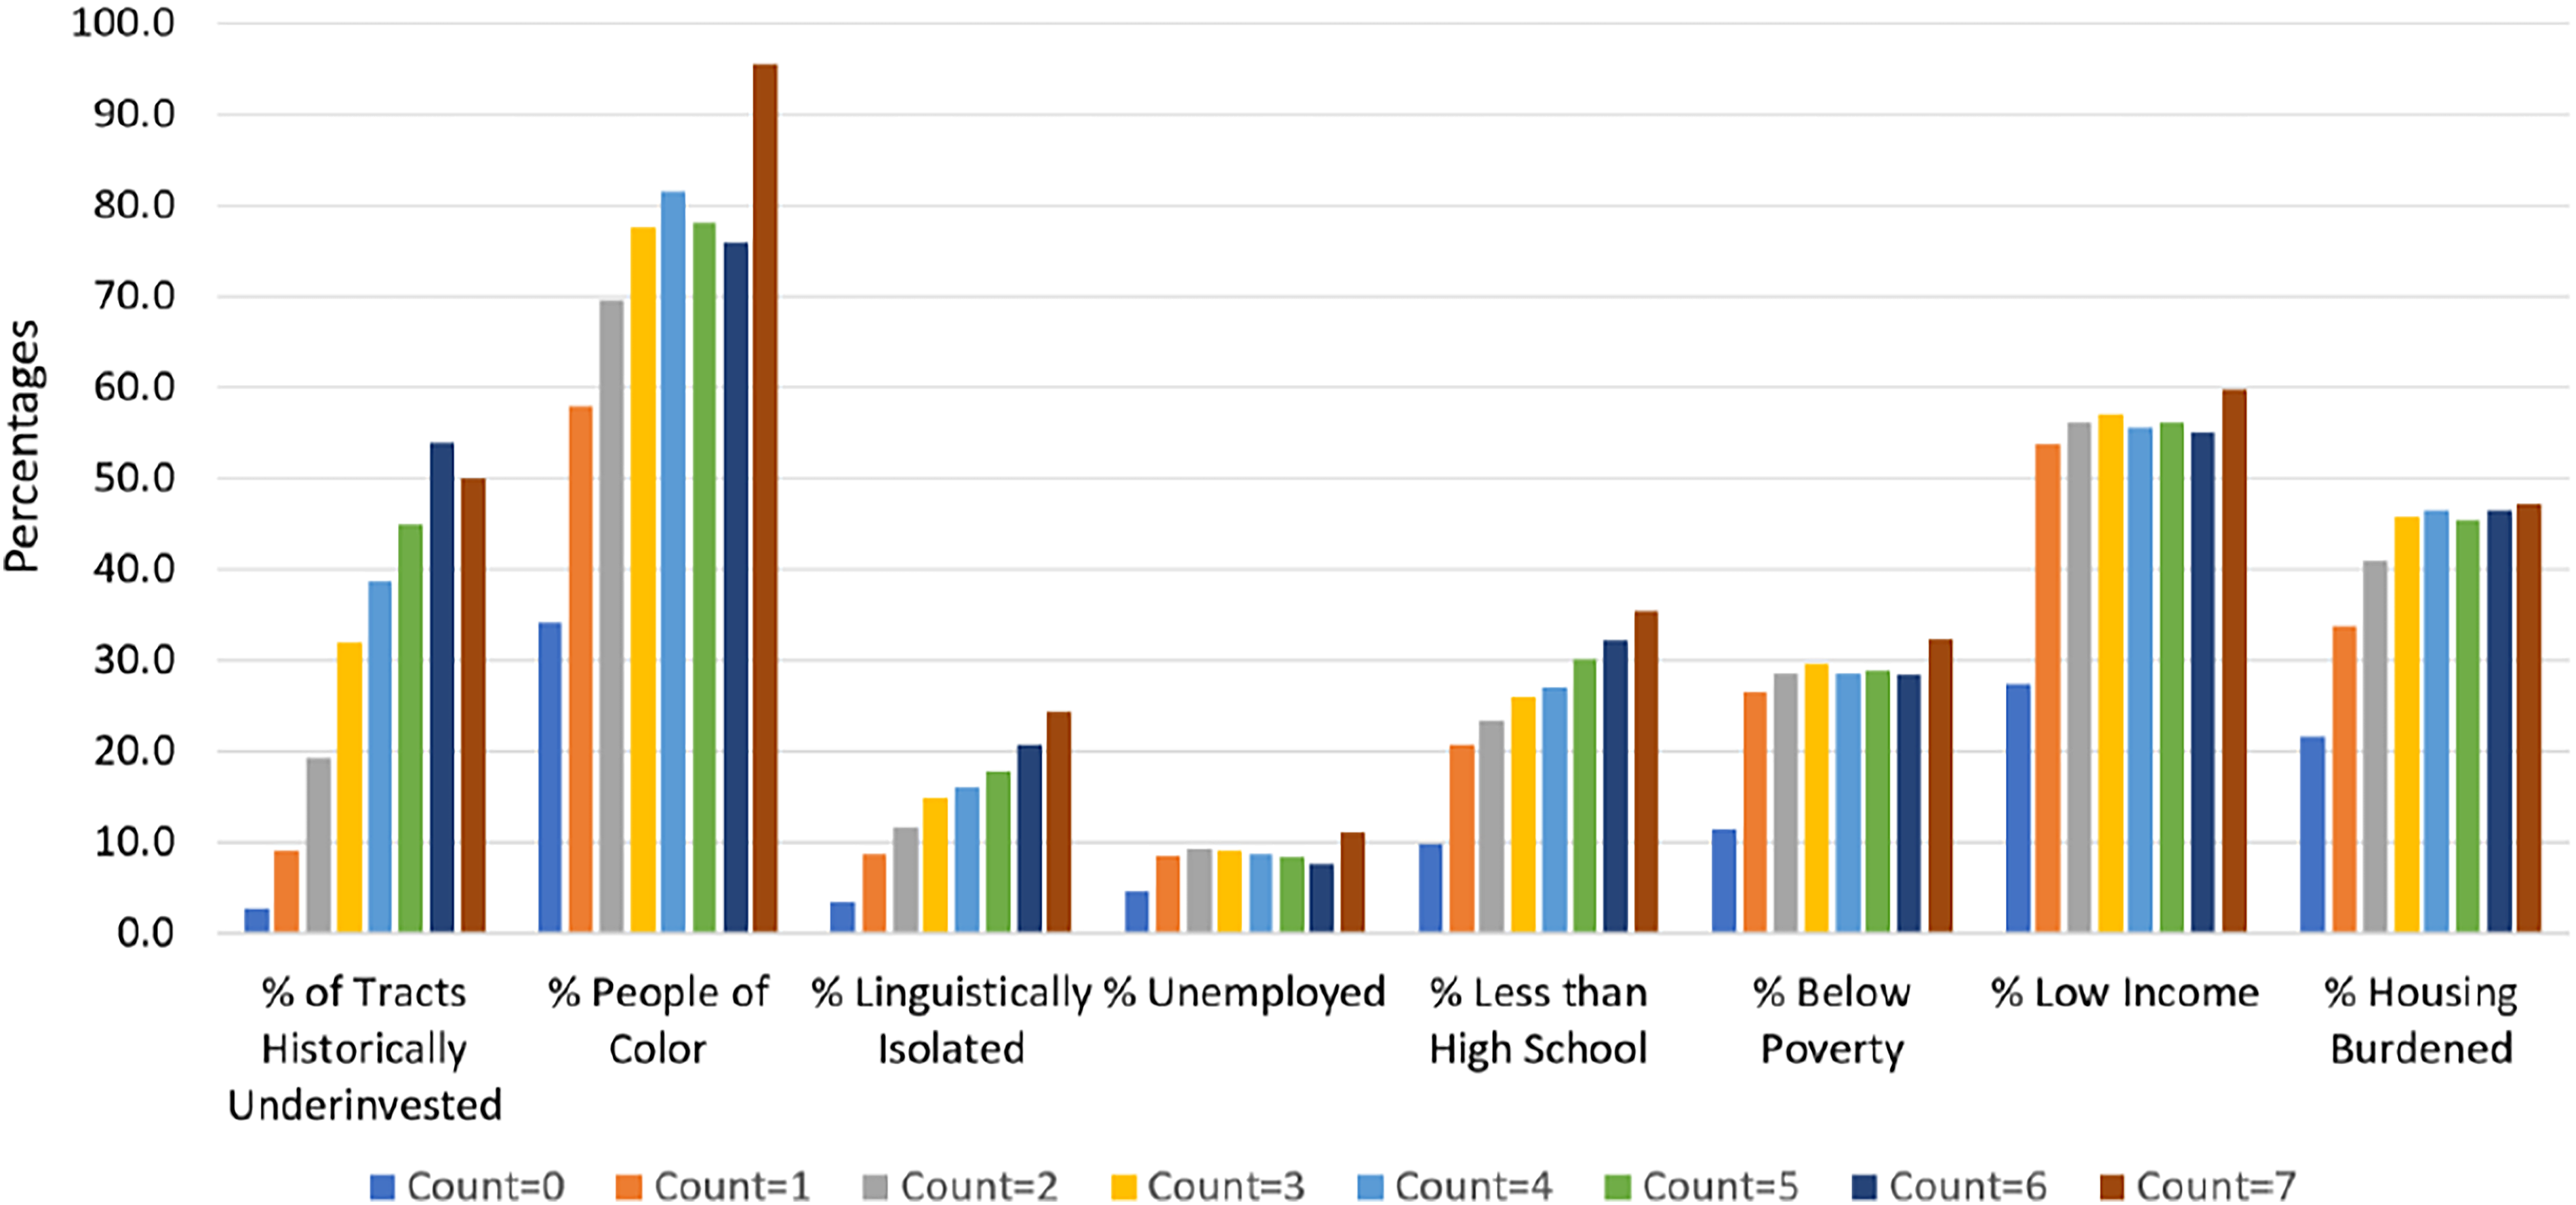
Relationship between the Number (Count) of CEJST Proximity Indicators that Reach Their Thresholds and Increasing Racial and Socioeconomic Disparities.
New Jersey’s EJMAP
New Jersey’s EJMAP tool was created by the New Jersey Department of Environmental Protection (NJDEP) as a result of passage of the New Jersey Environmental Justice Law (N.J.S.A 13:1 D-157) in 2020. The law “finds and declares that no community should bear a disproportionate share of the adverse environmental and public health consequences that accompany the State’s economic growth; … and that it is in the public interest for the State, where appropriate, to limit the future placement and expansion of such facilities in overburdened communities.” To implement the law, proposed rules were promulgated by the NJDEP June 6, 2022. According to the NJDEP, the Environmental Justice Rules “will establish a process for assessing relevant environmental and public health stressors affecting overburdened communities (OBCs) and to deny or condition permits where facilities cannot avoid the occurrence of disproportionate environment or public health stressors in the OBC” (page 3 of EJMAP Technical Guidance 33 ). New Jersey’s EJMAP was developed for this effort. A more detailed history of the advocacy, development, and implementation of New Jersey’s landmark legislation is given by Sheats et al. 34 in this special issue.
As with CEQ’s CEJST, although not recognized at the time of its creation, New Jersey’s EJMAP reflects the features of a matrix model or approach. EJMAP employs 26 environmental and public health burdens or “stressors”, each of which can be displayed as a row in a matrix, and three socioeconomic or social vulnerability indicators, each of which can be displayed as a column. Furthermore, the minimum thresholds placed on the environmental/public health stressors and socioeconomic indicators are set independently and are distinct from each other. Figure 6 displays the resulting matrix and lists all the individual environmental and public health stressors and socioeconomic indicators employed in EJMAP.
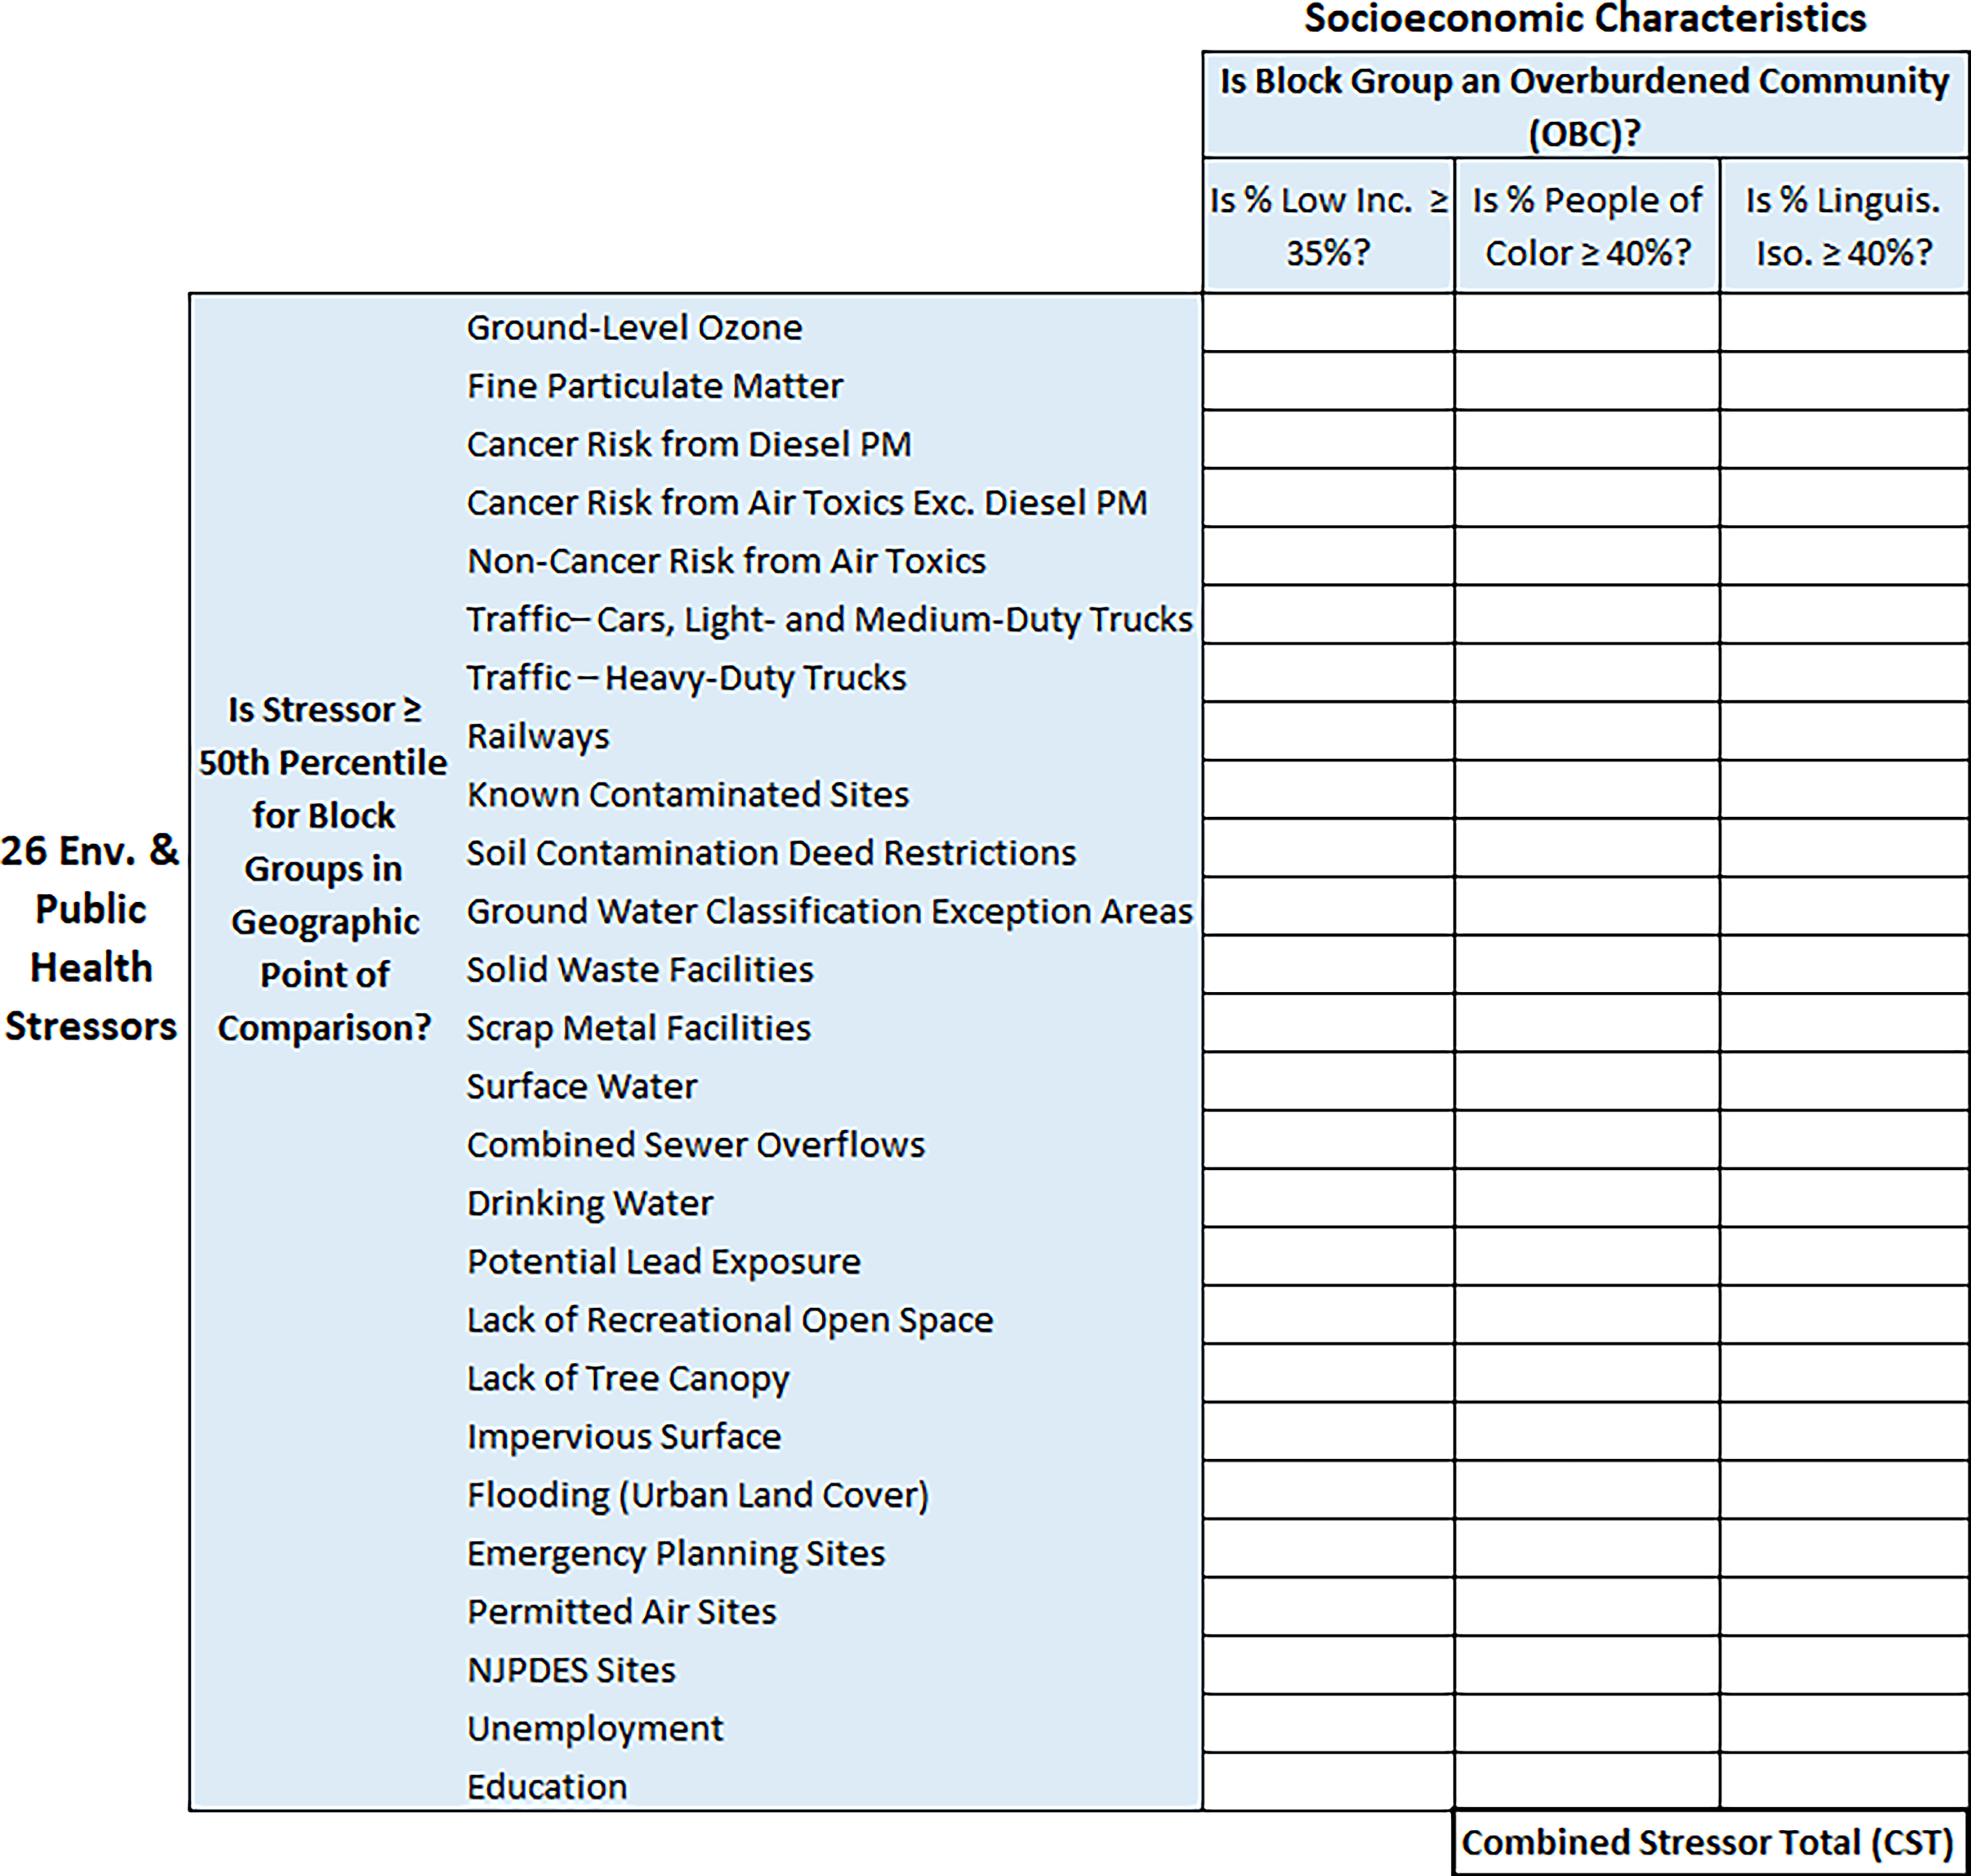
New Jersey’s EJ Mapping, Assessment, and Protection (EJMAP) Tool Displayed as a Matrix.
As with the matrix for CEJST (Fig. 3), the matrix in Figure 6 was constructed by the author from the description of the EJMAP methodology in the NJDEP’s EJMAP Technical Guidance. Unlike CEJST, EJMAP does count the number of environmental and public health stressors that meet the thresholds and are considered “adverse,” thus making it more appropriately a matrix model for cumulative impact assessment than CEJST (although, as noted, CEJST could be modified to do so). The resulting total number of adverse stressors is referred to as the “combined stressor total” or “CST.” The CST plays a critical role in deciding whether a permit for a new source is approved, conditioned, or denied. Details about the steps taken in EJMAP and New Jersey’s method are given below.
In the first step, three key socioeconomic indicators in New Jersey block groups are examined. These include: (a) percent low-income, (b) percent people of color, and (c) percent linguistically isolated. These are represented as columns in the matrix in Figure 6. Note that the thresholds placed on them (35%, 40%, and 40%, respectively) are percentages rather than percentiles, as in the case of the CEJST. The thresholds on these indicators are used to determine whether a block group is an “OBC.” It is not necessary for the thresholds of all three socioeconomic indicators to be met. If only one of the indicators’ thresholds is met, the block group is considered an OBC block group.
Determining which New Jersey block groups are OBC and which are non-OBC is a critical first step in New Jersey’s method, as the median stressor values of the non-OBC block groups are used to determine whether a stressor is “adverse” for all the other block groups in New Jersey. Note in Figure 6, that there are 26 “environmental and public health” stressors, 24 of which are environmental and two which are socioeconomic (percent unemployed and percent with less than a high school education). A stressor for a block group is “adverse” if its value exceeds the median value of the non-OBC block groups for either the state or for the respective county, whichever is lower. Once it has been determined which stressors in a block group are “adverse,” these are counted to determine the “CST” for the block group.
The final step in New Jersey’s method is to compare an OBC block group’s CST with the median CST for non-OBC block groups at the state and relevant county levels in which the block group is located, the lower of which is referred to as the “Geographic Point of Comparison” (GeoPC). If the CST of an OBC block group exceeds its GeoPC, the block group is considered “subject to cumulative adverse stressors,” that is, disproportionately impacted. In that case, permits for new pollution sources would be either conditioned or denied.
Figure 7 provides an example, displaying outcomes for a block group in Atlantic County. Note that this block group reaches the minimum thresholds for both the low-income percentage (35%) and people of color percentage (40%), thus making it an OBC block group. In addition, there are 14 stressors that exceed the median values for the block group’s GeoPC and are thus “adverse” and result in a CST of 14. As this OBC block group’s CST (14) exceeds the CST of its GeoPC (10), it is considered disproportionately impacted. New permits would be conditioned or denied.
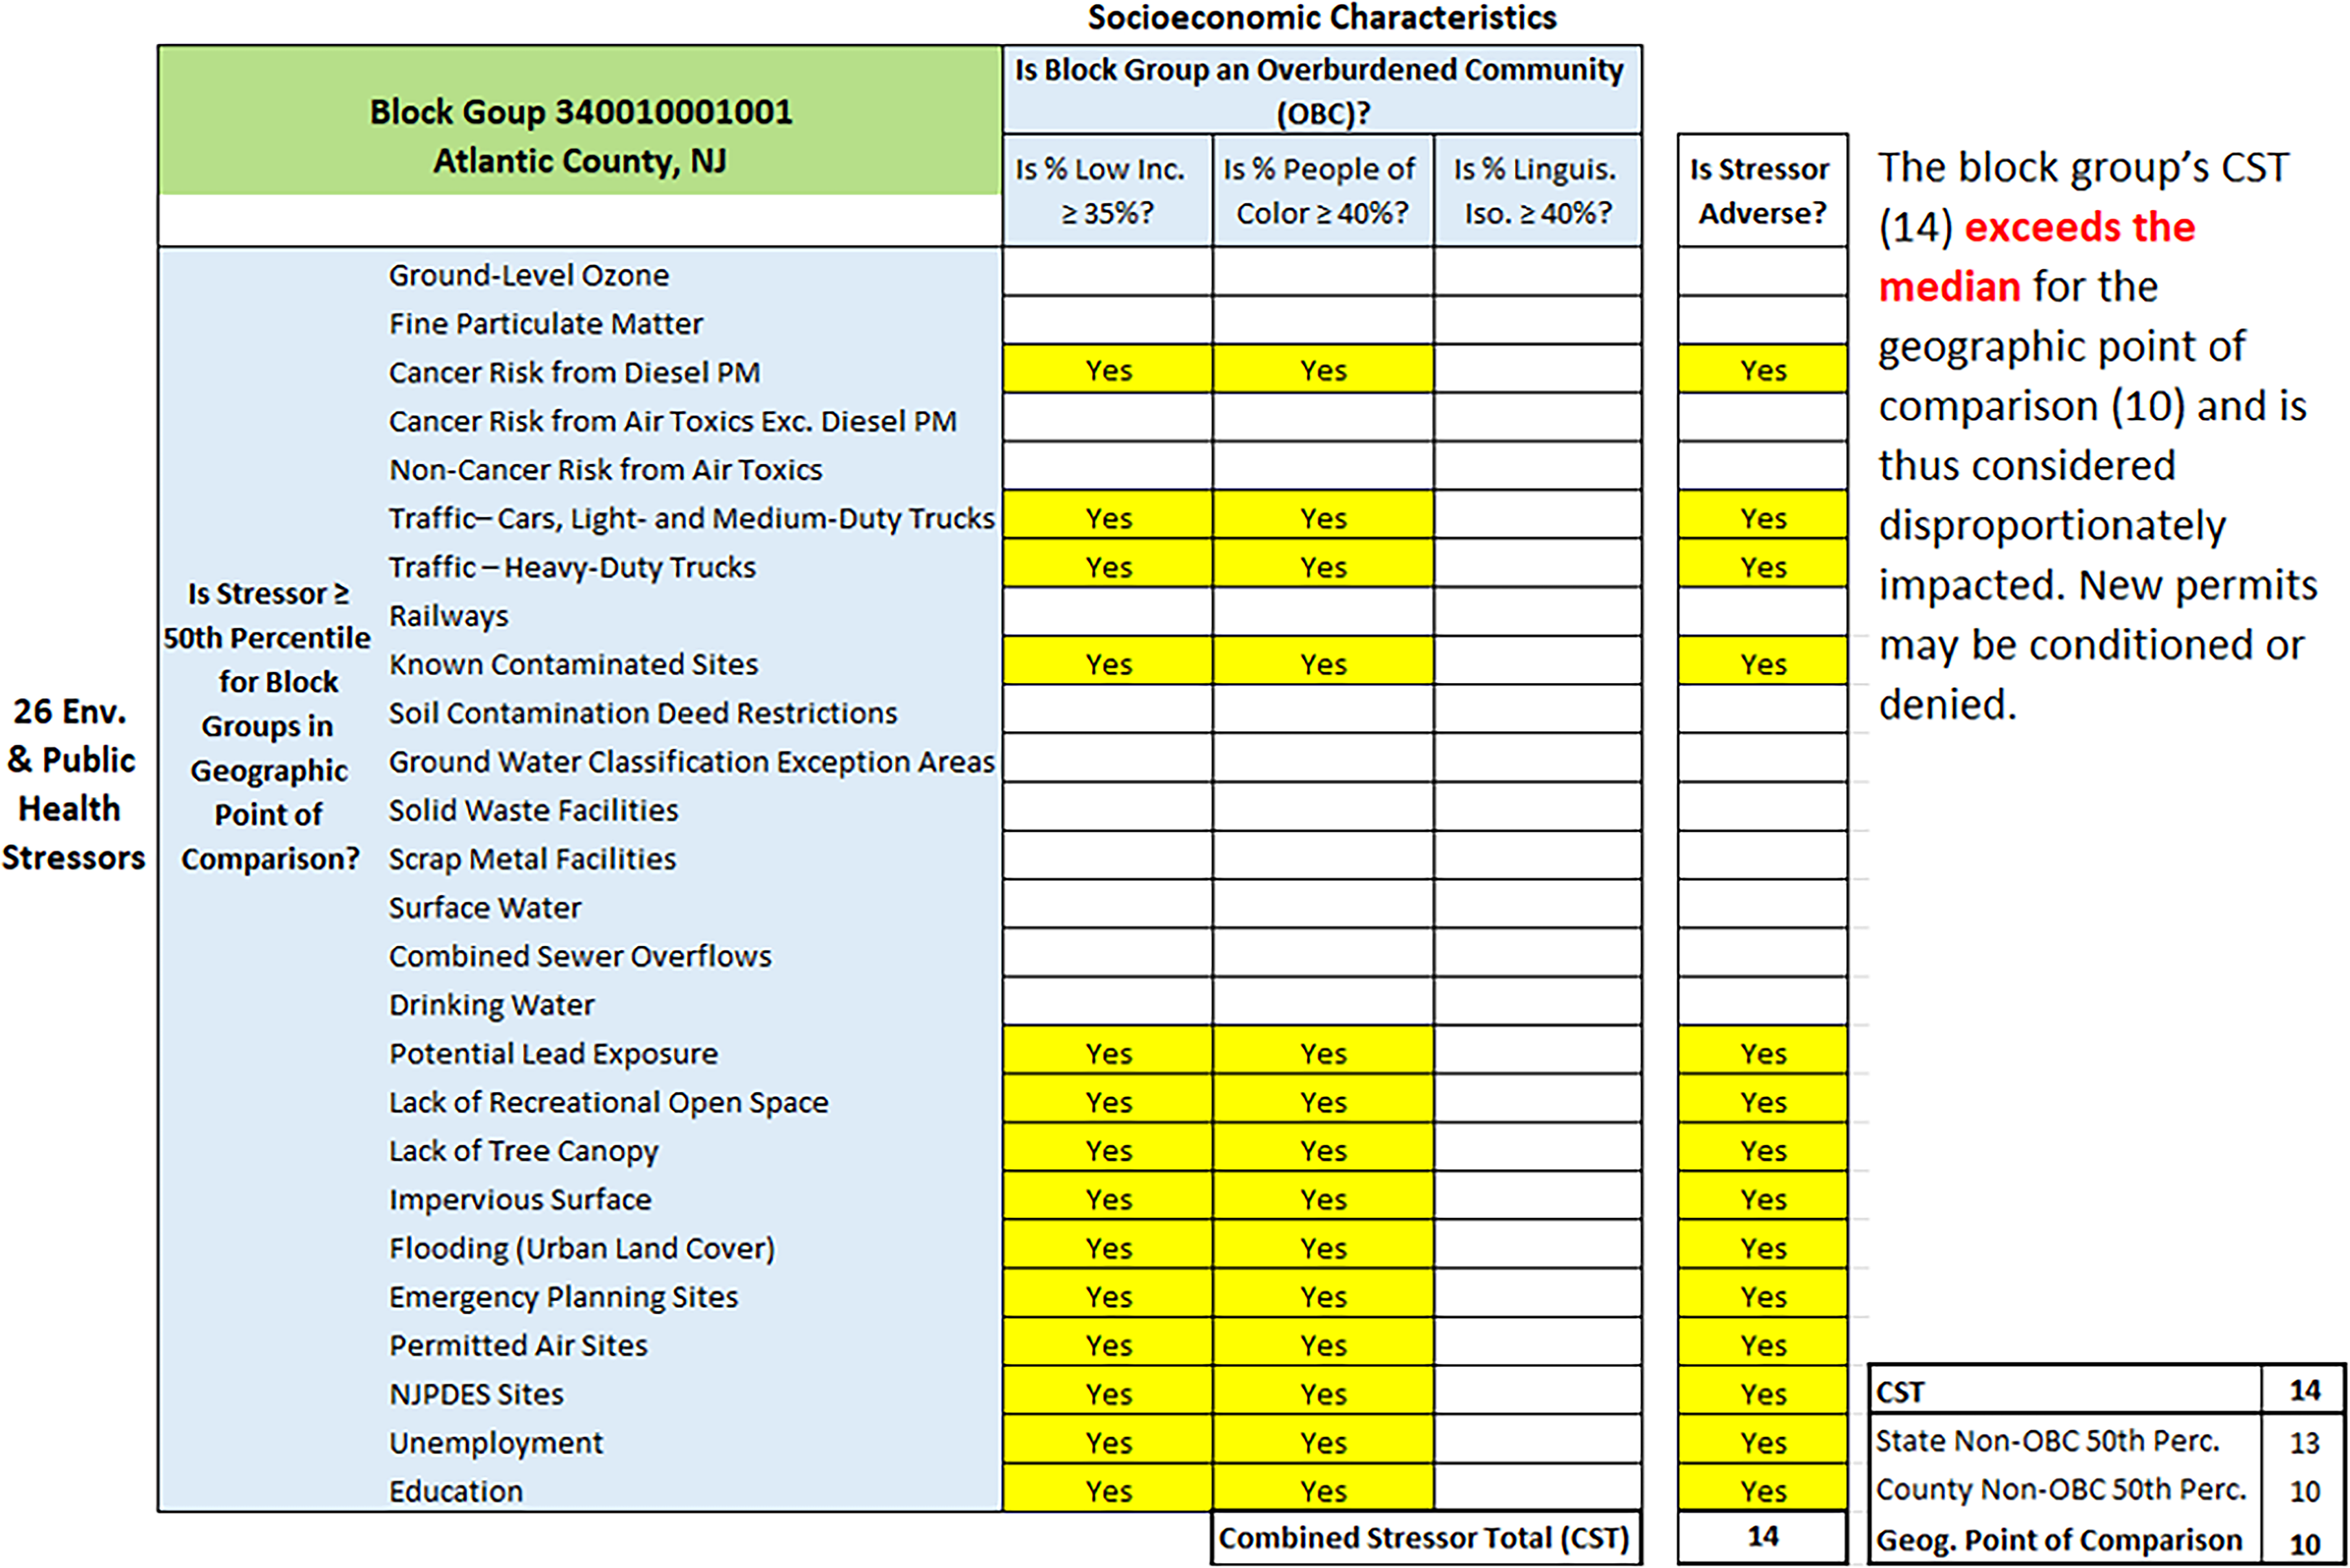
Outcomes for a Block Group in Atlantic County, New Jersey.
What happens if CSTs continue to be counted beyond the maximum GeoPC?
For the purposes of implementing New Jersey’s Environmental Justice Law, it is only necessary to determine whether an OBC’s CST exceeds that of its GeoPC. How much greater an OBC’s CST is beyond that value is not used in New Jersey’s decision-making pertaining to approving or denying new permits. However, would tracking that value be useful in other decision-making contexts? For example, if an OBC block group’s CST is greater than 14 (e.g., 16, 20, 24, etc.), should that block group be prioritized in other types of decisions, for example, decisions about special investments or remediation or enforcement actions if those opportunities existed? As similarly asked above with CEJST, what would happen if the number of burdens or stressors in EJMAP continued to be counted?
As indicated in Supplementary Table S2 of EJMAP’s Technical Guidance document, 35 the minimum value of the GeoPC for any OBC block group is 10 and the maximum is 13. Figure 8 below displays the average low-income, people of color, and linguistically isolated percentages as CST totals for OBC block groups increase from two to 25 (there are no OBC block groups with CSTs outside this range). Note how these percentages increase as block group CSTs increase. This increase is particularly pronounced as CSTs go beyond the GeoPC maximum of 13. This pattern is similar to what was found for CEJST. As the number of burdens/stressors increases, so do the concentrations of vulnerable populations among the block groups.
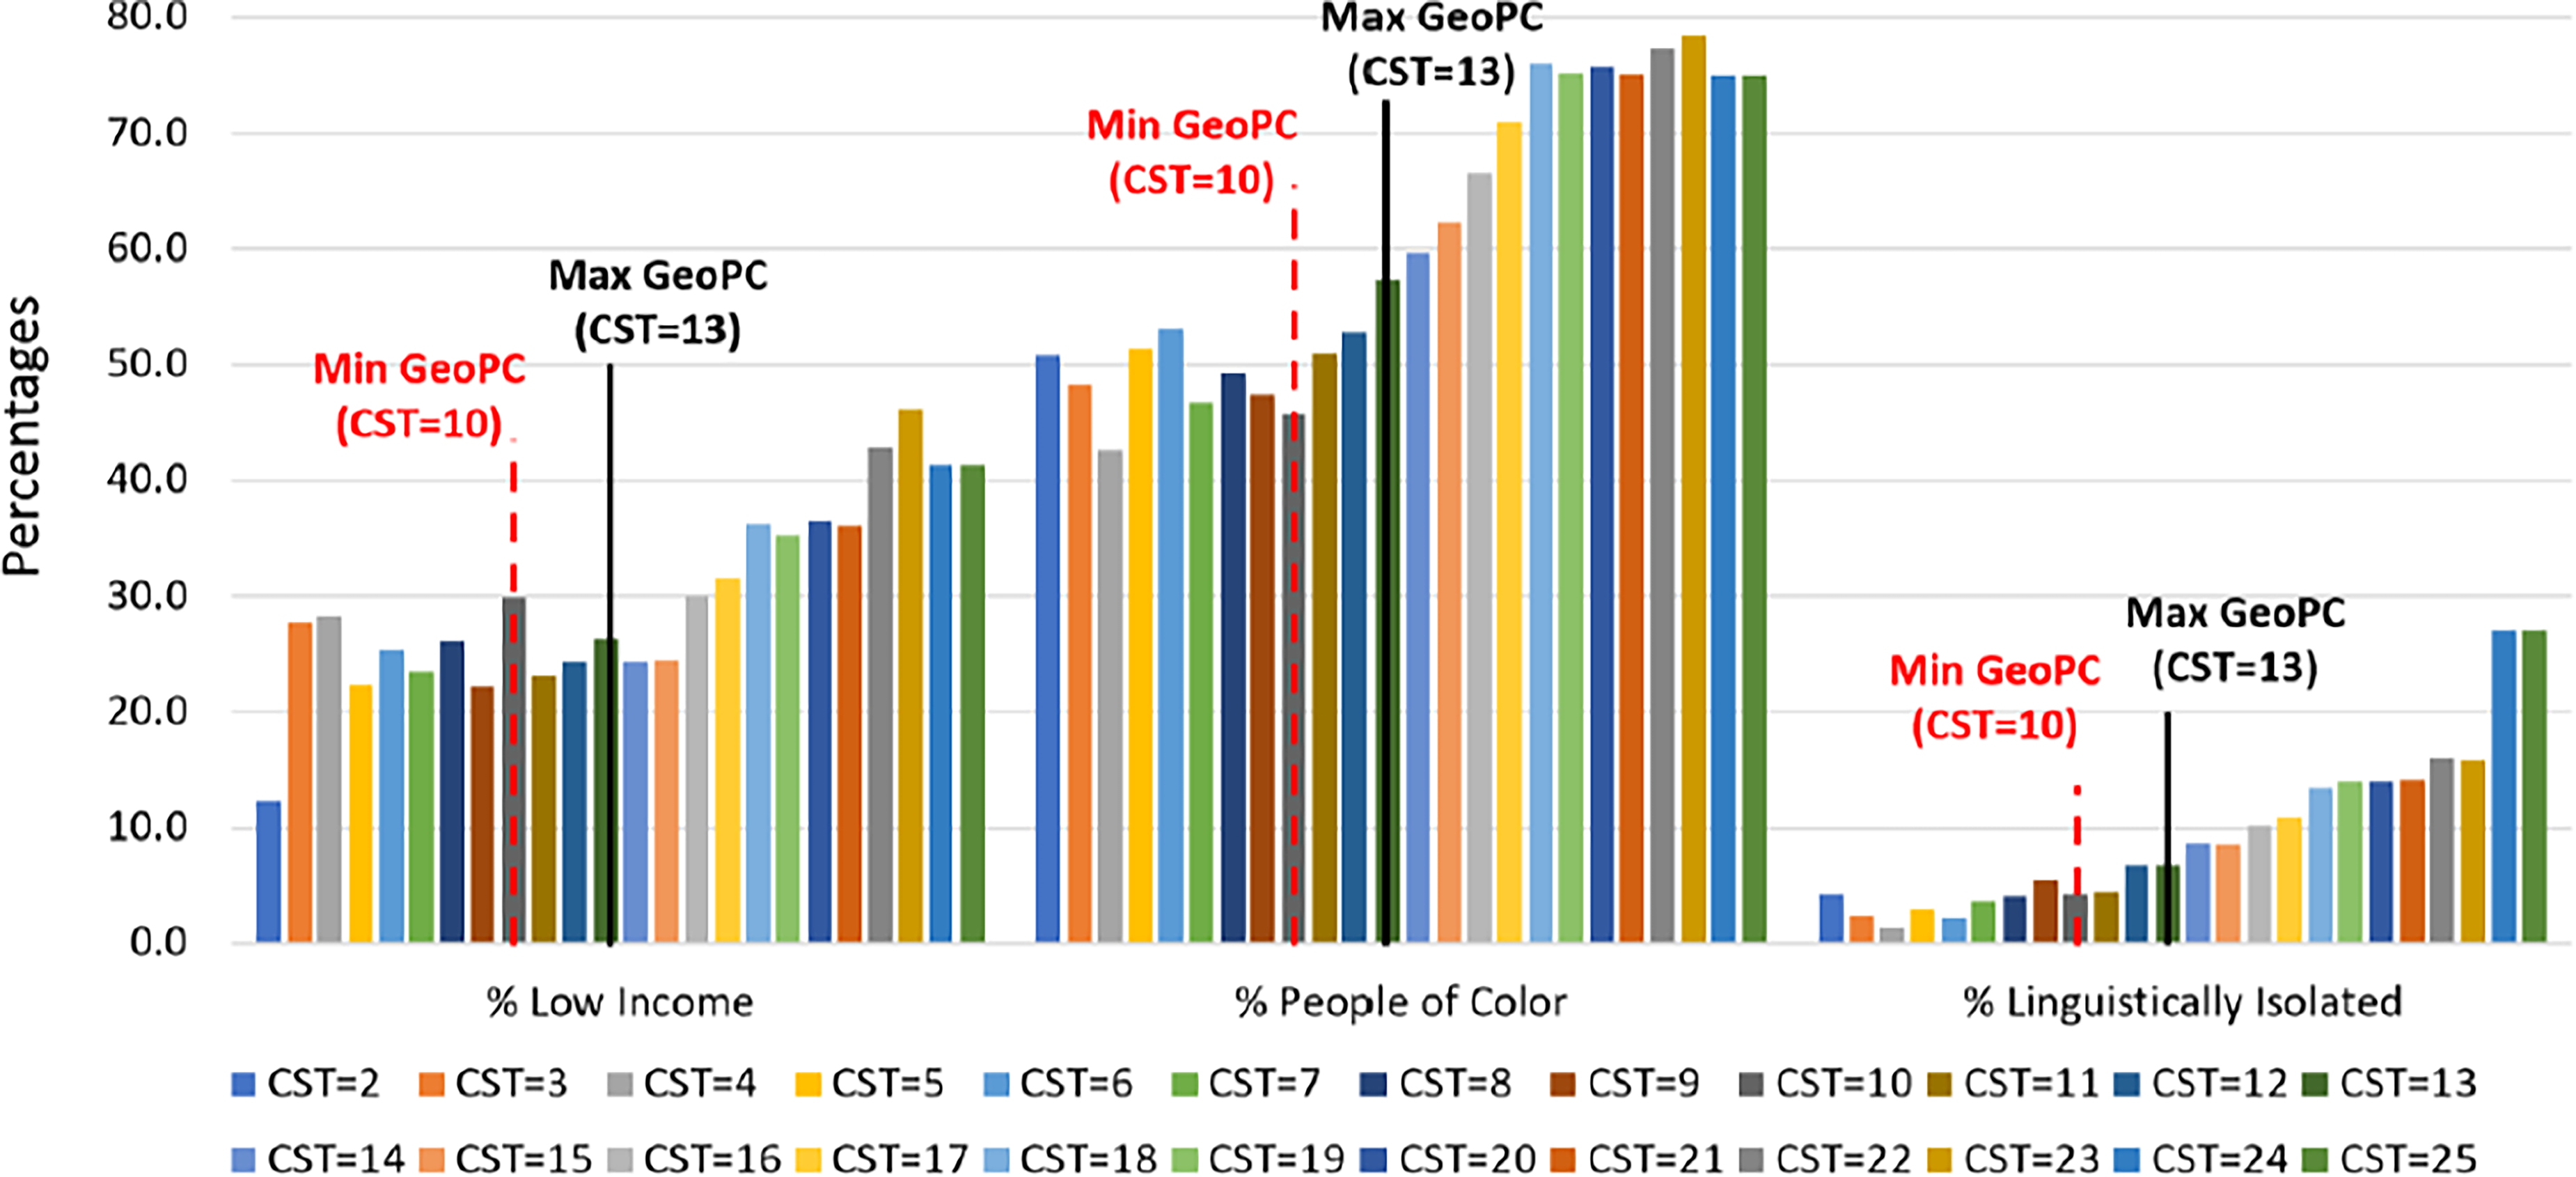
Average Racial and Socioeconomic Percentages by Combined Stressor Totals (CST) in OBC Block Groups in New Jersey.
APPLYING NEW JERSEY’S METHOD TO EJSCREEN DATA
A separate analysis was made to see how well New Jersey’s method could be replicated using data from the U.S. EPA’s EJScreen 2.1 database. Details of this analysis are given in the Supplementary Data. It was found that even though EJScreen 2.1 contains only about half the number of environmental and public health stressors as New Jersey’s EJMAP (14 vs. 26), applying New Jersey’s method to EJScreen data classifies 91.2% of New Jersey’s 3445 OBC block groups into the same categories as when New Jersey’s method is applied to the EJMAP data (see Fig. 9). Specifically, it was found that of the 3011 OBC block groups whose CSTs exceed their respective Geographic Points of Comparison (GeoPC) when the New Jersey method is applied to EJMAP data, there are 2813 block groups whose CSTs exceed their respective GeoPCs when the New Jersey method is applied to EJScreen data. At the same time, of the 434 block groups whose CSTs fail to exceed their respective GeoPCs when the New Jersey method is applied to EJMAP data, there are 328 block groups whose CSTs fail to exceed their respective GeoPCs when the New Jersey method is applied to EJScreen data. These 2813 and 328, respectively classified block groups make up 81.7% and 9.5%, or 91.2%, of the total number of 3445 OBC block groups in New Jersey.
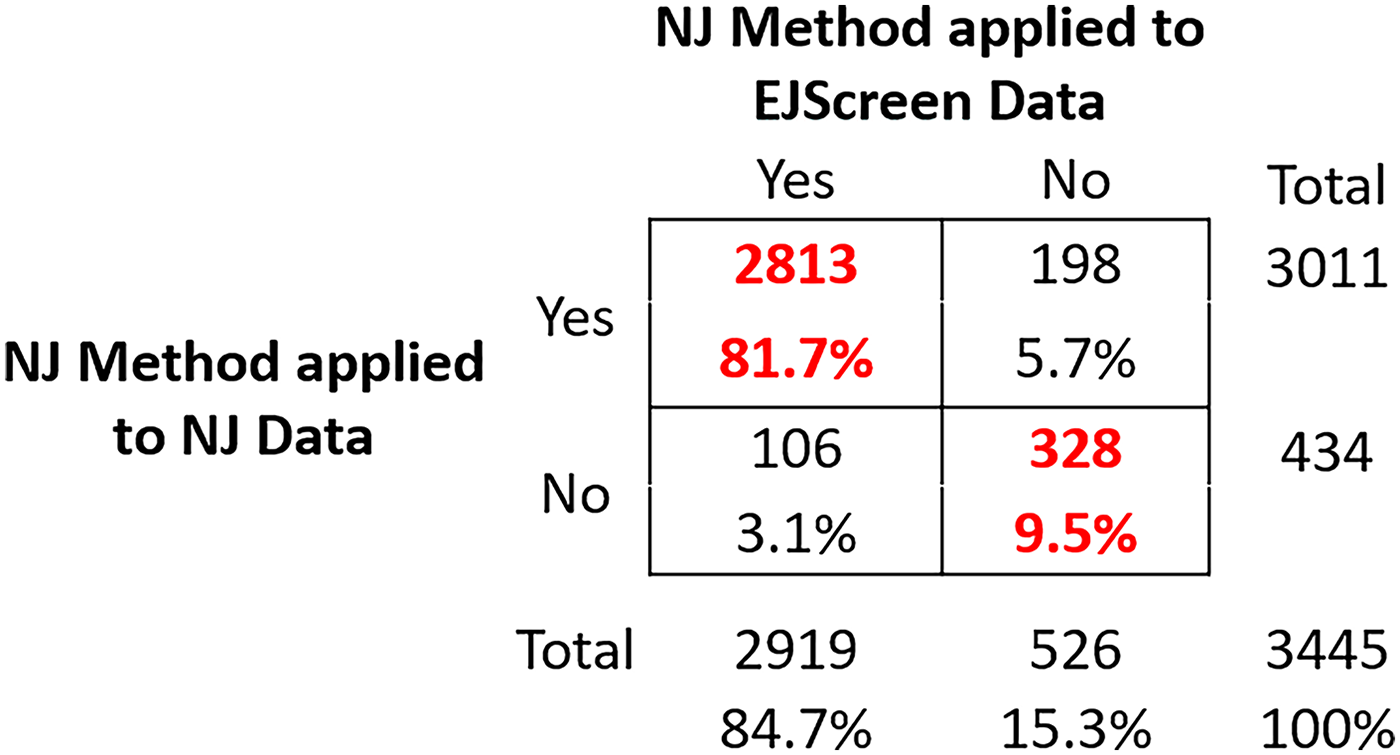
Does the OBC Combined Stressor Total (CST) exceed the Geographic Point of Comparison?
The high degree of matching in the above outcomes is supported by the calculation of high sensitivity and specificity scores of 0.93 and 0.93, respectively (see Supplementary Data). A sensitivity detection analysis furthermore yields a sensitivity index of d’ = 2.48, also indicating high sensitivity. These additional analyses provide further support that New Jersey’s method is well-replicated using EJScreen data. This, in turn, suggests that quantifying cumulative impacts in the way that New Jersey does represents a robust methodology. It also suggests that although the indicator sets in New Jersey’s EJMAP and EPA’s EJSCREEN have specific labels (e.g., fine particulate matter, ozone), they are likely proxies for a broader constellation of collocated adverse environmental conditions.
Furthermore, as was found when counting New Jersey EJMAP stressors, the concentrations of vulnerable populations steadily increase as CSTs using EJScreen stressors increase beyond the maximum GeoPC of 8 (see Fig. 10). These results provide further evidence of the robustness of New Jersey’s method. Also, given that racial and socioeconomic disparities continue to increase as CST values increase beyond the maximum Geographic Points of Comparison, the New Jersey model may have potential in other decision-making contexts that require the identification and prioritization of communities, especially impacted by multiple, cumulative burdens.
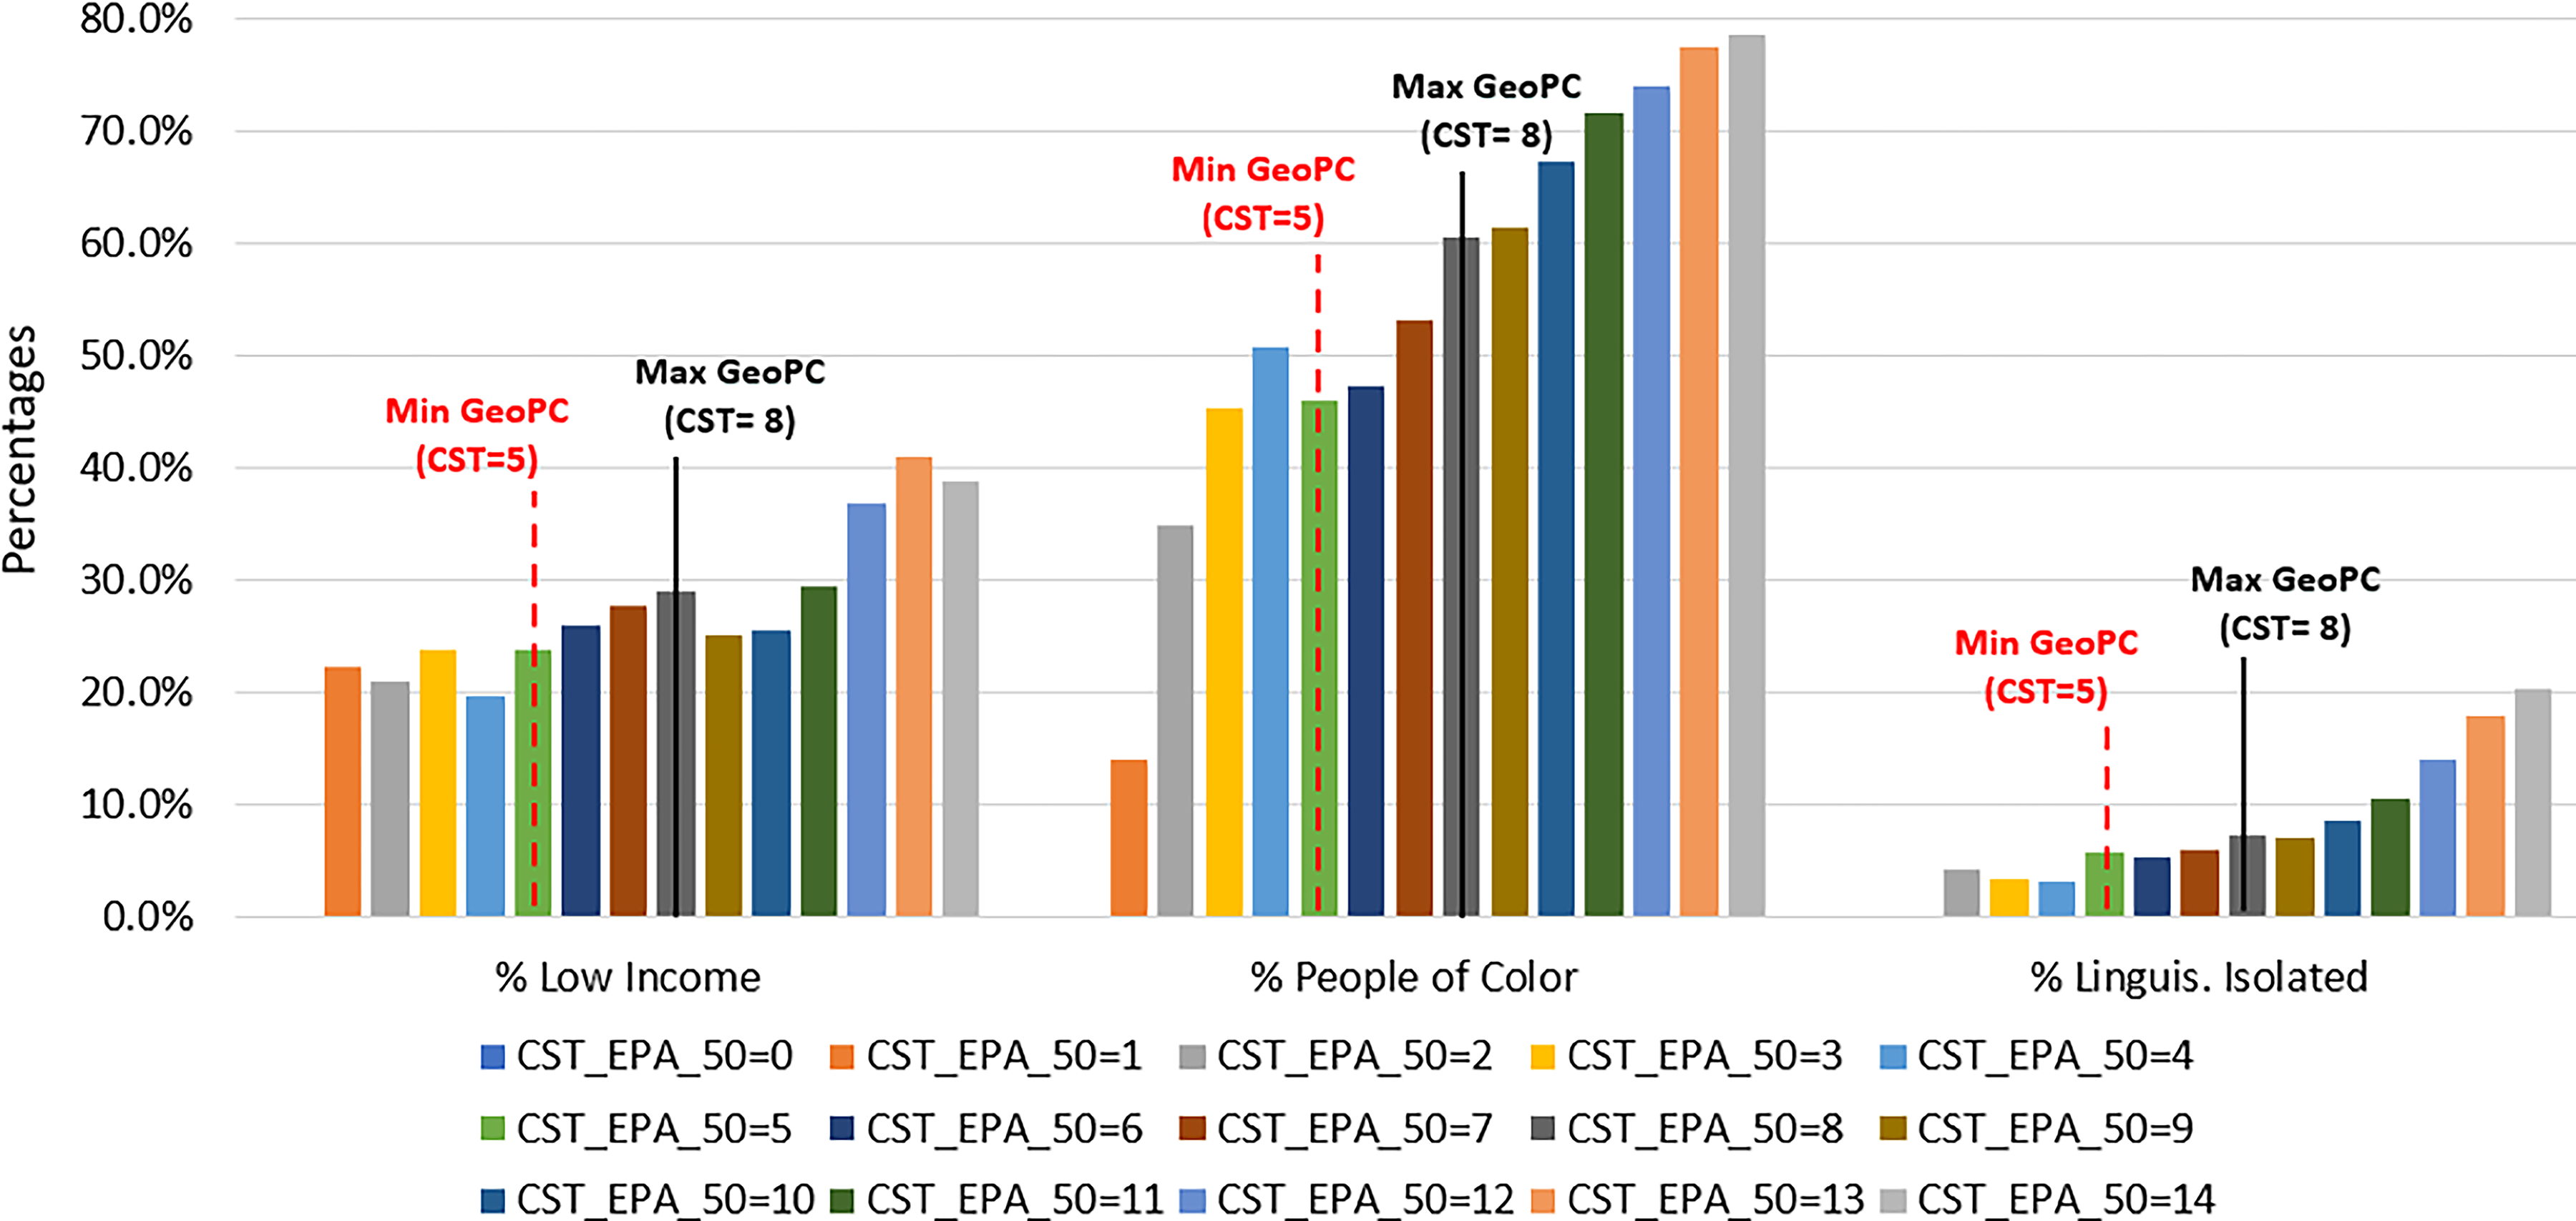
Average Racial and Socioeconomic Percentages by Combined Stressor Totals (CST) in OBC Block Groups in New Jersey Using EJScreen Data.
In sum, the above analyses of CEQ’s CEJST and New Jersey’s EJMAP were intended to show with concrete examples the feasibility and utility of applying matrix approaches in decision-making involving cumulative impacts. Furthermore, it was demonstrated that these two models can be built on and extended beyond their current uses by taking into account the total number of burdens and stressors meeting the minimum threshold requirements. The results also provide strong evidence of the robust relationship between total cumulative environmental burdens experienced by communities and the degree of racial and socioeconomic disparities that are a consequence.
DISCUSSION AND CONCLUSIONS
Matrix approaches have been proposed in prior reports, such as the NEJAC’s 2004 report to the EPA, Cal EPA’s 2013 sensitivity analysis of CalEnviroScreen 1.0, and the 2022 Mohai et al. report to the EPA, Advancing EJScreen. However, these approaches have not been fully developed or implemented. Nevertheless, the recent CEQ’s CEJST and New Jersey’s EJMAP tool reflect the properties of matrix approaches, although not recognized or labeled as such at the time of their creation.
Matrix approaches complement and offer advantages to single-scoring methods, such as CalEnviroScreen and the CDC's EJI, in assessing communities for their relative disadvantage and making policy decisions. Single scoring methods combine the values of diverse environmental burden and social vulnerability indicators into a single number, which are used to rank and compare communities for their relative disadvantage. When a threshold is set to identify a community as “disadvantaged” or to trigger an action or policy decision, such as the 75th percentile in the case of CalEnviroScreen, the threshold is applied to the single score value.
Matrix approaches, on the other hand, keep all the individual environmental burden and social vulnerability indicators explicit and display their values in a two-dimensional table, for example, with environmental burden indicators displayed as rows and social vulnerability indicators displayed as columns. In addition, threshold levels for environmental indicator values and social vulnerability values can be set independently from each other, thus providing a great deal of flexibility in creating the criteria for identifying communities as “disadvantaged” and triggering policy decisions.
Matrix approaches provide a number of other important advantages. They are mathematically straightforward and easy to understand, helping to avoid a “black box” appearance to cumulative impact assessment. They provide an explicit and visible menu of the relevant indicators/factors in identifying “disadvantaged” communities. They provide flexibility in setting thresholds for environmental burden and social vulnerability categories in designating communities as “disadvantaged.” And because the menu of indicators, threshold levels set, and number of indicators meeting thresholds are visible and flexible, matrix approaches are adaptable to fit a potentially wide range of decision-making contexts.
Potential limitations include constraints on the number and breadth of environmental burden and social vulnerability indicators currently available, although great advancements have been made with the development of such tools as CalEnviroScreen, EJScreen, CDC’s EJI, New Jersey’s EJMAP, and others. Future research and development should continue the collection of additional data and the construction of indicators to expand these tools, including developing ways to incorporate community knowledge directly as data input into the tools. There is also a great need for the development of environmental indicators pertinent to rural areas, such as proximity to mines and concentrated animal feeding operations (CAFOs), as well as adequate measures of water quality in rural areas. Also currently lacking are measures of the harm or risk of harm linked to many environmental indicators that are tracked in current tools, and whether there are interactive effects among the various burdens and stressors. Although information about such effects is currently lacking, the research presented in this article demonstrates that there is nevertheless a strong link between where multiple environmental burdens are concentrated and where vulnerable populations are also concentrated.
The development of matrix approaches provides an important opportunity to expand the toolkit for conducting cumulative impact assessments for the purposes of decision-making. CEQ’s CEJST and New Jersey’s EJMAP have already demonstrated their feasibility and potential.
Footnotes
AUTHOR DISCLOSURE STATEMENT
There are no conflicts of interest related to this work to disclose.
FUNDING INFORMATION
No funding was received for this article.
Supplemental Material
Supplementary Material
Please find the following supplemental material available below.
For Open Access articles published under a Creative Commons License, all supplemental material carries the same license as the article it is associated with.
For non-Open Access articles published, all supplemental material carries a non-exclusive license, and permission requests for re-use of supplemental material or any part of supplemental material shall be sent directly to the copyright owner as specified in the copyright notice associated with the article.