
Abstract
Despite extensive research on loyalty formation, findings regarding interrelationships between loyalty and its key drivers, such as perceived service quality, perceived value, and customer satisfaction, are inconclusive and often contradictory. To provide more definitive statements about these relationships, we synthesized and analyzed findings from 153 articles published in eight top-tier tourism and hospitality journals between 2006 and 2020 using meta-analytic structural equation modeling. We also confirmed that five- and seven-point Likert-type scales did not generate significant differences in the effect size of correlational measures. A further comparison of four theoretically postulated competing models strongly supports the full mediation model. Our results suggest that customer satisfaction fully mediates the effects of perceived service quality and perceived value on customer loyalty, whereas perceived service quality directly influences perceived value. This study contributes to the literature by reconciling and synthesizing inconclusive findings from prior research.
Keywords
Introduction
Over the past two decades, customer loyalty formation has been a key research topic in the tourism and hospitality literature (C. H. C. Hsu et al., 2012; Kandampully et al., 2015; X. Li & Petrick, 2008; Qi et al., 2023; So et al., 2013). In addition to hotels (Afaq et al., 2023; Oh, 1999; So et al., 2013) and tourism destinations (Ribeiro et al., 2018; Su et al., 2017), researchers have sought to examine loyalty in related contexts, including restaurants (E. Kim et al., 2021), craft beer (Murray & Kline, 2015), coffee houses (Y. G. Choi et al., 2017), cruises (Castillo-Manzano et al., 2022; Han & Hyun, 2018), airlines (Akamavi et al., 2015), casinos (Baloglu et al., 2017; Shi et al., 2014), and resorts (Ahn & Thomas, 2020).
Early research in the mainstream marketing literature has consistently revealed strategic advantages of building customer loyalty, including lower marketing costs (Aaker, 1996; Uncles & Laurent, 1997), increased market share (Buzzell & Gale, 1987; Chaudhuri & Holbrook, 2001), and positive word of mouth (Dick & Basu, 1994; Dowling & Uncles, 1997). In the tourism and hospitality domain, scholars have suggested that “building a group of loyal customers is money in the bank for a hotel” (Bowen & Shoemaker, 2003, p. 31), highlighting the need to practice loyalty and retention marketing (Shoemaker & Lewis, 1999). Recent research has also pointed out that customer loyalty, from a practitioner perspective, is among the most enduring company assets and thus imperative to maintaining a loyal customer base (Gremler et al., 2020; Kandampully et al., 2015). Such well-documented benefits have resulted in a significant body of literature examining the mechanisms underlying customer loyalty. While recent research has expanded the determinants of loyalty formation to include more novel constructs, such as customer engagement (M.-W. Li et al., 2020; So et al., 2016), corporate social responsibility (Latif et al., 2020), and memorable tourism experiences (Kahraman & Cifci, 2023; J.-H. Kim, 2018), the most widely examined loyalty antecedents remain perceived service quality (Gong & Yi, 2018; So et al., 2013), perceived value (e.g., C.-F. Chen & Tsai, 2008; El-Adly, 2019), and customer satisfaction (e.g., Back & Parks, 2003; X. Li & Petrick, 2008). These fundamental forces represent the building blocks of loyalty formation.
Despite extensive research, scholars have presented inconclusive and often contradictory findings on specific linkages among the key components behind customer loyalty formation. For example, in addition to a direct effect, the literature has indicated that perceived service quality influences loyalty indirectly through customer satisfaction (Gong & Yi, 2018; X. Li & Petrick, 2010). Similarly, consumers’ value perceptions have been shown to exert indirect influences on loyalty through satisfaction (Han et al., 2011; X. Li & Petrick, 2010; Petrick, 2004). Other work has suggested that perceived value plays a mediating role between perceived quality and customer loyalty (Brodie et al., 2009; Nam et al., 2011). For a well-studied topic of crucial industry relevance, such inconsistent results may not only mislead practitioners when making strategic decisions but also potentially undermine the quality of subsequent conceptualization while encouraging a piecemeal approach to theory building. To provide informative conclusions about the interrelationships between key loyalty-related theoretical constructs, this study synthesizes the results of tourism and hospitality studies over a 15-year period (2006–2020) based on pooled data via meta-analytic structural equation modeling (MASEM) (Jak, 2015).
Meta-analysis combines results from individual studies to integrate their findings (Gremler et al., 2020; Khamitov et al., 2019). In an article published in Nature, Gurevitch et al. (2018) noted that, since the term meta-analysis and modern approaches to research synthesis were introduced in the 1970s, this statistical method has revolutionized research in many scientific disciplines, providing a way to establish evidence-based practice recommendations and resolve seemingly contradictory research outcomes. Meta-analysis has become particularly popular in consumer behavior research as a way to present more reliable and accurate quantitative estimates based on a large amount of information from different empirical studies (Eisend, 2015). Meta-analyses have also been used in several tourism and hospitality studies to better understand consumer behavior in these contexts (Shin et al., 2021; Tanford & Jung, 2017; Xu et al., 2020). However, such studies appear to have focused on the correlations between antecedents and a single outcome measure or variable; comparatively less attention has been paid to the various dependent relationships among constructs or variables, which are arguably essential for theory building.
Another major methodology issue in hospitality and tourism research is the use of different numbers of scale points in Likert-type-scale questionnaire items. Specifically, five- and seven-point Likert-type scales dominate in hospitality and tourism management, and a natural question arises: whether the number of scale points matters to measure various latent constructs. Previous studies provide conflicting results: whereas certain studies recognized an independence between scale point number and construct reliability (Bendig, 1954; Jacoby & Matell, 1971), some unveiled a positive relationship (L. Chang, 1994; Green & Rao, 1970). However, these studies have drawn conclusions mainly from a single survey design, and there is a lack of systematic comparison to synchronize this relationship from a large number of quantitative studies.
This study applies MASEM to establish a structural model between loyalty and the aforementioned constructs: customer satisfaction, perceived service quality, and perceived value. Also, we evaluate the comparability of five- and seven-point items based on effect size and reliability before pooling the results. The loyalty literature has framed these three constructs as evaluative judgment variables (Butcher et al., 2001) or service evaluation variables (F. Lai et al., 2009) that largely depend on consumers’ evaluations of a service offering or consumption experience. Essentially, these variables are conceptually distinct but interrelated loyalty determinants (K. S. Choi et al., 2004; Cronin et al., 2000; F. Lai et al., 2009); thus, a clearer understanding of their interrelationships with loyalty is warranted. These antecedents were included in MASEM for the following reasons: (a) Their respective relationships with loyalty are theoretically justified, thereby indicating conceptual significance; (b) a substantial body of literature in tourism and hospitality (C.-F. Chen & Chen, 2010; X. Li & Petrick, 2010; Oh, 1999, 2000; Petrick, 2004) and marketing (Brady et al., 2001; Cronin et al., 2000; Wang et al., 2004) enables a meta-analysis of the structural relationships between these three theoretical constructs and loyalty; and (c) research findings regarding these relationships are inconsistent, highlighting the need for a meta-analysis.
Unlike previous literature, in this study, we do not merely estimate the overall effect size and significance levels of the relationships between constructs; rather, we focus on calibrating a structural model to better synchronize our results. MASEM has been applied to various tourism research topics, such as the model of goal-directed behavior (Chiu & Cho, 2022), antecedents and outcomes of emotional labor (Xu et al., 2020), and theory of planned behavior and norm activation model (Manosuthi et al., 2020). By conducting a MASEM analysis, we can estimate a set of population parameters that better reflect the true value of relationships between these four constructs. The final structural model from MASEM offers insights into the causal chain that ultimately leads to customer loyalty, which has been a major focus of tourism and hospitality research for decades. Beyond our specific context, we hope similar efforts (i.e., to synthesize and empirically test the long-running debate around an important research area) will help render tourism scholarship even more useful (J. S. Armstrong & Green, 2018) and trustworthy (S. Siebert et al., 2015). Finally, we contribute to the hospitality and tourism literature by examining the result difference between five- and seven-point Likert-type items and providing generalizable results through synchronized quantitative results from a large sample of observations.
Literature Review
Number of Scale Points in Likert-Type Items
In early efforts to assess the attitudes of survey respondents, Likert (1932) developed a summated bipolar scale with five options: strongly approve, approve, undecided, disapprove, and strongly disapprove. Although the original scale includes five points in the option, Likert (1932) suggested that this number of scale points can be open to manipulation. Likert-type scaling assumes an interval scale of measurement to evaluate the latent continuous variable that reflects respondents’ attitudes, opinions, and preferences, and this discrete approximation requires a proper data analysis (Clason & Dormody, 1994). Some studies indicated that the number of scale points did not impact the construct reliability and validity (Bendig, 1954; Jacoby & Matell, 1971). The scale usually has an odd number, with the midpoint indicating “neutral” or “no opinion” toward a specific statement. R. L. Armstrong (1987) did not identify any statistical differences between the scores with and without a midpoint in the Likert-type scale.
Several studies recognized a systematic relationship between scale point numbers and constructs’ psychometric measures, such as construct reliability and validity. More scale points capture more complex nuances of the attitudes, lead to a larger variance, and collect more information needed for analysis (L. Chang, 1994). However, a larger number of scale points/options may lead to an increase in measurement error, especially when some response labels are associated with unclear meanings. Preston and Colman (2000) recommended a range on the number of scale points, and more than 4 but less than 11 points should be a good balance of reliability, user-friendliness, and efficiency. In a more recent study, Lozano et al. (2008) recommended the number of scale points to be between four and seven after assessing the reliability and validity under different scale points. Based on a Monte Carlo simulation, psychometric property generally improves as the number of scale points increases. From seven points onward, the marginal improvement on the property becomes very minimal. This result is consistent with the finding from the study by Green and Rao (1970), who found that information retrieval reaches a maximum on six- or seven-point scales, and little will be gained beyond seven. Specifically in tourism and hospitality management, Dolnicar et al. (2011) criticized using five- and seven-point scales due to response style bias and instability. Instead, the full binary answer format outperforms other formats with more scale points, as indicated by the very low level of base instability (Dolnicar & Grün, 2013).
Customer Loyalty
The concept of loyalty has traditionally been defined from three aspects: attitudinal, behavioral, and composite loyalty (Backman & Crompton, 1991; Fournier & Yao, 1997; Jacoby & Chestnut, 1978). In terms of behavioral loyalty, repeat transactions signal a customer’s loyalty to a brand or company (e.g., Chatfield & Goodhardt, 1975; Dunn & Wrigley, 1984; Ehrenberg et al., 2004; Uncles et al., 1995). Attitudinal aspects of loyalty include customers’ stated preferences and commitment or purchase intentions (Bennett & Rundle-Thiele, 2002). Combining these perspectives, composite loyalty refers to biased behavioral purchases resulting from a psychological process (Jacoby, 1971), suggesting that measures of customer loyalty should include attitudinal and behavioral components (Day, 1969; Dick & Basu, 1994; Jacoby & Chestnut, 1978; Lutz & Winn, 1974). Due to its ability to provide a more holistic view, composite loyalty has been subsequently adopted in various studies of customer or brand loyalty (Evanschitzky et al., 2006; Harris & Goode, 2004; X. Li & Petrick, 2008; Odin et al., 2001; Oliver, 1999; Rasoolimanesh et al., 2021).
Antecedents of Customer Loyalty
To gain insights into the cultivation of customer loyalty, researchers have investigated its antecedents. Numerous factors have been found to contribute to the formation of customer loyalty in service settings (Hwang et al., 2021; Khamitov et al., 2019); however, three determinants are considered as the focus of this study given their well-documented roles in fostering customer loyalty: customer satisfaction, perceived service quality, and perceived value, each of which is discussed below.
Customer Satisfaction
An important antecedent of customer loyalty is customer satisfaction (Cooil et al., 2007; Oh & Kim, 2017; Voss et al., 2010), which has been described as “essential for corporate survival” (Pizam et al., 2016, p. 3). While early research conceptualized satisfaction as a cognitive construct (e.g., Oliver, 1980), more recent definitions (e.g., Oliver, 1997; Olsen, 2002) frame the concept as an affective construct reflecting an emotional response to product acquisition and consumption (Bennett, 2001; Giese & Cote, 2000). Such an affective focus implies that satisfaction is the degree to which a consumer believes that possession of a product or use of a service evokes positive feelings (Rust & Oliver, 1994).
In conceptualizing the satisfaction–loyalty link, the literature holds that increased loyalty results from greater satisfaction (M. Kim et al., 2015; Thakur, 2019). For example, consumers form satisfaction judgments about brands they consume, which then explains why consumers become loyal to a brand (Fullerton, 2005). Conceptually, the attitude-based loyalty framework by Dick and Basu (1994) identified satisfaction as an affective antecedent of affective loyalty, labeling this antecedent “relative attitude.” The investment model in social psychology (Rusbult, 1980) also includes satisfaction as one of three key determinants of relationship commitment. Empirical research has substantiated the positive effects of customer satisfaction on attitudinal loyalty (Akroush & Mahadin, 2019; Han et al., 2011; Yuksel et al., 2010), behavioral loyalty (Nam et al., 2011; Yoon et al., 2010), and composite loyalty (Bridson et al., 2008; Ha et al., 2009; Harris & Goode, 2004; H. J. Kim, 2011; Shankar et al., 2003). In short, scholars generally agree that increased customer satisfaction influences customer loyalty directly.
Perceived Service Quality
In addition to customer satisfaction, another widely accepted loyalty antecedent is perceived service quality, defined as a consumer’s judgment about a product’s overall excellence or superiority (Zeithaml, 1988). Most definitions of perceived service quality are grounded in the disconfirmation paradigm (Grönroos, 1984; Lewis & Booms, 1983; Parasuraman et al., 1985, 1988), which posits that service quality is evaluated through a comparison of expectations and performance. Although service marketing scholars have conceptualized perceived service quality in numerous ways (e.g., Grönroos, 1984; Lehtinen & Lehtinen, 1982, 1991; Sasser et al., 1978), the most widely accepted conceptualization suggests assessing service quality on the basis of its five underlying dimensions: reliability, responsiveness, assurance, empathy, and tangibles (Parasuraman et al., 1988, 1991).
Empirical research has shown that perceived service quality directly affects a customer’s loyalty toward a product (Han et al., 2011; C. H. C. Hsu et al., 2012; M. Lee & Cunningham, 2001; Rauyruen & Miller, 2007). Proposed by Zeithaml et al. (1996), the model of the behavioral consequences of service quality suggests that high-level assessments of service quality lead to favorable behavioral intentions among consumers, such as enhanced company loyalty. A positive evaluation of service quality serves as the foundation upon which a consumer forms a favorable attitude toward a provider, therefore generating loyalty in the form of customer preference (de Ruyter et al., 1998). Research has also revealed service quality’s impact on customer loyalty (Caruana, 2002; Hussein et al., 2018) and related outcomes, such as purchase intention (Filieri et al., 2018; Rauyruen & Miller, 2007) and willingness to recommend (de Ruyter et al., 1998). In addition to the direct path from perceived service quality to loyalty, alternative arguments have also been made on quality-loyalty relationships. We will elaborate those in the “Competing Conceptual Models” section.
Perceived Value
Perceived value is often acknowledged as a key driver of loyalty. Most conceptual definitions are drawn from Zeithaml’s (1988) description of value as “the consumer’s overall assessment of the utility of a product based on perceptions of what is received and what is given” (p. 14). Accordingly, value represents the trade-off between a customer’s perceived costs and benefits of using a product (e.g., Anderson & Srinivasan, 2003; Cronin et al., 2000; Dodds et al., 1991; Grewal et al., 1998; F. Lai et al., 2009; S. Y. Lam et al., 2004; Petrick, 2002; Zeithaml, 1988). Marketing scholars have described value as a superordinate consumer goal that regulates consumers’ actions, such as their behavioral intentions related to loyalty (Sirdeshmukh et al., 2002). Furthermore, research has indicated that perceived value shapes revisit intention (Cakici et al., 2019; W. G. Kim et al., 2008; Petrick, 2004), commitment (Cakici et al., 2019; Han et al., 2011), and brand loyalty (e.g., P. T. Chen & Hu, 2010; Sirdeshmukh et al., 2002), thus highlighting the role of perceived value in building customer loyalty. Similar to perceived service quality, various forms of relationships have been proposed on the value-loyalty relationship, and the jury is still out on which one holds true.
Competing Conceptual Models
The preceding review suggests that customer satisfaction, perceived service quality, and perceived value can directly predict customer loyalty (depicted as Model 1 in Figure 1). In addition to such direct paths, perceived service quality has also been found to influence loyalty indirectly through customer satisfaction (Caruana, 2002; Chiou & Droge, 2006; Han et al., 2011; Harris & Goode, 2004; H. J. Kim, 2011; Wilkins et al., 2010; Yu et al., 2005). The framework of emotional self-regulation in the attitude–intention relationship, which consists of appraisal, emotional reactions, and coping, offers theoretical reasoning for this indirect effect (see the studies by Bagozzi, 1992; Lazarus, 1991). This framework holds that consumers form attitudes about product quality, leading to a global affective evaluation (e.g., satisfaction) that guides ultimate brand choice and loyalty (Olsen, 2002). This evaluative process results in a sequential chain effect of quality, satisfaction, and loyalty. Therefore, on the basis of the extant literature, perceived service quality exerts direct and indirect effects (through satisfaction) on loyalty (e.g., Baker & Crompton, 2000; Cronin et al., 2000; Ha et al., 2009; J. Lee et al., 2004; X. Li & Petrick, 2010; Petrick, 2004).
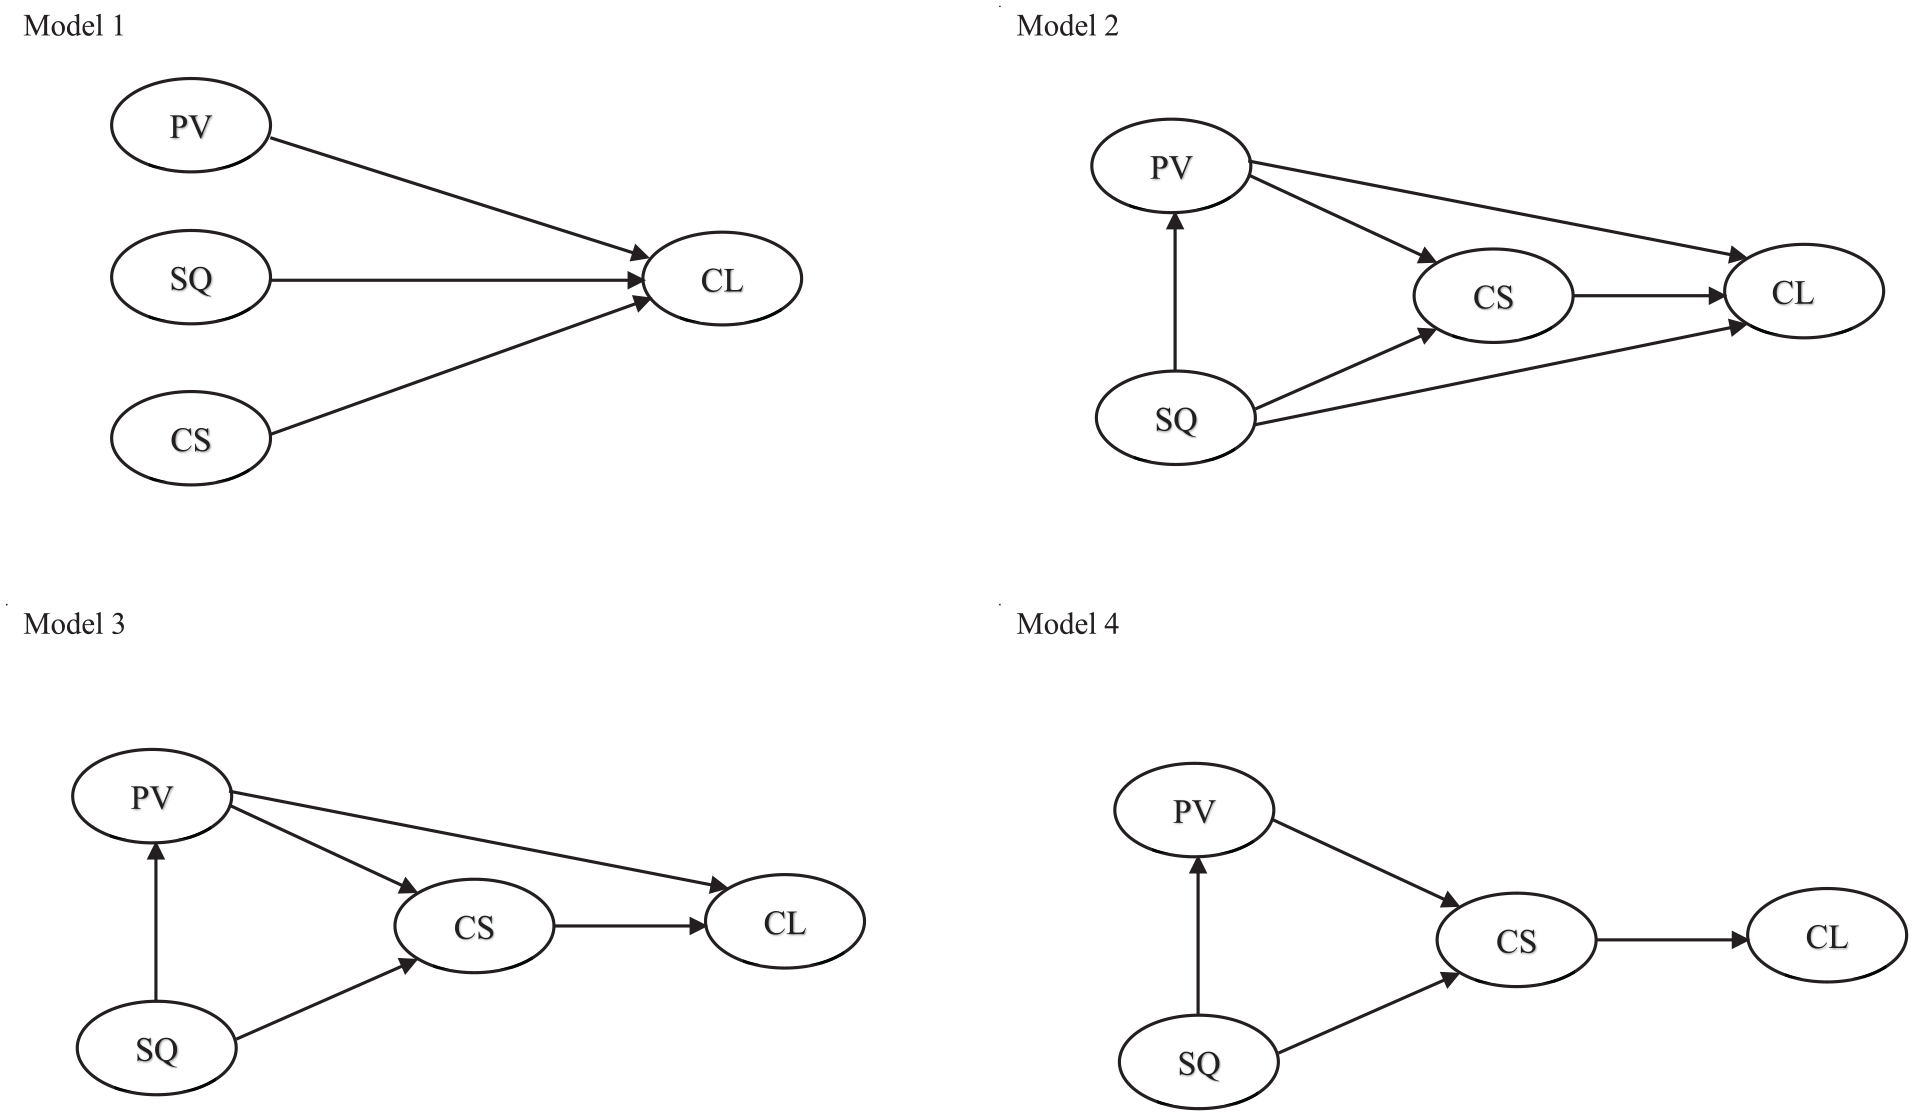
Proposed Competing Theoretical Models.
Similarly, some researchers have suggested that consumers’ value perceptions can also indirectly influence loyalty (through satisfaction). For example, F. Lai et al. (2009) found that perceived value affects overall satisfaction and loyalty intention, and overall satisfaction simultaneously drives loyalty intention, forming a partial mediation model. Such results have emerged in various research contexts, including hotels (Han et al., 2011; Hussein et al., 2018), restaurants (Tuncer et al., 2021), festivals (F.-C. Hsu et al., 2021), the cruise industry (Petrick, 2004), and services in general (Cronin et al., 2000). Furthermore, the trade-off between price and quality apparently leads to perceived value, which is a primary factor influencing purchase intention (T. Z. Chang & Wildt, 1994). Perceived value therefore mediates the effect of perceived quality on customer loyalty. Parasuraman and Grewal (2000) developed a conceptual framework illustrating that service quality leads to perceived value, which in turn generates loyalty. Other scholars have presented similar findings (Brodie et al., 2009; Harris & Goode, 2004; F. Lai et al., 2009; Nam et al., 2011) supporting the sequential chain of quality, value, and loyalty. These relationships comprise Model 2 in Figure 1.
While this literature review suggests that perceived service quality affects customer loyalty directly and indirectly through customer satisfaction (i.e., a partial mediation relationship), several studies have indicated that service quality affects loyalty only indirectly through customer satisfaction. For instance, scholars have noted that dimensions of service quality affect customer satisfaction, and customer satisfaction leads to customer loyalty, with no significant direct linkage between service quality and customer loyalty (Chao et al., 2015; Manimaran, 2010). Other researchers have found that the effects of service quality dimensions on customer loyalty are fully mediated by customer satisfaction because these effects are no longer significant when the direct effect of customer satisfaction is included (Priporas et al., 2017). Model 3 in Figure 1 illustrates this proposition.
Similarly, although the literature indicates that perceived value exerts a direct and indirect effect on customer loyalty (through customer satisfaction), some researchers have argued that perceived value exerts only an indirect effect on customer loyalty. For example, in restaurant settings, scholars found that perceived value affects customer satisfaction, which leads to behavioral intention; however, the direct effect of perceived value on intention was not hypothesized (Ryu et al., 2012). Another restaurant study revealed that perceived value fully mediates the relationship between service quality and customer satisfaction (I. K. Lai, 2015), as depicted in Model 4 in Figure 1.
Taken together, the foregoing literature review suggests at least four sets of conceptual relationships exist among the four constructs of interest. Each of the following models was tested in our meta-analysis: (a) Satisfaction, quality, and value each lead directly to loyalty (“Baseline, One-to-one Direct Model”); (b) satisfaction, quality, and value each have direct effects on loyalty, and the effects of value and quality on loyalty are partially mediated by satisfaction, and quality affects value (“Dual Partial Mediation Model”); (c) the relationships in Model 2 hold, but service quality does not directly affect loyalty (“Single Partial Mediation Model”); and (d) the effects of quality and value on loyalty are fully mediated by satisfaction, while quality affects value (“Full Mediation Model”). Figure 1 presents these models.
Methodology
In this study, MASEM was chosen as the analytical technique to examine the relationships between perceived quality, perceived value, satisfaction, and loyalty in tourism and hospitality research. A typical MASEM approach involves three primary steps (Viswesvaran & Ones, 1995): (a) identifying relevant research articles and collecting the correlations between constructs; (b) pooling correlation coefficients into a combined correlation matrix; and (c) estimating a SEM from the matrix.
To identify empirical literature on relationships between the four major constructs, we manually reviewed articles published in four top-tier hospitality journals from 2006 to 2020: International Journal of Hospitality Management, Journal of Hospitality & Tourism Research, Cornell Hospitality Quarterly, and International Journal of Contemporary Hospitality Management. We also looked at four top-tier tourism journals: Annals of Tourism Research, Tourism Management, Journal of Travel Research, and Journal of Tourism & Travel Marketing (Gursoy & Sandstrom, 2016). Although the sample of articles could have been extended to include more years of publication (e.g., Palmatier et al., 2006) or more journals (e.g., Peng et al., 2015), our chosen timeframe was considered appropriate to ensure a representative number of articles (Roberts & Camasso, 1991). A similar approach has been adopted in other meta-analyses in disciplines including education (Shih & Fan, 2008) and tourism and hospitality (Stepchenkova & Mills, 2010; Zhang et al., 2014), making it suitable for this study. Using the official publisher databases of each chosen journal, we examined the title, abstract, keywords, and model(s) presented in the articles published in each issue. Articles containing at least two of the four constructs, perceived quality, perceived value, satisfaction, and loyalty, were included in our meta-analysis.
Two coders screened and coded relevant information from each article independently, and another co-author randomly checked the coding results for quality assurance. Any discrepancies were discussed until a consensus was reached. In the preliminary screening process, journal articles were included in our sample if (a) the empirical analysis covered at least two out of four constructs of interest, and (b) either the inter-construct correlation coefficient or the standardized path coefficient was reported between these constructs. We also included studies that deconstructed perceived quality (or perceived value, satisfaction, or loyalty) as multiple constructs. For example, some studies included perceived quality of different aspects of services/products (e.g., perceived food quality and perceived service quality) as separate constructs without modeling an overall quality construct. In addition, some studies embraced attitudinal loyalty and behavioral loyalty instead of a composite loyalty construct. In such cases, the effect sizes based on these aspects were included, and therefore, a model can generate more than one effect size on the correlation between two constructs. These inclusion criteria resulted in 153 articles with SEM estimated coefficients for a combined total sample of 87,286 respondents.
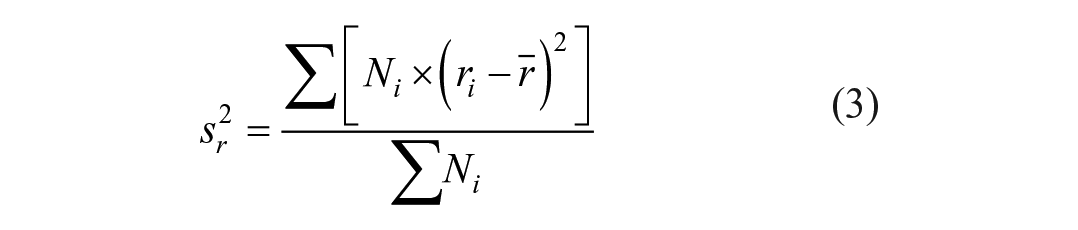
In this study, we selected the correlation coefficient as the effect size metric to synchronize empirical results. We coded the valid sample size of each SEM; the reliability coefficient, mean value, and standard deviation of each construct and the inter-construct correlation coefficient reported in each article. If the correlation coefficient was not presented, then we converted the path coefficient into a correlation using the following formula, as suggested by Peterson and Brown (2005):

where
Following the recommendation by Schmidt and Hunter (2014), we used a random-effects model to combine individual correlations into a mean effect size. Because construct measurement involved multiple-item scales with measurement errors, we corrected for these errors using the reliability coefficient of constructs reported in each study. If this coefficient was not reported, we replaced it with the sample average reliability coefficient. Furthermore, we obtained a final “pooled correlation” ( r̅ ) by weighting the reliability-adjusted correlation according to the sample size as follows (Schmidt & Hunter, 2014):

The standard error of r̅,
where
Results
Pooling Correlation Matrix
Figure 2 presents the distribution of reliability-adjusted correlation coefficients from the literature. Distributions of the correlations between loyalty and value, between loyalty and satisfaction, and between satsifaction and value are right skewed, indicating that large values dominate. The other three correlations were either relatively evenly distributed (e.g., the correlation between value and quality) or clustered around the center (e.g., the correlation between quality and satisfaction). The histogram further shows that the correlation coefficients covered a wide range, suggesting a large dispersion of these correlations across studies.
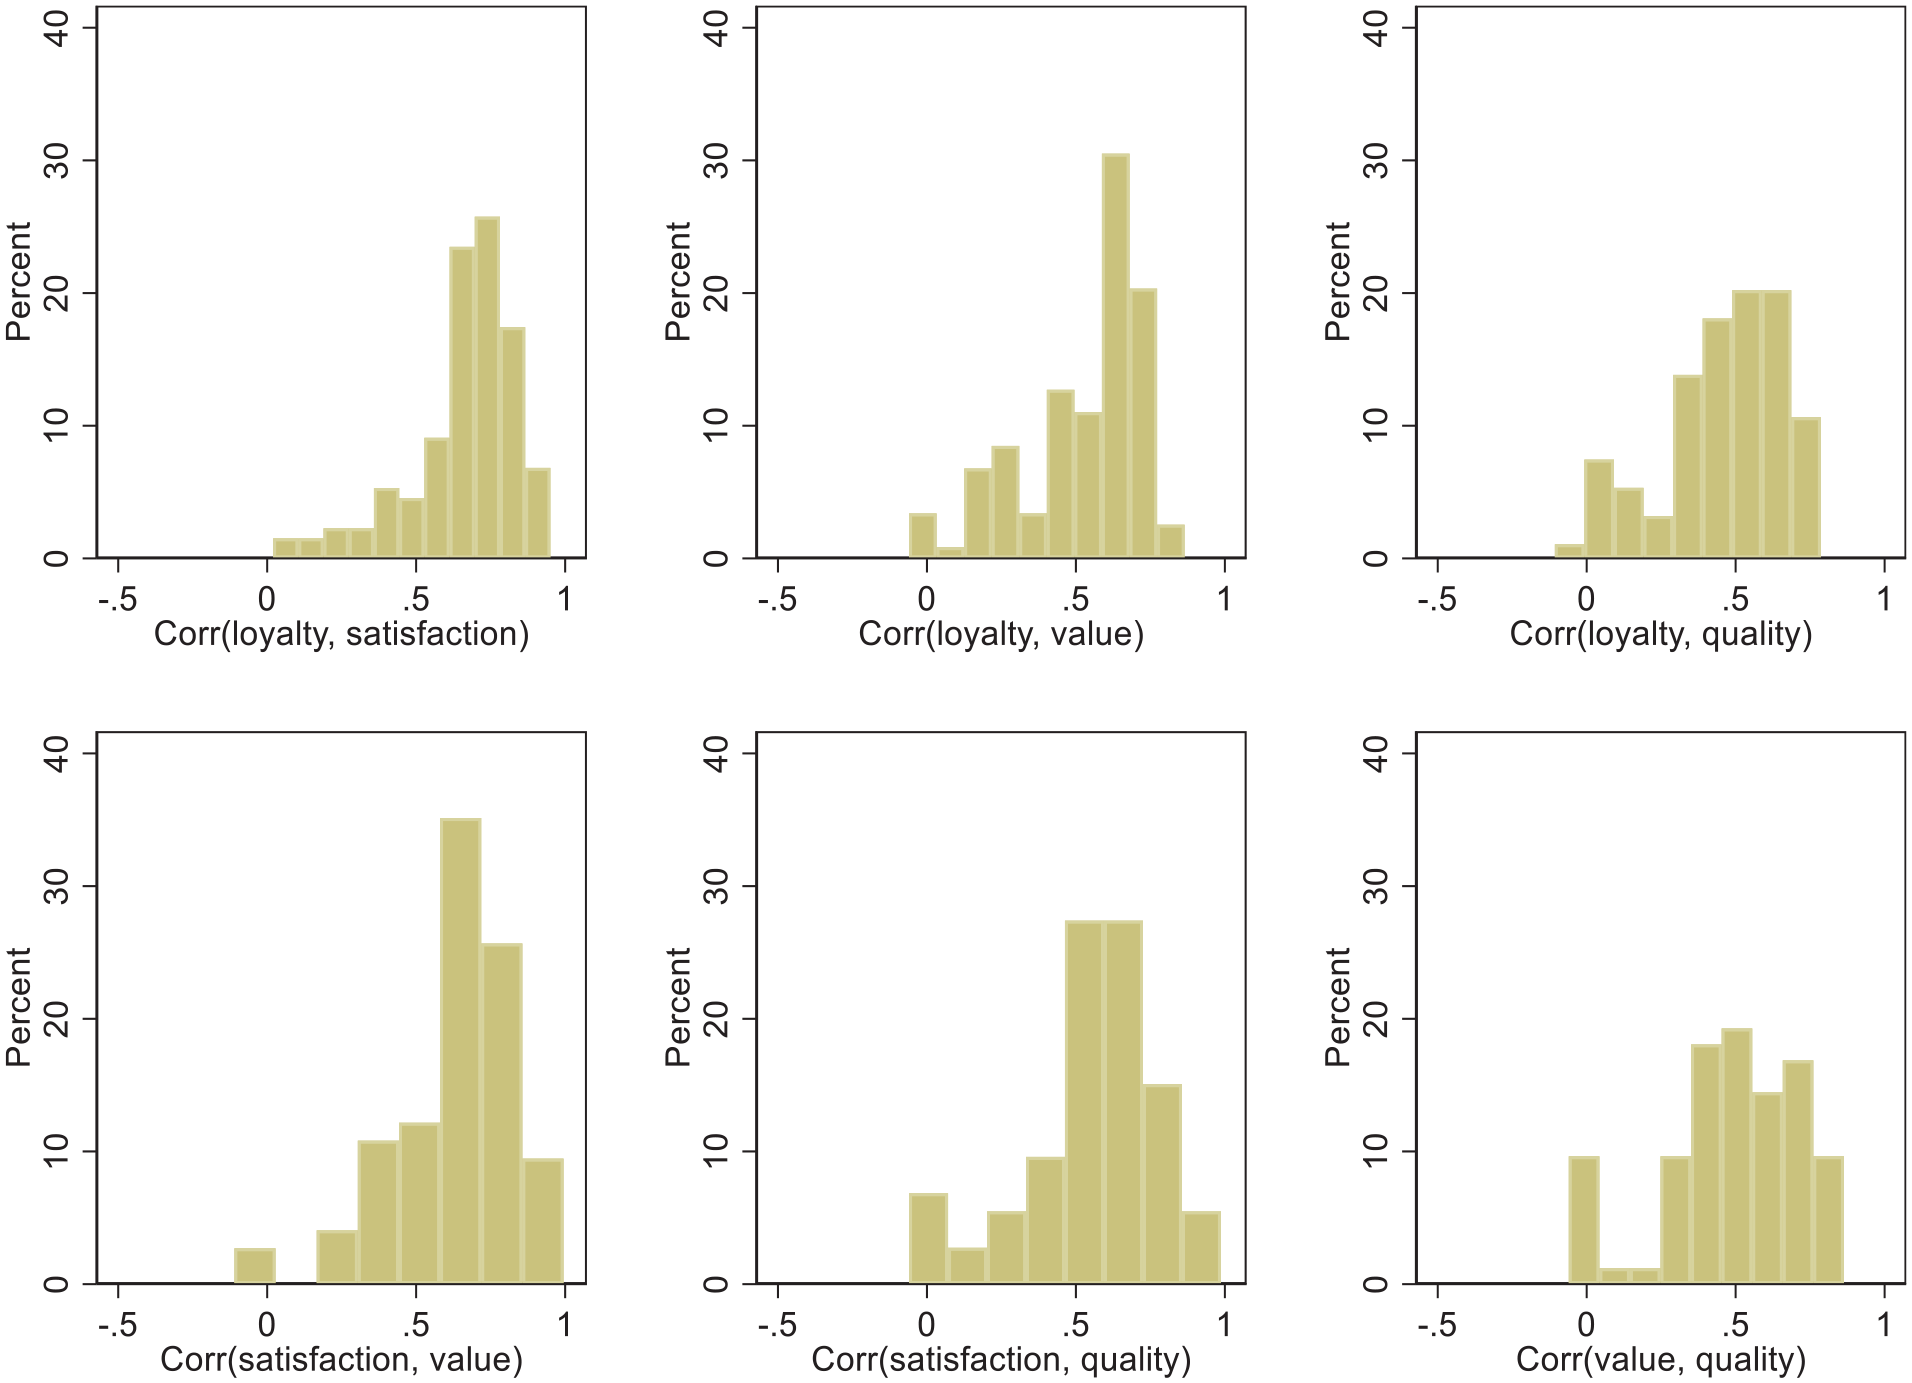
Histograms of Reliability-Adjusted Correlation Coefficients.
Table 1 presents statistics on the synchronized correlation coefficients among the four constructs: sample-weighted reliability-adjusted correlations, the standard deviation of correlation, 80% credibility intervals, 95% CIs, the proportion of variance attributed to sampling error, Q-statistics for heterogeneity, total sample size, and the number of observations. All correlation coefficients in Table 1 were positive and statistically significant at the .01 level. Based on all observations, the largest synchronized correlation coefficient was that between loyalty and satisfaction (.734), whereas the smallest was that between loyalty and value (.545). We also calculated pooled coefficients for various sub-samples: lodging, restaurants, and tourism and travel (see Table 1). Interestingly, the results show that all pairwise correlations, except that between loyalty and value, were higher in the lodging sample than in the restaurant sample. Also, the correlations between loyalty and value, between satisfaction and quality, and between value and quality were notably lower in the tourism and travel sub-sample. We noted heterogeneity of these correlation coefficients in different research contexts, as indicated by significant Q-statistics. For example, the correlation between satisfaction and quality was .922 in the lodging context but .601 in the tourism and travel context. The fail-safe number is 1,294, suggesting that another 1,294 studies are needed with an effect size averaging zero to make the results on the relationship between loyalty and satisfaction to reach an insignificant level. Given the sample size of meta-analysis in this study, this is unlikely to happen, confirming the stability of our results.
Descriptive Information on Synchronized Correlation Coefficients.
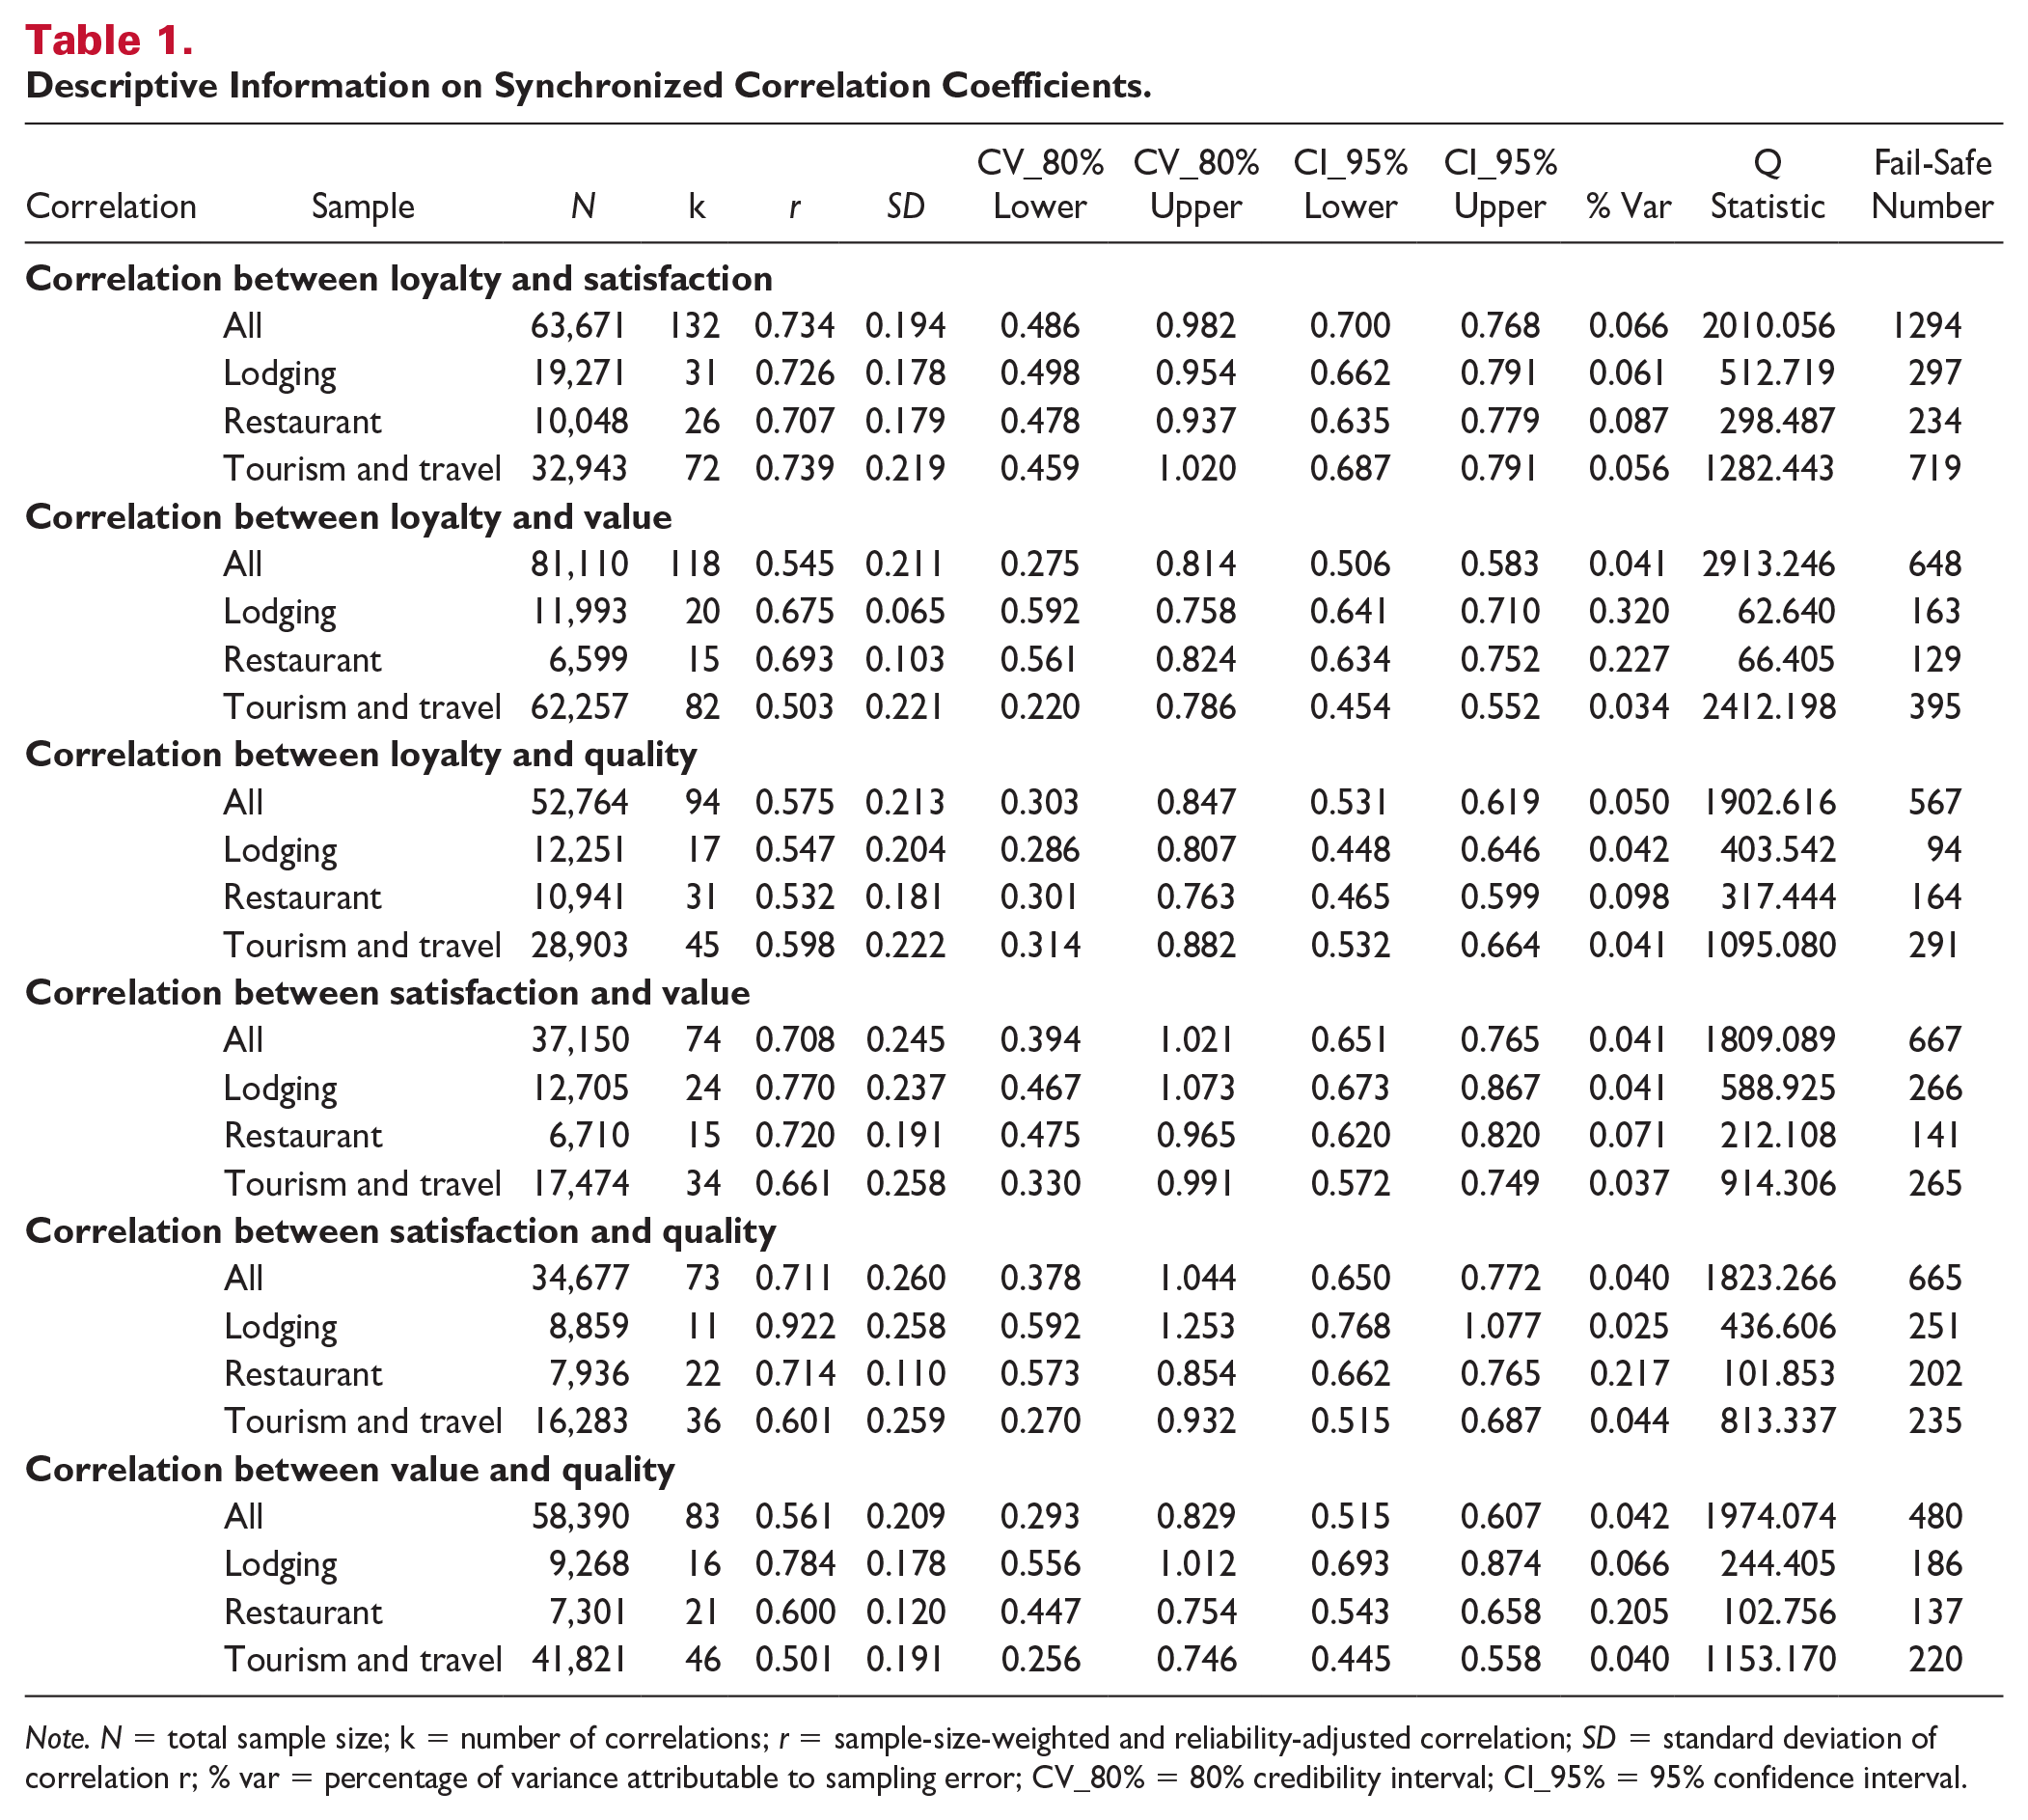
Note. N = total sample size; k = number of correlations; r = sample-size-weighted and reliability-adjusted correlation; SD = standard deviation of correlation r; % var = percentage of variance attributable to sampling error; CV_80% = 80% credibility interval; CI_95% = 95% confidence interval.
Comparison Between Five- and Seven-Point Items
We estimated a series of regressions to compare the reliability and correlation measures between five- and seven-point scales. Only studies using five- or seven-point scales were included in this comparison because only three studies used other point scales, such as 10- or 11-point scales. In the model, the major variable of interest is seven-point: Seven-point = 1 if a seven-point scale was used, whereas seven-point = 0 if a five-point scale was used. Also, we controlled lnsample (log of valid sample size), journal-specific effects, and year-specific effects in the model. In the first four columns of Table 2, we used the reliability score of different constructs as the dependent variable. Results indicate that while a seven-point scale provides higher reliability than its five-point counterpart for loyalty and satisfaction measures, this difference is not significant for value and quality constructs. In the last six columns of Table 2, the seven-point scale was estimated to be statistically insignificant in all of them, indicating that five- and seven-point scales generate similar correlational measures in all six types of correlation in the meta-analysis.
Results of Reliability and Correlation Comparison Between Five- and Seven-Point Scales.
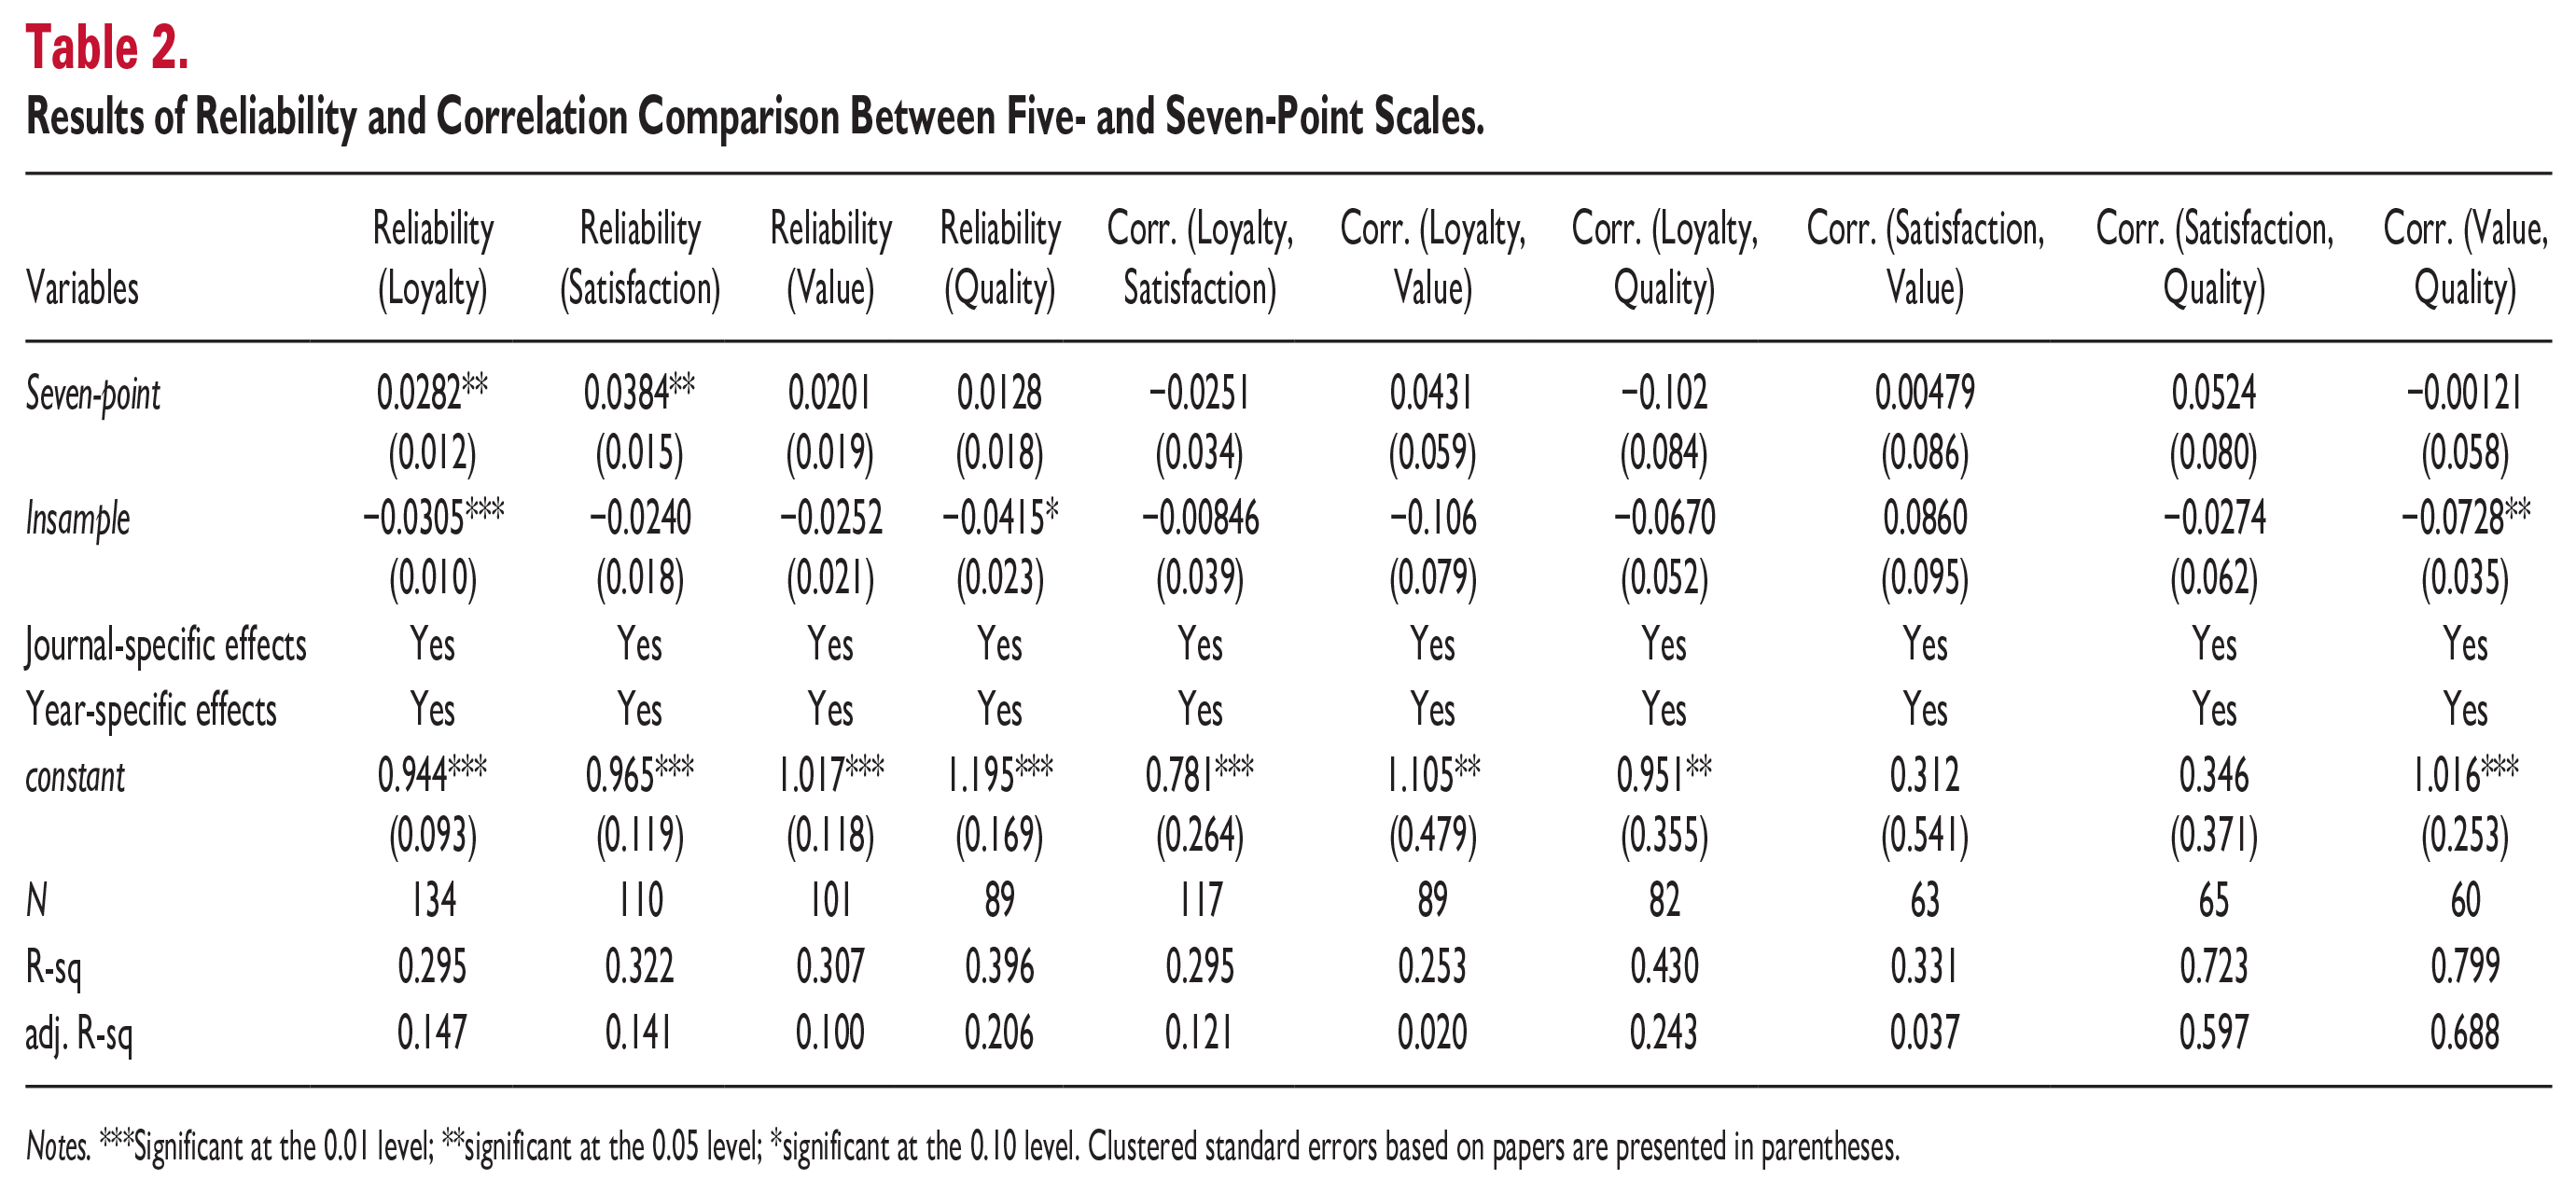
Notes. ***Significant at the 0.01 level; **significant at the 0.05 level; *significant at the 0.10 level. Clustered standard errors based on papers are presented in parentheses.
Fitting MASEM
After obtaining the corrected pooled correlation matrix, we used it along with factor means and standard deviations as input to fit SEM in MASEM (Cheung & Chan, 2005) via Mplus 7.11 (Muthén & Muthén, 2005). One statistical challenge that can occur when fitting MASEM involves determining an appropriate sample size; researchers have used different approaches to do so, such as the arithmetic mean (Carson et al., 1993; Verhaeghen & Salthouse, 1997), harmonic mean (Colquitt et al., 2000), median (Brown & Peterson, 1993), or sum of the sample sizes (Tett & Meyer, 1993) based on synthesized correlation coefficients (see Bergh et al., 2016; Cheung & Chan, 2005). Following the study by Bergh et al. (2016), the harmonic mean was adopted in this study because it limits the influence of very large values and increases the influence of smaller values in addition to being lower than the arithmetic mean in most, if not all, cases (see also the studies by Johnson et al., 2001; Landis, 2013). The harmonic mean is calculated by k/(1/N1 + 1/N2 + . . . + 1/Nk), where k equals the number of meta-analytic correlations, and N1 . . . Nk refers to each total sample size used to compute the corresponding meta-analytically derived correlation (Brown et al., 2008).
The results of testing synchronized bivariate correlations are listed in Table 1. The three loyalty antecedents were significantly correlated with customer loyalty, all with 95% CIs excluding zero: service quality (.575), perceived value (.545), and customer satisfaction (.734). Notably, although the correlation coefficients were significant and strong, these findings only offer an incomplete understanding and may not be consistent with those of MASEM (Bergh et al., 2016).
Having assessed the correlation matrix, we proceeded to test the four competing models depicted in Figure 1. Table 3 presents the model fit and direct and indirect effects of each model generated by Mplus. All the proposed indirect effects were estimated with bias-corrected bootstrapping (MacKinnon et al., 2002, 2004). We first examined the results of Model 1 (Baseline, One-to-one Direct Model), where each antecedent was directly related to customer loyalty, and the three antecedents were assumed to covary within a MASEM structure. The model coefficients are reported in Table 3. The hypothesized model was saturated, and the model fit was perfect. Upon considering the effects of predictors simultaneously, all three antecedents including service quality (β = .103, t = 23.94, p < .001), perceived value (β = .039, t = 8.89, p < .001), and customer satisfaction (β = .633, t = 135.05, p < .001) exerted a significant and positive effect on customer loyalty while their effects differ substantially.
Results of Model Comparison Based on MASEM.
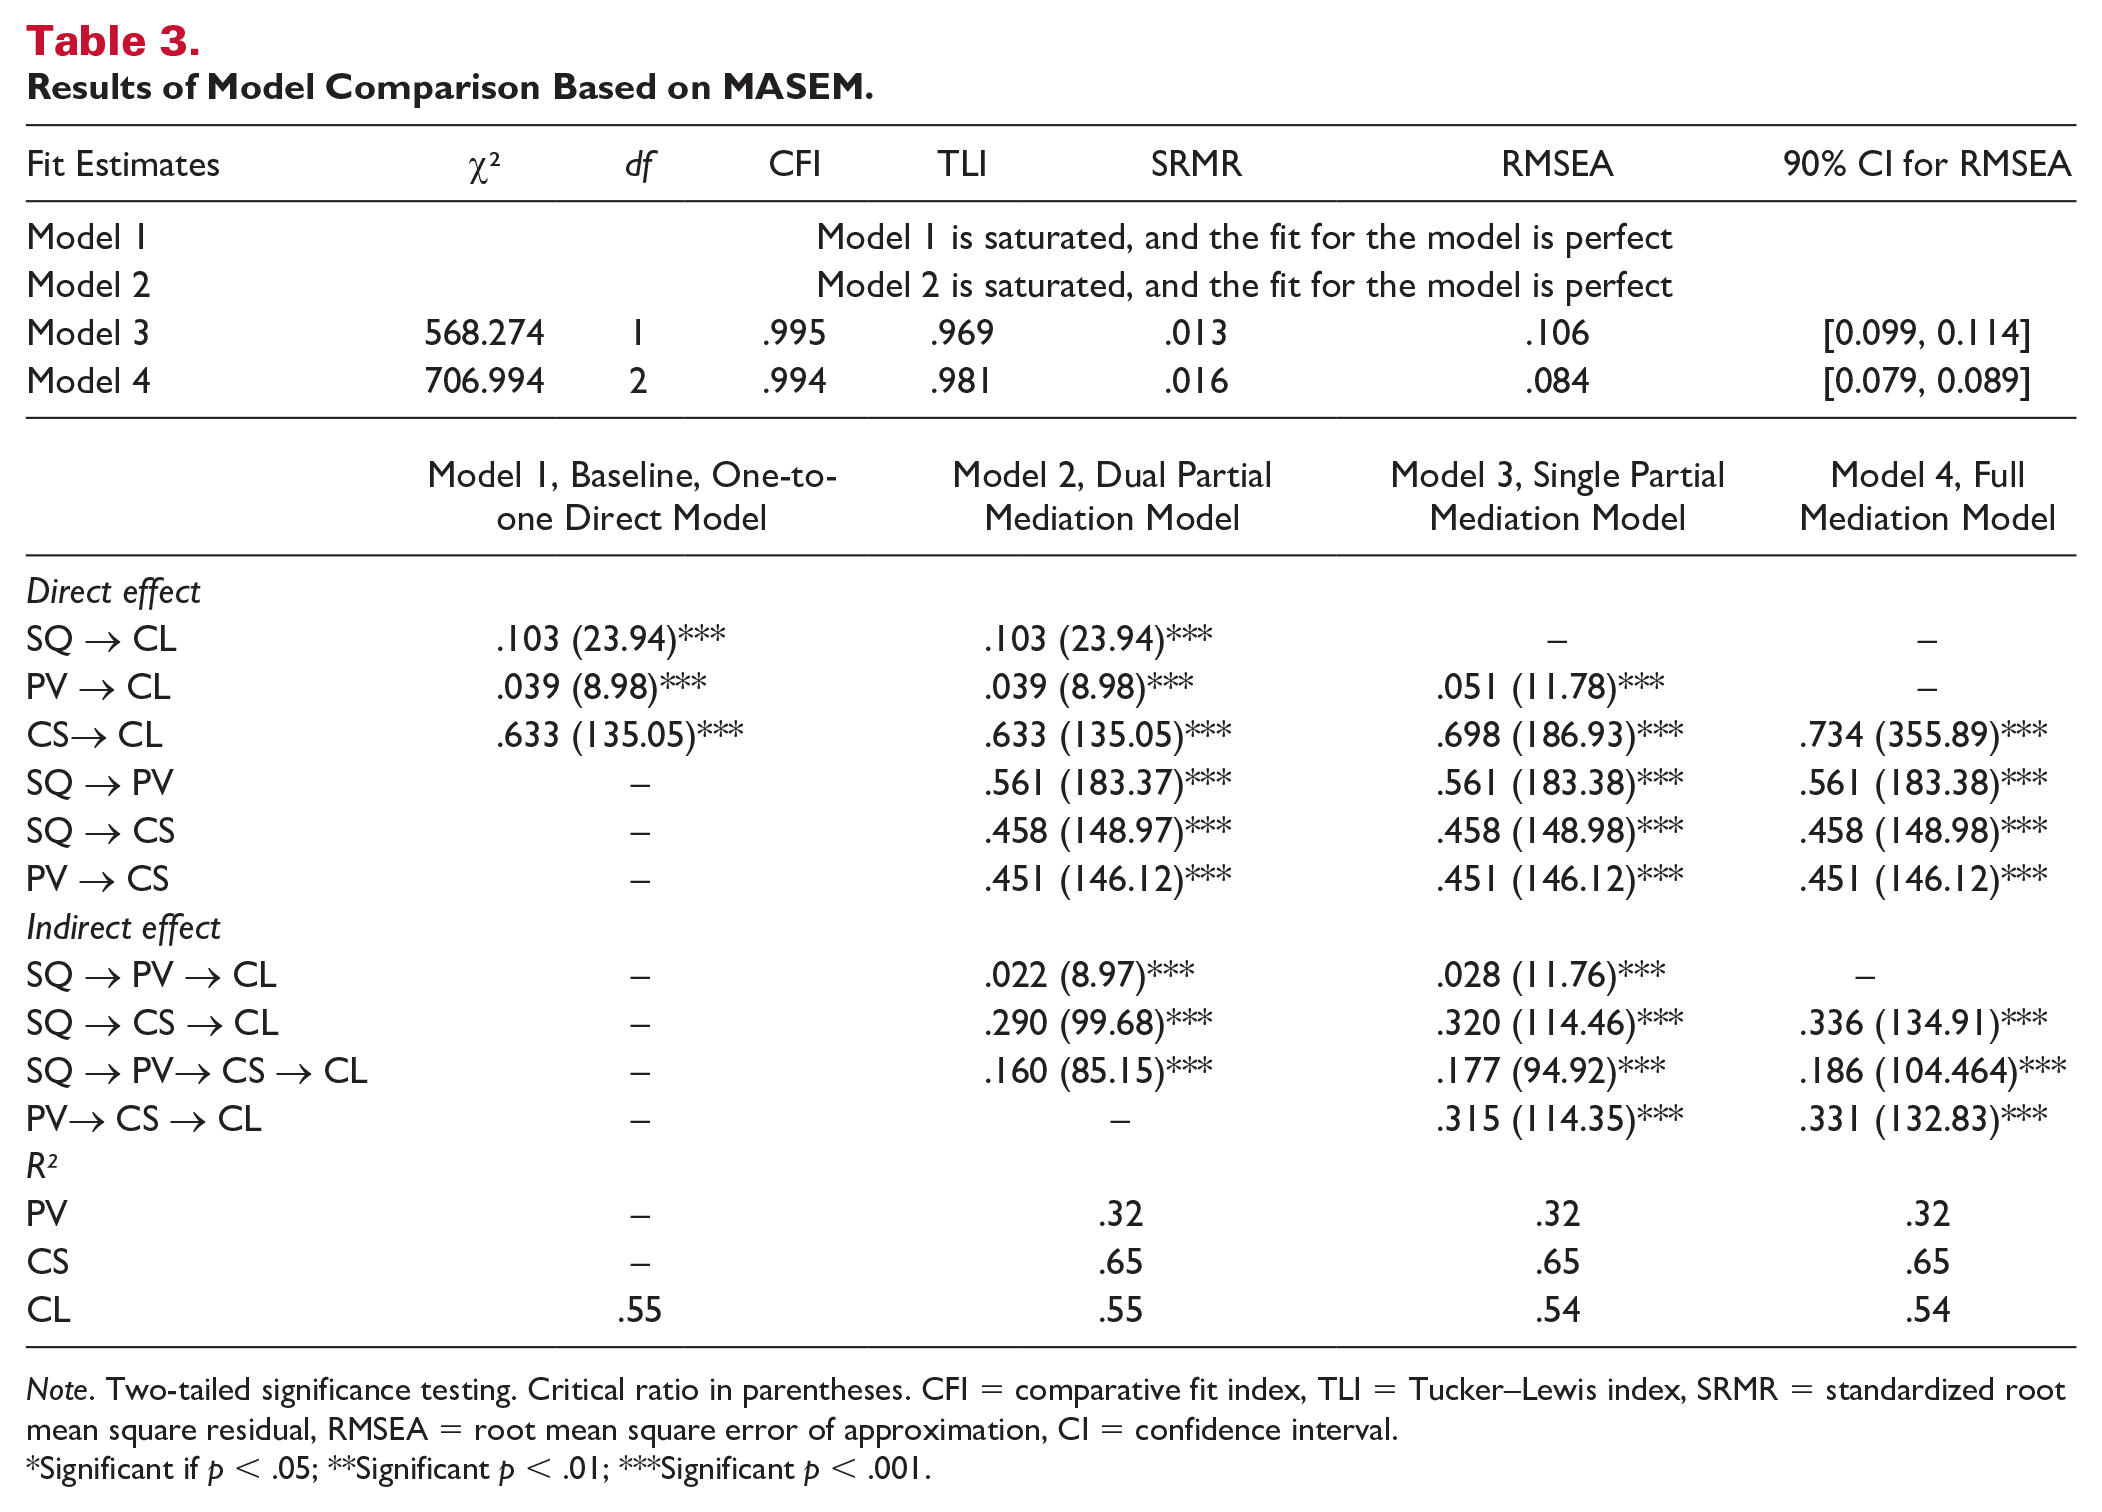
Note. Two-tailed significance testing. Critical ratio in parentheses. CFI = comparative fit index, TLI = Tucker–Lewis index, SRMR = standardized root mean square residual, RMSEA = root mean square error of approximation, CI = confidence interval.
Significant if p < .05; **Significant p < .01; ***Significant p < .001.
Model 2 (Dual Partial Mediation Model) was tested next. The findings in Table 3 indicate that the hypothesized model was again saturated, and the model fit was perfect. In terms of path estimates, service quality (β = .103, t = 23.94, p < .001), perceived value (β = .039, t = 8.89, p < .001), and customer satisfaction (β = .633, t = 135.05, p < .001) each exerted a significant and positive effect on customer loyalty. The indirect effects were significant and exhibited the expected directionality, with service quality positively influencing customer loyalty through perceived value (β = .022, t = 8.97, p < .001). A similar effect manifested from the service quality to customer loyalty path indirectly through customer satisfaction (β = .290, t = 99.68, p < .001).
With respect to Model 3 (Single Partial Mediation Model), in which the service quality to customer loyalty path was removed from Model 2 (Dual Partial Mediation Model), the hypothesized model produced a marginal fit (χ² = 568.274, df = 1, p < .01; comparative fit index [CFI] = .995; Tucker–Lewis index [TLI] = .969, standardized root mean square residual [SRMR] = .013, root mean square error of approximation [RMSEA] = .106, 90% CI = [.099, .114]), suggesting misfit. Among the path estimates, perceived value (β = .051, t = 11.78, p < .001) and customer satisfaction (β = .698, t = 186.93, p < .001) each had a significant and positive effect on customer loyalty, and service quality demonstrated a significant and positive effect on perceived value (β = .561, t = 183.38, p < .001). In addition, service quality (β = .458, t = 148.98, p < .001) and perceived value (β = .451, t = 146.12, p < .001) each had a significant and positive effect on customer satisfaction. The indirect effects were significant and demonstrated the expected directionality, with service quality positively affecting customer loyalty through perceived value (β = .028, t = 11.76, p < .001). A similar effect appeared from the service quality to customer loyalty path indirectly through customer satisfaction (β = .320, t = 114.46, p < .001), while perceived value had a significant indirect effect on customer loyalty through customer satisfaction (β = .315, t = 114.35, p < .001).
Next, Model 4 (Full Mediation Model) was estimated and produced a good fit (χ² = 706.994, df = 2, p < .01; CFI = .994; TLI = .981, SRMR = .016, RMSEA = .084, 90% CI = [.079, .089]). The path estimates indicated that customer satisfaction (β = .734, t = 355.89, p < .001) had a significant and strong positive effect on customer loyalty, and service quality had a significant and positive effect on perceived value (β = .561, t = 183.38, p < .001). As in the prior models, service quality (β = .485, t = 148.98, p < .001) and perceived value (β = .451, t = 146.12, p < .001) each had a significant and positive effect on customer satisfaction. The indirect effects were significant and performed as expected, with service quality positively influencing customer loyalty through customer satisfaction (β = .336, t = 134.91, p < .001). A similar effect appeared from the perceived value to customer loyalty path indirectly through customer satisfaction (β = .331, t = .132.83, p < .001). As Model 3 did not fit the data well, a chi-square difference test to compare Model 3 and Model 4 was deemed unnecessary. Based on the model fit and path estimates, the MASEM results suggest that Model 4 is superior to the other three hypothesized competing theoretical models. Figure 3 depicts the model and results.
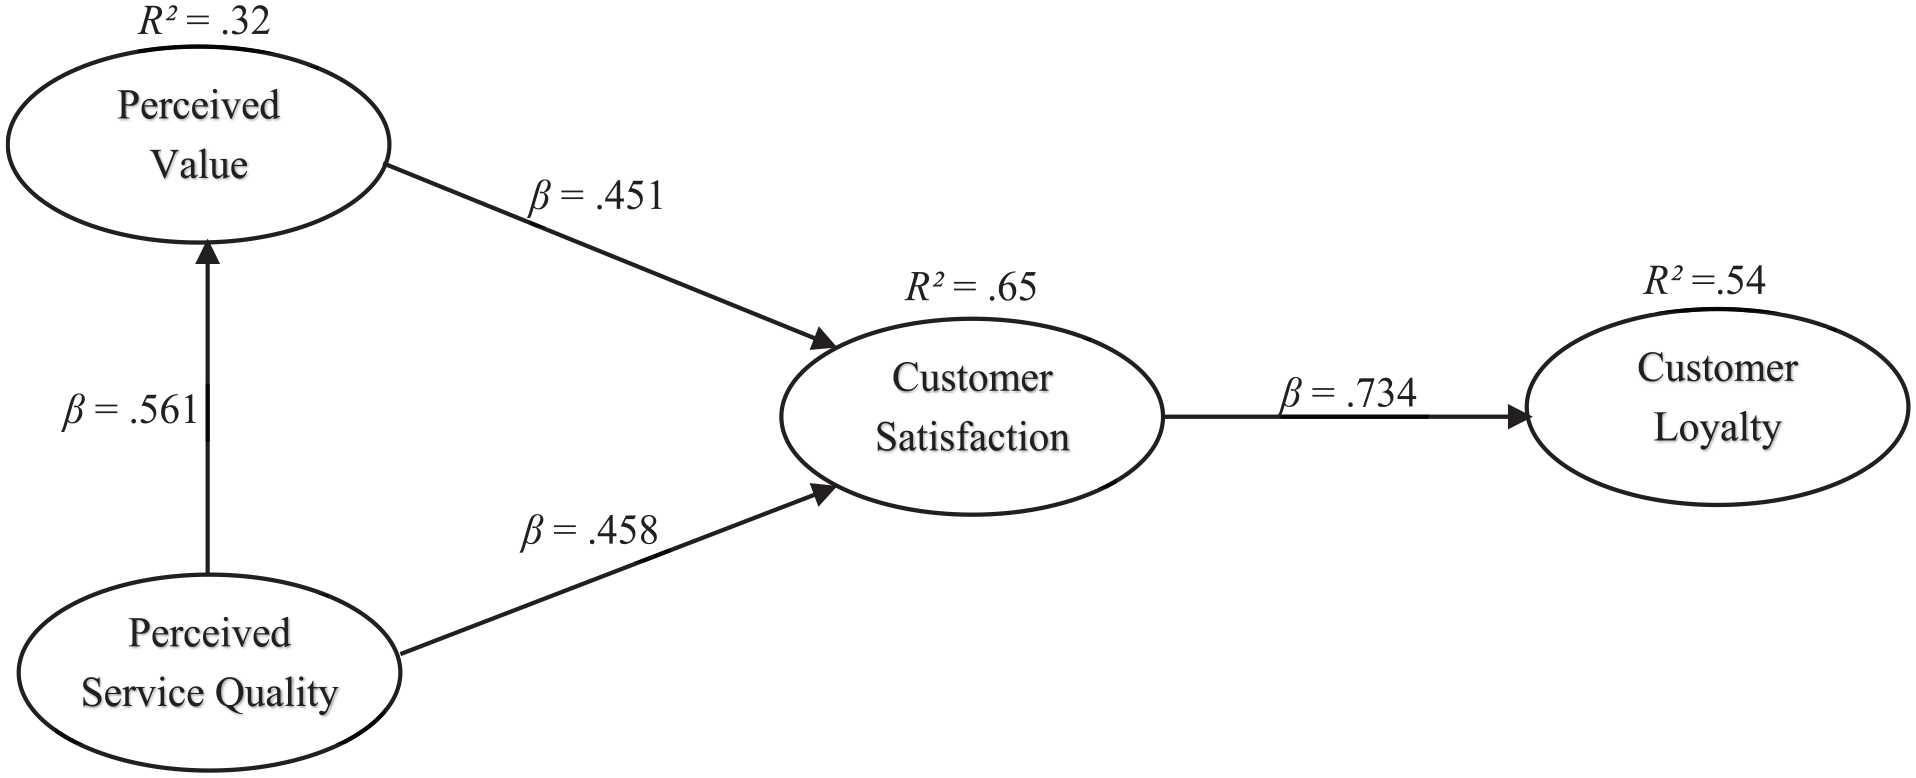
The Results of the Full Mediation Model.
Discussion
Through a comprehensive literature review and MASEM analysis, this study confirmed that customer satisfaction is a direct driver of loyalty. Service quality and perceived value positively affect customer loyalty through customer satisfaction, and service quality directly influences value. By accounting for measurement errors in construct operationalization, our results advance the literature by providing a robust empirical summary of the role of each building block of customer loyalty formation. Also, we recognized the fact that the use of different scale point numbers, five- vs. seven-point scale, does not lead to a different correlational measure.
Theoretical and Practical Implications
While past studies provided inconsistent results on the effect of point scale numbers on construct measures from individual surveys, we added new evidence after collecting a large number of survey results in hospitality and tourism research. If the focus of the study is on the correlational relationship between constructs, no significant difference was noticed between five- and seven-point scales. Also, we found statistical evidence that the seven-point scale can be associated with a higher level of reliability than the five-point one, which corroborates the findings from the study by L. Chang (1994). However, for some constructs (i.e., value and quality), this reliability improvement is statistically insignificant.
Prevailing wisdom holds that satisfaction, quality, and value each play a critical role in consumers’ loyalty-formation process, yet specific relationships among the four constructs remain inconclusive in the tourism and hospitality literature (C.-F. Chen & Chen, 2010; X. Li & Petrick, 2010; Petrick, 2004; Priporas et al., 2017). We also extended the meta-analysis results in the marketing literature (Carrillat et al., 2009) by adding perceived value as a construct, which plays a vital role in shaping tourist behavior. Although testing these relationships is not a novel pursuit, a meta-analysis of articles published in top-tier tourism and hospitality journals over a 15-year period offers a more comprehensive picture of this topic. Specifically, this study attempts to contribute to tourism scholarship from three perspectives.
First, our findings conclusively revealed how three key antecedents of customer loyalty are related in tourism and hospitality. To date, most studies examining customers’ brand-related perceptions have addressed or partly built upon relationships among satisfaction, quality, value, and loyalty, yet their linkages remain somewhat ambiguous. Such inconsistency has led to numerous relevant models and frameworks assembled through piecemeal approaches, all suggesting plausible but inconsistent relationships among related constructs. The lack of consensus has stalled theoretical development on customer perceptions and purchase decisions and has muddied managerial practices and performance evaluation. This study attempts to end much of the debate around four major constructs to offer clear directions for future theory building in this area.
Although the customer satisfaction–loyalty link has been universally supported (Cooil et al., 2007), the fact that the full mediation model outperformed competing models in our study highlights the indispensable role of satisfaction in loyalty formation. Furthermore, it was important to verify the role of satisfaction in loyalty building amid quality and value. Recent studies have shown that value (price) and quality are two prime drivers for building customer loyalty; as such, customer loyalty may be divided into quality- and value-based loyalty (Wieseke et al., 2014). Although our study supports this conceptualization, we found that at least some customers’ value perceptions of service offerings were based on quality; therefore, the quality- vs. value-based loyalty classification may not be mutually exclusive.
This study also revealed intriguing inter-relational patterns among loyalty, customer satisfaction, perceived service quality, and perceived value within specific tourism contexts (i.e., lodging, restaurants, and tourism). Most notably, correlations among the four constructs in the lodging context were considerably higher than those in restaurant and tourism settings, implying that these constructs are particularly interconnected when evaluating lodging services. Tourism and hospitality research is inherently context-sensitive, yet few studies have empirically compared differences across various contexts. To this end, our study calls for more comparisons delineating the characteristics of these three contexts.
Our results within a hospitality and tourism context share some differences from the results in general marketing. For example, we generated MASEM results of the four constructs based on the meta-analysis efforts on 184 publications with a sample from the study by Barari et al. (2021). The results provided in the Supplemental Materials show that the path coefficient between service quality and satisfaction in our study is twice as much as that in the general marketing sample, highlighting the vital role of service quality in shaping the satisfaction of hospitality and tourism consumers. Also, we recognize a larger coefficient between satisfaction and loyalty, underscoring a stronger satisfaction–loyalty relationship in the hospitality and tourism context.
Researchers may conduct meta-analyses for purposes beyond summarizing existing knowledge. An important objective of this study was to consolidate inconsistent results surrounding the relationships among four pertinent evaluative constructs in the tourism and hospitality literature. Scholars have proposed interesting concepts and scenarios that may influence loyalty formation: customers’ gender (Melnyk et al., 2009); level of engagement and membership history in a brand community (Thompson & Sinha, 2008); complementarity and substitution effects (Voss et al., 2010); and radical innovations (S. K. Lam et al., 2010). Loyalty formation is therefore increasingly viewed as a dynamic and complex process (Johnson et al., 2006). Examining the roles of emergent factors (moderators, mediators, or otherwise) requires a solid understanding of and general consensus regarding the fundamental relationships among loyalty, customer satisfaction, perceived service quality, and perceived value. This need further justifies the importance of this investigation.
From a managerial perspective, our findings can inform recommendations for effective loyalty formation in tourism and hospitality settings. Compared to prior studies that tended to rely on one-off surveys and single datasets, our study provides more definitive conclusions about the relationships among four of the most important customer perception constructs in the customer loyalty literature. Specifically, our results can offer companies clear guidance on which metrics to use and how to make resource-allocation decisions to foster customer loyalty. As a starting point, customer satisfaction fully mediates the effects of quality and value on loyalty; this result indicates that customer satisfaction remains the most fundamental determinant of loyalty formation and warrants the most attention and resource commitment. In addition to being a critical loyalty precursor, customer satisfaction plays an important role in transmitting the effects of other customer perceptual constructs on loyalty. Furthermore, to earn and sustain customer satisfaction, companies pursuing customer loyalty must invest in promoting service quality and value, as our findings reaffirmed that customer loyalty is fundamentally quality- or value-driven (Wieseke et al., 2014).
Even so, delivering quality and/or value alone cannot determine customer loyalty in the absence of customer satisfaction. Within the quality–value–satisfaction triangle, value is important because it drives satisfaction and affects how quality is associated with satisfaction. For organizations attempting to leverage competitive advantages by delivering superior quality or value, this finding supports a holistic approach to monitoring and maintaining quality, value, and satisfaction in customer loyalty building (Oh, 1999). Although increasing efforts have been made to understand constructs relating consumer-brand relationship (e.g., brand love or trust; Khamitov et al., 2019) and the unpredictability and inconsistency of customer journeys (A. Siebert et al., 2020), satisfaction, quality, and value remain the most fundamental and arguably “controllable” tools for a service provider to monitor consumer–firm interactions and service/experience performances. Measuring these yardsticks should promote effective and efficient marketing efforts among companies. In today’s marketing environment, a firm understanding of relationships among key loyalty antecedents should also help companies demonstrate the value of their loyalty-building strategies and ultimately enhance their marketing productivity (Hanssens & Pauwels, 2016).
Limitations and Future Research
Our findings are subject to several limitations, which reveal promising research directions. First, we specifically selected relevant articles from top-tier tourism and hospitality journals, potentially overlooking many articles from other sources. These selection criteria may be subject to publication bias in that researchers are less motivated to report “unfavorable” results for publication in top-tier journals (Card, 2015). Therefore, future studies could collect a more comprehensive sample of estimates from a variety of publications, including lower-tier tourism and hospitality journals, mainstream business journals, dissertations and theses, book chapters, and conference papers.
Second, the MASEM results in this study were based solely on relationships among customer satisfaction, service quality, perceived value, and customer loyalty; as such, our findings may not provide a complete understanding of the linkages between all relevant loyalty-formation factors in the wider nomological network. Additional conceptually and empirically relevant variables include destination image (Zhang et al., 2014), place attachment (Yuksel et al., 2010), and customer engagement (Hollebeek, 2011). In subsequent studies, a more holistic structural model could be estimated and tested using a similar meta-analysis that incorporates these additional factors. Similarly, results from hospitality and tourism studies can be formally compared with those generated in the mainstream marketing dicipline to offer further insights into conextual differences in loyalty formation.
Third, although the sample size of articles in this study exceeds that in most research involving MASEM (e.g., Butts et al., 2013; Hom et al., 1992; Jiang et al., 2012), our relatively small sample size could be more problematic in MASEM than in typical meta-analyses and may affect our overall results. In future work, scholars could consider extending the publication period under analysis.
Finally, because most (if not all) studies in our sample employed a cross-sectional design, the relationships calibrated from correlation coefficients captured these statistical associations. However, a causal relationship represents only one explanation for such correlation (Zhong et al., 2017). Therefore, future research may consider alternative methods to better unveil and triangulate causal relationships between major constructs of interest.
Conceptually, this study was partly inspired by the “replication” or “reproducibility” crisis (Maxwell et al., 2015; Pashler & Wagenmakers, 2012) facing the scientific community. Researchers in multiple disciplines, especially psychology and medicine, have advocated for a metascientific approach (i.e., applying scientific methodology to study science itself; Schooler, 2014) to demonstrate the validity of research findings and reinforce trust and integrity in the scientific domain (S. Siebert et al., 2015). We believe tourism and hospitality researchers should also take on this challenge, and the present study represents our own effort in this direction.
Supplemental Material
sj-docx-1-cqx-10.1177_19389655241276506 – Supplemental material for Fifteen Years of Research on Customer Loyalty Formation: A Meta-Analytic Structural Equation Model
Supplemental material, sj-docx-1-cqx-10.1177_19389655241276506 for Fifteen Years of Research on Customer Loyalty Formation: A Meta-Analytic Structural Equation Model by Kevin Kam Fung So, Yang Yang and Xiang (Robert) Li in Cornell Hospitality Quarterly
Footnotes
Acknowledgements
This research was conducted when the first author was a faculty member at Oklahoma State University.
Declaration of Conflicting Interests
The author(s) declared no potential conflicts of interest with respect to the research, authorship, or publication of this article.
Funding
The author(s) received no financial support for the research, authorship, or publication of this article.
Supplemental Material
Supplemental material for this article is available online.
Author Biographies
References
Supplementary Material
Please find the following supplemental material available below.
For Open Access articles published under a Creative Commons License, all supplemental material carries the same license as the article it is associated with.
For non-Open Access articles published, all supplemental material carries a non-exclusive license, and permission requests for re-use of supplemental material or any part of supplemental material shall be sent directly to the copyright owner as specified in the copyright notice associated with the article.