
Abstract
Based on the trade-off theory of capital structure and the information asymmetry theory of business financing, we evaluated the association of informal financing with the financial performance of small- and medium-sized enterprises (SMEs) in the restaurant industry. This study collected survey responses directly from small- and medium-sized restaurant owners (n = 178) during the COVID-19 pandemic. The findings of the study suggested that reliance on “family, friends, relatives, and third-party lenders” for financing was associated with lower financial performance during a crisis for restaurants. Results were robust when controlled for the owner’s gender, business affiliation, firm age, and relative firm size. Furthermore, we also found that the relative firm size of SMEs moderated this relationship such that, for mid-sized firms ($2–5 million annual revenues), the negative association with financial performance was lower than that for smaller firms (<$2 million annual revenue) and larger firms (>$5 million annual revenues). This article theoretically contributes to the literature by investigating the influence of informal financing on a firm’s performance, and the role of relative firm size within the category of SMEs in this relationship. Findings from the study provide practical guidance for SMEs and informal lenders.
Introduction
In a time when margins are historically tight in the restaurant industry, understanding strategies to optimize performance during a crisis can make a substantial difference in the ultimate survival of a business during a crisis. The COVID-19 pandemic impacted the restaurant industry in ways that even the most skilled strategists could not have anticipated. There is no way to predict when the next major crisis might occur, but restaurants will have the advantage of learning from the COVID-19 pandemic. Although recently there has been research to understand how restaurants adopted operational strategies during the COVID crisis, it is unclear how capital structure decisions could impact restaurants if another crisis was to occur.
Despite extensive interest in the capital structure decisions of large firms, corporate finance literature related to the capital structure decisions of small- and medium-sized enterprises (SMEs) is far less developed (Nguyen & Canh, 2020). Some general information about the capital structure decisions of SMEs is known. For instance, SMEs tend to rely on internal sources of financing (retained earnings) given that they suffer from greater information opacity than larger firms (López-Gracia & Sogorb-Mira, 2008). Formal debt is generally defined as financing from banks and financial institutions, and this financing is typically used by large firms. In contrast, SMEs often use informal debt, which is financing from sources other than banks and financial institutions (Lin & Sun, 2006). Informal financing can be less costly and more convenient to obtain than formal financing as the process of assessing project feasibility tends to be less scrutinous by lenders of informal financing (Lin & Sun, 2006; Nguyen & Canh, 2020). Although obtaining informal financing is easier, it often comes with trade-offs, such as impacts on innovation (negative) (Khan, 2015; Nguyen & Canh, 2020; Wu et al., 2016) and production (positive) (Lawal & Abdullahi, 2011). Businesses that are reliant on informal debt can also be more vulnerable in their risk profiles and may experience lower-than-normal returns than those that are more reliant on formal debt financing (Berger & Udell, 1998; Lin & Sun, 2006). This is because the collateral requirements of formal financing tend to attract lower-risk projects; however, it is unclear how this increased risk influences the financial performance of SMEs.
Although relationships among capital structure, firm size, and performance have been extensively studied (Fatima & Bashir, 2021; Muzir, 2011), the distinction between formal and informal sources in capital structure, especially for SMEs, is still fragmented and in its nascency. This results in a gap in our understanding of how informal financing impacts the success of SMEs. It also presents an opportunity for our study to address this gap by exploring the relationship between informal debt, firm size, and performance.
The increased risk due to informal financing could negatively impact a firm’s performance; however, the literature is also inconclusive in this regard. On one hand, the literature views informal financing as beneficial in reducing the cost of borrowing through relationships with friends, family, and other informal lenders (Adanlawo, 2021). Conversely, research has also suggested informal financing costs can be higher due to the shadow costs of these very relationships, such as social obligations owed to family members in case of default (Lee & Persson, 2016).
During a system-wide crisis, most businesses are negatively impacted by the added risk and uncertainty in the environment (Pearson & Mitroff, 1993). Given that reliance on informal debt is already associated with a higher-risk profile (Berger & Udell, 1998; Lin & Sun, 2006), SMEs that have relied upon informal debt (before a crisis) can be particularly vulnerable and may have a poorer performance during a crisis when the market uncertainty is increased. Accordingly, we investigated whether the SMEs that were more reliant on informal financing before a crisis experienced greater negative financial performance during the crisis (COVID-19 pandemic in our study).
Within the SME literature, there is a recognition of the relative size of SMEs—larger SMEs have greater access to resources than the smaller ones (Boter & Lundström, 2005; López-Pérez et al., 2017). It is unclear whether relative firm size (within the category of SMEs) will be of consequence in the relationship between informal financing choice and a firm’s performance. Filling this research gap could inform capital structure decisions and public policy.
The COVID-19 pandemic provides a unique opportunity to understand how precrisis capital structure decisions could be associated with a business’s financial performance during a crisis. The pandemic had a system-wide impact on businesses, and small- and medium-sized restaurants were severely impacted (Fairlie, 2020). According to the National Restaurant Association (2021), over 90,000 restaurants were either temporarily or permanently closed due to the COVID-19 pandemic. This also had a devastating impact on industry revenues (down $65 billion from 2019 to 2021) and on employment (down 1 million jobs from the prepandemic level to the end of 2021). A greater understanding of the impact of business decisions before the pandemic on pandemic-related financial performance could provide relevant stakeholders such as restaurant owners with a longer-term view of capital structure trade-offs. Based on the trade-off theory of capital structure and information asymmetry arguments, we hypothesize a negative relationship between restaurants’ reliance on informal debt financing before COVID-19 and their financial performance during this crisis. We further propose that such association will depend on the restaurant’s size within the category of SMEs, such that smaller restaurants will be at greater risk of financial losses than larger ones.
One of the challenges related to financing decisions of SME research is the unavailability of reliable and timely data, particularly in the hospitality industry. In this study, we collected primary data directly from SME owners who are responsible for making capital structure decisions. Our study, therefore, could provide more meaningful and reliable results that can guide industry practitioners and policymakers better in navigating businesses during a crisis.
Literature Review
SMEs make several important decisions that impact their financial performance in the short, medium, and long term (López-Gracia & Aybar-Arias, 2000). Financing is one such decision that determines the source of capital for SMEs (Hutchinson, 1995; López-Gracia & Aybar-Arias, 2000). While firms can choose to use a combination of debt and equity as their funding sources, SMEs often choose internal sources of funds and informal debt financing instead of formal debt financing or equity capital (Hutchinson, 1995; Nguyen & Canh, 2020). The two most relevant foundations for gaining insights into financing decisions in SMEs are the trade-off theory of capital structure (Scott, 1972) and the information asymmetry framework (Pettit & Singer, 1985). In the following sections, we present our rationale for using these foundations to enhance our understanding of how informal financing may influence SMEs’ performance.
Theoretical Foundations
The theoretical foundation for the use of debt by SMEs is the trade-off theory of capital structure (Ai et al., 2020). According to the trade-off theory of capital structure, firms face the cost-benefit trade-off from increasing leverage between the lower tax cost advantage (benefit) and the increased risk of bankruptcy (cost) (Kraus & Litzenberger, 1973). External debt offers several advantages for SMEs in their early growth stages. Debt financing allows SMEs to retain full control of their companies rather than diluting the company by issuing equity (Wu et al., 2007). Furthermore, equity financing can be costly (Berger & Udell, 1998) as investors will seek risk-adjusted returns on their investments through dividend payments (Mao & Gu, 2007). Debt also provides added tax advantages over equity financing as interest on debt is tax-deductible (Kemsley & Nissim, 2002).
While large businesses can source funds from formal debt financing, SMEs are often unable to procure such financing since they tend to face greater obstacles in obtaining formal financing than large businesses, often related to information asymmetry (Beck & Demirguc-Kunt, 2006; Cassar et al., 2015; Kurshev & Strebulaev, 2015). Information asymmetry exists when one party in a transaction possesses less information than the other party. In the current context, information asymmetries exist due to lenders having little information about the expected future performance of SMEs (Cassar et al., 2015; Krishnaswami et al., 1999). Formal lenders cannot properly evaluate the risk and feasibility of lending to SMEs. This creates uncertainty for formal lenders, resulting in the denial of requested financing. In the absence of formal debt and equity financing, SMEs are forced to rely on internal funds and informal debt (Lin & Sun, 2006; Nguyet, 2014). Factors that can prevent SMEs from obtaining formal debt include owner characteristics, business characteristics, location, and the ability of SMEs to provide collateral loan repayment guarantees (Le, 2012; Rand et al., 2009; Steijvers et al., 2010; Thanh et al., 2011). Although there is growing evidence about the factors that cause information asymmetries and how they can drive SMEs toward informal financing, there is a scant understanding of how informal financing impacts SMEs’ performance. We elaborate on those issues in the following section.
SMEs and Informal Debt Financing
When SMEs cannot access formal debt, they pursue internal financing and/or borrow funds from informal sources of debt (Berger & Udell, 1998). In this study, we define informal debt based on prior literature as two separate variables representing funding from “family, friends, relatives, and third-party lenders” (FFRL) and “trade creditors” or “purchases on credit from suppliers” (TRADE) (Nguyet, 2014). Even though both represent informal financing, the two sources are treated differently given that FFRL is primarily based on personal relationships, whereas TRADE (informal financing received through trade credit) provide a different perspective of business’ relationships with suppliers (Allen et al., 2019).
Informal debt is mostly dependent on the owner’s reputation and network, whether personal or business (Ji, 2009). This has advantages and trade-offs for SMEs. The advantage of informal debt is that businesses are able to circumvent stringent application requirements and collaterals necessary to obtain formal debt (Lin & Sun, 2006). Another advantage of informal debt is that relationships with friends and family can incentivize owners to create “reciprocal insurance,” thereby ensuring progress monitoring and repayment enforcement (Lee & Persson, 2016). One trade-off with informal debt is that informal lenders cannot fairly assess financial and market viability of the business given that informal debt is mostly based on the owner’s reputation and their relationships with the lender (Lin & Sun, 2006; Nguyet, 2014).
The association between using informal sources of financing and the financial performance of SMEs is inconclusive. The cost of informal debt can be lower than formal debt since relationship and reputational aspects can be beneficial for owners borrowing through informal sources (Adanlawo, 2021). An opposing argument is that informal debt, particularly from friends and family, can create shadow costs that eventually undermine the utility of such sources of financing (Lee & Persson, 2016). Limited research in this area found no significant difference in the overall financial performance between SMEs that used informal debt financing versus those that did not use such funding (Zarook et al., 2013). In addition to inconclusive evidence regarding informal debt’s impact on a firm’s performance, it is also unclear how businesses that are reliant on informal financing perform when external risks increase, such as during a market-driven crisis.
SME Restaurants and Capital Structure Decisions
Capital structure decisions of small restaurants and other small hospitality businesses remain relatively underexplored. One early study explored the various challenges such businesses can face in raising capital (Kwansa, 1994). Two recent studies focused on the capital structure decisions of restaurants. Altin et al. (2018) investigated the loan application decisions of foodservice businesses and found that factors such as owners’ net worth and sufficient liquidity reduced the likelihood of seeking external financing. Lin et al. (2020) also found that market information asymmetries impacted small- and medium-sized restaurants’ decisions to seek formal versus informal financing. Nevertheless, the literature studying the structure decisions of SME restaurants related to informal financing is scant.
Market Crisis and Informal Debt
There has been an extensive interest in studying the impact of debt on a firm’s performance. Higher debt (i.e., higher leverage) has generally been associated with higher performance given that fixed debt payments ensure that management remains operationally disciplined (Jensen, 1986; Ofek, 1993); however, higher levels of debt can also lead to greater business risks resulting in a higher risk of business failure (Iqbal & Kume, 2014). An increased use of debt commits firms to debt payments, thereby increasing fixed costs. Some of this business risk could translate into financial distress for a firm, even in “normal” (or noncrisis) times, due to the usual market uncertainty (Kaufman, 1986). During a crisis when market uncertainty is greater, the risk of bankruptcy for more leveraged firms (those with greater amount of debt than equity financing) could be higher. Although research suggests that the relationship between capital structure and financial performance can be impacted by a market crisis (Hossain & Nguyen, 2016), evidence in this line of research is mixed (Khodavandloo et al., 2017; Saleh et al., 2017).
Much of the evidence we have so far about the relationship between the use of debt financing and the risk of bankruptcy during a crisis is for public (large) companies and in the context of formal debt. Literature is relatively scant in exploring this relationship between the capital structure and financial performance during a market crisis for SMEs. Providers of informal financing do not typically scrutinize project viability to the extent that providers of formal financing do (Lin & Sun, 2006), so inherent latent risks in SMEs may remain unnoticed until a crisis occurs. Informal financing from FFRL would not be placed under high scrutiny due to the presence of shadow costs that could provide additional security in case of defaults (Nguyet, 2014). Informal financing from suppliers through trade credit (TRADE) would not require scrutinizing the viability of the project given the short-term purpose of such financing (Dornel et al., 2020; Nguyet, 2014). Consequently, the negative influence of risk due to reliance on informal financing from these two sources could become more pronounced during a market crisis. In view of the past research and this gap in the literature, we propose the following hypothesis:
Informal Debt Financing, Firm Performance, and Firm Size
Several factors impact the relationship between capital structure and a firm’s performance. One such factor is firm size. There are two possible explanations for the role that firm size plays in driving a firm’s capital structure decisions. First, larger firms tend to have greater access to equity markets and, therefore, are less reliant on debt financing (Ojah & Manrique, 2005; Panno, 2003). This could reduce the risk of bankruptcy due to debt financing for larger firms. Second, larger firms are able to lower their cost of capital by increasing debt using their size/resource advantage (Ang et al., 1982; Warner, 1977). Reduced cost of capital could help them better manage the risk of bankruptcy that usually accompanies increasing levels of debt. The literature that has investigated the moderating role of firm size in the relationship between capital structure and firm performance is limited to larger (publicly traded) companies and those with formal financing. It is unclear whether this relationship holds true for SMEs, particularly when these businesses are reliant on informal debt financing.
Ibhagui and Olokoyo (2018) found that a negative influence of debt on financial performance is more prominent for small firms and that there is a size threshold until which this effect holds. One view is that as firm size increases (allowing them to increase debt), so does their ability to make more investments, thereby increasing their profitability (Vithessonthi & Tongurai, 2015). Within the category of SMEs, size has been explored on a relative basis, distinguishing between smaller and larger SMEs (Boter & Lundström, 2005; López-Pérez et al., 2017). Most of the literature related to the relationships among leverage, firm size, and firm performance is focused on larger publicly traded firms. To the best of our understanding, these relationships remain underexplored in the context of informal debt financing. Accordingly, it is unclear whether the relative size of SMEs will moderate the relationship between informal debt (FFRL and TRADE) and financial performance. Given the challenges that SMEs encountered during the recent COVID-19 pandemic (Liguori & Pittz, 2020), it is both relevant and timely to investigate this relationship during a market crisis. We examined this relationship in Hypothesis 2:
Methods
Study Design and Data Collection
Prior research has shown that financial decisions are largely under the purview of business owners (Gibcus et al., 2009). Therefore, this study is novel in that it collected primary survey data directly from owners of small- and medium-sized business in the United States. This study used a primary survey design given the lack of financial information databases for small- and medium-sized restaurant businesses. Small- and medium-sized restaurants were defined as those with less than $11 million of annual sales (U.S. Small Business Administration, 2017). Data were collected using Dynata panels. Dynata is a provider of data, products, and services using proprietary technology and is able to collect primary data from a wide variety of population groups. Data were collected from July 17 to August 31 2020. Restaurant or café business owners and those self-employed in their businesses who were in the age range of 21–70 years across all segments of the industry were targeted for this study. Attempts were made to keep the sample representative based on gender, race, and age. A total of 1,602 potential SME owners were qualified to respond to the survey, and 181 complete surveys were collected (11% response rate). The final sample size was 178 surveys with usable observations. The descriptive statistics of the study sample are presented in Table 1.
Descriptive Data and Bivariate Correlation Analyses.
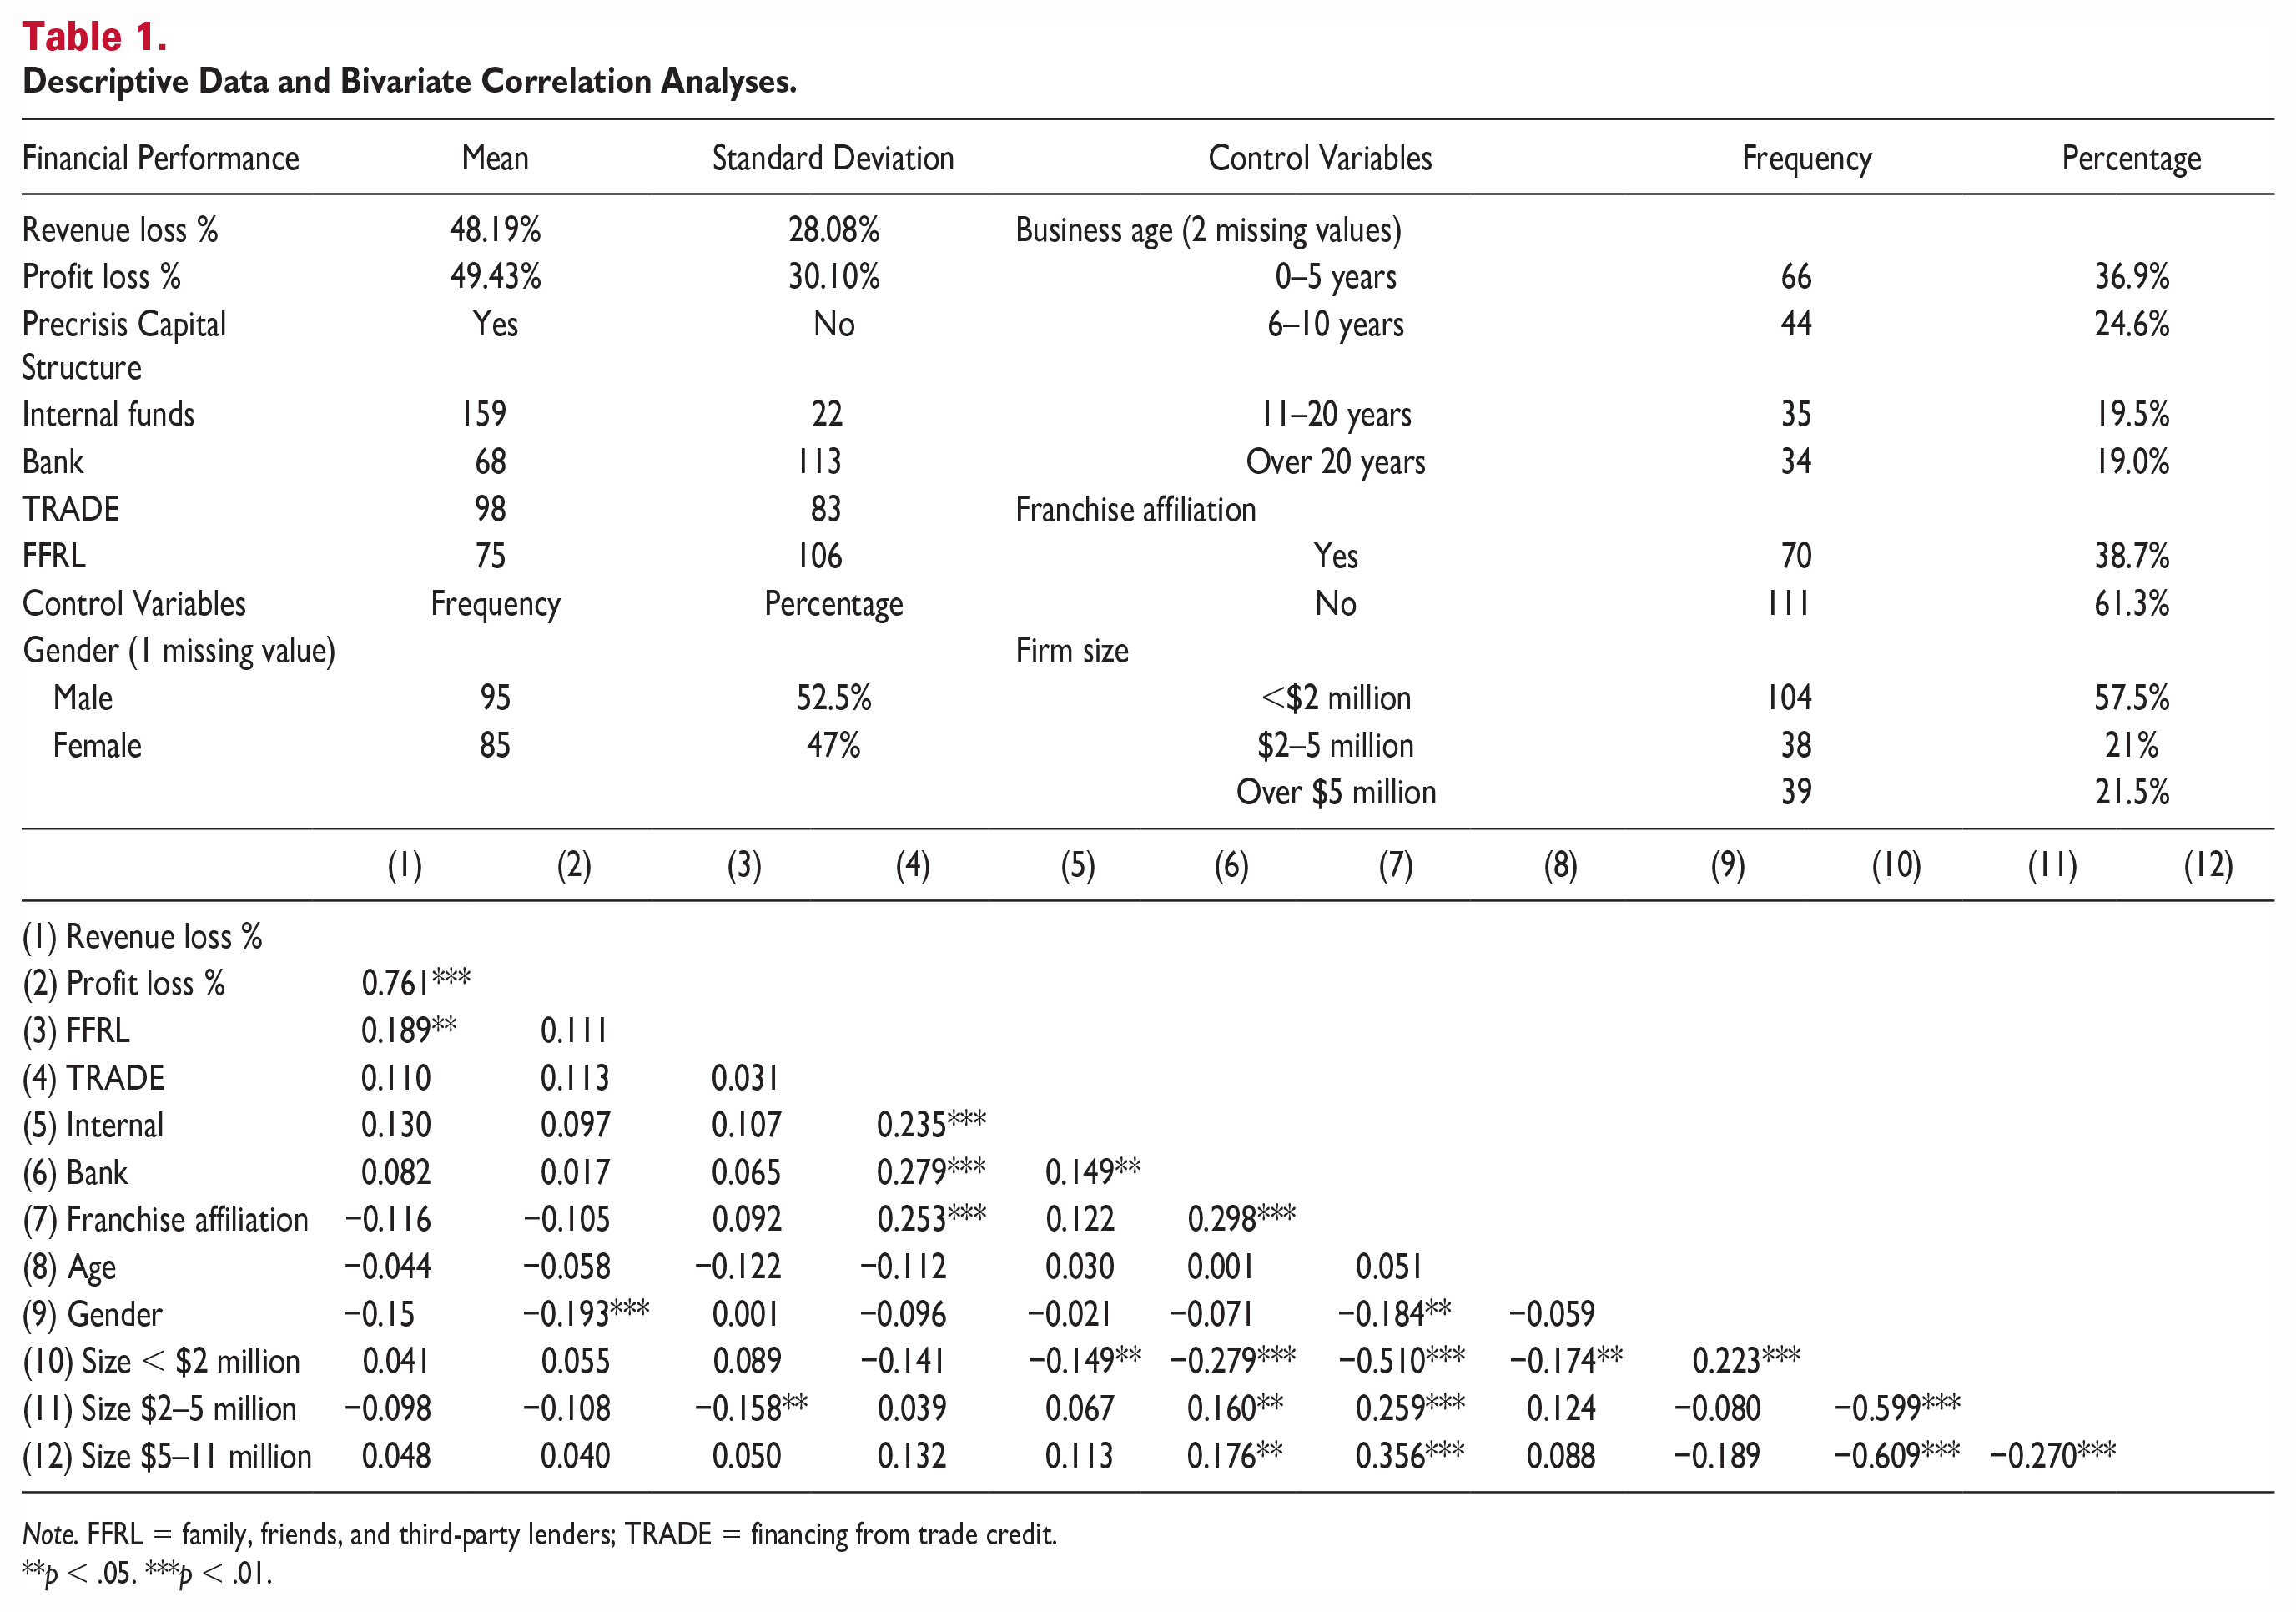
Note. FFRL = family, friends, and third-party lenders; TRADE = financing from trade credit.
p < .05. ***p < .01.
Survey Instrument
The key variables representing the capital structure in this study were based on variables obtained from the World Bank Enterprise Survey (WBES) (2018). The WBES has been collecting data from SMEs around the globe since 2005, and since then, it has collected over 174,000 observations. For this study, informal financing was included as two separate variables, one measuring funding received from FFRL and the other measuring funding received from TRADE (Nguyen & Canh, 2020; WEBS, 2018). Funds borrowed from banks (private and state-owned) represented formal financing. In addition to external financing, internal funds are also a part of the capital structure; therefore, the use of internal funds (“internal funds and retained earnings”) was also included in the models (WEBS, 2018). While the WBES captures the proportion of capital structure from each source, this study measured capital structure decisions using categorical response variables (yes/no) (Bridges & Disney, 2010; Sweet et al., 2018). While the proportion data would have provided a more objective assessment of capital structure weights, the decision to use categorical variables was made given that self-reported financial data can be biased due to social desirability, memory decay, and/or common method bias (Rauch et al., 2009). The WBES conducts interviews with SMEs to manage these biases. Given that this study used a self-reported survey design, the decision was made to use categorical response variables.
The key dependent variables of financial loss or financial performance (Ali & Aulia, 2015) used in this study were also adopted from prior literature. Financial performance during the COVID-19 pandemic was measured by asking respondents whether their businesses experienced a loss in revenue or profitability, measured as the percentage loss for both indicators (WEBS, 2018).
Control variables were also included in this study given their impact on financing options available for SMEs. We used the owner’s gender (Nguyen & Canh, 2020), restaurant’s franchise or management affiliation (Sveum & Sykuta, 2019), restaurants’ age, and size of the restaurant (annual sales) (Valtakoski & Witell, 2018) as control variables. This study also examined firm size as a moderator to test Hypothesis 2. Firm size was measured as a categorical variable with three categories of annual sales: less than $2 million, $2–5 million, and $5–11 million using the U.S. Small Business Administration’s (2017) definition of SMEs based on revenues.
Data Analysis
The primary dependent variables of financial performance in this study were the loss of revenue and profitability during the COVID-19 crisis, measured as percentages. All analyses were conducted using SPSS version 26.0 and STATA version 16.0. Data were analyzed using ordinary least square regression models. Linear regression models were specified as follows:
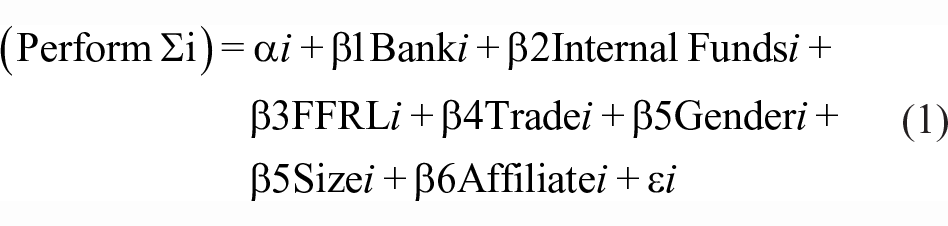
where “Perform” represents the two dependent variables of percentage loss in revenues and profitability; “bank” represents formal sources of financing; “internal funds” represent the firm’s liquidity; “FFRL” and “TRADE” represent informal financing, the main variables of interest (H1a and H1b, Models 1 and 2); and control variables are represented by gender, size, and affiliation. H2a and H2b were tested by including interaction terms between FFRL and TRADE variables and each of the firm size categories (Models 5 and 6).
Robustness results were consistent with those of linear regression models, and the latter are reported in Tables 2 and 3 as the main results. Furthermore, we conducted sensitivity analyses using two different approaches: First, given that the main analysis for Hypotheses 1 (a & b) and 2 (Models 1, 2, 5, and 6) used firm size of “less than $2 million” as the reference category, we changed this reference category to “$5–11 million” (Models 3, 4, 7, and 8); second, a sensitivity analysis was conducted by removing all control variables (Models 9 and 10) and by assessing the direct relationship between the two variables of interest representing informal financing (FFRL and TRADE) (Models 11 and 12).
Results for Hypothesis 1 (n = 178).
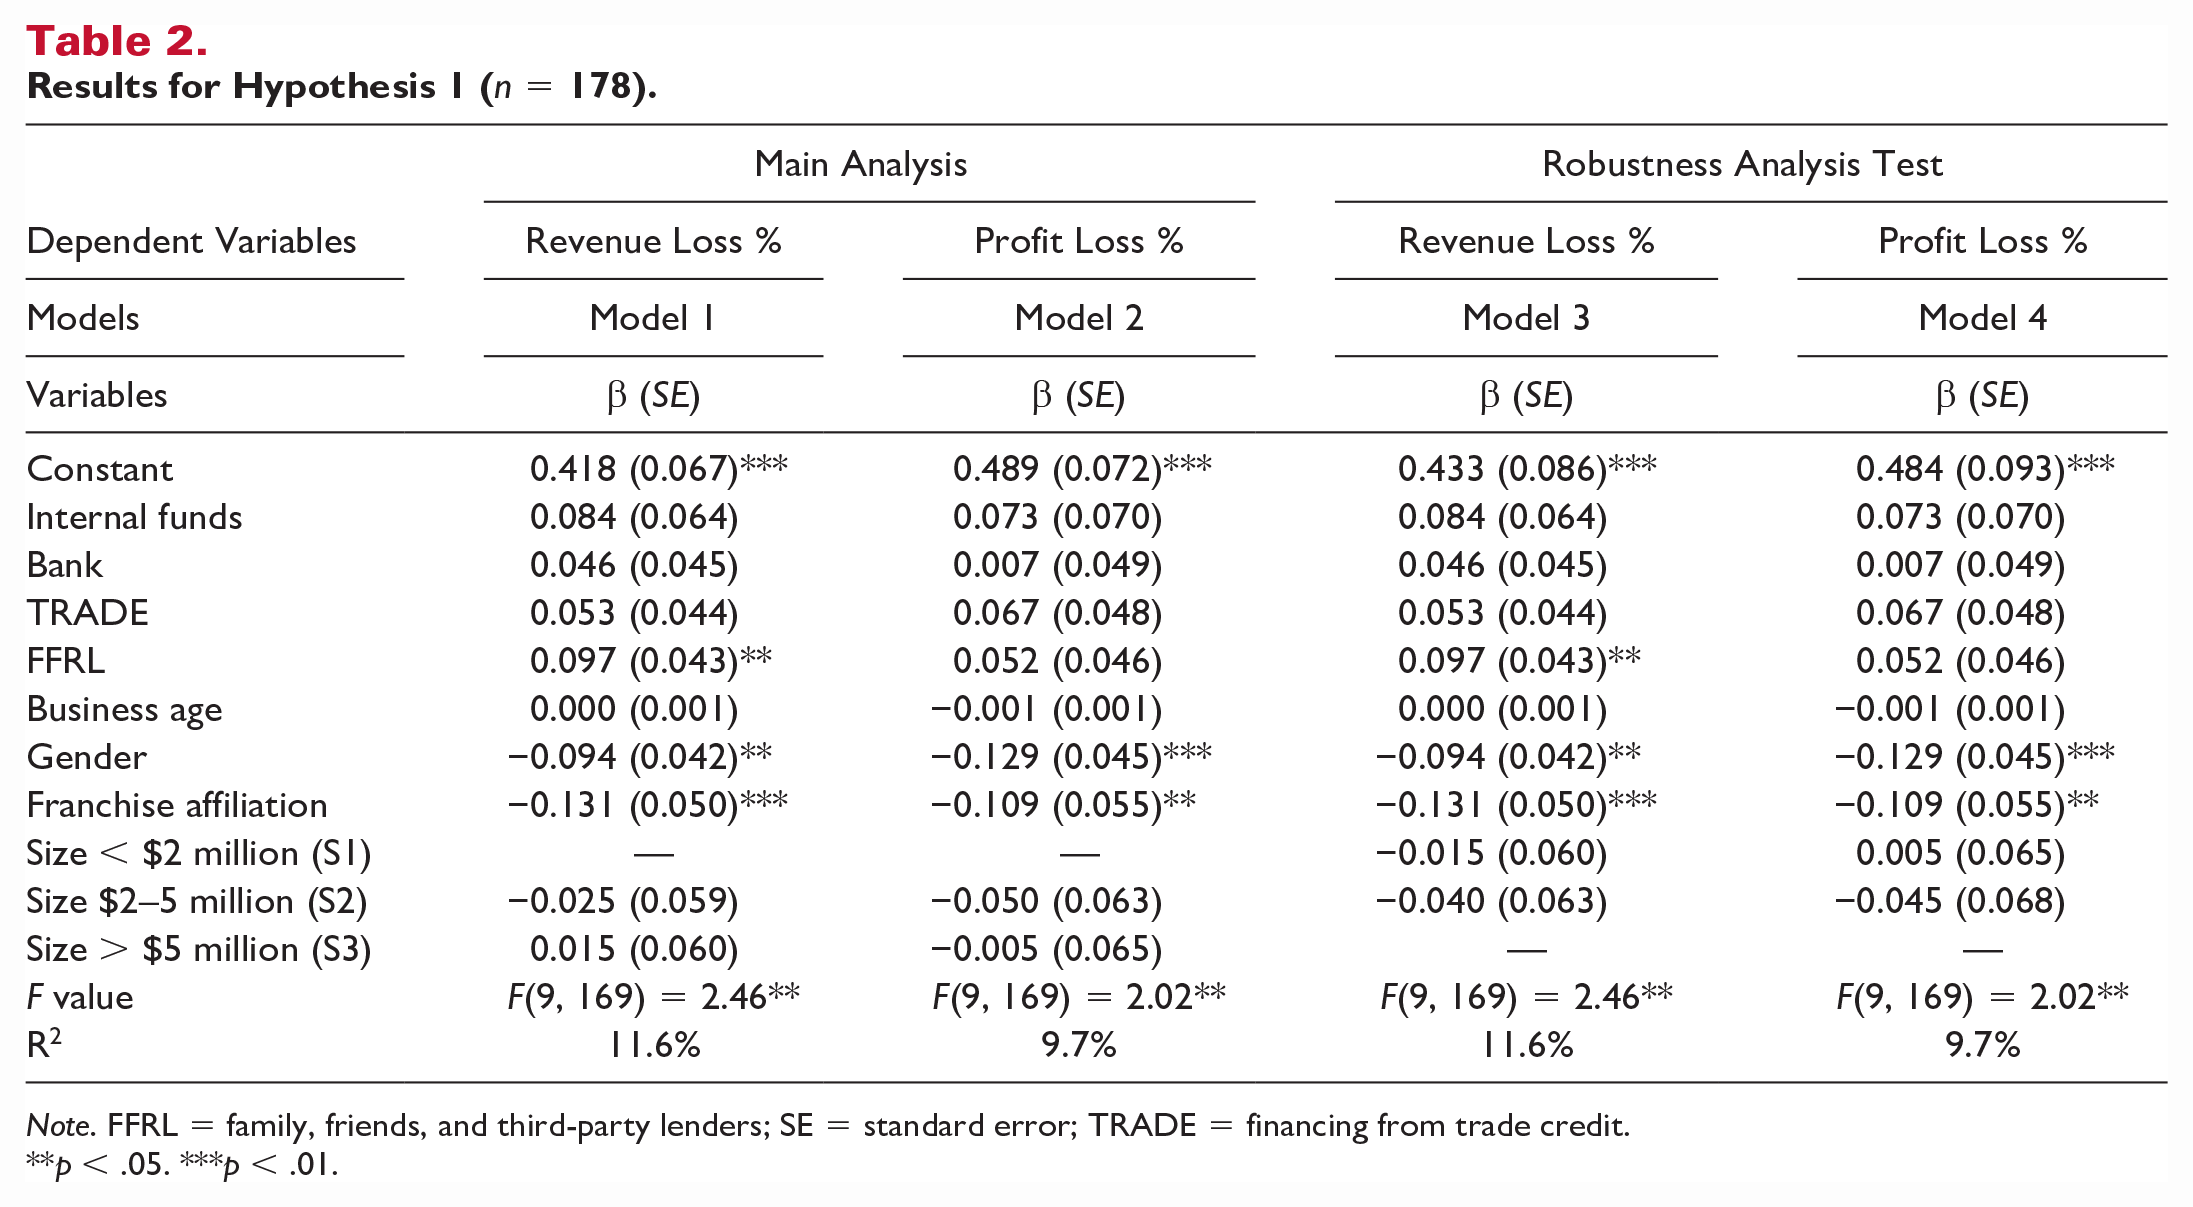
Note. FFRL = family, friends, and third-party lenders; SE = standard error; TRADE = financing from trade credit.
p < .05. ***p < .01.
Results for Hypothesis 2 (n = 178).
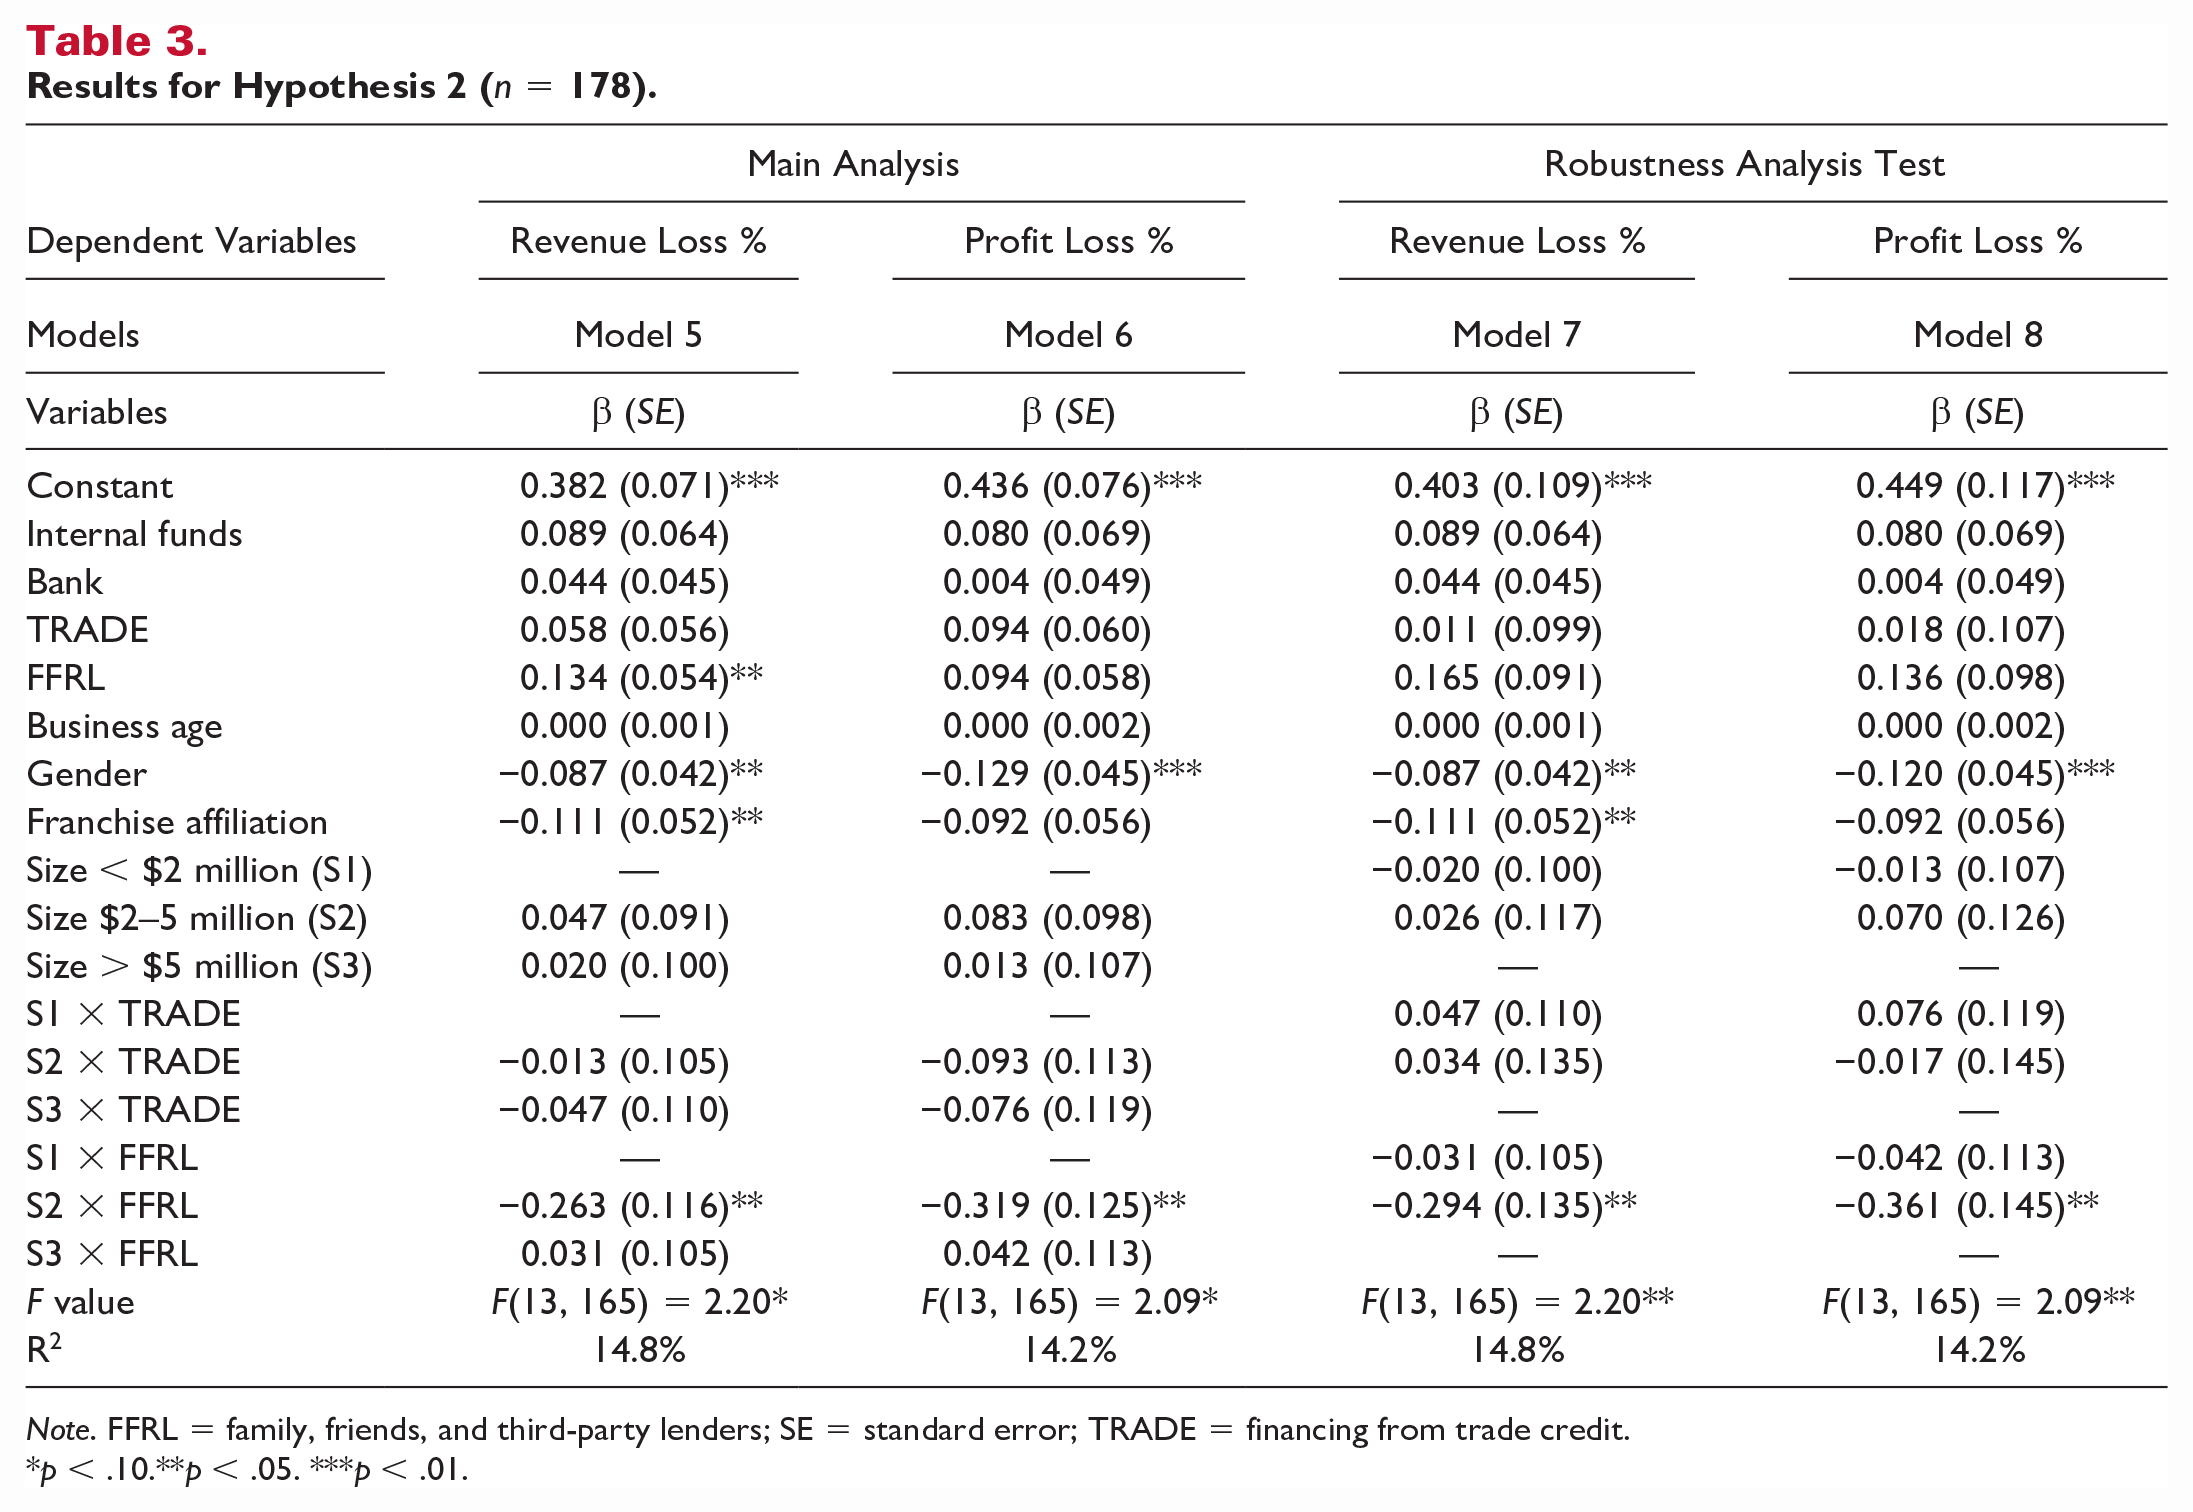
Note. FFRL = family, friends, and third-party lenders; SE = standard error; TRADE = financing from trade credit.
p < .10.**p < .05. ***p < .01.
Results
Descriptive Statistics
Descriptive statistics are provided in Table 1. The restaurants experienced on average 48.19% loss in revenue and 49.43% loss in profit due to the COVID-19 pandemic. Before the COVID-19 crisis, restaurant owners used internal funds (87.85%), TRADE (54.14%), FFRL (41.44%), and bank loans (37.57%) to fund their businesses. About 47.22% of the sample identified their gender as female. The average age of the restaurants was 12.2 years, and 61.3% of the restaurants did not have a franchise affiliation. Multicollinearity checks were performed for each of the models. In Models 1–6 and 9–12, all variables had a variance inflation factor (VIF) of less than 5 (Fox, 1991; Shubita & Alsawalhah, 2012); however, Models 7 and 8 had the main effect and moderating (interaction) effect variables of TRADE with a VIF of 6.061 and 6.035, respectively. Neither of those variables was statistically significant at p < .05. Table 1 also presents correlation coefficients for variables of interest that are consistent with the rest of the regression analysis results.
Hypothesis 1 Testing
Table 2 summarizes the statistical analyses for testing H1a and H1b. Model 1 tested the relationship between precrisis capital structure and revenue loss percentage (F(9, 169) = 2.46, p < .05, R2 = 11.6%). The results indicated that FFRL (β = 0.097, p < .05) had a positive relationship with revenue loss percentage. Among the control variables, gender (β = −0.094, p < .05) and franchise affiliation (β = −0.131, p < .01) had negative relationships with revenue loss percentage. In both Models 1 and 2, the coefficient for TRADE was not statistically significant at p < .05; it had a stronger association to revenue and profit loss percentage than formal financing (bank), but lower than internal funds. Model 2 tested the relationship between precrisis capital structure and profit loss percentage (F(9, 169) = 2.02, p < .05, R2 = 9.7%). The results indicated that none of the precrisis capital structure variables were related to profit loss percentage. Among the control variables, gender (β = −0.129, p < .01) and franchise affiliation (β = −0.109, p < .05) had negative relationships with profit loss percentage. Based on these results, we partially accept H1a.
We also changed the reference category of the firm size from “less than $2 million” in Models 1 and 2 to “$5–11 million” in Models 3 and 4. The results remained consistent for both dependent variables.
Hypothesis 2 Testing
Table 3 summarizes the statistical analyses for testing H2a and H2b. Model 5 tested the interaction effect between precrisis capital structure and firm size on revenue loss percentage (F(13, 165) = 2.20, p < .05, R2 = 14.8%). The results indicated that FFRL (β = 0.134, p < .05) had a positive relationship with revenue loss percentage. In addition, the interaction between FFRL and a firm size of $2–5 million (β = −0.263, p < .05) had a negative relationship with revenue loss percentage. Among the control variables, gender (β = −0.087, p < .05) and franchise affiliation (β = −0.111, p < .05) had negative relationships with revenue loss percentage.
Model 6 tested the interaction effect between precrisis capital structure and firm size on profit loss percentage (F(13, 165) = 2.09, p < .05, R2 = 14.2%). None of the precrisis capital structures had relationships with profit loss percentage. The interaction between FFRL and a firm size of $2–5 million (β = −0.319, p < .05) had a negative relationship with profit loss percentage. Among the control variables, gender (β = −0.120, p < .01) had a negative relationship with profit loss percentage. In Models 5 and 6, the coefficient for TRADE was not statistically significant at p < .05. TRADE had a stronger association with revenue and profit loss percentage than formal financing (bank), but lower than internal funds. Based on these results, we partially accept H2a.
We also changed the reference category of the firm size from “less than $2 million” in Models 5 and 6 to “$5–11 million” in Models 7 and 8. The results remained consistent in Model 7 (dependent variable = revenue loss percentage) and Model 8 (dependent variable = profit loss percentage). The coefficient of TRADE in Models 7 and 8 was still not statistically significant at p < .05; however, the strength of the relationship decreased in Model 7 to lower than that for formal financing (bank) and internal funds. In Model 8, although the coefficient of TRADE was consistent with the findings in Models 5 and 6, there was a stronger association with loss of revenue and profit loss percentage than with formal financing (bank) but a weaker association than internal funds.
Sensitivity Analysis
Table 4 summarizes the sensitivity analyses. Sensitivity analyses were conducted by removing all the control predictors and only including the independent variables: internal funds, bank, TRADE, and FFRL. The results of Model 9 (F(4, 176) = 2.59, p < .05, R2 = 5.6%) remained consistent, as FFRL (β = 0.099, p < .05) had a positive relationship with revenue loss percentage. The results of Model 10 (F(4, 176) = 1.30, p > .1, R2 = 2.9%) also remained consistent, as none of the precrisis capital structure variables had a relationship with the profit loss percentage.
Sensitivity Analysis Without Control Variables (n = 178).
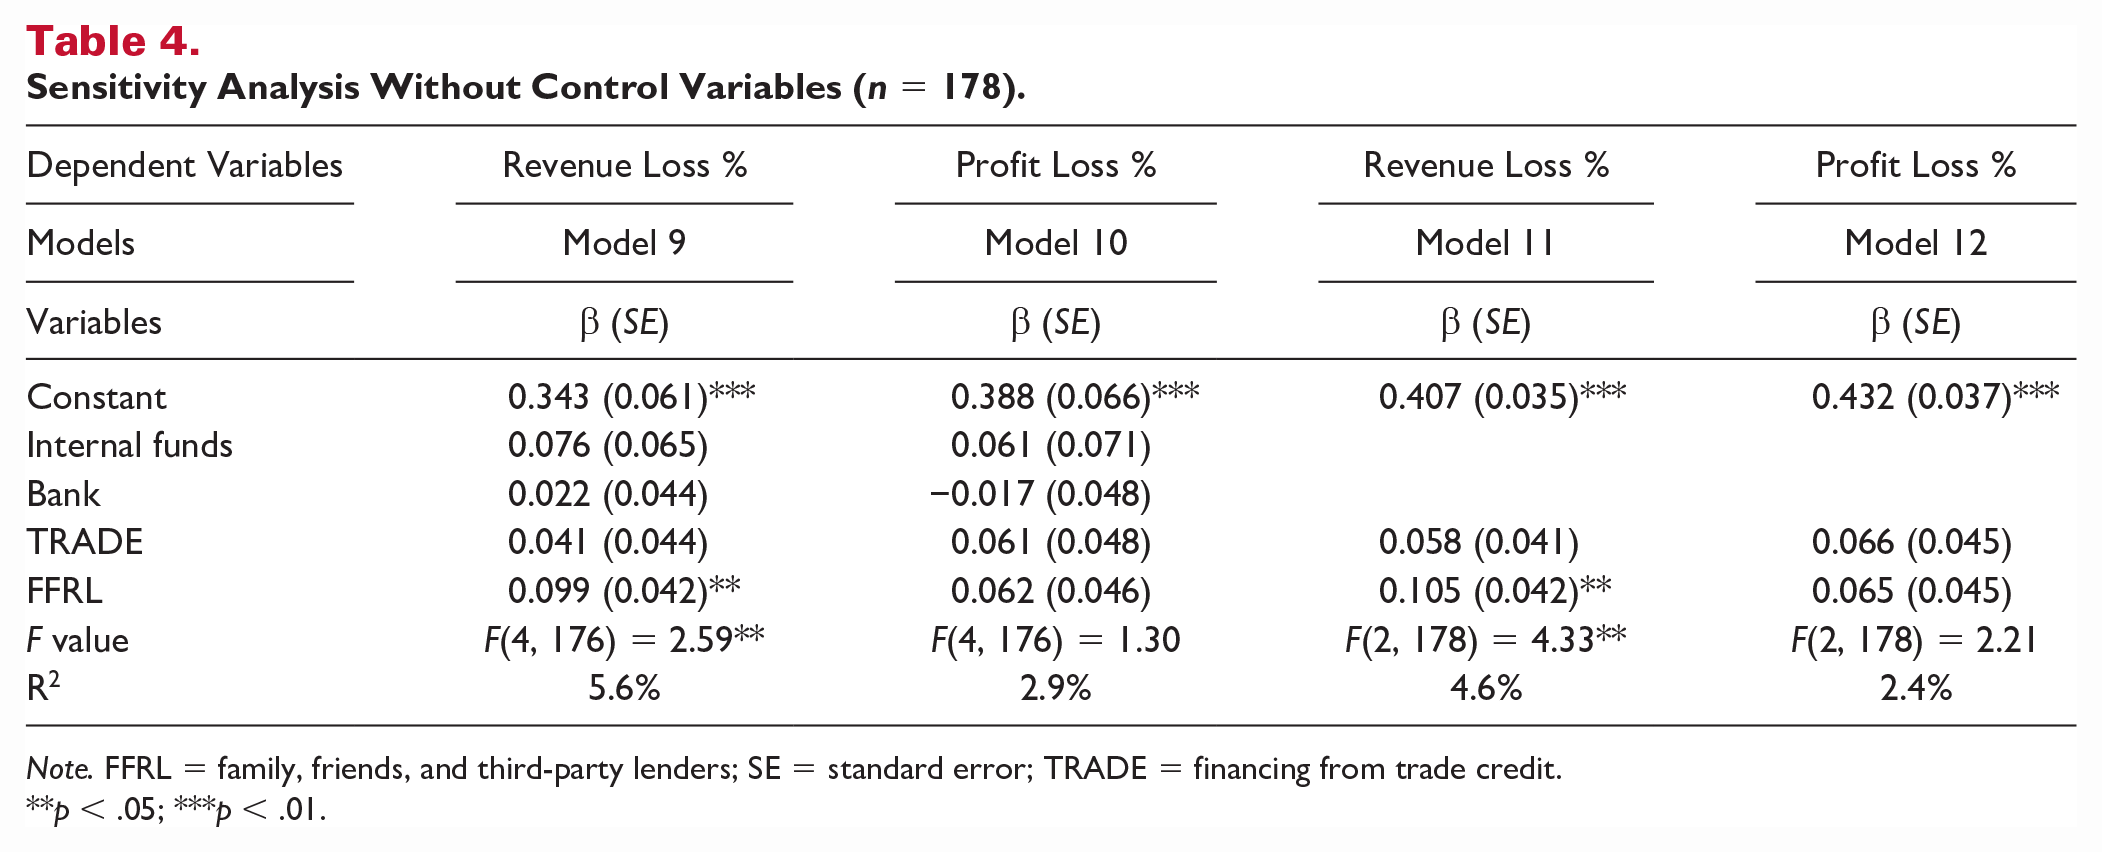
Note. FFRL = family, friends, and third-party lenders; SE = standard error; TRADE = financing from trade credit.
p < .05; ***p < .01.
Additional sensitivity analyses were implemented by only including the informal funds (i.e., TRADE and FFRL). The results of Model 11 (F(2, 178) = 4.33, p < .05, R2 = 4.6%) remained consistent, as FFRL (β = 0.105, p < .05) had a positive relationship with revenue loss percentage. The results of Model 12 (F(2, 178) = 2.21, p > .1, R2 = 2.4%) also remained consistent, as none of the precrisis capital structure variables had a relationship with the profit loss percentage.
Post Hoc Analysis
A series of post hoc tests were conducted to compare the key variables of interest to the dependent variables. All the post hoc tests were consistent with the main results reported earlier. There was a significant difference in revenue loss percentage for those SMEs with FFRL financing (M = 0.438, SD = 0.277) versus those that were not reliant on FFRL financing (M = 0.545, SD = 0.275), t(179) = 2.572, p < .05. There was also a significant difference in revenue loss percentage between male (M = 0.521, SD = 0.274) and female (M = 0.436, SD = 0.284), t(178)=2.029, p < .05) owners. Furthermore, there was a significant difference in profit loss percentage between male (M = 0.547, SD = 0.292) and female (M = 0.431, SD = 0.300, t(178) = 2.626, p < .01) owners.
Furthermore, there was a significant difference in revenue loss percentage between SMEs with annual sales of less than $2 million and having FFRL financing (M = 0.568, SD = 0.296) and other businesses in the study (M = 0.452, SD = 0.270), t(179) = 2.485, p < .05. In addition, there was a significant difference in revenue loss percentage between SMEs with sales of $2–5 million and FFRL financing (M = 0.304, SD = 0.205) and other businesses in the study (M = 0.492, SD = 0.282), t(179) = 2.080, p < .05. There was a significant difference in profit loss percentage for SMEs with annual sales of $2–5 million and reliant on FFRL financing (M = 0.235, SD = 0.166) versus other businesses that did not qualify on those two criteria (M = 0.510, SD = 0.301), t(179) = 2.858, p < .01. Last but not least, there was a significant difference in revenue loss percentage for SMEs with $5–11 million in sales and with FFRL financing (M = 0.617, SD = 0.172) versus other businesses (M = 0.467, SD = 0.287), t(179) = 3.246, p < .01. There was also a significant difference in profit loss percentage for SMEs with $5–11 million in sales and with FFRL financing (M = 0.612, SD = 0.214) versus other businesses (M = 0.481, SD = 0.307), t(179) = 2.345, p < .05. The variable for TRADE financing was not statistically significant.
Discussion
Based on prior literature, we hypothesized that SMEs that rely on informal financing will be associated with poorer financial performance during a crisis. We further hypothesized that financial performance will be worse for relatively smaller SMEs. Our findings provide partial support for H1a. For SME restaurants, our findings suggest that informal financing from FFRL was significantly associated with revenue losses during the pandemic, but not with profit losses. Furthermore, we found that mid-sized SME restaurants (with revenue ranging from $2 to 5 million) that were reliant on informal financing were more negatively correlated with both revenue and profit loss than smaller (with revenue less than $2 million) and larger SME restaurants (with revenue ranging from $5 to 11 million). These findings partially support H2a.
Theoretical Implications
Findings from this study extended the understanding of SMEs’ choices of informal financing and how these choices impact business performance during a crisis. Following the capital structure trade-off theory, capital structure decisions involve making trade-offs between the costs of bankruptcy associated with greater debt versus lower costs than equity capital (Kraus & Litzenberger, 1973). The emerging literature on informal financing suggests that whether voluntarily or due to a lack of choices, certain firms are unable to access formal financing because of information asymmetry between firms and formal debt lenders (Lin & Sun, 2006; Mpofu & Sibindi, 2022; Nguyet, 2014). This is due to the accessibility of informal debt with relatively lower scrutiny. In this study, we found that informal financing before a market crisis is associated with revenue loss during the crisis, but not profit loss. Our results add value to the extant literature that currently reports inconclusive results on this issue. For example, while our results are consistent with those of Ullah and Khushnood (2019) who found a negative association between informal financing and sales growth, Degryse et al. (2016) found an insignificant relationship between FFRL and sales growth. Especially, our findings extend the support for the negative relationship between informal financing and firm performance to the crisis context. Also, while the direction of the coefficients for profit loss percentage in our study was as expected, these results were not statistically significant. Furthermore, the data collection for this study was conducted within 6 months of the first reported cases of COVID-19 in the United States. It is possible that as the pandemic progressed, businesses may have experienced more noticeable changes in their profitability.
Prior research examined the effect of firm size on capital structure in leverage and refinancing choices (Kurshev & Strebulaev, 2015; Muzir, 2011); however, as Allen et al. (2019) pointed out, informal financing is more useful for smaller firms given that larger firms typically have greater access to formal debt. It is therefore likely that smaller SMEs with greater amount of funding from FFRL are at a greater risk of loss in revenue growth than larger firms. The study by Allen et al. (2019) also showed that a combination of informal and formal financing could be beneficial for revenue growth. In this study, we observed that the interaction of FFRL and firm size was positive for larger firms’ revenue growth, but not statistically significant. It is unclear why the medium-sized firms (with revenue ranging from $2 to 5 million) were at a greater risk than the smaller firms in this study. Future studies could further investigate whether the relative size of SMEs is a determining factor in the relationship between informal financing and revenue growth in a more comprehensive context.
There were additional interesting findings in this study in relation to the control variables. As noted earlier, we found that control variables of women-owned businesses and franchise- and/or chain-affiliated businesses were negatively correlated with financial losses during COVID-19. Franchise and chain affiliations can provide resource support for SMEs (owner franchisees or chain affiliates), particularly during a crisis. The role of gender and franchise/chain affiliation are areas worthy of further investigation. In addition, our results showed that a business’s age did not relate to financial losses, possibly suggesting that long-term business experience and relationships with local communities are not likely to be helpful in reducing financial losses during a crisis such as COVID-19. Business age may not be an accurate reflection of these factors, and future research should attempt to measure and examine more specific factors such as local community relationships and owners’ or operators’ business experiences.
Practical Implications
The findings of this study provide several important practical implications. Although informal sources of financing are often necessary for SMEs, our findings suggest that during a crisis, businesses using informal financing could be at a greater risk of experiencing losses in revenues. One of the benefits of formal sources of financing is the objective evaluation of business risk by financial lenders (Dempster, 2002); however, when a business is unable to access formal funding sources, it also forgoes the opportunity for an objective risk assessment (Hyytinen & Väänänen, 2006). The same may be true for businesses that rely on FFRL. These informal lenders should more actively evaluate business risk so that both business owners and lenders have evidence-based expectations of risk-return outcomes, particularly during market-crisis-driven risks. Results from a recent study suggested that restaurants’ financing choices between formal and informal financing could be a function of the business climate (Van Song et al., 2022). SME restaurants should be cautious of exploring investment opportunities during a relatively poorer business climate as such conditions could limit their financing choices to informal sources. The timing of making capital structure and investment decisions for SME restaurants could determine their future financial performance.
Limitations
As we noted, one of the novel aspects of this research is that data were collected directly from SME owners, an approach that is rare in finance and business literature; however, the response rate for this study was low because of the COVID-19 pandemic. Data were also self-reported (as is generally the case in SME literature). It is a challenge to gather reliable financial data from SMEs, and there is a dire need to create more systematic and sustainable approaches to collecting such data over time.
The most salient limitation of our study is the cross-sectional design, which impacted our ability to make strong inferences regarding causal relationships. Unfortunately, much of the SME literature is plagued with this shortcoming due to the private nature of financial data. Public company data are more easily accessible, thereby allowing researchers to develop timeseries and panel models. There is a need to collect more reliable data from hospitality SMEs in general. There are also numerous exogenous variables that have been shown to influence a firm’s performance such as competition, location, and customer satisfaction. To ensure parsimony of the analytical models, several of those were not accounted for in the current study. Given the increased interest in informal financing for SMEs, we anticipate that our study will serve as a catalyst for additional research supporting this line of literature.
Footnotes
Declaration of Conflicting Interests
The author(s) declared no potential conflicts of interest with respect to the research, authorship, or publication of this article.
Funding
The author(s) disclosed receipt of the following financial support for the research, authorship, and/or publication of this article: This study was supported by a grant from the Social Science Research Institute and the Huck Institutes of the Life Sciences at Penn State University as part of the COVID-19 Rapid Research program.