
Abstract
Commercial real estate (CRE) investment involves risk, and hotels are perceived as the riskiest CRE assets because of the high turnover of guest room occupants and are the most operation-intensive of all types of CRE properties. Furthermore, that risk may vary significantly across types of hotels based on different dimensions. The existing academic literature regarding CRE investment performance generally lacks such investigation of hotels at the establishment level. The purpose of the current study is to investigate the volatility of operating profit (risk) of different types of hotel assets. Using relative standard deviations of historical performance (gross operating profit [GOP]) to measure hotel risk, we examine various property characteristics and the extent to which they affect the volatility of GOP at the unit level from 2015 through 2020 of over 3,000 U.S. hotel properties. We find that different types of hotels have carried different levels of risk. Specifically, we find significant differences in risk based on hotel brand affiliation status, class, property type, location type, region in which the hotels are located, age of the hotels, size of the hotels, and their occupancy and average daily rate levels. This study provides practitioners and researchers with an understanding regarding the relationships between the risk of different types of hotels, and provides practitioners with information regarding risk and a benchmarking methodology that may be applied to evaluate risk to aid hotel investment decisions. Furthermore, we provide researchers with information regarding various hotel characteristics that may lead to relatively greater/lesser risk.
Introduction
Risk is associated with all commercial real estate (CRE) investments, and CRE is a substantial portion of the economy, constituting a large share of overall wealth, worldwide (Floyd & Allen, 2014). According to National Association of Real Estate Investment Trusts (NAREIT), the estimated asset value of CRE is approximately US$16 trillion, based on data from CoStar and other sources (National Association of Real Estate Investment Trusts [NAREIT], 2019). Among various CRE assets, including hotels, multifamily properties, industrial facilities, retail centers, and office complexes; hotels constitute over 10% of all properties, estimated to represent 12% of the market value of all CRE investments (Corgel, 2005).
Due to the operational aspect of hotels, as well as not relying on long-term lease contracts, hotel investment is often considered to be the riskiest of all classes of CRE properties. Although hotels may generate significant yields stemming from responding to changes in market supply and demand by adopting flexible pricing strategies, that is, yield management, however, hotel revenues and expenses may be volatile, and hotels can also be the first CRE asset class to suffer from demand interruptions (CADRE Insights, 2019). Therefore, evaluating hotel returns relative to risk becomes critical for hotel investors and researchers to evaluate alternative investment opportunities, and to inform investment decisions in purchasing, disposing, holding, investing, or re-investing in hotel properties.
Although there exists literature about hotel investment performance, such literature is primarily macro in nature, typically focusing on lodging real estate investment trusts (REITs), or public hospitality firms, and lacks evaluation of privately-owned properties, or analysis at the hotel establishment level. The limitation of a sufficient volume of high-quality, establishment-level data may be attributed to the economic hurdle that CRE (including hotels) is not a very liquid type of asset, whose financial performance is difficult to be observed directly and consistently over the course of multiple years (Peng, 2016). The primary purpose of the subject research is to analyze hotel investment risk based on annual gross operating profit (GOP) of over 3,000 hotels during the course of six recent years, focusing on measuring hotel risk by using GOP profit margin, GOP per available room (GOPPAR), and relative standard deviation of GOP (GOP RSD). While previous research has acknowledged that having approximately 30 points of data regarding the holding period (HP) may be desired (Choi & Mukherji, 2010; Mukherji, 2003), recent research has shown a significant decrease in the HP (Poretti & Das, 2020). For example, Poretti and Das (2020) noted that the HP of hotels has been decreasing in recent years from approximately 15 years to approximately 5 to 8 years. Thus, we believe our timeframe of 6 years is appropriate given industry trends.
Literature Review
CRE and Risk Measures
CRE has a substantial role in the overall investment market, as previously discussed. Guo (2018) determined that as a portion of overall assets of investment portfolios, CRE brings unique advantages, including a premium for illiquidity, a return separate from the market portfolio, the potential of hedging against inflation, and cash flow during the HP. The primary disadvantages of CRE assets are their valuation difficulty, illiquidity, need for continuous capital expenditures, and relatively large size as investments. However, securitization may successfully convert CRE assets into much more liquid, and possibly less risky financial assets through such vehicles as REITs. The literature identifies two types of risk: systematic risk that is the result of the volatility of markets, and unsystematic risk resulting from firm or unit-specific aspects or characteristics. Unsystematic risk may be effectively managed by understanding the relative risk versus the return of individual assets (Li & Chen, 2013). The focus of the current study is thus on the unsystematic risk of different types of hotels.
Among the most substantial risks of CRE investments is the stream of income because such an income stream is uncertain, particularly over the course of multiple years, and it is affected by market and other external variables, resulting in uncertainty regarding the outcomes, particularly in the long term (Frodsham, 2007). To estimate the market value of hotels or any class of CRE, there are two important inputs: How much profit (cash flow) the property is expected to generate in future years, and how variable, that is, risky, are those expected profits (Das & Rein, 2020), or stated alternatively, how much those cash flows may fluctuate over time. We focus on the CRE valuation risk by estimating the variability of GOP of hotels in this study.
The risk of any asset is generally defined as volatility, measured as the standard deviation of its historical realized profitability performance (D’Alpaos & Canesi, 2014). It is commonly assumed that assets with high volatility in historical performance also have the least predictable future performance. Therefore, both practitioners and researchers use standard deviations to quantify the potential outcomes, and such measures can be referred to as indexes of risk (D’Alpaos & Canesi, 2014). This study applies the concept of standard deviations as risk indexes to analyze the GOPPAR volatility of hotel assets.
Real Estate Risk and Business Risk
In the 1990s, the CRE field evolved from one of producing new space and collecting rental income, on almost a bond-like basis, to one where operators managed CRE assets as competitive businesses to produce annual investment returns over the course of multiple years (Mueller & Anikeeff, 2001). The CRE field now includes operating CRE assets as competitive businesses with operating cost management, marketing, additional services (producing additional sales), and additional products and services, including technology services, telecommunications services, recreational services, valet services, and parking services. However, the intensity of such management varies substantially depending on the type of CRE asset. When the real estate income is related to the viability of the commercial enterprise operated within the real estate, the income is likely to have greater volatility. In such cases, the market would demand a relatively higher risk premium, that is, a higher return would be expected for that type of property (Mueller & Anikeeff, 2001).
The concept of business enterprise value (BEV) was developed by Kinnard and Worzala (2000), and instituted as a component of the appraisal of CRE (Appraisal Institute, 2001). CRE asset value is enhanced because of the presence of intangible personal property, including such aspects as management skill, marketing ability, working capital, an assembled workforce, trademarks, franchises, non-realty related leases or contracts, and certain operating agreements (Mueller & Anikeeff, 2001), and risk is associated with all of these variables. BEV has become an important aspect of hotel and other CRE properties particularly because of assessment, damage claim assignments and condemnation which require that any estimate of the market value of the real estate of the CRE be separate from the market value of the total assets of the business (TAB) (Lennhoff, 1999). A great deal of the motivation for the estimation of BEV, including tangible or intangible personal property, is that these components of CRE assets are not subject to real estate taxes (deRoos, 2006; Vandell, 2007). In reality, BEV is typically determined by partitioning the value of the going concern into real estate, tangible personal property, and intangible personal property (deRoos, 2006; Hennessey, 1993; Kinnard et al., 2001; Lesser & Rubin, 1993; Rushmore & Rubin, 1984). Some research has concluded that BEV may be over 30% of the TAB of hotels (Kinnard et al., 2001), and regional malls (Eppli, 1998).
As the profitability of hotels and other CRE assets becomes increasingly related to the actual business being operated within the real estate asset, the volatility of the income will generally increase because operating businesses are typically subject to higher volatility than real estate (Mueller & Anikeeff, 2001). Operations of hotels, in particular, are a daily exercise, as the operator must “sign contracts” for use of the space (guest rooms, restaurants, lounges, function space, health/fitness facilities, and other facilities) on a daily basis. Service, maintenance, marketing, and other features are the types of variables that must be effectively managed for a hotel to be profitable. Compared with other property types, hotels have the strongest relationship to operations. Thus, the volatility of both income and market value of hotels is often considered to be the highest of all CRE property types, as depicted in Figure 1 (Mueller & Anikeeff, 2001).
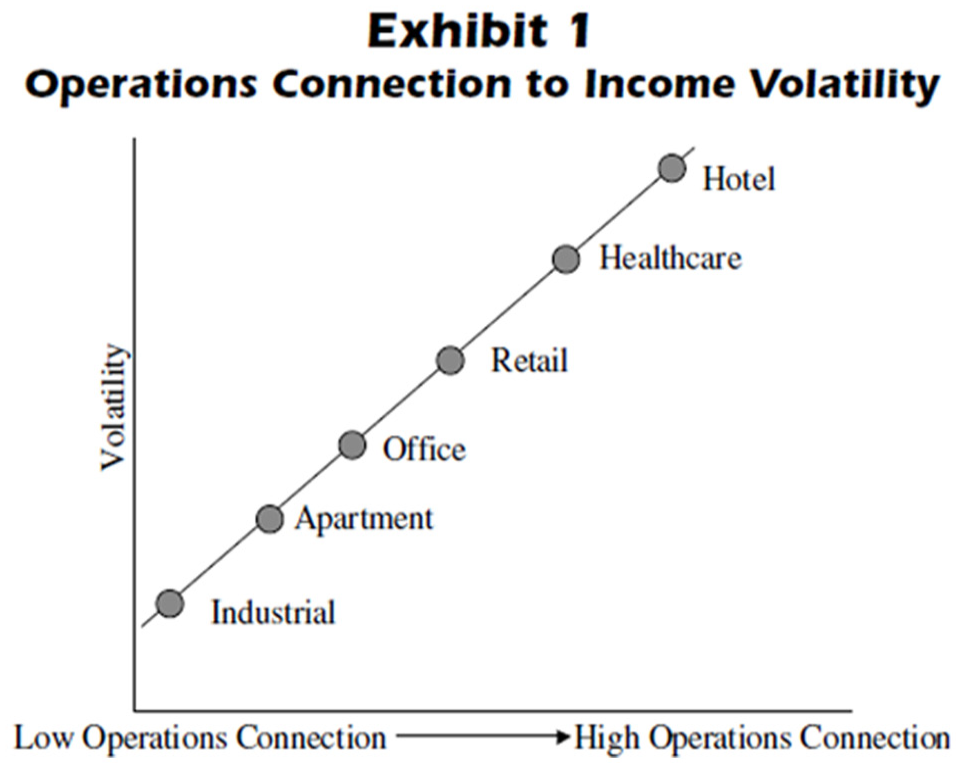
Operations Connection to Income Volatility.
Hotel Operating Risk
Hotels and other CRE assets encompass two different but interconnected markets that deploy real estate to generate annual income—the space market, and the market for owning assets. This separation but interrelationship is evident in the hotel market because the hotel owner generally is not the user of the space itself (Corgel, 2005). Since a hotel essentially is an operating business contained within real estate, previous research has investigated whether it is possible to separate the two basic components of a hotel property’s market value, that is, the real estate, and BEV. O’Neill (2004) concluded that separating the real estate and operational aspects of hotels is exigent in reality because premiums in operating parameters, including occupancy, average daily rate (ADR), and overall rooms revenue, for example, rooms revenue PAR, or RevPAR, are generally a function of a property’s actual location, that is, real estate, even though prior research suggested such premiums should be allocated to BEV (Kinnard & Worzala, 2000).
In investment in hotels and other CRE properties, the “HP return” is a function of the combination of the profit, that is, annual cash flow, earned throughout the HP, as well as the market value appreciation or depreciation of the asset itself (Younes & Kett, 2006). Depending on the type of hotel property (and its HP), the profit, for example, gross operating profit, or GOP, represents approximately 70% of the total returns (Younes & Kett, 2006). Furthermore, the remainder of the HP return, that is, the other 30% of the return that is attributable to appreciation or depreciation, is directly related to profit, as well.
As hotels are operation-intensive assets, operating risk characterizes the ability of a hotel to produce sufficient levels of cash flow to produce the level of profitability required to justify a certain level of investment. GOP is a common measure of the cash flow of hotels and other CRE assets.
In hotels, GOP comprises the profit from operations after deductions for departmental expenses, for example, rooms, food, beverage, recreational services, etc., and undistributed (overhead) expenses (Lloyd-Jones et al., 2020), such as human resources, marketing, maintenance, and utilities. Due to these variables, hotel investors are substantially exposed to operating risk. Variances in the performance of the operations of a hotel property may have a substantial effect on the GOP that hotel investors may deploy to service the hotel mortgage or other debt, to service the income taxes, and finally to provide a satisfactory return on investment or ROI (Younes & Kett, 2006).
An economic downturn, such as the one caused/exacerbated by the COVID-19 pandemic, for example, could increase risk, depress revenues and profitability, and potentially force the business (and its owner) into liquidation. The main operating risk factor in a hotel property is its GOP volatility throughout the HP. The more that GOP fluctuates over a specific period, the higher the operating risk. Given the operating structure of hotel assets, this risk can be attributed to two main characteristics: revenues and the fixed cost structure of the operation (Younes & Kett, 2006). Various dynamics and business characteristics, whether controllable or uncontrollable, affect these operating risk factors. Furthermore, there are fundamental operating differences between various types of hotel assets (Younes & Kett, 2006). The subject research project assesses hotel GOP profit margin (percentage), GOPPAR, and relative risk of GOPPAR (GOPPAR RSD) attributed to property characteristics (i.e., real estate aspects such as hotel size, class, region in which the hotels are located and type of location) and non-real estate aspects such as branding (i.e., whether the hotel is brand-affiliated, unbranded or carries a soft brand), and we believe, should contribute to practical and academic understanding regarding hotel operating risk and hotel asset risk.
The Data and Research Design
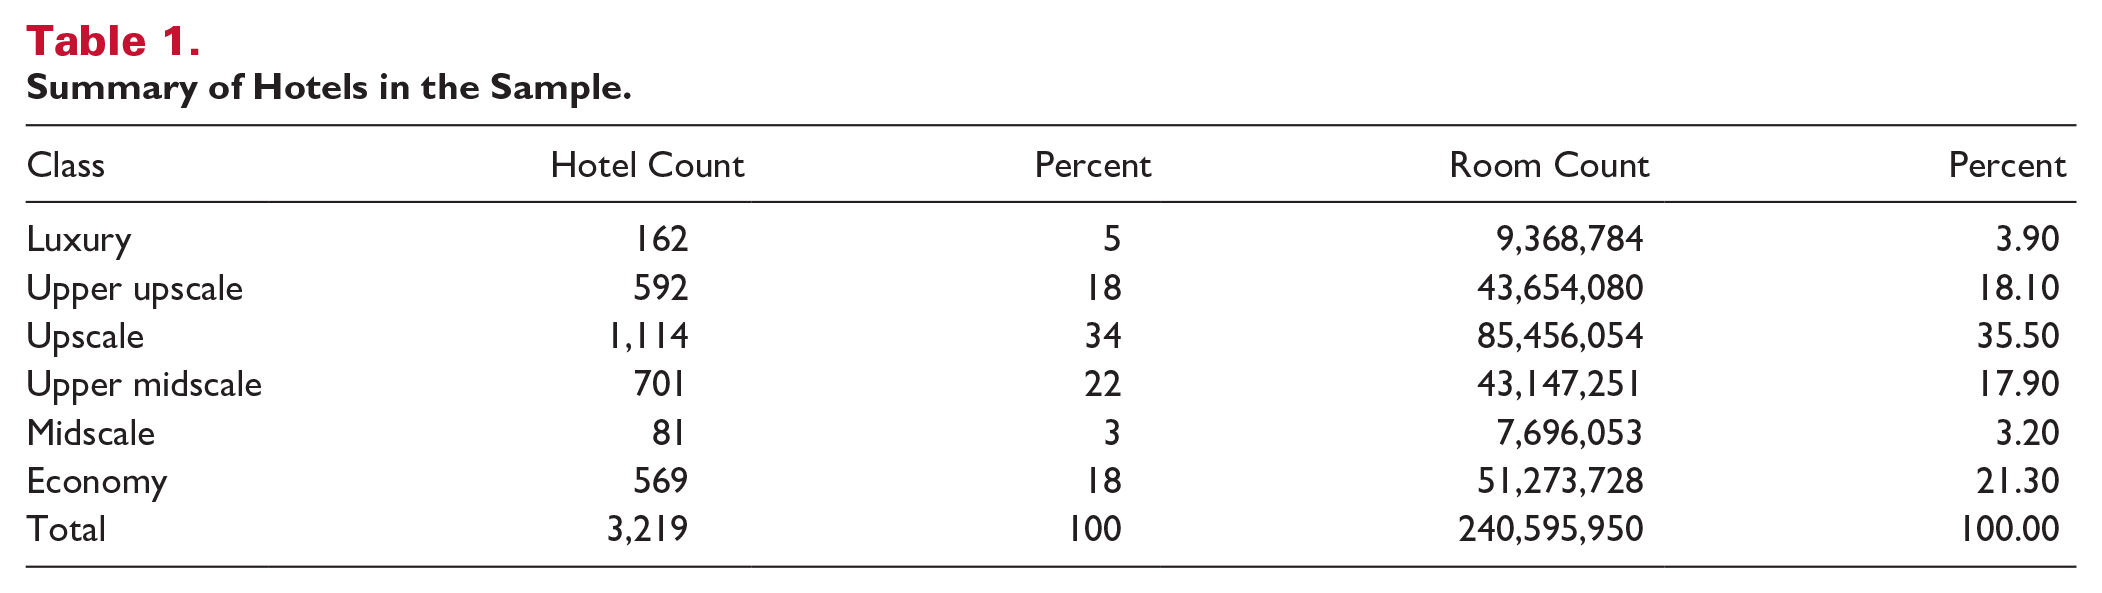
The dataset of profit and loss statements was provided by CBRE, consisting of 3,234 hotels in the United States for 6 consecutive years from 2015 through 2020, for a total of 19,404 property-year observations. To maintain confidentiality, the actual names of each of the individual hotels were not provided to the researchers. Upon completing data cleaning and screening, 15 properties were removed due to missing data, which resulted in a final sample size of N = 3,219, which were used in our analyses. The sample breakdown is summarized in Table 1.
Summary of Hotels in the Sample.
Research Design
This study sought to identify the varying levels of risk based on different categories of hotels. Nine hotel characteristics involving hotel operating and asset aspects were selected for ANOVA analyses to examine the overall and individual effects of each predictor on three variables measuring hotel profits and risks.
We first completed a few one-dimensional analyses using ANOVA. Next, we developed two-dimensional heatmaps to visually demonstrate the variation of GOPPAR RSD across combinations of hotel class (i.e., luxury, upper upscale, upscale, etc.) and additional characteristics, such as region, property type, and occupancy quartile. Finally, multiple regression analyses were performed to simultaneously examine the significance of multiple predictors.
Variables
The dependent variable of interest for our study was the RSD of GOP PAR or GOPPAR RSD, which equals the standard deviation of GOPPAR divided by the mean of GOPPAR:

To put the GOPPAR in context, we also analyzed the average GOPPAR itself as well as the GOPPAR profit margin (GOPPAR percentage). The nine independent variables were (a) brand affiliation status, (b) property class, (c) property type, (d) region, (e) location type, (f) property age, (g) property size, (h) occupancy, and (i) ADR. Brand affiliation, property class, property type, region, and location were coded as categorical variables. Property age, size, occupancy, and ADR were coded as continuous variables. Since our interest was risk at the property level, and there were minor fluctuations in certain variable values across certain years (e.g., number of rooms), we used the average of 2015 through 2020 as the input for each continuous independent variable.
Method
The methods for this study involved investigating hotel profit volatility attributed to various hotel characteristics, measuring risk based on those characteristics, and developing hotel performance benchmarks based on risk. We introduce a novel measure of risk to benefit hotel investment decision-making and future research. Specifically, we employed the following three analyses:
ANOVAs
The analyses were conducted in three steps. First, we used the Excel built-in functions to compute the means and ratios of various continuous variables, such as hotel age, hotel size, occupancy, ADR, RevPAR, GOP profit margin, GOPPAR, GOPPAR RSD for each property over 6 years of 2015 through 2020. Second, we used IBM SPSS 27 to conduct 18 ANOVAs for the nine predictors selected. In the third step, we used the SPSS built-in function to test the assumption of variance homogeneity. If the homogeneity assumption was not violated, we applied Tukey HSD post hoc tests to determine the magnitude of the difference of pairwise subgroup comparisons within the predictor. If the assumption of homogeneity was violated, we applied the James-Howell post hoc test to conduct pairwise comparisons for the sub-groups with unequal size and unequal variance. Relative to the Tukey HSD method, James-Howell post hoc tests provided improved accuracy for unbalanced samples.
Hotel Risk Heatmaps
The heatmaps visually display a comparative view of the GOPPAR RSD in our dataset. We used the two-dimensional analysis tool to present the combined effects of certain predictors. In the heatmaps, the colors were assigned by conditional formatting based on the GOPPAR RSD value in each cell. The color scale is Green to Yellow to Red with relatively low values receiving the green color and high values being red.
Multiple Regression Analyses
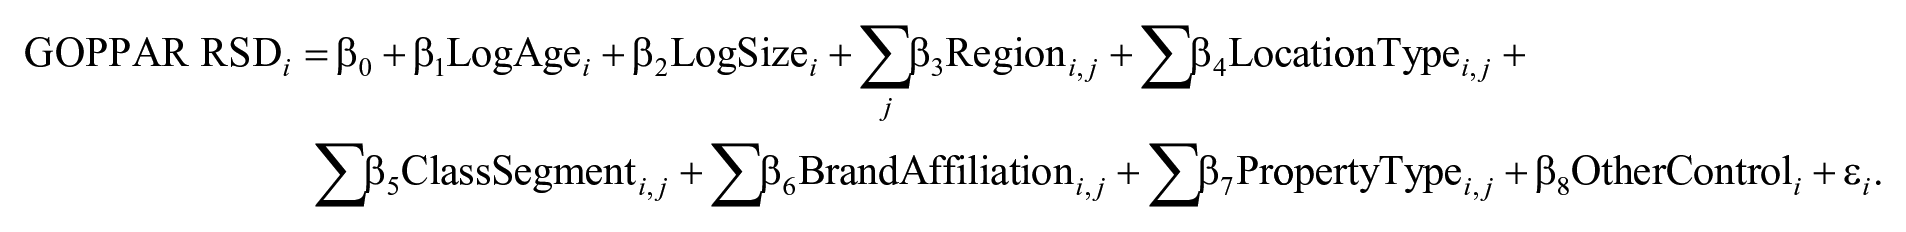
To test the simultaneous effects of multiple factors on our risk measure, we conducted the following multiple regression analyses to examine the magnitude of multiple factors’ effects on GOPPAR RSD:
Results
Descriptive Statistics
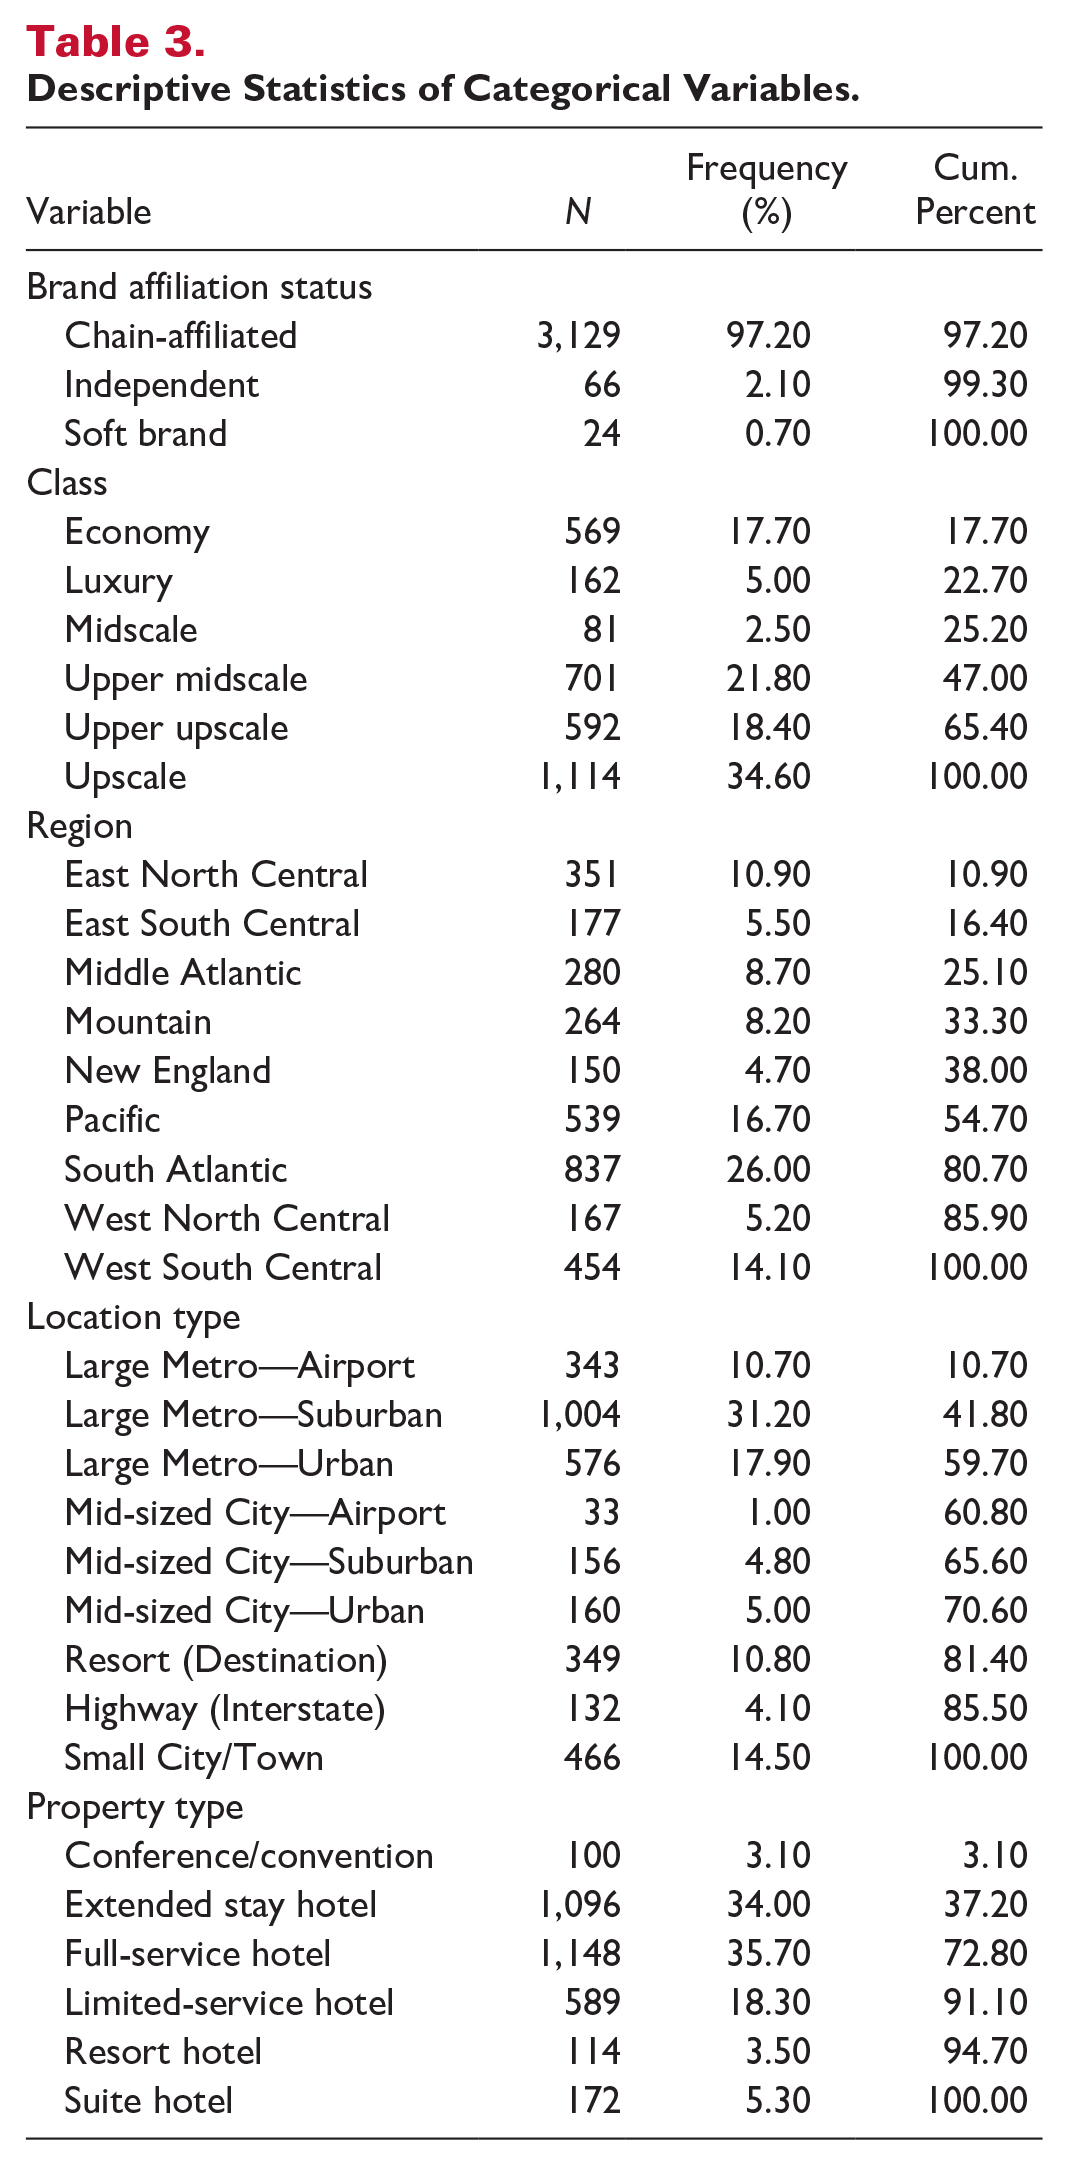
The means, minimums, maximums, and SDs of continuous variables are displayed in Table 2, while the categorical variables are summarized in Table 3.
Descriptive Statistics of Continuous Variables.
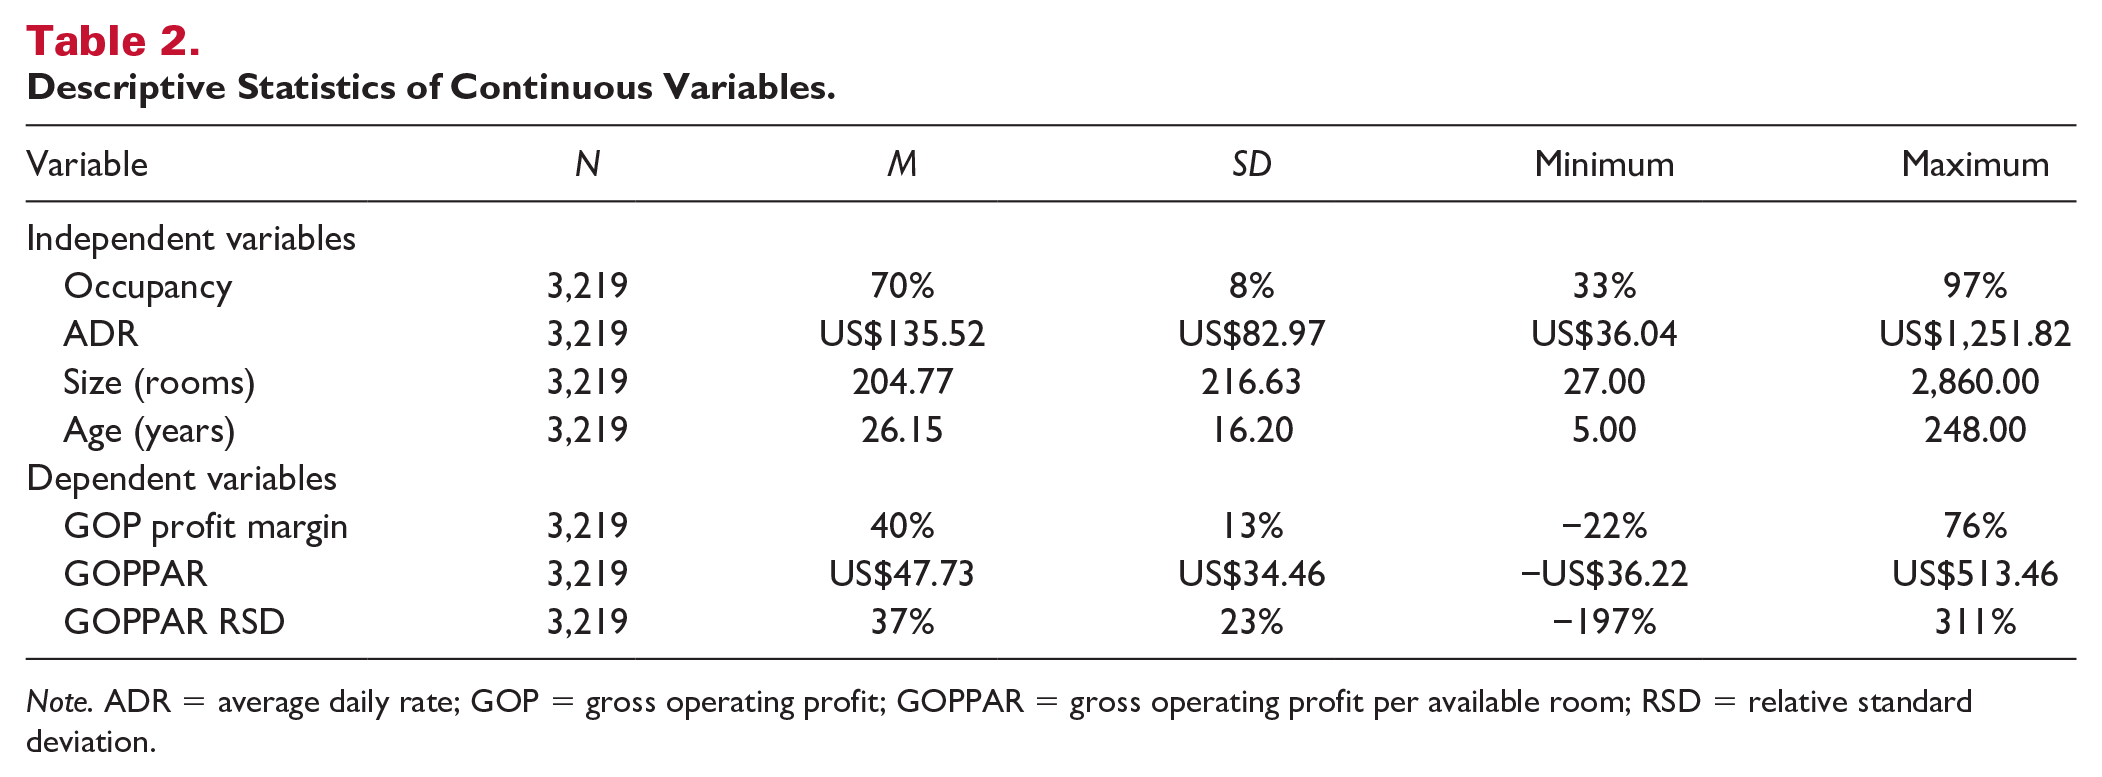
Note. ADR = average daily rate; GOP = gross operating profit; GOPPAR = gross operating profit per available room; RSD = relative standard deviation.
Descriptive Statistics of Categorical Variables.
One-Dimensional Overall Effects
ANOVAs indicated that hotel characteristics affected the variances of all three dependent variables (i.e., Mean GOP Profit Margin, Mean GOPPAR, and GOPPAR RSD) significantly as presented in Table 4.
ANOVA Summary.
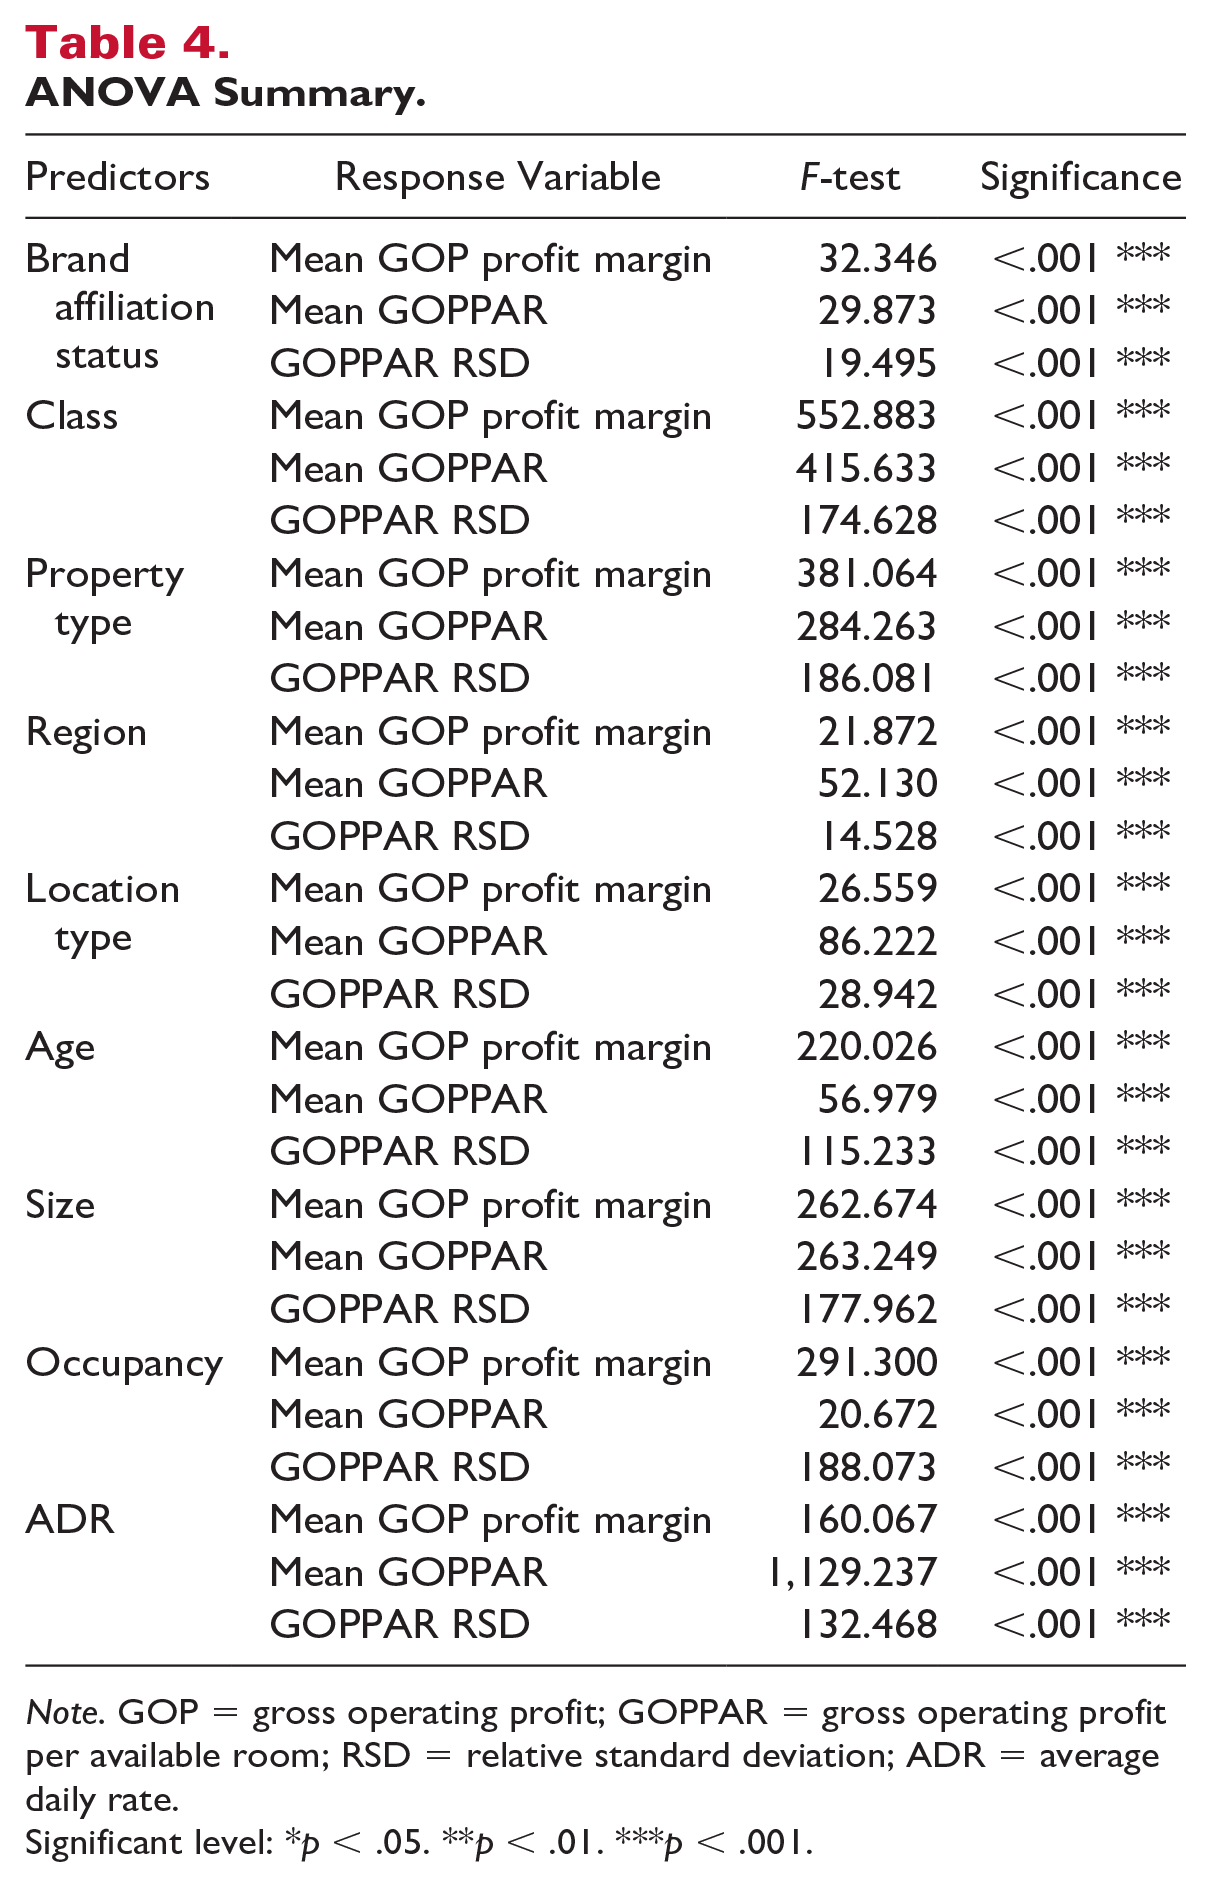
Note. GOP = gross operating profit; GOPPAR = gross operating profit per available room; RSD = relative standard deviation; ADR = average daily rate.
Significant level: *p < .05. **p < .01. ***p < .001.
Individual Effects
Brand Affiliation Status
The brand affiliation status of hotels affected the Mean GOP Profit Margin, the Mean GOPPAR, and the Mean GOPPAR RSD over the observation period as presented in Table 5.
Means of Brand Affiliation Status.
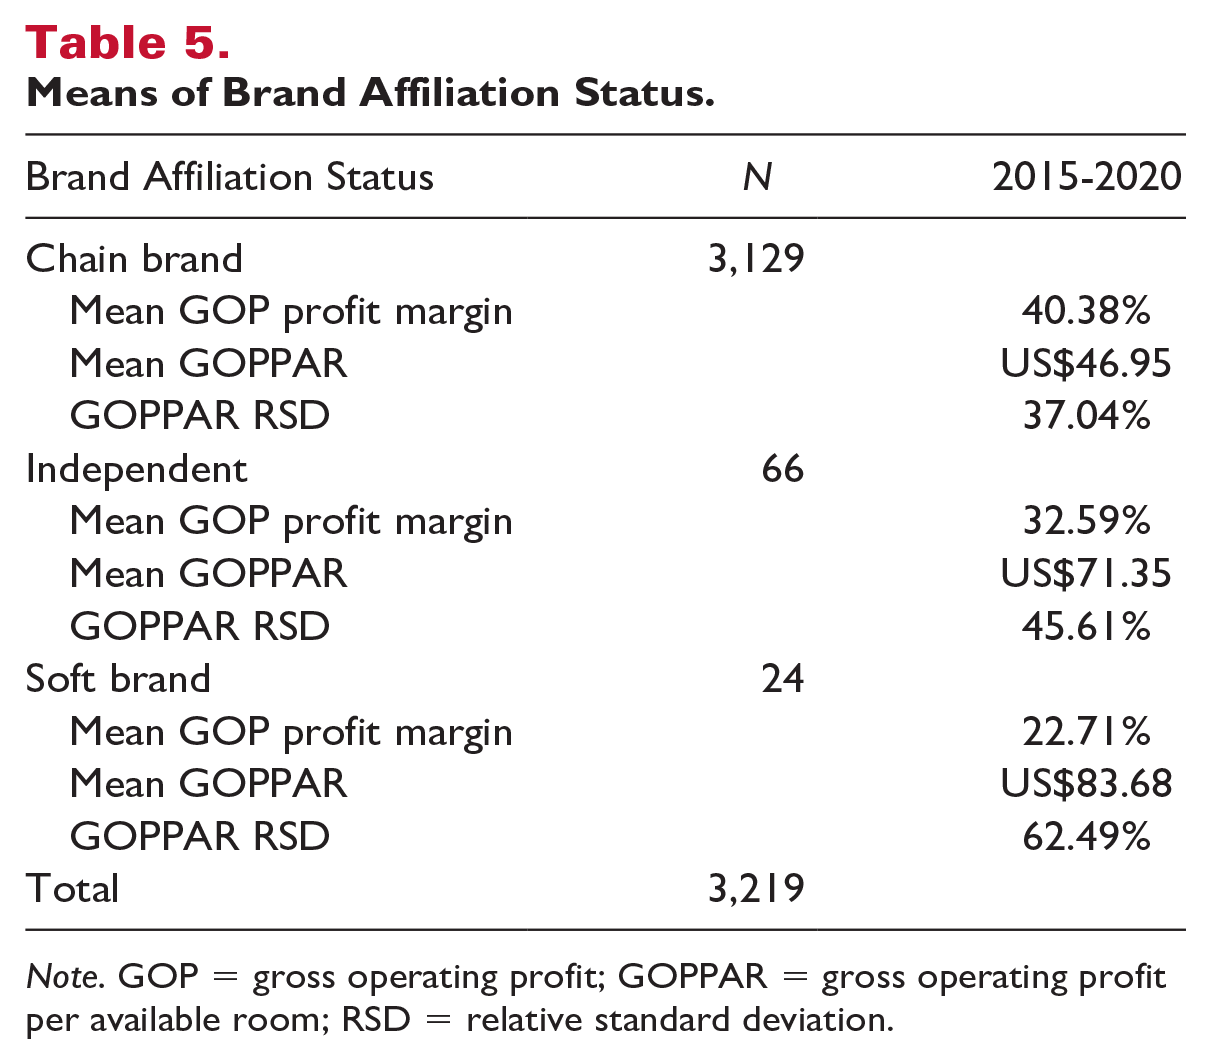
Note. GOP = gross operating profit; GOPPAR = gross operating profit per available room; RSD = relative standard deviation.
We found that chain branded hotels had the highest profit margin (GOP) at 40.38%, the lowest GOPPAR at US$46.95, and the lowest GOPPAR RSD at 37.04% among the three levels of brand affiliation status. In addition, the ANOVA model of brand affiliation status (chain-brand, soft-brand, and independent) was significant in predicting profit margin, F (2, 3,216) = 32.346, p < .001; GOPPAR, F (2, 3,216) = 29.873, p < .001; and GOPPAR RSD, F (2, 3,216) = 19.495, p < .001.
Hotel Class
Hotel class was analyzed based on the standard CBRE hotel classes of Luxury, Upper Upscale, Upscale, Upper Midscale, Midscale, and Economy, as presented in Table 6.
Means of Hotel Class.
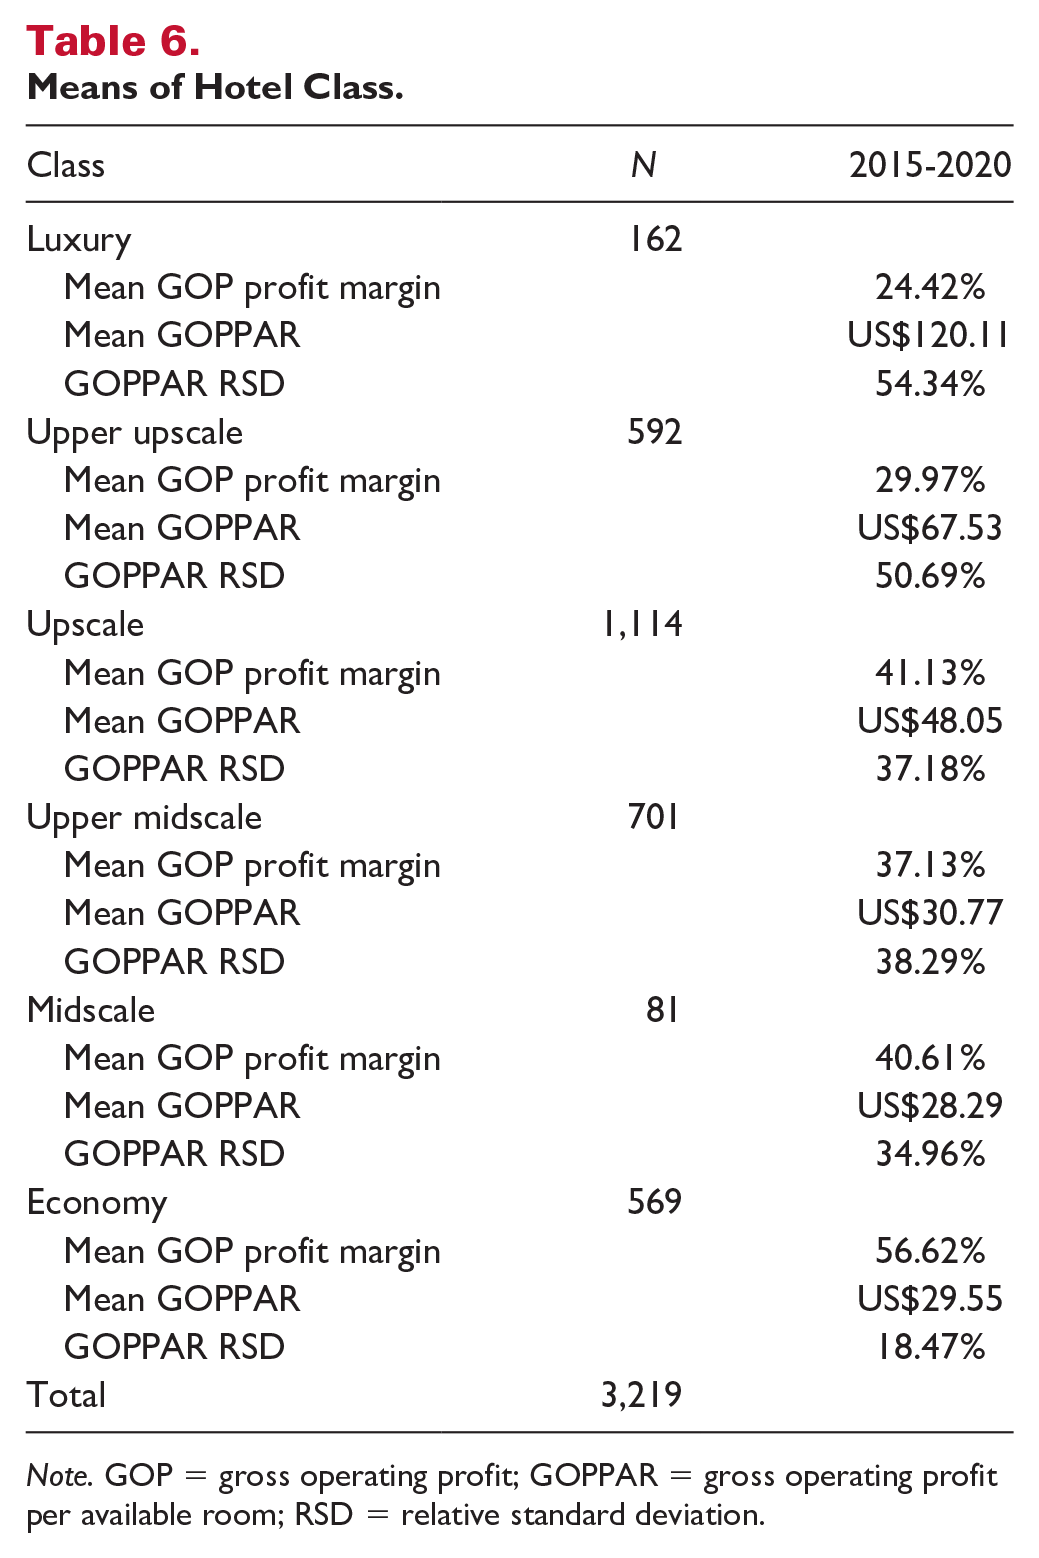
Note. GOP = gross operating profit; GOPPAR = gross operating profit per available room; RSD = relative standard deviation.
We found economy hotels had the highest GOP profit margin at 56.62%, the second lowest GOPPAR at US$29.55, and the lowest GOPPAR RSD at 18.47%, among six levels of class. In addition, the ANOVA model of hotel class was significant in predicting GOP profit margin, F (5, 3,213) = 552.883, p < .001; GOPPAR, F (5, 3,213) = 415.633, p < .001; and GOPPAR RSD, F (5, 3,213) = 174.682, p < .001.
Property Type
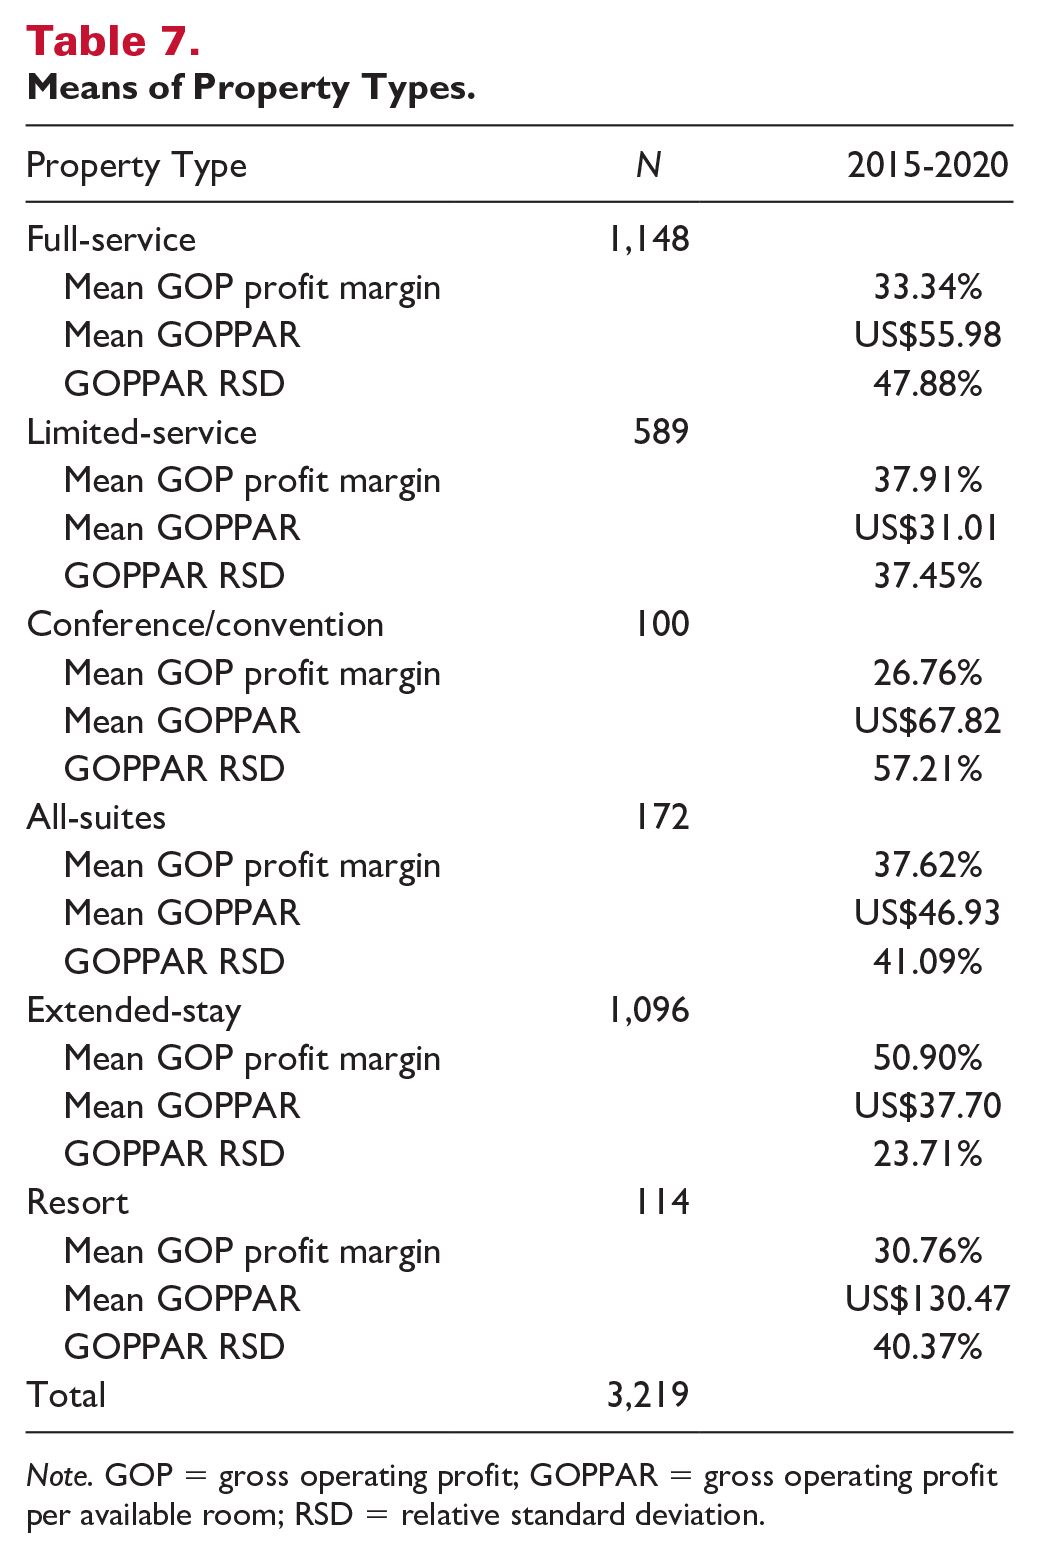
Property type was based on six levels using standard CBRE classifications: Full Service, Limited Service, Conference/Convention Center, All Suite, Extended Stay, and Resort, as presented in Table 7.
Means of Property Types.
Note. GOP = gross operating profit; GOPPAR = gross operating profit per available room; RSD = relative standard deviation.
We found that extended-stay hotels had the highest GOP profit margin at 50.90%, the second lowest GOPPAR at US$37.70, and the lowest GOPPAR RSD at 23.71%, among six levels of property types. In addition, the ANOVA model of property type was significant in predicting mean GOP profit margin, F (5, 3,213) = 381.064, p < .001; GOPPAR, F (5, 3,213) = 284.263, p < .000; and GOPPAR RSD, F (5, 3,213) = 186.081, p < .001.
Property Region
Property Region included nine regions based on standard CBRE and STR classifications, and Washington, DC, was included in the South Atlantic region, as follows:
New England (Maine, New Hampshire, Vermont, Massachusetts, Connecticut, Rhode Island)
Middle Atlantic (New York, Pennsylvania, New Jersey)
South Atlantic (Maryland, Delaware, West Virginia, Virginia, North Carolina, South Carolina, Georgia, Florida, Washington, DC)
East North Central (Michigan, Wisconsin, Illinois, Indiana, Ohio)
East South Central (Kentucky, Tennessee, Alabama, Mississippi)
West North Central (Minnesota, North Dakota, South Dakota, Iowa, Nebraska, Missouri, Kansas)
West South Central (Arkansas, Oklahoma, Texas, Louisiana)
Mountain (Montana, Idaho, Wyoming, Colorado, Utah, Nevada, Arizona, New Mexico)
Pacific (Alaska, Washington, Oregon, California, Hawaii)
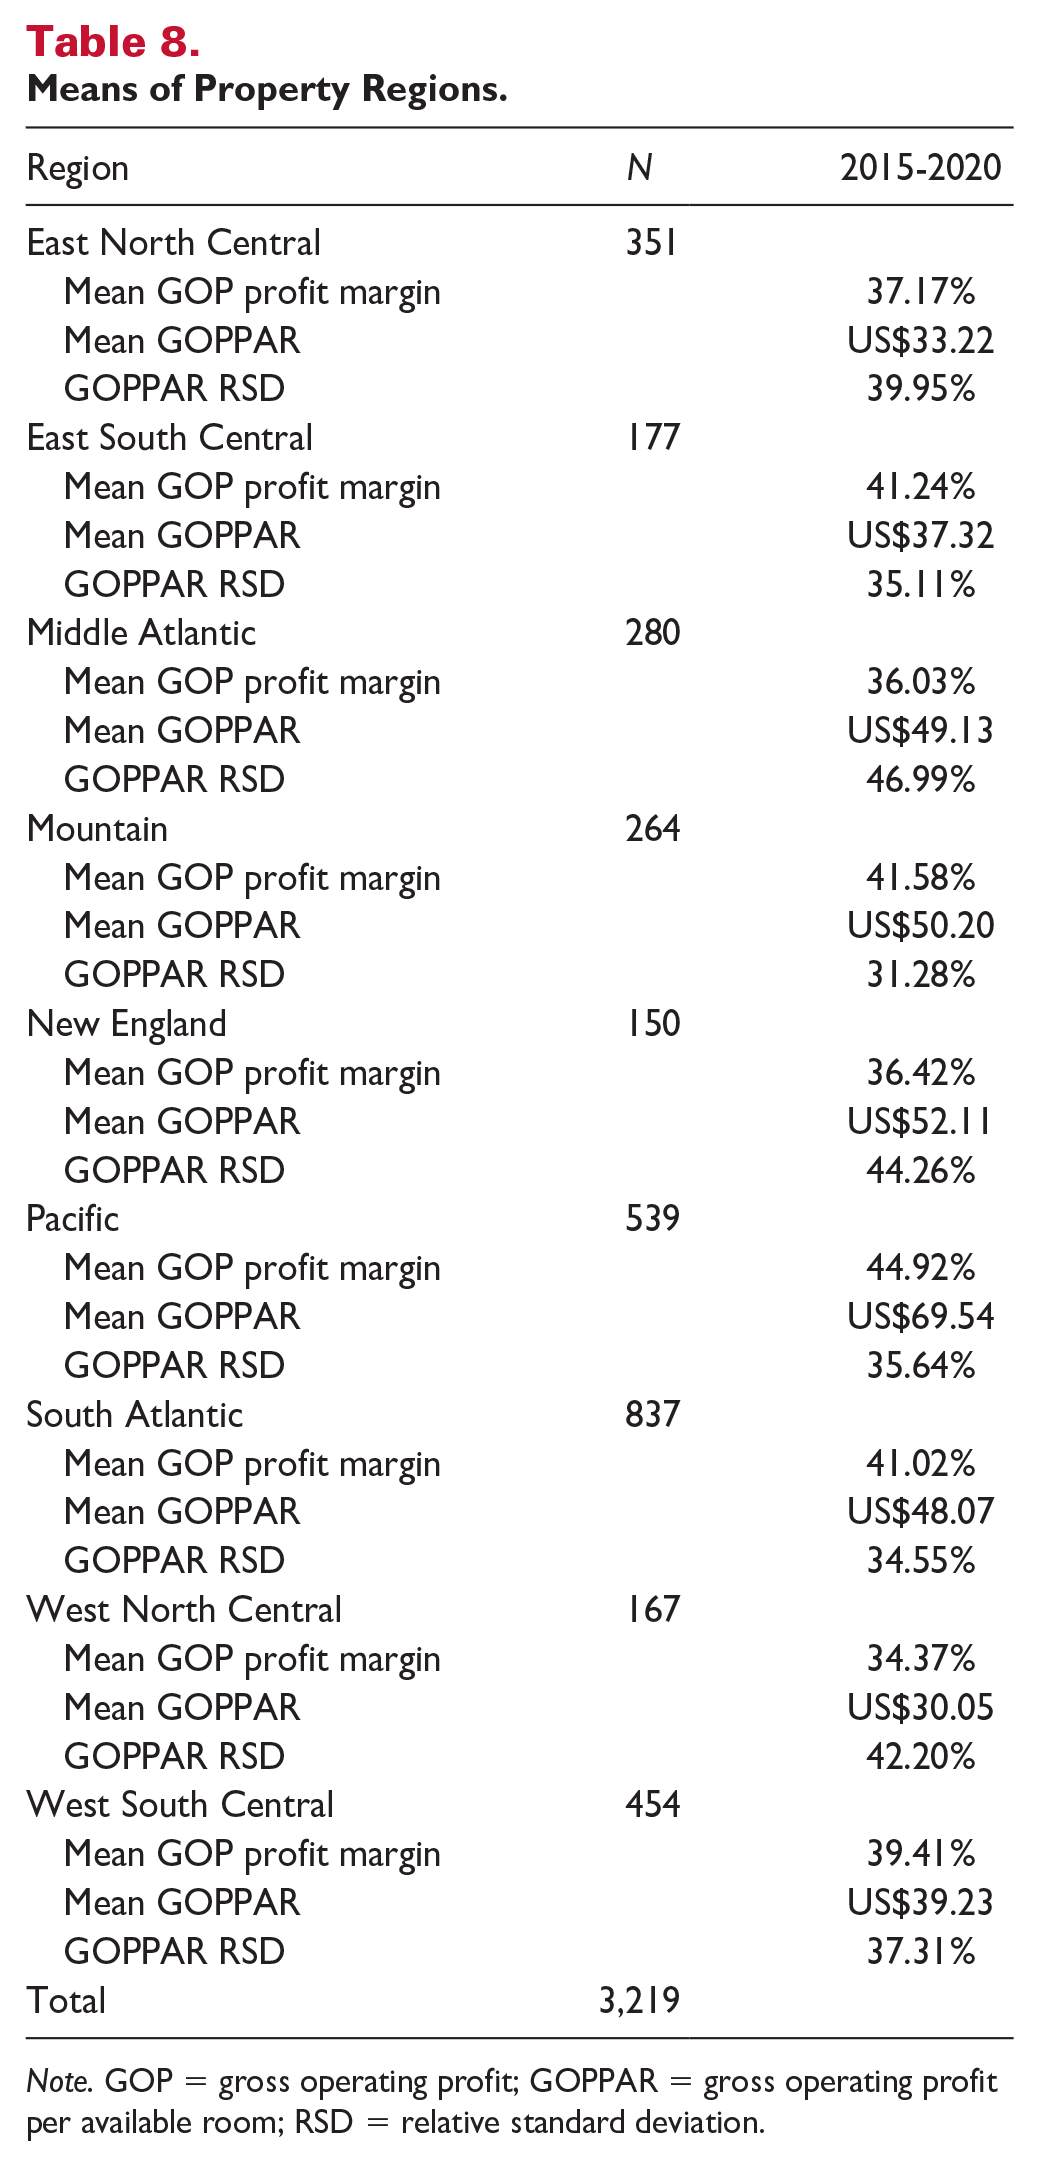
Our findings are presented in Table 8.
Means of Property Regions.
Note. GOP = gross operating profit; GOPPAR = gross operating profit per available room; RSD = relative standard deviation.
We found that hotels located in the Mountain region had the second highest GOP profit margin at 41.58%, the third highest GOPPAR at US$50.20, and the lowest GOPPAR RSD at 31.28% among the nine regions. In addition, the ANOVA model of hotel regions was significant in predicting mean GOP profit margin, F (8, 3,210) = 21.872, p < .001; GOPPAR, F (8, 3,210) = 52.130, p < .001; and GOPPAR RSD, F (8, 3,210) = 14.528, p < .001.
Property Location Type
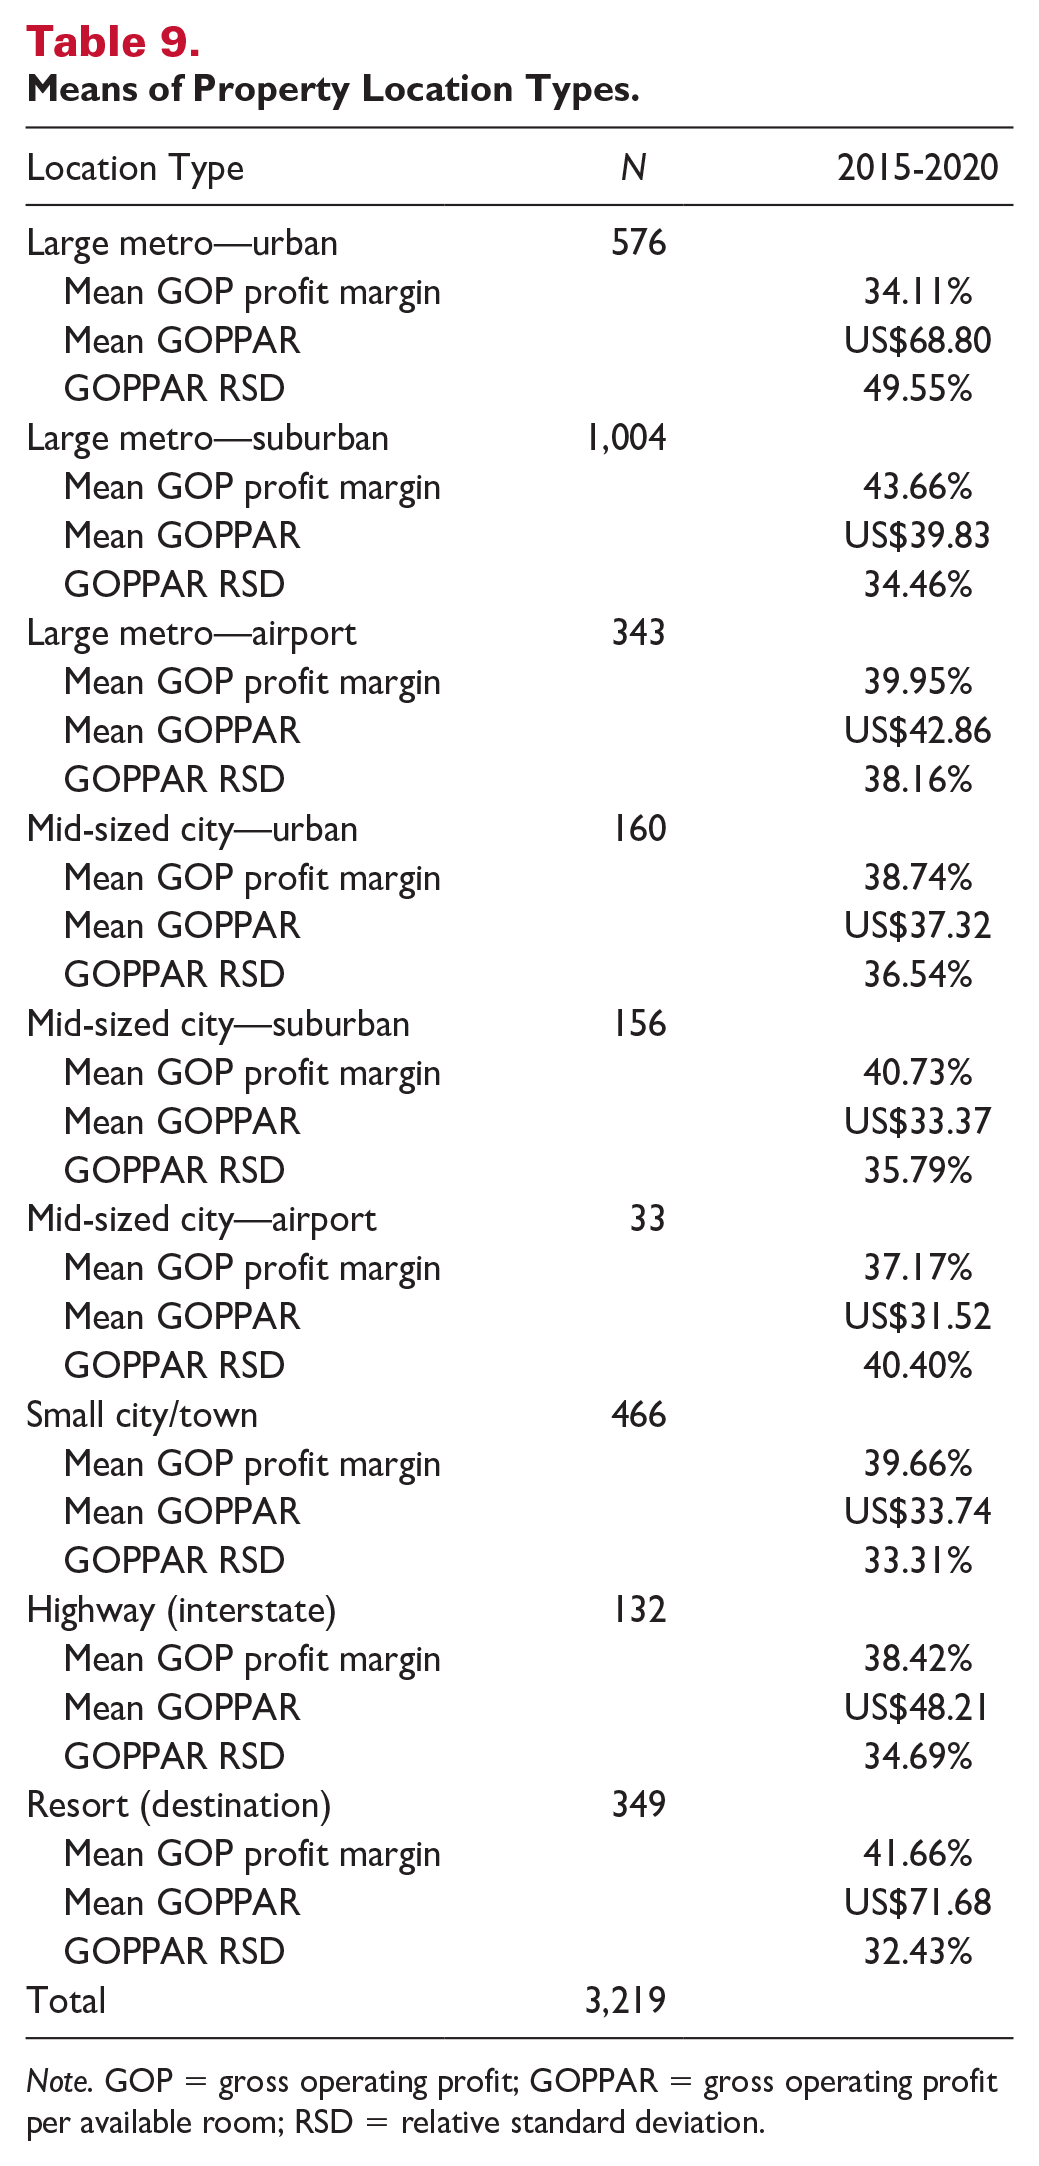
Property location type included nine types based on standard CBRE classifications: Large Metropolitan Airport, Large Metropolitan Urban, Large Metropolitan Suburban, Midsize City Airport, Midsize City Urban, Midsize City Suburban, Small City/Town, Resort (Destination), and Highway (Interstate) as presented in Table 9.
Means of Property Location Types.
Note. GOP = gross operating profit; GOPPAR = gross operating profit per available room; RSD = relative standard deviation.
We found Resort (Destination) hotels had the second highest GOP profit margin at 41.66%, the highest GOPPAR at US$71.68, and the lowest GOPPAR RSD at 32.43%, among the nine location types. In addition, the ANOVA model of hotel location was significant in predicting mean GOP profit margin, F (8, 3,210) = 26.559, p < .001; GOPPAR, F (8, 3,210) = 86.222, p < .001; and GOPPAR RSD, F (8, 3,210) = 28.942, p < .001.
Property Age (Years in Operation)
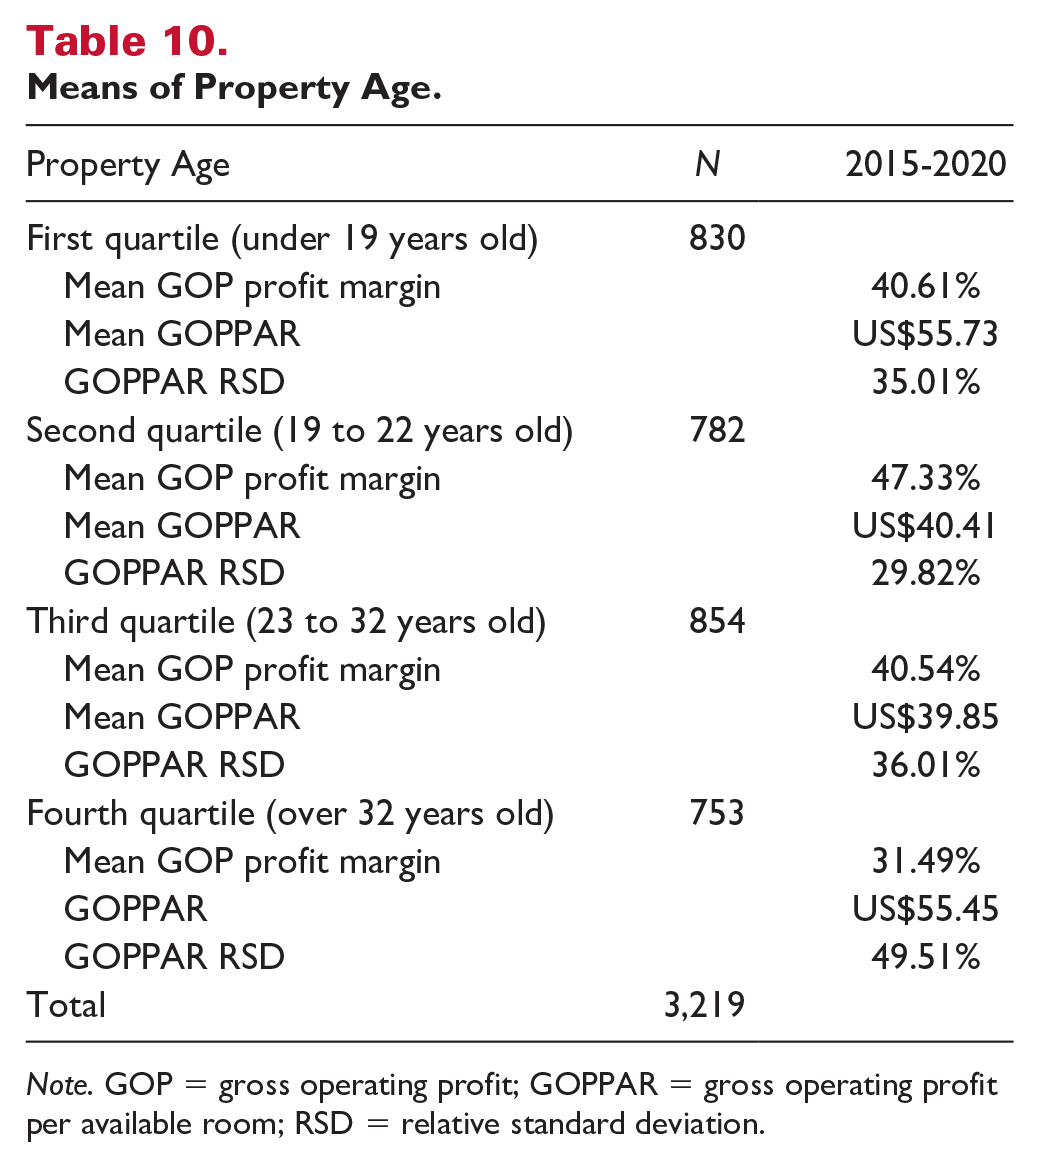
Property age (year opened) was analyzed based on four quartiles using SPSS descriptive statistics, as reported in Table 10.
Means of Property Age.
Note. GOP = gross operating profit; GOPPAR = gross operating profit per available room; RSD = relative standard deviation.
We found that the hotels in the second quartile, between 19 and 22 years old, had the highest GOP profit margin at 47.33%, the second lowest GOPPAR at US$40.41, and the lowest GOPPAR RSD at 29.82%, among the four quartiles of age. In addition, the ANOVA model of hotel age was significant in predicting mean GOP profit margin, F (3, 3,215) = 220.026, p < .001; GOPPAR, F (3, 3,215) = 56.979, p < .001; and GOPPAR RSD, F (3, 3,215) = 115.233, p < .001.
Property Size
Property size was reported as the total room count of each hotel property. We used the mean number of rooms available for each property for the observation period as the independent variable. We analyzed the dataset based on four quartiles, as previously discussed, as reported in Table 11.
Means of Property Size.
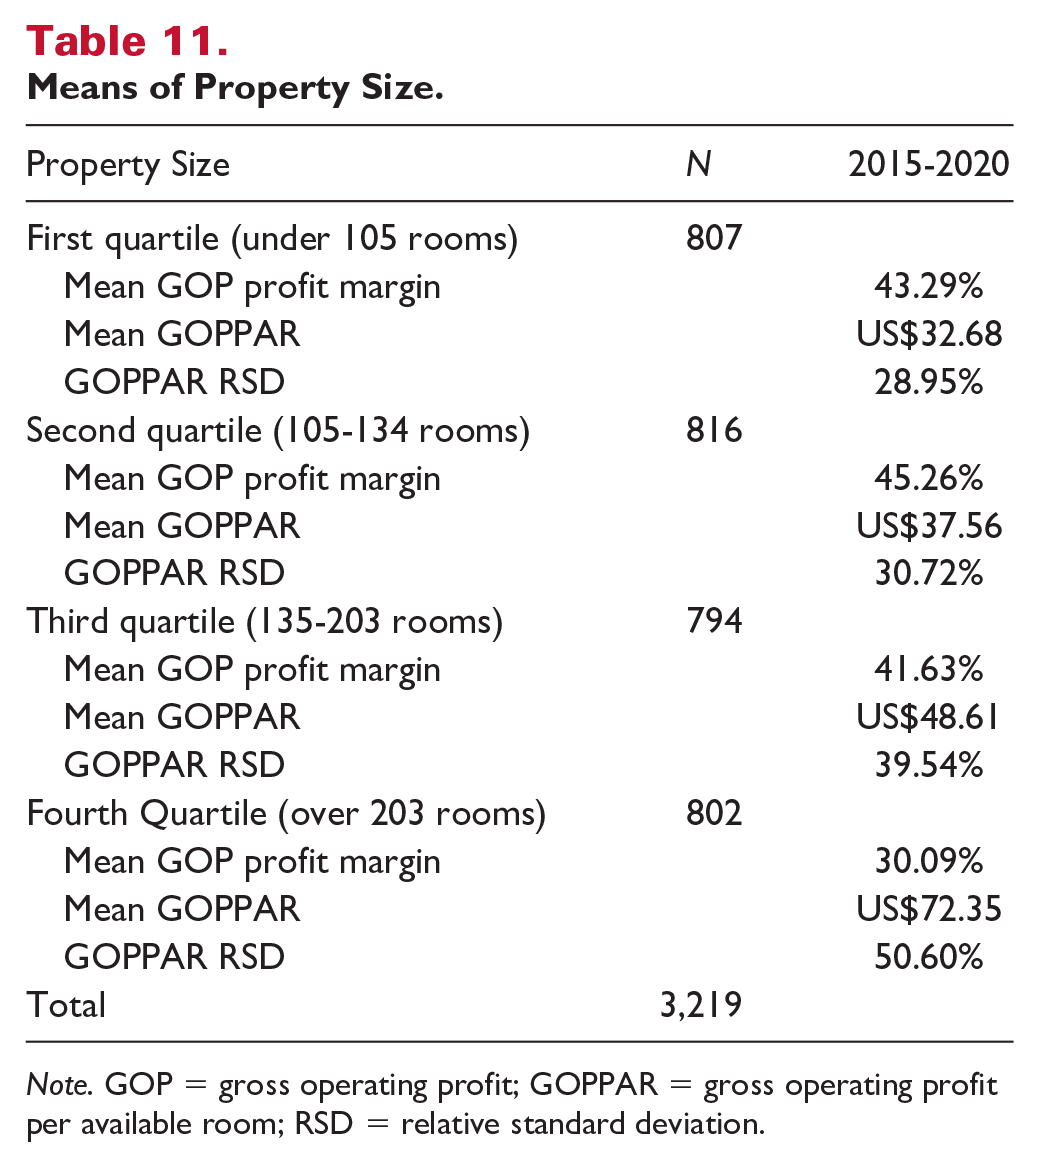
Note. GOP = gross operating profit; GOPPAR = gross operating profit per available room; RSD = relative standard deviation.
We found that hotels in the first quartile (under 105 rooms), had the second highest GOP profit margin at 43.29%, the lowest GOPPAR at US$32.68, and the lowest GOPPAR RSD at 28.95%, among four quartiles of size. In addition, the ANOVA model of hotel size was significant in predicting mean GOP profit margin, F (3, 3,215) = 262.674, p < .001; GOPPAR, F (3, 3,215) = 263.249, p < .001; and GOPPAR RSD, F (3, 3,215) = 177.962, p < .001.
Occupancy
Occupancy percentage was calculated by dividing the number of room nights sold (occupied) by room nights available for each hotel for each year. We used the mean of annual occupancy for the period of 2015 to 2020 as the independent variable to test the variances of dependent variables based on four quartiles, as previously discussed, as presented in Table 12.
Means of Occupancy.
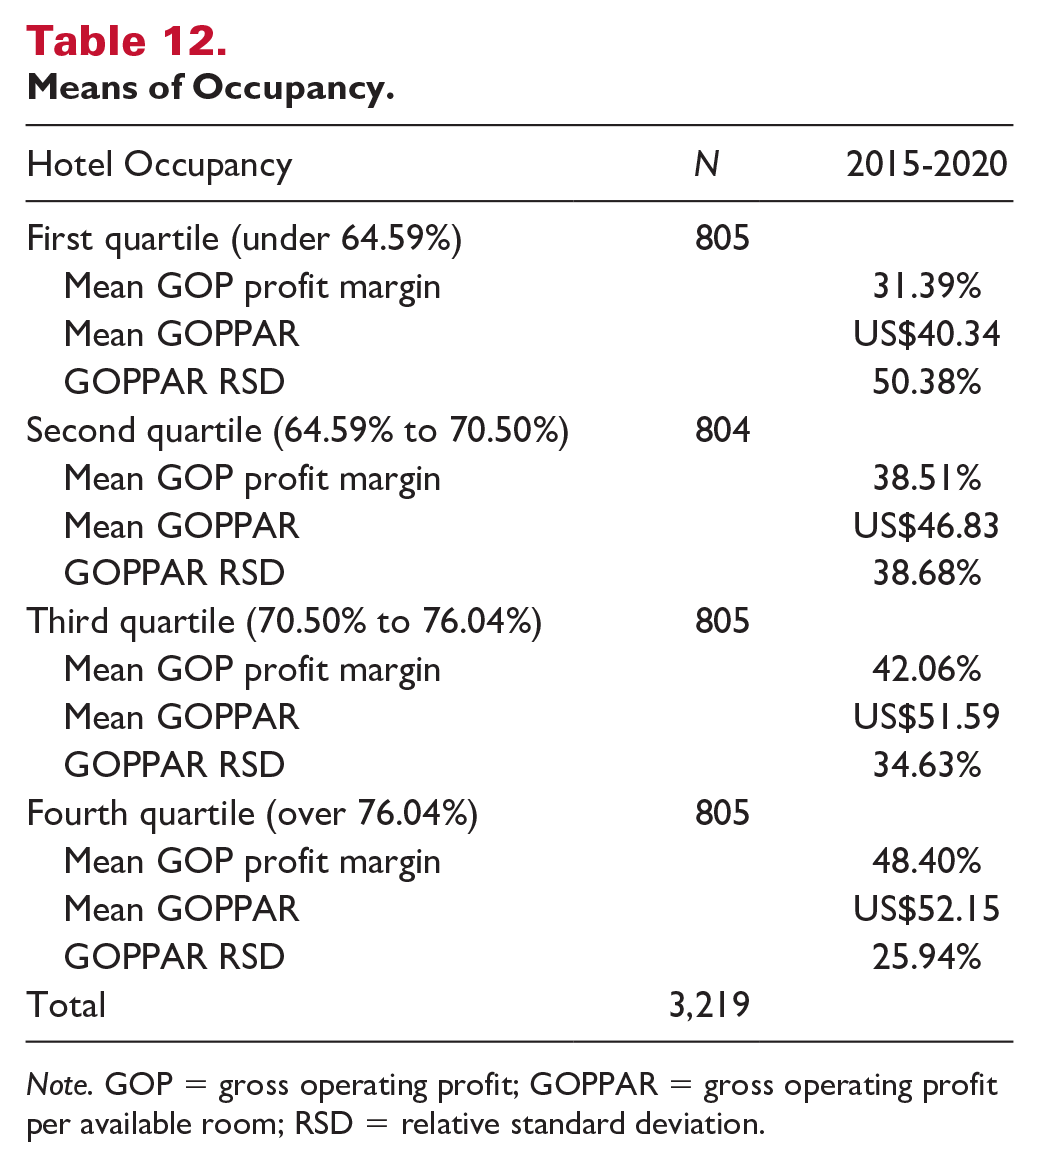
Note. GOP = gross operating profit; GOPPAR = gross operating profit per available room; RSD = relative standard deviation.
We found a clear pattern in which, the higher occupancy quartile is associated with the higher mean GOPPAR, the higher GOP profit margin, the lower GOPPAR RSD. In particular, hotels in the fourth quartile, with occupancy above 76.04%, had the highest GOP profit margin at 48.40%, the highest GOPPAR at US$52.15, and the lowest GOPPAR RSD at 25.94% among the four occupancy quartiles. In addition, the ANOVA model of hotel occupancy was significant in predicting mean GOP profit margin, F (3, 3,215) = 291.300, p < .001; GOPPAR, F (3, 3,215) = 20.672, p < .001; and GOPPAR RSD, F (3, 3,215) = 188.073, p < .001.
Average Daily Rate
ADR was calculated by dividing the rooms revenues by rooms sold (occupied) for each hotel for each year. We used the average ADR for the period of 2015 to 2020 as the independent variable to test the variances of dependent variables. We sorted the dataset into four quartiles, as previously discussed, as presented in Table 13.
Means of ADR.
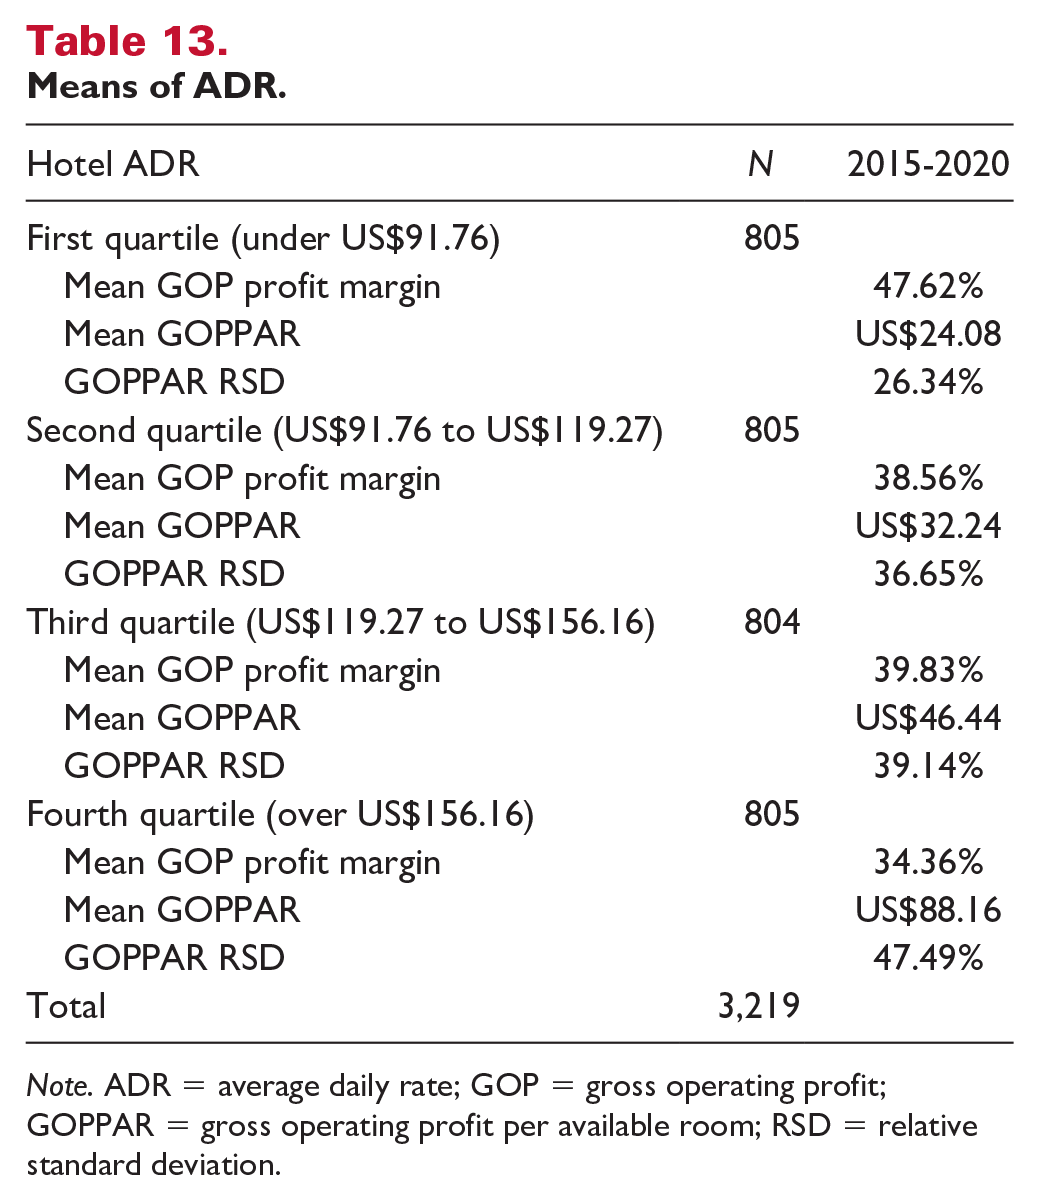
Note. ADR = average daily rate; GOP = gross operating profit; GOPPAR = gross operating profit per available room; RSD = relative standard deviation.
We found hotels in the first quartile, with ADRs under US$91.76, had the highest GOP profit margin at 47.62%, the lowest GOPPAR at US$24.08, and the lowest GOPPAR RSD at 26.34% among four quartiles of ADR. In addition, the ANOVA model of hotel ADR was significant in predicting mean GOP profit margin, F (3, 3,215) = 160.067, p < .001; GOPPAR, F (3, 3,215) = 1,129.237, p < .001; and GOPPAR RSD, F (3, 3,215) = 132.468, p < .001.
Two-Dimensional Combination Effects
To examine the combined effects of two predictors on hotel investment risk, we applied the heatmap technique to visually demonstrate the variation of GOP RSD across combinations of hotel class and other independent variables.
Hotel Class and Region
As illustrated in Table 14, luxury hotels in the Middle Atlantic region had the highest GOP RSD (risk) at 91.84%, while economy hotels had the lowest risk, in general, and economy hotels in the Middle Atlantic region had the absolute lowest risk at 15.62%.
Combined Effects of Hotel Class and Region on GOPPAR RSD.
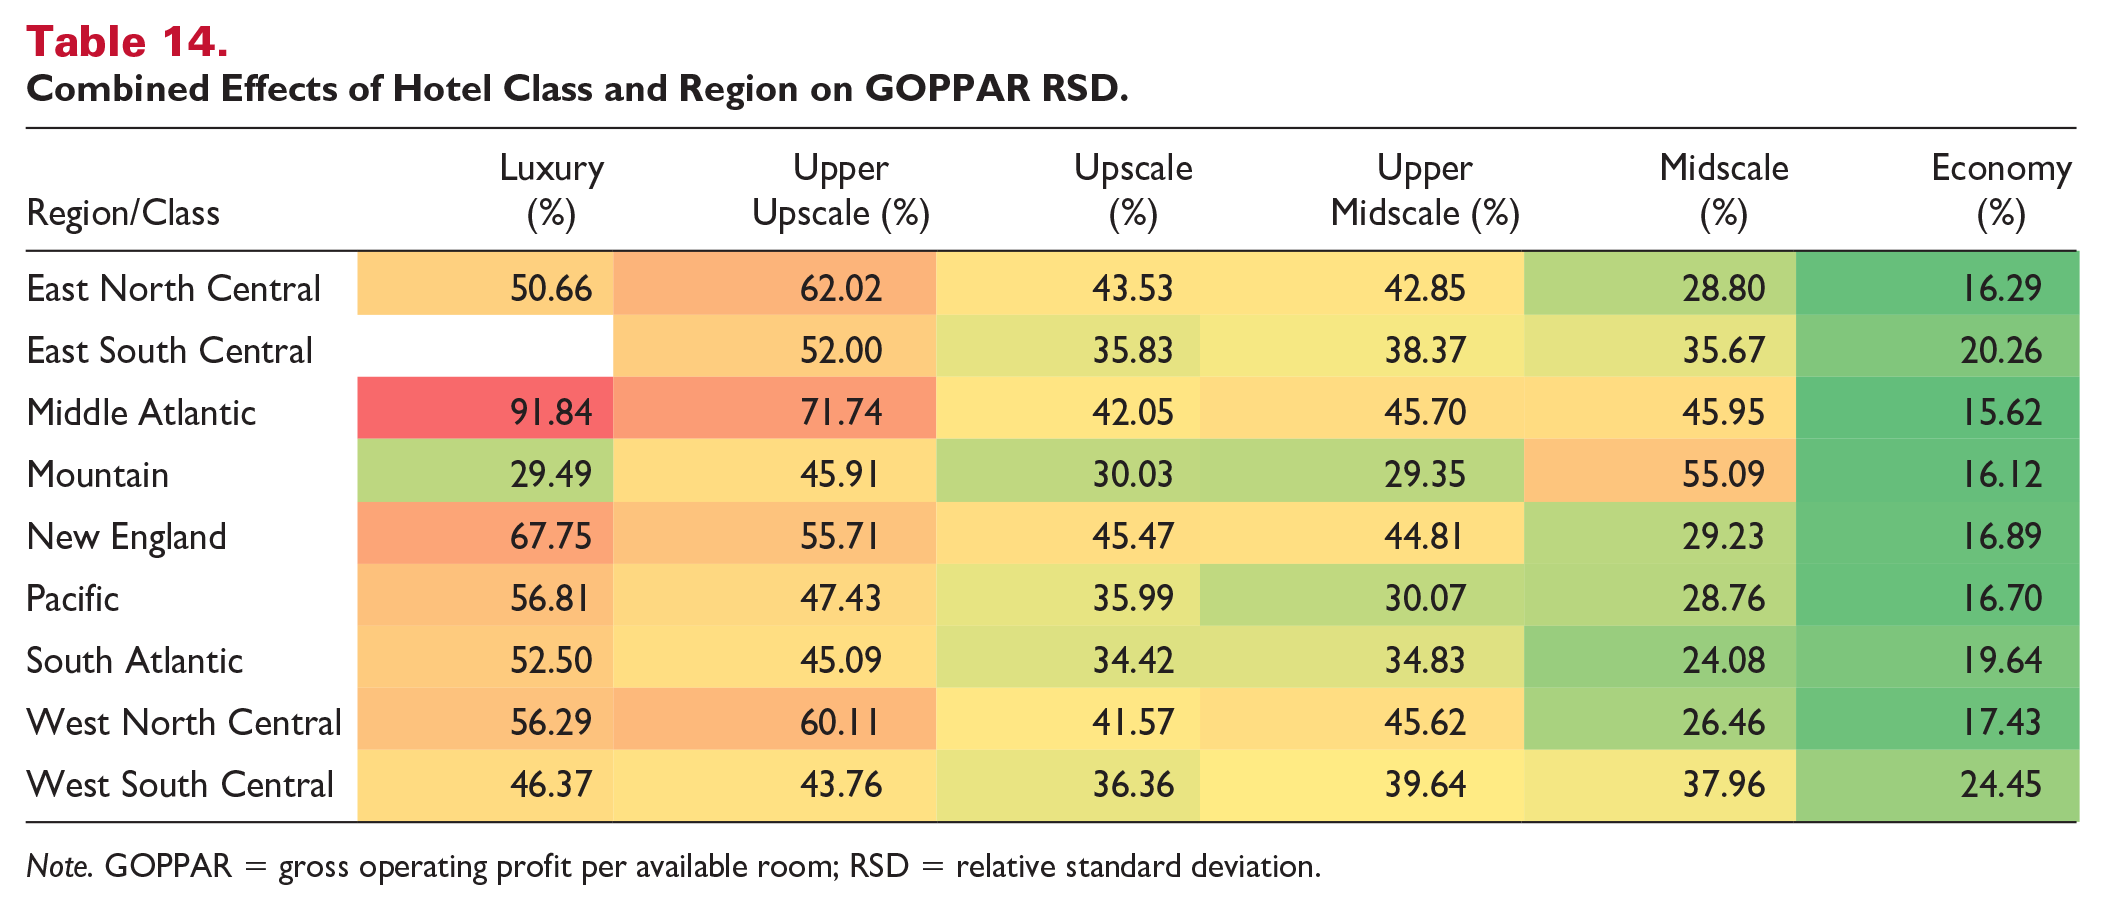
Note. GOPPAR = gross operating profit per available room; RSD = relative standard deviation.
Hotel Class and Property Type
As shown in Table 15, we found that midscale, full-service hotels had the highest GOP RSD (risk) at 100.29%, while the economy and extended-stay hotels generally had the lowest risk, with economy extended-stay hotels having the absolute lowest risk at 18.02%.
Combined Effects of Hotel Class and Property Type on GOPPAR RSD.
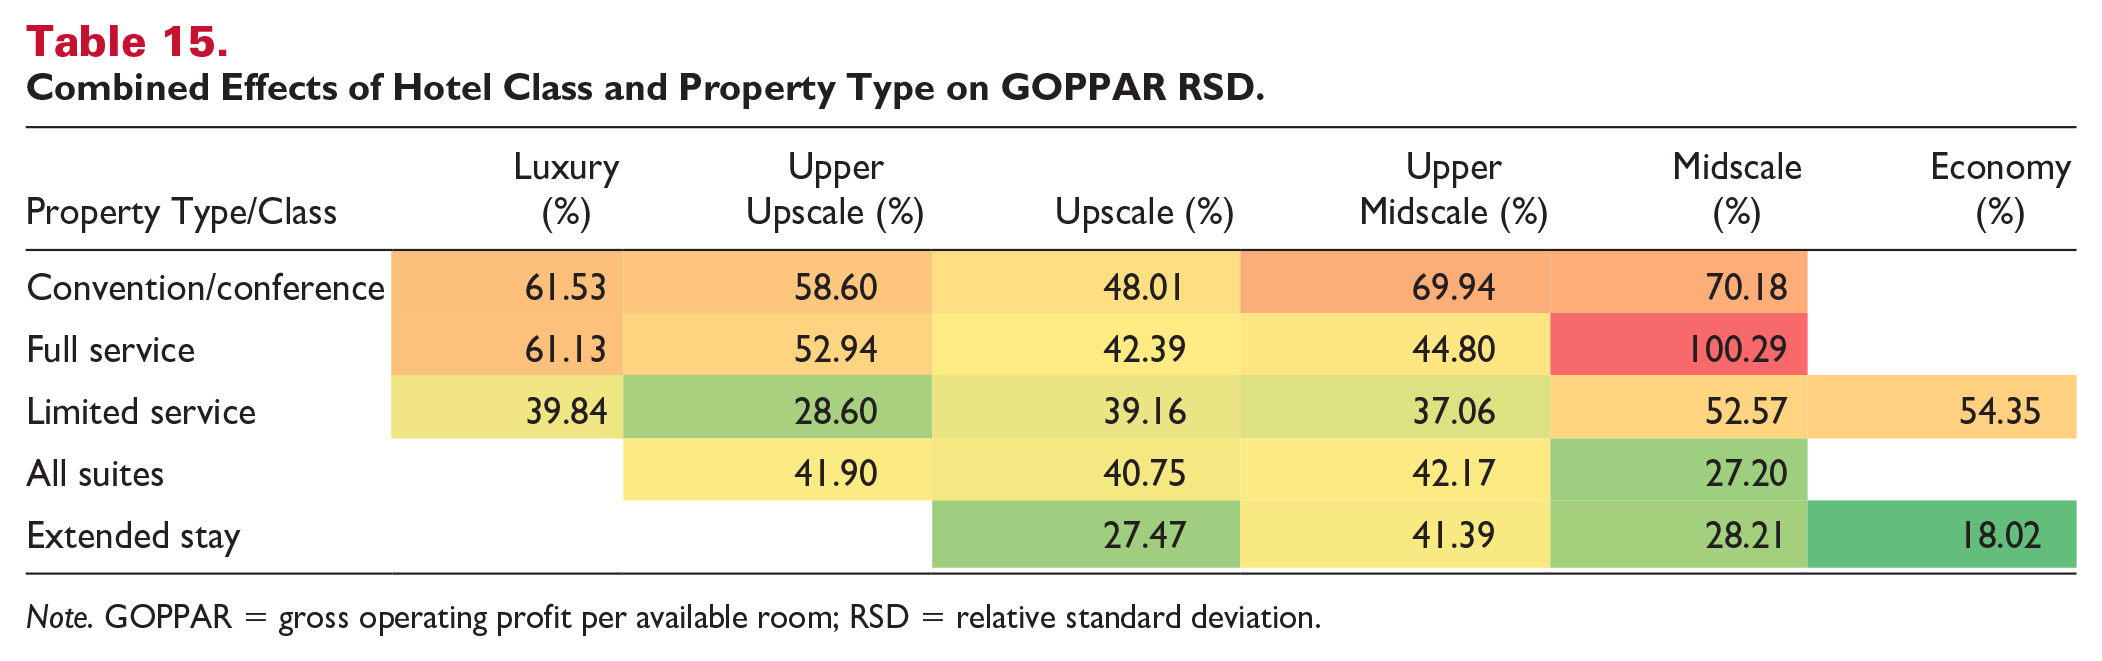
Note. GOPPAR = gross operating profit per available room; RSD = relative standard deviation.
Hotel Class and Location Type
As shown in Table 16, we found that midscale hotels located along interstate highways had the highest GOP RSD (risk) at 102.41%, while economy hotels located in small cities or towns had the lowest risk at 17.08%.
Combined Effects of Hotel Class and Location Type on GOPPAR RSD.
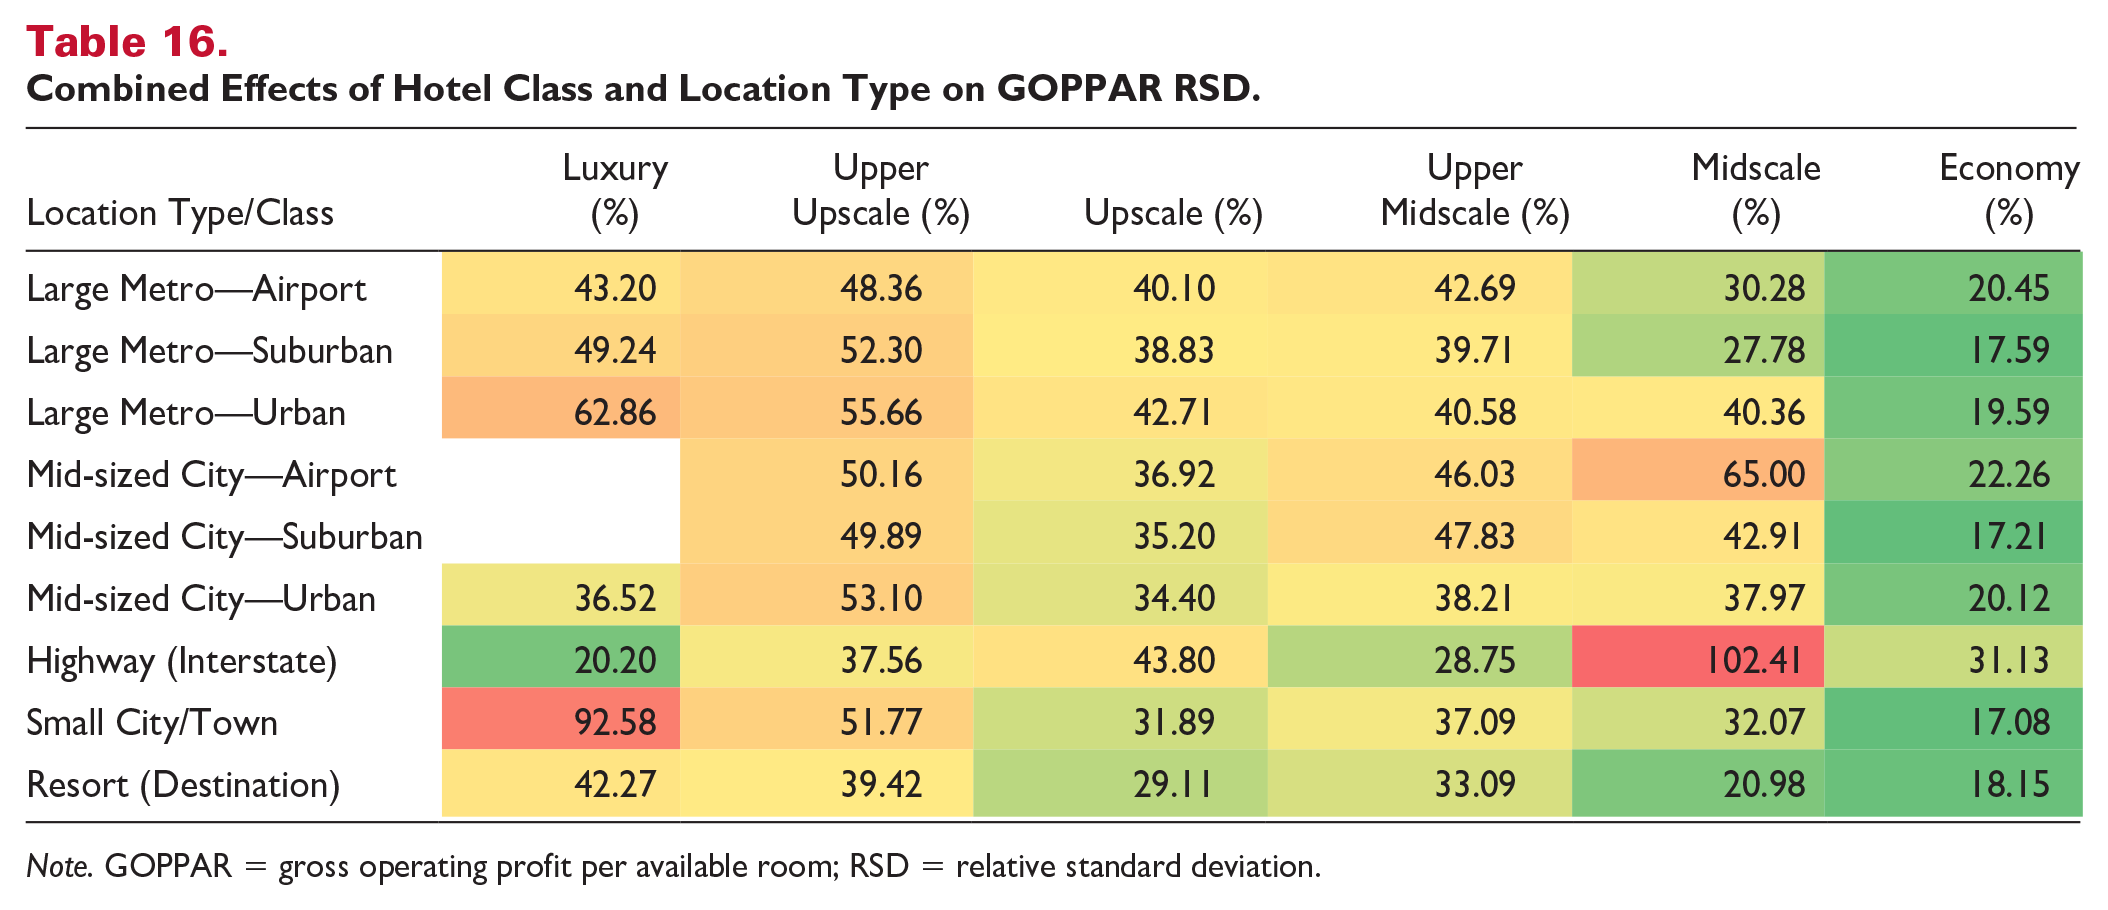
Note. GOPPAR = gross operating profit per available room; RSD = relative standard deviation.
Hotel Class and Brand Affiliation Status
As shown in Table 17, we found that soft-branded, upper upscale hotels had the highest GOP RSD (risk) at 78.37%, while chain-branded, economy hotels had the lowest risk at 18.42%.
Combined Effects of Hotel Class and Brand Affiliation Status on GOPPAR RSD.
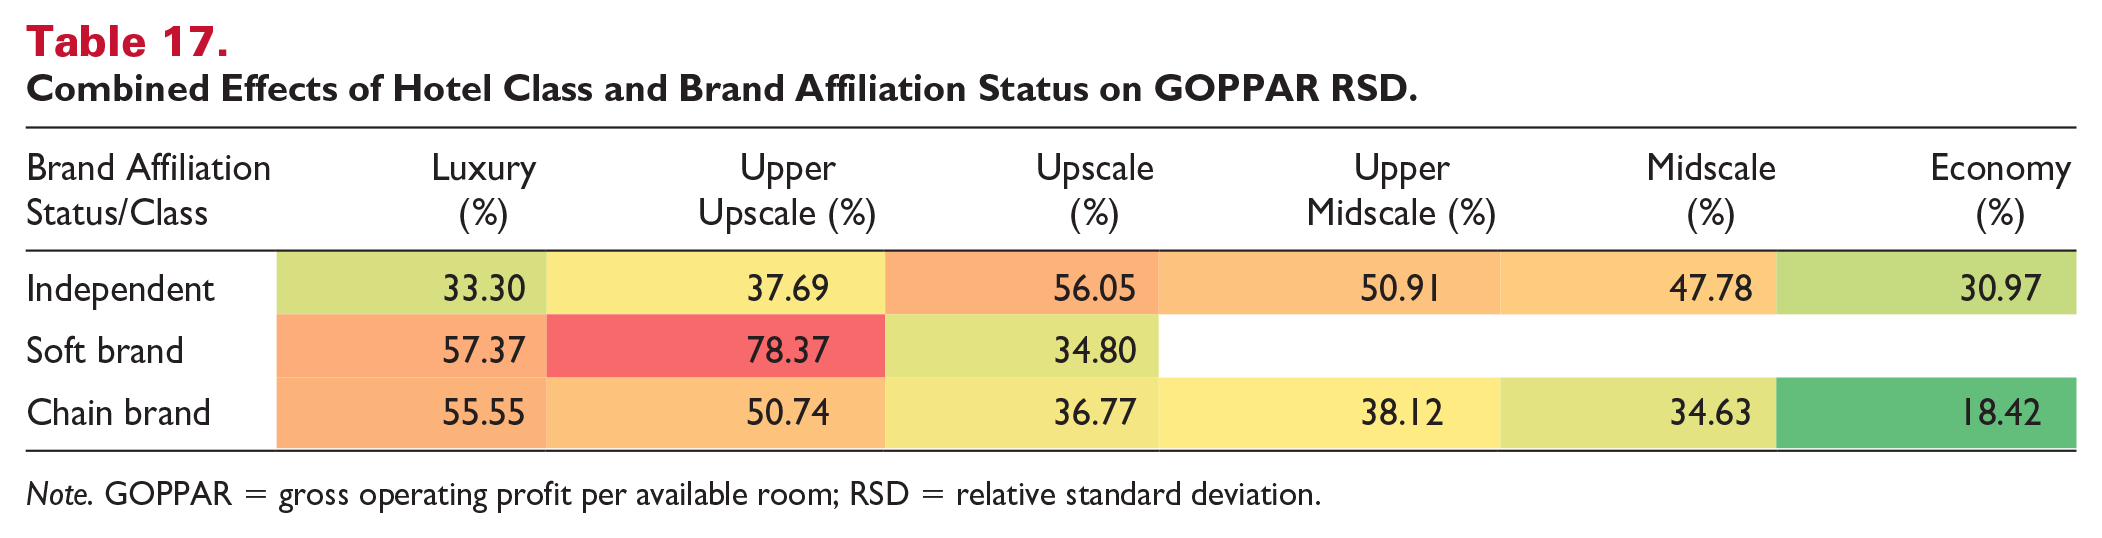
Note. GOPPAR = gross operating profit per available room; RSD = relative standard deviation.
Hotel Class and Occupancy
As shown in Table 18, we found that midscale hotels operating with an annual occupancy rate below 64.59% (first quartile) had the highest GOP RSD (risk) at 74.26%, while economy hotels with an annual occupancy rate over 76.04% (fourth quartile) had the lowest risk at 16.31%.
Combined Effects of Hotel Class and Occupancy on GOPPAR RSD.
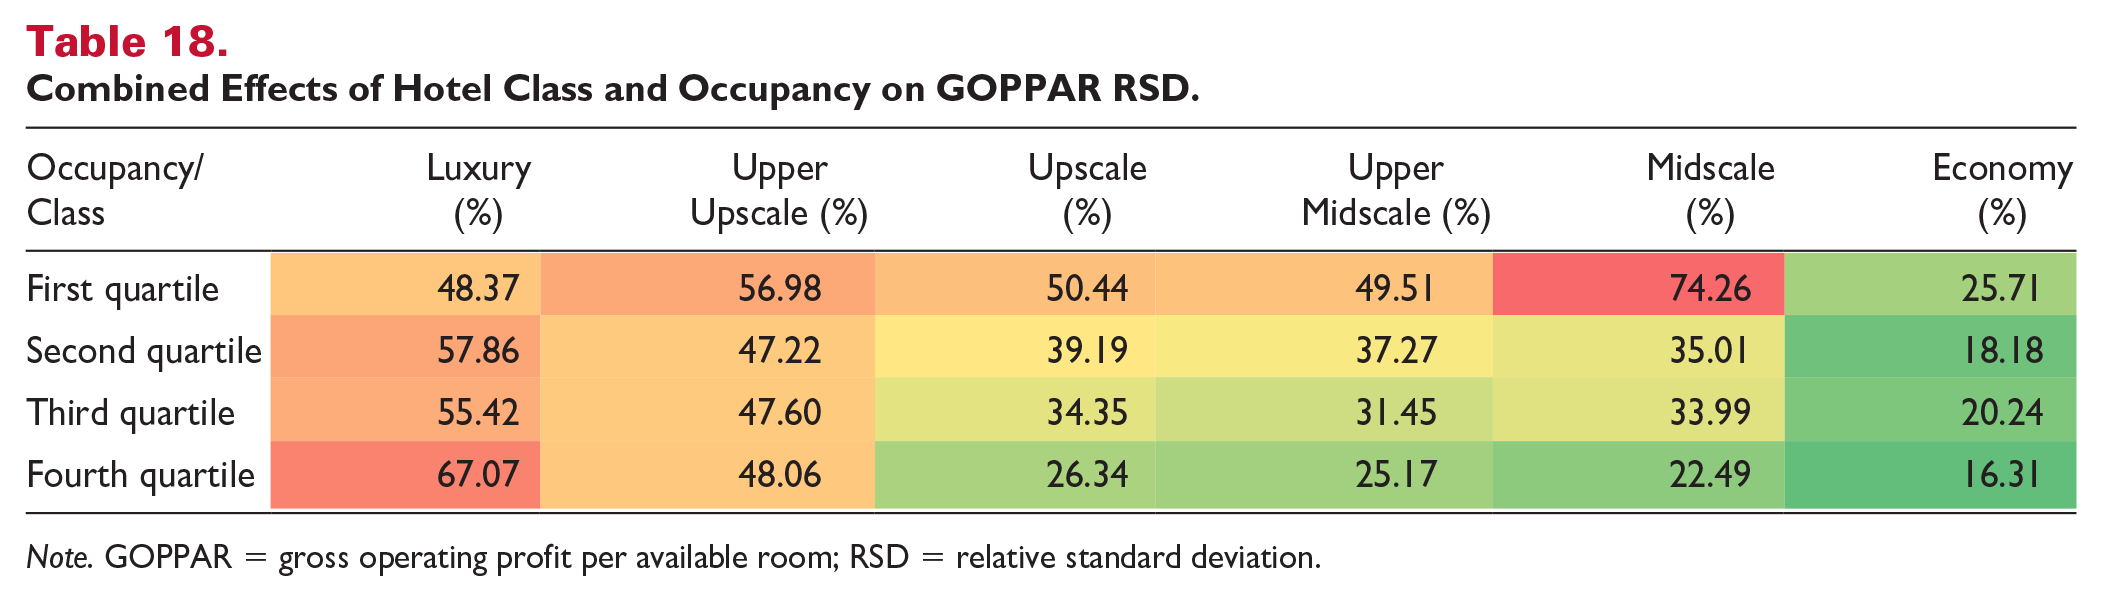
Note. GOPPAR = gross operating profit per available room; RSD = relative standard deviation.
Hotel Class and ADR
As shown in Table 19, we found that Upper Upscale hotels with an annual ADR between US$91.76 to US$119.27 (second quartile) had the highest GOP RSD (risk) at 60.57%, while economy hotels with an annual ADR under US$91.76 (first quartile) had the lowest risk at 18.05%.
Combined Effects of Hotel Class and ADR on GOPPAR RSD.
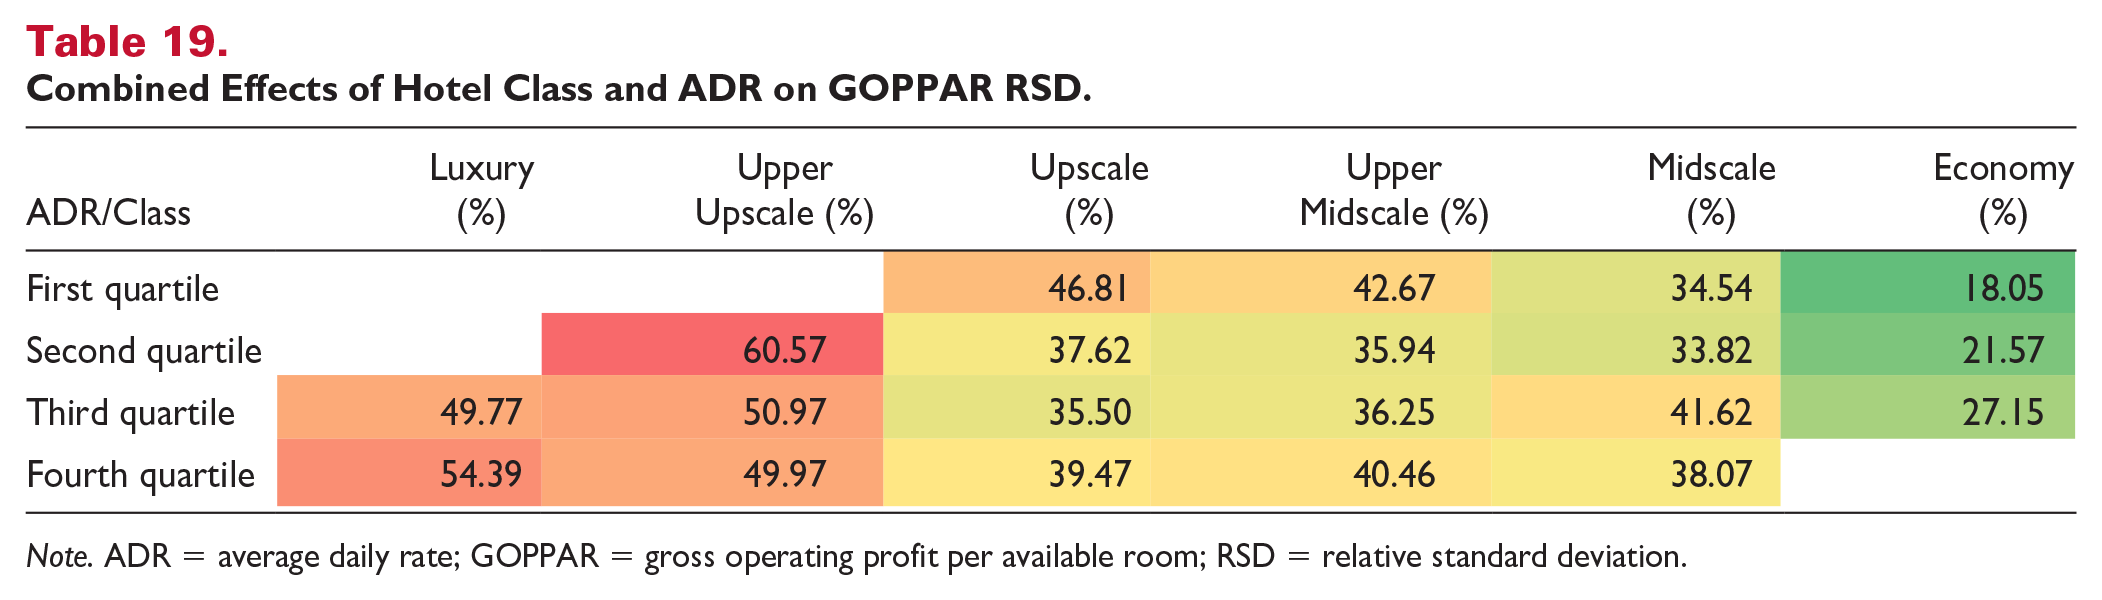
Note. ADR = average daily rate; GOPPAR = gross operating profit per available room; RSD = relative standard deviation.
Multi-Dimensional Effects
Table 20 presents the multiple regression results for four models. The dependent variable is GOPPAR RSD (hotel risk). The main results from the sample of 3,219 observations are shown in the coefficients of each model from (1) to (4), as follows:
Model 1—without controlling for performance variables.
Model 2—controlling for the mean occupancy rate.
Model 3—controlling for the mean ADR.
Model 4—controlling for the mean RevPAR.
The regression coefficients (adjusted R2 statistics) are similar across the four models. Model 2, which controls for the mean occupancy rate, achieves the highest adjusted R2.
GOPPAR RSD Regression Results of Four Multiple Regression Models.
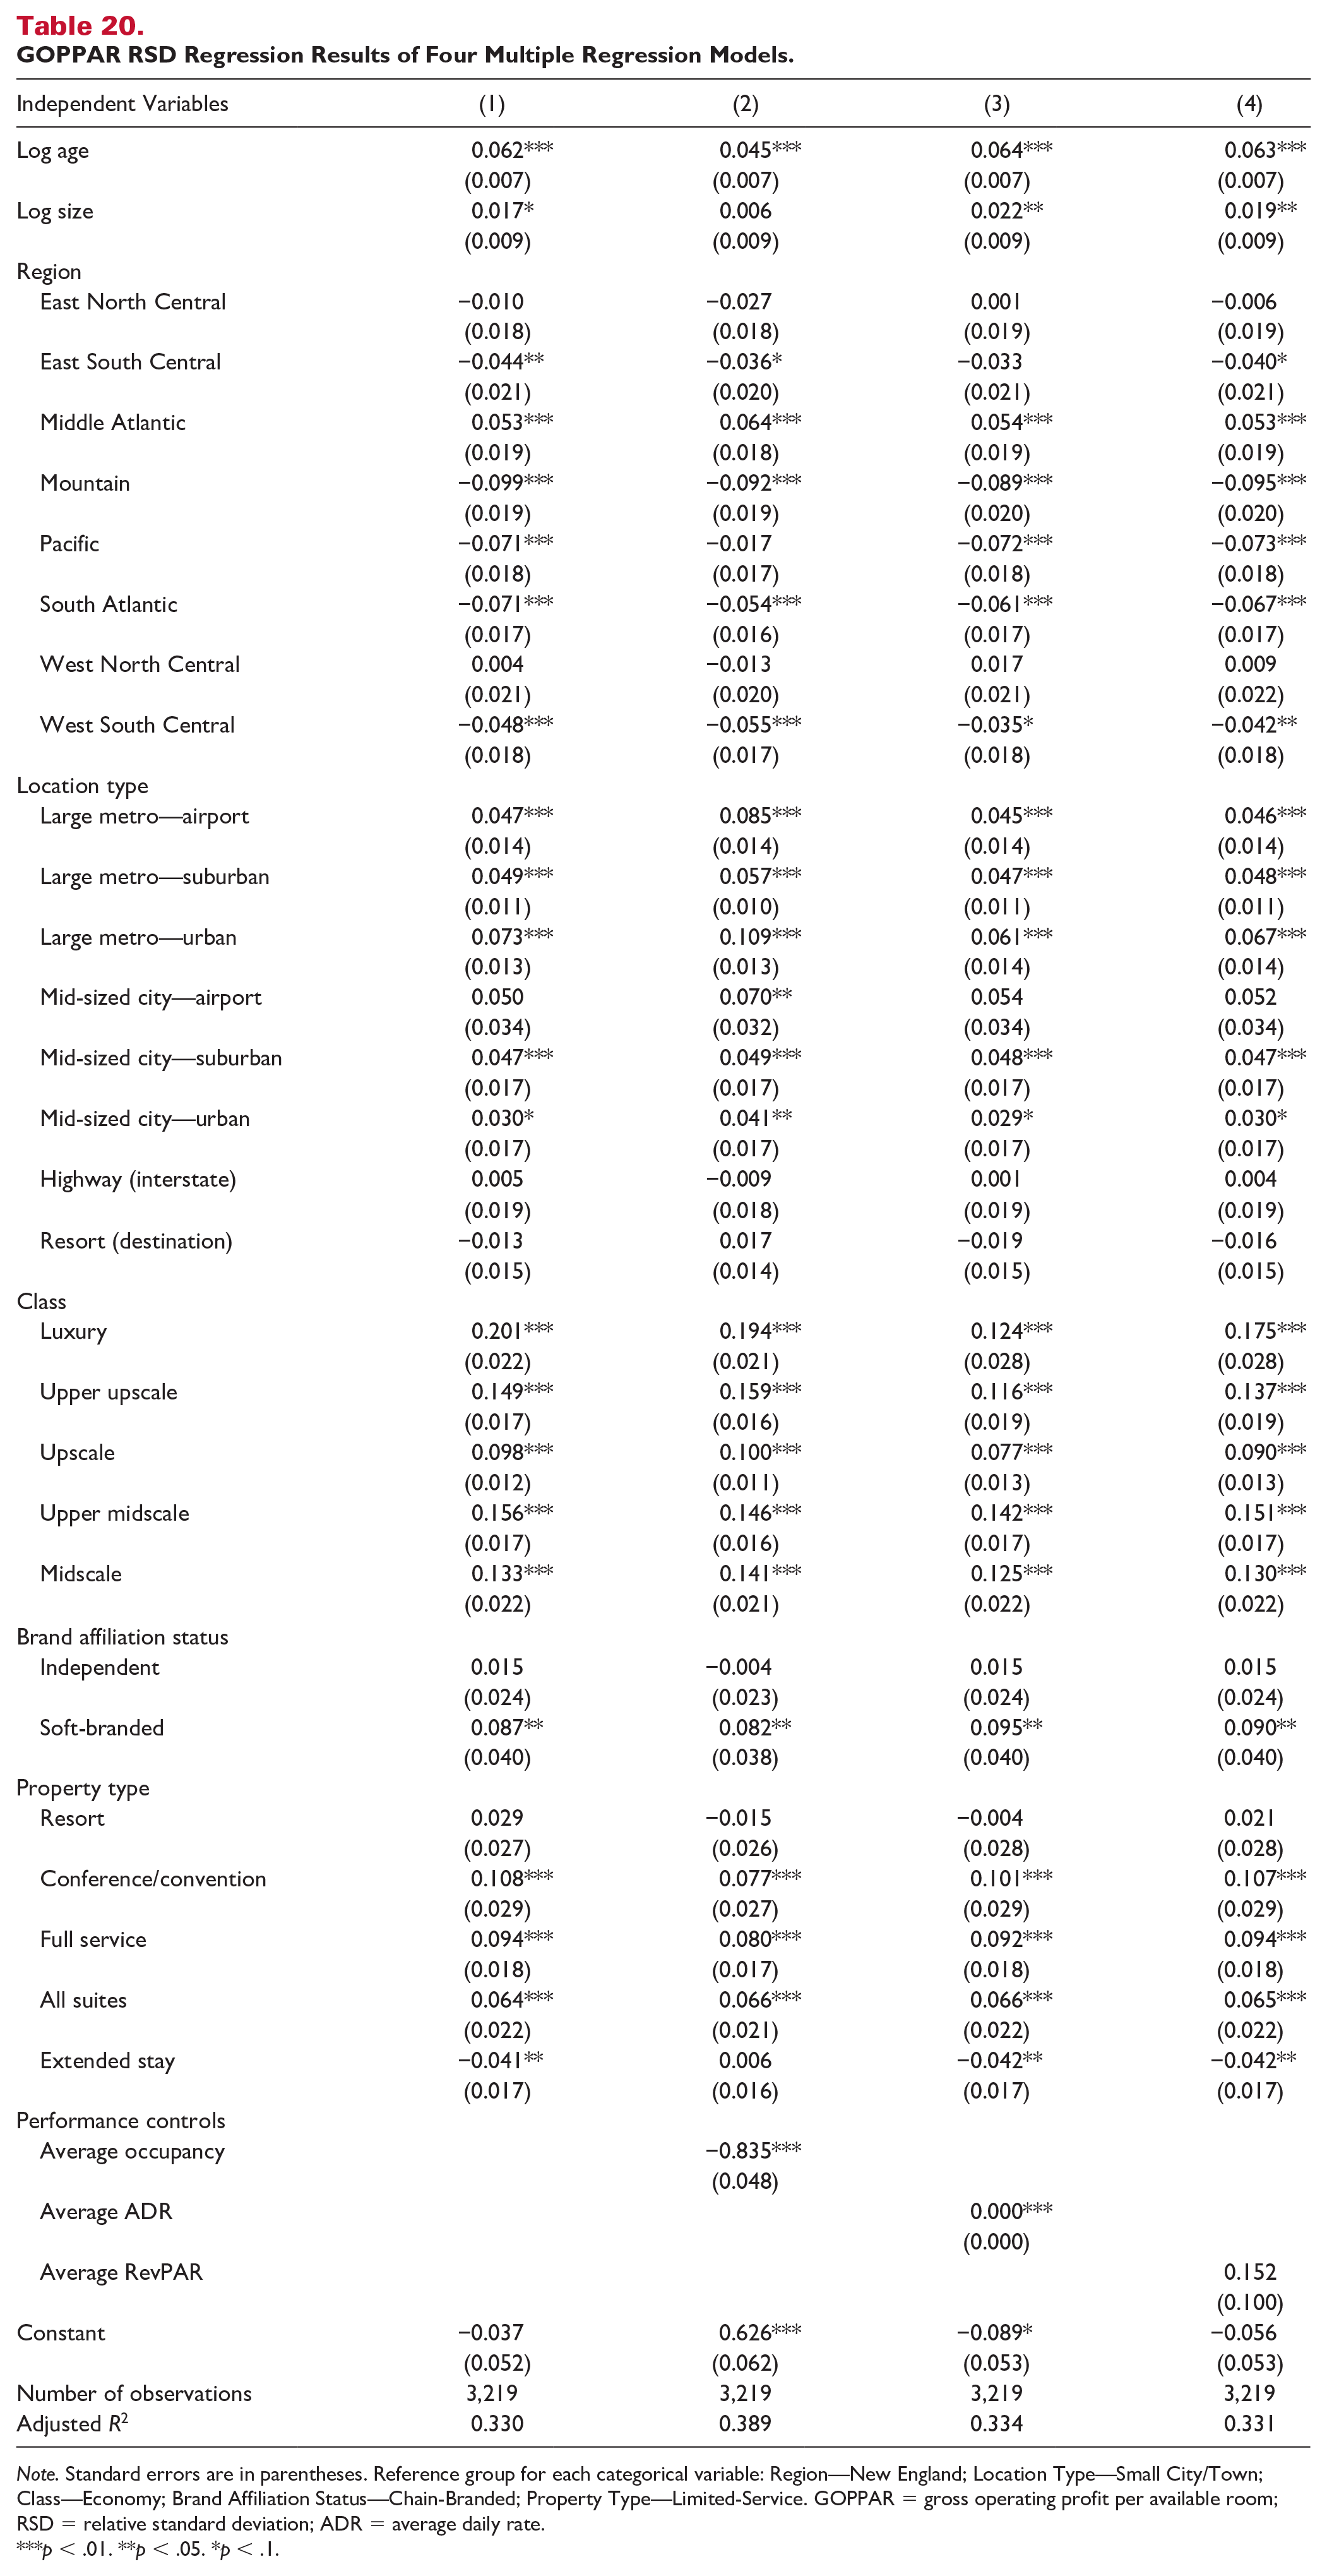
Note. Standard errors are in parentheses. Reference group for each categorical variable: Region—New England; Location Type—Small City/Town; Class—Economy; Brand Affiliation Status—Chain-Branded; Property Type—Limited-Service. GOPPAR = gross operating profit per available room; RSD = relative standard deviation; ADR = average daily rate.
p < .01. **p < .05. *p < .1.
From the perspective of main effects, for each one-unit change in the average occupancy of hotels in the sample, the mean RSD of GOP PAR decreases by 0.835 units (p < .01), when holding other variables in the model constant.
It is worth noting that the direct effects based on specific variable subgroups are different. For example, the moderating effect of average occupancy in Model 2 on the GOPPAR RSD of hotels in the East North Center region (
Based on the regression analyses, hotel age is a significant predictor of risk (GOPPAR RSD) in all four models, and size (number of guest rooms) is a significant predictor of risk in all models except Model 2, controlling for occupancy. The region in which hotels are located is generally a significant predictor of risk, except in the East North Central and West North Central regions, and the location type in which hotels are located is generally a significant predictor of risk, except in highway (interstate) and resort (destination) locations. Hotel class is a significant predictor of risk in all models and all classes. Hotel brand affiliation status, for example, chain-branded, soft-branded, or independent, is a significant predictor of risk in all models, except for independent hotels. Hotel property type is generally a significant predictor of risk, except in resort hotels.
Discussion
This article introduced a measure of hotel investment risk using the variability of the hotels’ annual GOP over multiple recent years. Specifically, the hotels’ profit variability was defined as the RSD of the hotel’s annual GOP PAR, or GOPPAR RSD. To avoid the size effect, we normalized the operating profit at the PAR level. In addition, for the RSD, we applied the mean of GOPPAR as a denominator to scale the standard deviation level. Using GOPPAR RSD as a risk indicator from an owner’s perspective, we have analyzed various deterministic factors for hotel investment.
Effects of Hotel Characteristics on Hotel Investment Risk
Several findings can be concluded regarding the effects of hotel characteristics on the variability of hotel profitability. First, hotel brand affiliation status, that is, chain-branded, soft-branded, and independent; appeared to substantially affect hotel operating profit variability (risk) during the period of 2015 through 2020 (which included the recession of 2020), with branded hotels displaying less profit variability than soft-branded and independent hotels. This finding appears to be consistent with prior research which demonstrated that while branded and independent hotels recorded comparable profitability during economic growth cycles, branded hotels outperformed nonbranded ones during economic recessions (Liu & O’Neill, 2023; O’Neill & Carlback, 2011).
There are significant differences in the levels of risk (GOPPAR variability) based on hotel class (quality level based on standard classifications of luxury, upper upscale, upscale, upper midscale, midscale, and economy), property type (specifically, types of services and accommodations provided), property region, and location type (including city size, and urban/suburban/airport/highway/resort locations) for the economic cycle of 2015 to 2020. Also, there are significant differences in risk based on hotel age, size (number of guest rooms), occupancy level, and ADR.
Upscale, upper midscale, midscale, and economy hotels have demonstrated relatively lower risk, while luxury and upper upscale hotels have shown relatively higher risk. Based on the heat maps, an exception to this finding is with midscale, full-service hotels which are particularly risky. The business model of satisfying hotel guests’ most basic needs appears to result in a less risky business venture for investors, while the business model of providing the additional facilities and services of luxury and upper upscale hotels may not only increase the level of complexity of those hotels but increase their risk as investments, as well. Similarly, limited-service and extended-stay hotels have recorded relatively lower levels of risk, whereas full-service, conference/convention, resort, and all-suite (non-extended-stay) hotels have had higher levels of risk. Again, higher complexity appears to yield higher risk. While a hotel’s extended-stay orientation may appear to result in greater complexity for that type of property, that hotel type appears to have consistently generated both high consumer appeal and low risk throughout the period of our analysis.
Although hotels classified as resort properties have had relatively higher levels of risk, hotels that were located in destination resort areas, that may not have been classified as resort properties, have had relatively lower levels of risk. It appears that resort locations themselves may be a consistent draw for consumers, and hotels in such locations may provide investors with more stable cash flow except when they are resort hotels that offer a complex array of facilities and services. The reason for the greater variability of profit (greater risk) of resort hotels may be that they operate with relatively high fixed costs due to their diversity of facilities/services. When business volume, that is, revenues, of these properties decline, they may be subject to very substantial declines in profit.
Hotels located in the Middle Atlantic, New England, and West North Central regions have had relatively higher levels of risk, while hotels in the South Atlantic, East South Central, West South Central, Mountain, and Pacific regions have had relatively lower levels. The heat maps indicate luxury hotels in the Middle Atlantic to be particularly risky. These findings might suggest that seasonality in weather, and the diversity of the regional economy, may contribute to the profitability risk of hotels.
Hotels located in small cities and towns, in the urban and suburban areas of midsize cities, in the suburban areas of large cities, and along interstate highways generally have had relatively lower levels of risk. It is worth noting that the heat maps indicate an exception is midscale hotels located along interstate highways. Also, hotels located in the urban centers of large cities and nearby the airports of midsize cities have had higher risk levels. These findings suggest that visitation to the downtown areas of large cities and travel to the airports of midsize cities may be more sporadic than visitation to other types of locations, and thus the cash flow to hotels in these locations is more variable, as well.
The oldest hotels carried the highest levels of risk during the relatively full economic cycle of 2015 to 2020, compared with relatively newer properties. The oldest hotels were classified as the oldest quartile of properties in our study, and these hotels opened in 1976, on average. In general, older hotels may have relatively lesser consumer appeal, and guests may opt not to stay in such properties when overall hotel occupancies are relatively lower and guest rooms in newer properties are available.
The largest hotels carried the highest levels of risk during the relatively full economic cycle of 2015 to 2020, compared with relatively smaller properties. The largest hotels were classified as the quartile of properties with the highest number of guest rooms in our study, and these hotels had 456 guest rooms, on average. To fill their higher number of guest rooms, hotels of this large size would be most likely to offer additional facilities and services, such as restaurants, lounges, and event spaces, and such facilities/services may be subject to more sporadic utilization than guest rooms, resulting in increased risk. However, the smallest hotels, all with fewer than 105 guest rooms, carried less risk.
Hotels that operated at relatively higher occupancy levels (the highest quartile) had lower risk than properties that operated at lower levels. This finding is notable because it indicates that hotels recording relatively lower occupancies not only may achieve lower levels of utilization, but greater fluctuation in utilization and profit, as well. Stated alternatively, properties with higher occupancy had greater smoothness in their profit, as well. However, hotels operating in the lowest quartile of occupancy had the greatest risk.
Hotels that operated at relatively lower ADRs had lower risk than properties that operated at relatively higher ADRs. Interestingly, upper upscale hotels with relatively lower ADRs were particularly risky. In whole, these findings suggest there is lesser variability in profit in hotels with broader consumer appeal via relatively lower pricing, except for upper upscale hotels.
As a point of comparison, our tables display the levels of GOP profit margin (expressed as a percentage of total revenues) of the different types of hotels we studied. It is notable that in many cases, types of hotels with lower levels of risk (variability of GOP), did not necessarily carry lower mean levels of returns (GOP), as would be supported from a theoretical standpoint. For example, branded hotels (which carried lower risk than soft-branded and independent hotels during the period of analysis of 2015 through 2020) achieved higher mean levels of GOP percentage than soft-branded and independent hotels, not lower levels, as would be theoretically expected.
Luxury and upper upscale hotels carried higher levels of mean GOPPAR as well as higher levels of GOPPAR variability (risk). Also, extended-stay hotels showed both low levels of risk and high levels of mean GOPPAR. In the same vein, the oldest quartile of hotels demonstrated both high levels of risk and low mean GOPPAR, and the largest quartile of hotels experienced both high levels of risk and low mean GOPPAR, as well. Hotels in the lowest quartile of occupancy experienced relatively high GOPPAR variability and low GOPPAR, while hotels in the highest quartile of occupancy showed relatively low GOPPAR variability and high GOPPAR. Finally, hotels in the lowest quartile of ADR experienced relatively low GOPPAR variability and high GOP, while hotels in the highest quartile of ADR showed relatively high GOPPAR variability and low GOPPAR. These findings provide practitioners with empirical evidence regarding the relative desirability of various types of hotel investments from the perspective of hotel ownership, that is, certain types of hotels tend to provide investors with relatively high profitability and correspondingly low risk—both desirable features for investors.
Benchmarking: Risk Penetration Index
The complexity of joint determining factors on hotel investment risk calls for a market benchmarking practice. Hotel owners and investors aim for higher operating profits and profit margins. At the same time, hotel owners are also concerned about the variabilities of those profits, or stated alternatively, risks of the investment. A good hotel investment or superb financial performance for the owners should balance the two investment dimensions and compare them to the market. Table 21 presents our contemplation for hotel investment benchmarking using a “hotel owner’s penetration index,” which adheres to the market penetration index concept commonly adopted by hotel practitioners to benchmark hotel top-line performance for occupancy, ADR and RevPAR. We demonstrate our owner’s benchmarking example using analyses for the actual, upscale, suburban, full-service hotels in Atlanta in our sample. To protect confidentiality, CBRE did not provide us with actual hotel names. Therefore, in the first column, hotels are identified as Hotel 1 through Hotel 10. The next three columns represent actual GOP profit margin (percentage), mean GOPPAR, and GOPPAR RSD for each of the 10 hotels over the sample period of 2015 to 2020. The last three columns represent the index of GOP profit margin, mean GOPPAR, and GOPPAR RSD for each hotel, where the market (using sample average) equals 100. The hotels were sorted by the GOPPAR RSD (the last column).
Hotel Owner’s Risk Penetration Benchmarking Index Example.
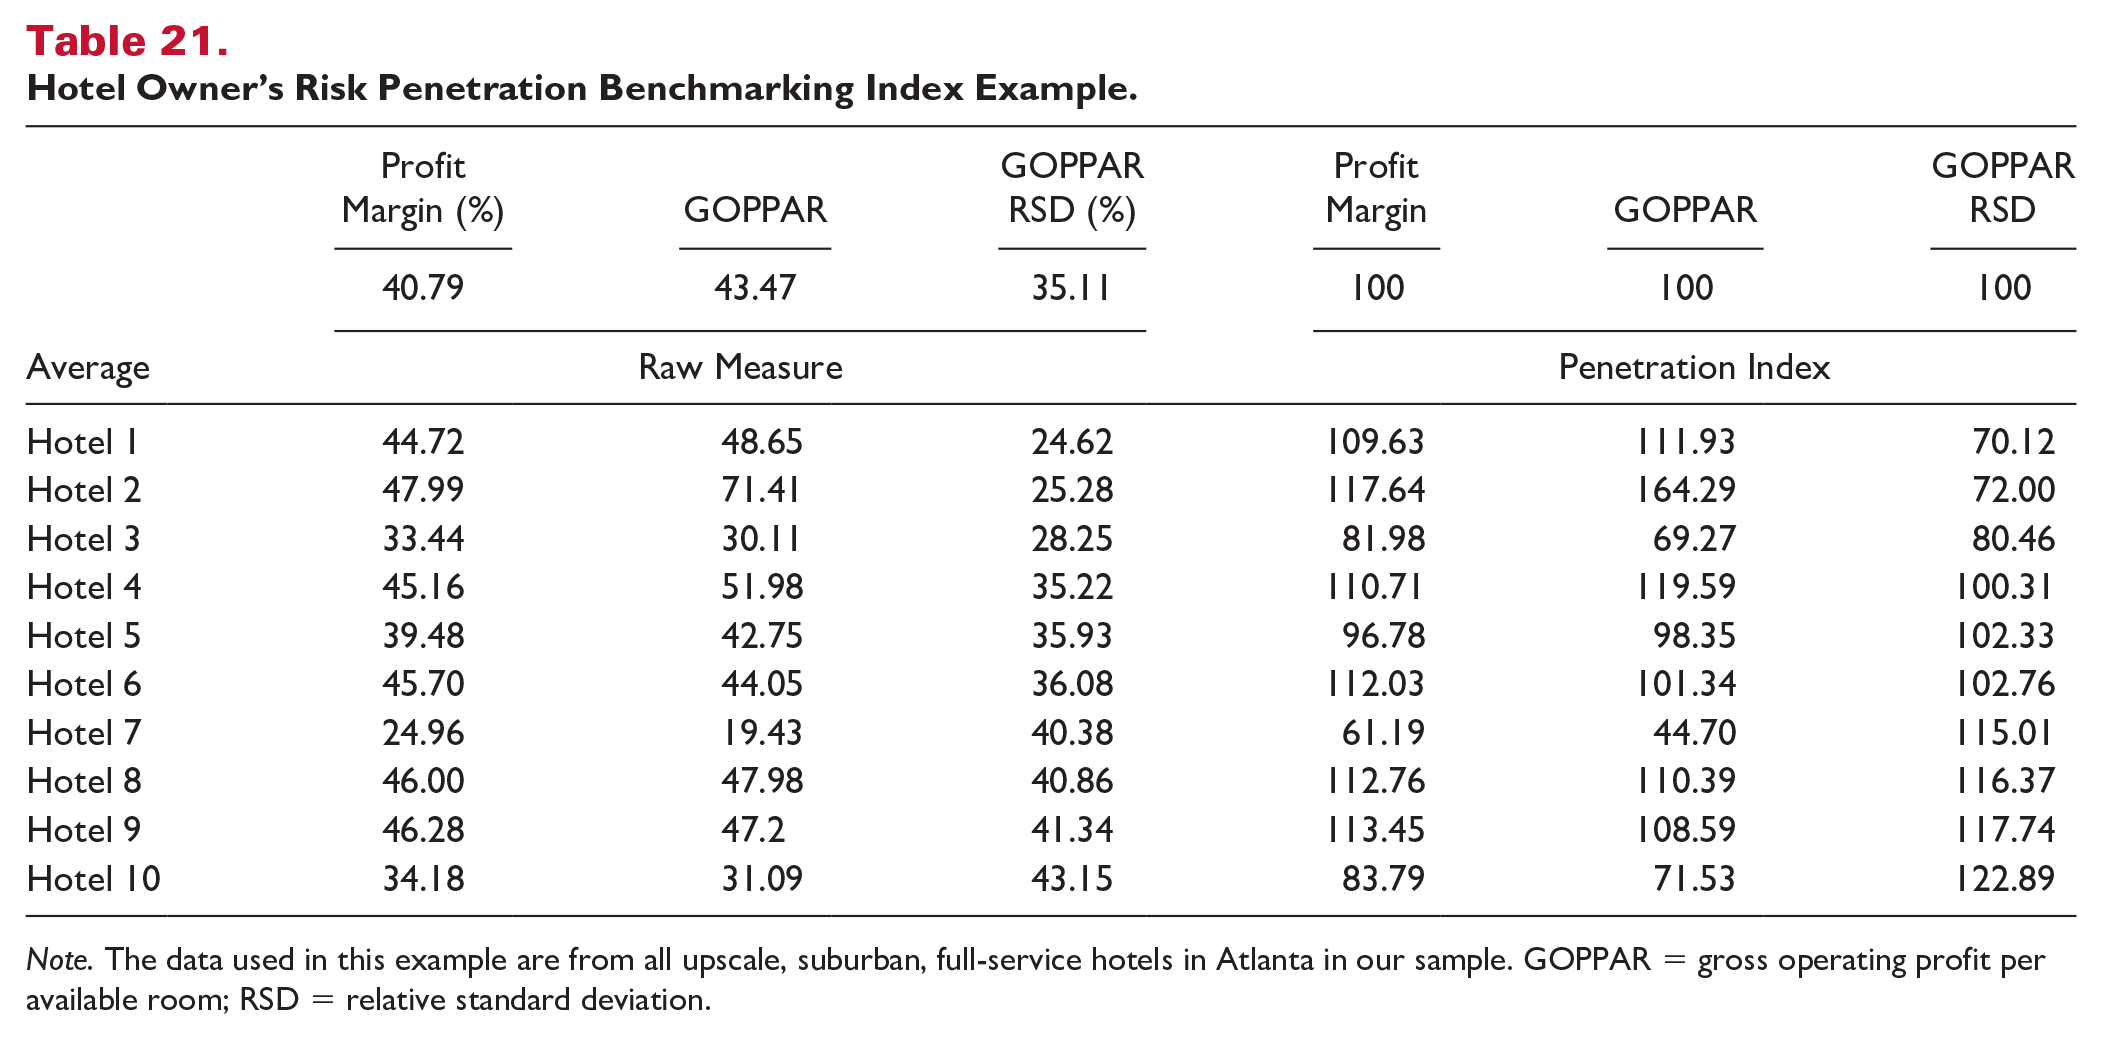
Note. The data used in this example are from all upscale, suburban, full-service hotels in Atlanta in our sample. GOPPAR = gross operating profit per available room; RSD = relative standard deviation.
The table illustrates that even within a comparison of similar hotels located in the same market area, there are substantial differences in the variability of GOPPAR (risk). For example, Hotel 1 has shown much less risk (70.12% of the market) than Hotel 10 (122.89% of the market).
The owner’s penetration index may be a useful tool to support hotel investment decisions for owners and developers. For example, investors can evaluate the bottom-line performance among the ten hotels in Table 21. From the table, we can see that Hotel 1 and Hotel 2 are relatively good investments because the GOPPAR RSD is much smaller than the overall market, and GOPPAR and profit margin exceed the market. However, Hotel 7 and Hotel 10 are relatively poor investments for the opposite reasons.
Conclusions, Limitations, and Implications
This study provides hotel researchers, analysts, developers, owners, operators, and investors with empirical evidence regarding the different levels of risk in different types of hotels. Specifically, we show that the different levels of risk we found in different types of hotels are generally statistically significant. We believe this research demonstrates the functionality of using the RSD of hotel GOP PAR, that is, GOPPAR RSD, as a means of evaluating the investment risk of different types of hotels.
As with all research of this nature, this study is subject to limitations. Though our CBRE set of data containing GOP information for over 3,000 hotels for 6 years for all of those hotels (over 19,000 cases) is one of the largest data sets available for research of this type, our findings and conclusions must naturally be limited to the data we studied. It is notable that CBRE data are for the United States. Thus, our findings may not be applicable to hotels or hotel markets located outside the United States.
Furthermore, we can only speculate regarding many of the reasons or mechanisms for the greater or lesser volatility of certain types of hotels compared with others. It is possible, for example, that branded hotels are less risky than independent and soft-branded hotels when economic recessions are incorporated because hotel guests may feel more comfortable staying in branded hotels during economic recessions, and a feeling of safety and security may translate to relatively higher profit for branded hotels during recessions, as well as overall greater stability in branded hotels’ profit over the long term.
Also, hotels that are classified as being in the relatively lower class of economy properties may benefit from greater patronage at many different time periods, whereas patronage of the top classes of luxury and upper upscale hotels may be less robust over time, yielding relatively greater variability of profit. The same positive conclusions could be drawn related to limited-service and extended-stay hotels compared with other types of properties.
Hotels classified as being located in destination resort areas have benefited from relatively consistent travel to these areas over time with relatively low variability of profit, as previously discussed. However, hotels classified as being resort properties (and having all of the amenities of full-service resort hotels) had high variability of profit. These results may have been affected by the recent period we studied. Many large resort hotels reportedly closed during the initial months of the COVID-19 pandemic in 2020, and such closures would have very likely had a substantial effect on these properties’ 2020 profit, and those data would have been included in our statistical analyses. At the same time, many focused-service hotels in such locations reportedly remained open, and that may have benefited these properties from the standpoint of the overall risk of their profit during the time period studied. Hotels located in the urban centers of large cities, and larger hotels, may have been affected by the same negative forces during the recent period of our analysis.
Older hotels may suffer from functional obsolescence and designs that make them less efficient than newer properties, and as a result, may make them susceptible to inefficiencies and substantially decreased levels of profitability at lower levels of business volume. Furthermore, such properties may also suffer from relatively lesser consumer acceptance, making them more likely to experience lower business volume during periods of lesser consumer demand when more guest have more hotel properties from which to choose.
The findings related to occupancy should be contrasted with the findings related to ADR. Specifically, while hotels with higher average occupancies appear to have been awarded with less variability in their GOP, hotels with lower ADRs displayed less variability in their profit (risk), not more. Such properties may benefit from relatively consistent consumer demand and acceptance during different time periods. However, more expensive hotels may benefit from stronger economic conditions but may be unusually affected by weaker economic times, resulting in relatively greater variability in their profit in the long term.
Future research in this area could provide a more complete and thorough understanding regarding the stability premium of certain types of hotels. For example, future research in the area of hospitality real estate could explore the profit performance of hotels in locations outside the United States. Furthermore, future studies in the area of hospitality consumer research could explore why hotel consumers may choose to patronize certain types of hotels during different phases of economic cycles.
In conclusion, based on a sample of over 3,000 hotels over recent years, our research illustrated there are significant differences in the levels of profitability of certain types of hotels, that is, certain types of hotels appear to have more stable cash flows than others, with lower, long-term standard deviations of GOP (risk). Our findings and conclusions are important to hospitality and real estate researchers because we found only very limited prior work studying the investment risk of hotels.
Footnotes
Acknowledgements
The authors gratefully acknowledge the assistance of Robert Mandelbaum of CBRE for providing the data used in this research project.
Declaration of Conflicting Interests
The author(s) declared no potential conflicts of interest with respect to the research, authorship, or publication of this article.
Funding
The author(s) received no financial support for the research, authorship, or publication of this article.