
Abstract
Hotels are generally perceived as the riskiest type of commercial real estate (CRE) investment because hotel “leases” have relatively high turnover. Existing literature regarding CRE investment risk and return lacks investigation of hotels at the unit level—which is the level of analysis undertaken by existing and prospective hotel investors. Two major types of hotels are branded and independent ones. The purpose of this study is to investigate the variability (risk) of key performance indicators (KPIs) such as occupancy rate, and revenues and profit of branded versus independent hotels. Using a large sample of performance data regarding over 4,000 U.S. hotel properties from 2000 to 2019, we examine the extent to which branding affects the volatility of KPIs. We find that brand-affiliated hotels have lower cash flow risk measured as lower volatilities of KPIs compared with independent ones. Furthermore, the level of volatility reduction of branded hotels is greater for profit than for revenue, and profit may be the most important KPI for hotel investors. The magnitude of volatility reduction also increases as the measurement window length (number of years) increases. We also study the long-term returns of branded versus independent hotels. This study contributes to the understanding regarding the relationships between investment risk of branded versus independent hotels, extends the literature regarding hotel investment, and provides hotel investors and analysts information regarding risk to aid decisions such as developing, purchasing, holding, or disposing of hotel assets.
Keywords
Introduction
All investments carry risk, and that includes commercial real estate (CRE) investments. Hotels, as an emerging CRE type, have attracted more and more institutional investors. Real estate is a large component of the overall economy, constituting a substantial portion of worldwide wealth (Floyd & Allen, 2014). According to the National Association of Real Estate Investment Trusts (NAREIT), the estimated market value of CRE in 2019 was approximately US$16 trillion (Reit.com, 2019). Among various CRE assets, including office buildings, industrial buildings, and retail centers, hotels constitute over 10% of all properties and 12% of the asset value of CRE investments (Corgel, 2005).
Hotel assets are unique due to their heavy operational aspect and dynamic nature of sales. The lack of long-term leases, which distinguishes hotels from other income-producing CRE properties, presents a substantial risk to hotel managers and owners. Corporate hotel bookings were quickly canceled, and travel activity tapered in the depths of the COVID-19 pandemic; similar consequences accompanied the global financial crisis during the 2007–2009 recession. Changes in daily room rates and occupancy render hotels’ income flows highly volatile across business cycles. Such risk is further compounded by supply shocks associated with labor and building supplies and materials. Therefore, hotel investments are generally considered to be riskier than other CRE asset classes. Hotels may generate large yields by rapidly responding to changes in market supply and demand via adopting flexible daily pricing strategies, that is, revenue management, but however, hotels are inherently volatile investments and can also be the first real estate type to suffer from market disruptions. As a result, properly evaluating hotel risks becomes critical for investors to assess alternative investment opportunities, and to endow investment decisions in developing, purchasing, holding, or disposing of hotel assets.
Existing literature regarding hotel investment risk and return primarily focuses on lodging real estate investment trusts (REITs) or public hospitality firms and lacks analysis regarding privately-owned properties as well as analysis at the hotel-unit level. The limitation of sufficient volume of high-quality, unit-level data is attributed to the challenging econometric hurdle that real estate (such as hotels) is a relatively illiquid asset, whose investment returns cannot usually be observed directly and consistently over the long term (Peng, 2016).
The subject study analyzes hotel investment risk and return based on the “same-store” annual financial performance data of more than 4,000 hotel properties over a period of 20 years. The value of a hotel is the present value of anticipated future cash flows. The investment performance of any income-generating CRE is determined by the level and variability of its cash flows. In this study, we examine the hotel cash flow risk using detailed property-level data by focusing on one important hotel characteristic—brand affiliation status.
The remainder of this article is organized as follows: Section “Background and Literature Review” provides the background of past literature and identifies gaps in the research. Section “Method” describes the methodology and data used in this study. Empirical methods are illustrated and corresponding results are discussed in section “Results.” Section “Conclusions, Managerial Implications and Limitations” concludes the article with discussion of limitations, future research directions, and conclusions.
Background and Literature Review
CRE and Risk
CRE plays a substantial part in the capital asset market. It has been included in diversified investment portfolios joined by other financial assets such as stocks and bonds. Guo (2018) indicated that as a subset of alternative assets of modern investment portfolios, CRE assets bring unique advantages, including an illiquidity premium, an absolute return independent of the market portfolio, potential of inflation hedging, and income flow during the holding period. The main disadvantages of CRE assets are their illiquidity, valuation difficulty, need for continued capital improvements, and large size as individual investments. One of the most significant risks of CRE investments is the stream of income because that income stream is uncertain, and affected by possible economic and other events, resulting in uncertainty regarding the probability of the outcomes due to these events (Frodsham, 2007).
CRE valuation has two critical inputs: (a) how much cash flow an asset is expected to generate in the future and (b) how risky are the anticipated cash flows (Das & Rein, 2020). Investment risk is generally related to the uncertainty of future investment returns (J. Chen & Hobbs, 2003). Focusing on property investment, Adair and Hutchison (2005) defined risk as the probability that a target rate of return will not be realized, while uncertainty denotes situations where outcomes and probabilities are unknown. Widely used in measuring stock market risk, Sharpe’s Capital Asset Pricing Model (CAPM) has identified two types of risk: the systematic risk caused by the market’s volatility and the unsystematic risk caused by firm-specific features or events (H. Kim et al., 2016). Systematic risk is inevitable, while unsystematic (i.e., idiosyncratic) risk can be reduced by a diversified asset portfolio (Li & Chen, 2013).
The risk associated with an asset is usually defined as volatility, quantified as the standard deviation (SD) of its historical returns (D’Alpaos & Canesi, 2014). Researchers and practitioners use volatility or SD to summarize the spread of possible outcomes, and such measures can be considered indexes of risk (D’Alpaos & Canesi, 2014). This study adopts the concept of SD as a risk measure to analyze the cash flow volatility of hotel assets.
The Evolution of Risk in the U.S. CRE Market
The CRE business evolved during the 1990s from producing new space and collecting bond-like rent income to one that manages properties more like competitive businesses to produce long-term investment returns (Mueller & Anikeeff, 2001). The CRE investment business now includes operating the property as a competitive business with marketing, operating cost reduction, additional services (revenues), and additional products (such as telecommunications, computer system connectivity, valet services, recreational services, and parking services). However, management intensity varies significantly by property type. If the income to the real estate is tied to the success of the business enterprise being operated within the real estate (business risk), the income should be more volatile, and a higher risk premium should be demanded by the marketplace (Mueller & Anikeeff, 2001).
The concept of business enterprise value (BEV) was developed and established by the Appraisal of Real Estate (Appraisal Institute, 2001). A value enhancement of CRE results from intangible personal property items, such as marketing and management skill, an assembled workforce, working capital, trademarks, franchises, trademarks, non-realty related contracts/leases, and some operating agreements (Mueller & Anikeeff, 2001), and all of these elements carry risk. BEV has attracted attention primarily because of assessment, condemnation, and damage claim assignments, which require that an estimate of the market value of the real estate component be separated from the market value of the total assets of the business (Lennhoff, 1999). Much of the motivation for the determination that BEV exists comes from the fact that personal property (tangible or intangible) is not subject to property taxes (deRoos, 2006; Vandell, 2007). In practice, BEV is estimated by partitioning the value of the going concern into real estate, tangible personal property, and intangible personal property (deRoos, 2006; Hennessey, 1993; Kinnard et al., 2001; Lesser & Rubin, 1993; Rushmore & Rubin, 1984).
As CRE income becomes more dependent on the business being operated within the real estate, the volatility of the income will typically rise due to the higher inherent volatility in operating businesses over real estate (Mueller & Anikeeff, 2001). Management of hotels, for example, is a daily exercise, as the operator must re-lease the space (guest rooms, restaurants, bars, event space, recreational facilities, parking space, etc.) every day. These factors make hotels unique from other CRE investments. Service, marketing, maintenance, and amenities are also among the keys to a successful hotel, similar to other CRE investments. Compared with other property types, however, hotel “leases” (the daily rental of hotel rooms) have the greatest link to operations. Thus, both income and long-term returns of hotels usually have the highest volatility of all CRE property types (Mueller & Anikeeff, 2001).
How Risk Is Unique in Hotels
CRE properties involve two distinct but highly interrelated markets that use real estate for the production of periodic income—the space market—and the market for owning capital assets—the asset market. This division is quite evident in hotels because hotel owners typically are not the users of the space (Corgel, 2005). Since the hotel is an operating business housed in real estate, previous research has investigated whether it is possible to separate the two aspects of a hotel property’s value, that is, real estate, and the BEV. O’Neill (2004) noted that dividing the real estate and operating components is challenging in practice because many operating parameters such as occupancy and average daily rate (ADR) premiums are often largely attributable to a hotel’s physical location, that is, real estate, even though prior research indicated such premiums should be attributed to BEV. The current research assessing hotel key performance indicator (KPI) volatility attributed to property characteristics (i.e., real estate aspects such as type of hotel and type of location) and non-real estate aspects such as branding (i.e., whether the hotel is branded or unbranded), should contribute to understanding the relations between hotel operating risk and hotel asset risk.
In CRE investment, the total “holding period return” is the combination of the cash flow earned throughout the holding period as well as the capital appreciation (or depreciation) of the asset (Younes & Kett, 2006). Depending on the type of hotel property (and its holding period), the operating cash flow returns represent up to 70% of the overall returns (Younes & Kett, 2006), and thus, are crucial to the overall investment.
According to CRE investment theory, operating risk represents the ability of the asset to generate sufficient levels of cash flow to produce a certain level of financial returns to justify the investment. NOI (net operating income) and GOP (gross operating profit) are measures of the profitability of a CRE property and are specifically used to quantify cash flow or net income (Hoteltechreport, 2020). GOP in hotels represents profit from operations after deductions for departmental expenses and overhead expenses (Lloyd-Jones et al., 2020). Owners are significantly exposed to operating risk in hotel investments. Fluctuations in the operating performance of a hotel asset have a significant impact on the profit available to its owner to service the hotel mortgage/senior debt and secure a return on the investment (Younes & Kett, 2006). In the current research, we use SD of annual hotel GOP as the risk measure, along with other KPIs of hotel assets to investigate the property characteristics that affect hotel risk, and specifically whether the hotels are branded or unbranded.
Hotel Branding
Branding has emerged as a key component of the strategic decisions of hotel real estate investors and analysts (O’Neill & Mattila, 2010). To maximize brand equity, most hotel mega-companies have developed multiple brands to serve multiple markets (Jiang et al., 2002; O’Neill & Mattila, 2004). The value of a hotel brand is based on the awareness of the brand, its quality perception, and overall customer satisfaction (Aaker, 1996; O’Neill & Mattila, 2004). Lodging operators have turned their attention to branding because brand name operates as a “shorthand” for quality by providing prospective investors and guests important information about the product/service (Brucks et al., 2000; Jacoby et al., 1977; O’Neill & Mattila, 2004).
Branding is particularly critical in the service industries such as the hotel business (Onkvisit & Shaw, 1989). The recognized goal of hotel branding is to provide added value to both hotel investors and guests by building brand loyalty (Cai & Hobson, 2004; O’Neill & Xiao, 2006). From a corporate strategy viewpoint, well-managed hotel brands tend to gain increasing market share (O’Neill & Mattila, 2004). A specific challenge related to hotel investment is that hotels are a combination of both an operating business and real estate with different parties being involved in the different aspects of the business. In recent years, international hotel conglomerates, for example, have evolved away from being hotel owners via asset-light strategies at an increasing rate, and are increasingly brand management organizations.
As a hotel brand represents a company, it should be consistent in the marketplace. Such consistency benefits guests with their decision-making processes, but it also benefits investors because capital markets may reward cash-flow consistency, that is, smoothness of cash flow. Although there are cases when hotel companies change their positioning or strategies, corporate colors, and even their logos and typeface, very few hotel companies ever change their brand names (Vaid, 2003). A hotel brand must communicate with investors and guests in real time through technological advances by delivering of four basic qualities: offering and communicating a clear promise, building trust by delivering on the promise, continuously improving on the promise, and innovating beyond the familiar (Barwise & Meehan, 2010).
In sum, a hotel brand consists of a relationship. Developing this relationship is the real purpose of hotel branding as brands provide value to investors and guests and build brand loyalty. The promise to the consumer and the products and services should be unique to the identity of the hotel brand, and should be strong in peoples’ minds. As O’Neill and Mattila (2010) suggest regarding hotel brands, ultimately, the brand represents the consumer’s experience with its organization.
The Value of Hotel Brands
Recent research evaluated the effects of hotel brands on the real estate value (i.e., market value) of brand-affiliated hotels. Earlier research revealed that a number of factors were shown to be correlated with a hotel property’s market value. NOI, ADR, occupancy rate, and number of guest rooms were proven to be significant predictors of a hotel’s value (O’Neill, 2004; O’Neill & Carlback, 2011; O’Neill & Lloyd-Jones, 2001). Some brands consistently have stronger bottom lines, that is, NOIs, than do others (O’Neill & Mattila, 2006), although ADR (an indicator of a hotel’s “top line”) is a better predictor of a hotels’ market value than its NOI (an indicator of a hotel’s “bottom line”) (O’Neill & Mattila, 2006), and some brands have consistently stronger ADRs than others. Research also has shown that hotel brand affects hotel market value, and it does so above and beyond the effect of NOI, ADR, occupancy rate, and number of guest rooms (O’Neill & Xiao, 2006).
Among other things, hotel brands are marketing organizations that attempt to maximize KPIs in hotels, including occupancy, ADR, and GOP, and to minimize the fluctuation of these KPIs. Previous research evaluated the effects of hotel brands on the real estate value (i.e., market value) of brand-affiliated hotels (O’Neill & Xiao, 2006).
Brand affiliation is an important factor affecting hotel revenue. Branding literature has demonstrated that consumers use hotel brand name as an important quality cue. The quality associated with a company’s characteristics of the brand portfolio (number of brands owned, number of segments in which they are marketed, degree to which the brands in the portfolio compete with each other, and perceptions of the quality and price of the brands) is associated with the firm’s marketing and financial performance (Morgan & Rego, 2009).
More specifically in a hotel context, consumers are typically willing to pay a price premium for brands they view as high in quality (O’Neill & Mattila, 2006). Brand affiliation, name recognition, and reputation for high-quality service together can contribute as much as 20% to 25% of the value of a successfully operating hotel (Kinnard et al., 2001).
In general, hotel brand power represented as a name, logo, or symbol in the market might be expressed as brand equity (Mahajan et al., 1994). Brand equity results from benefits of marketing efficiency and enhanced performance associated with that brand and long-term brand effect based on customer loyalty.
Hotel brand equity is created when firms deliver quality products, and strong brand associations are created when firms conduct appropriate communications (Aaker, 1991; Rao et al., 2004). Brand equity, as well as brand, can represent the relationship between the firm and its customers, and the positive relationship may enhance cash flows and reduce risk of the firm as a whole, and it may have a positive effect on value of the firm (Rao et al., 2004). When correctly and objectively measured, hotel brand equity can be the proper metric for estimating the long-term effects of marketing decisions (Rao et al., 2004) because brand equity varies based on the consumer’s evaluation of the brand dimensions (Konecnik & William, 2007).
The level of brand equity is positively related to a hotel company’s financial performance, for example, revenue per available room (RevPAR) (H. B. Kim et al., 2003; H. B. Kim & Kim, 2005; O’Neill & Xiao, 2006). Realizing that a hotel brand’s strength ultimately drives stock price and shareholder value, the lodging industry has been recognized as a “brand-equity business” (O’Neill & Xiao, 2006; Stanley, 1997). In addition, brand equity measures have been related to the stock price and value of a firm (Keller & Lehmann, 2006).
Well-established hotel brands create financial value due to their ability to generate cash flows via relatively higher margins (Aaker & Jacobson, 1994; O’Neill & Mattila, 2006). In general, major contributors of generating cash flows and high margins for hotel brands are customer loyalty, brand extension including licensing opportunities, and enhanced efficiency (Rao, Agarwal, & Dahlhoff, 2004).
Hotel executives recognize brand quality as an important intangible company asset and as a potential source of strategic advantage (Damonte et al., 1997; O’Neill & Mattila, 2004, 2010). Patents, trademarks, and franchises are examples of intangible assets as well as brand equity (Simon & Sullivan, 1993).
Hotel brands are generally categorized as intangible assets. Intangible assets are earned cash flows of a firm in excess of the return on tangible assets. In other words, intangible assets boost the earning power of the firm’s tangible assets. Patents, trademarks, R&D, and franchises are examples of intangible assets as well as brand equity (Simon & Sullivan, 1993).
Not only is it generally recognized that brands create value for both consumers and companies (Aaker, 1991; O’Neill & Xiao, 2006), but consumers use brands as cues to infer certain product attributes, such as quality (O’Neill & Mattila, 2004; O’Neill & Xiao, 2006). The value of a hotel brand chiefly resides in the minds of customers and is based primarily on customers’ brand awareness, their perceptions of its quality, and their brand loyalty (Aaker, 1991; O’Neill & Xiao, 2006).
Strong brands enable hotel chains to differentiate themselves (O’Neill & Xiao, 2006; Prasad & Dev, 2000). Branded hotels (as opposed to independent properties) have been shown to have higher profitability in recessionary times and a comparable profit with independent hotel during periods of economic expansion. The higher profit for branded hotels during recessionary times has been attributed to the intangible asset value of hotel brands (O’Neill & Carlback, 2011).
Hotel brands create value for consumers by a establishing a constant, uniform level of quality (Keller & Lehmann, 2003; O’Neill & Xiao, 2006). Lodging companies with successful brands benefit in the financial marketplace by improving shareholders’ value (Ambler et al., 2002; O’Neill & Xiao, 2006).
Although it is important for hotel owners to be able to recognize the effects of a brand on hotel market value, other benefits associated with a brand should be considered to fully assess the brand’s total value (O’Neill & Xiao, 2006). Such other factors could include the variability, or stated alternatively, the stability of cash flows.
Hotel Ownership and Branding
Protecting reputation has become a key issue for hotel brands, both in terms of consumer perceptions and franchisee willingness to sign and/or stay with a hotel brand (O’Neill & Mattila, 2004; Prasad & Dev, 2000). Since today’s hotel owner-franchisees are quick to change their brand loyalty, it may be more important than ever for hotel brands to maintain consistent brand quality (O’Neill & Mattila, 2004) and consistency of their franchisees’ cash flows. One reason franchisees may be quick to change hotel brands is that hotel rebranding, including shifting between branded and independent operations, may have a positive effect on hotel financial performance (Hanson et al., 2009).
Since chain affiliation is incorporated in lenders’ tight underwriting formulas, obtaining financing for an independent hotel may be more difficult than for a branded one (O’Neill & Xiao, 2006). Potential franchisees need to examine the prospective performance of branded hotels because strategies of branded hotels differ from independent ones (O’Neill & Mattila, 2006, 2010). During different time periods, branded and independent hotels offer different levels of cash flow (O’Neill & Carlback, 2011), and informed hotel owners who have figured this out have become less hesitant to seek branding status, for example, branded versus independent operations, that is in closer conformance to their cash flow goals (O’Neill & Mattila, 2006). Such variability in cash flow affects the risk of the investment, and diverse investors have dissimilar appetite for risk.
For hotel owners, whose goal is to maximize the market value of their assets, recognizing the role of brand name in hotel market value is beneficial for positioning and decisions whether to be branded or independent. The strategies that hotel owners employ influence their properties’ financial performance, specifically their expertise in determining whether to be branded or independent (Xiao et al., 2012). For hotel companies’ brand-management teams, effectively assessing brands’ effects on hotel performance can strengthen the overall value of the brands and possibly improve the brands’ franchise sales (O’Neill & Xiao, 2006).
Although a great deal of research has been conducted regarding CRE risk, and to some extent regarding hotel investment risk, and a great deal of research has been conducted regarding hotel branding, we found no prior research regarding investment risk in branded versus independent hotels. Therefore, this study seeks to fill that gap in the literature.
Method
Sample Data
Our sample was drawn from the CBRE hotel trend database, which provided us with confidential, anonymized property-level financial statement information. This database is the oldest and most comprehensive source of hotel-related financial information in the United States. Our sample comprised 45,034 property-year observations with a balanced panel data series from 2000 to 2019. Overall, the data covered 4,582 lodging properties located across the largest 40 U.S. hotel markets.
According to the American Hotel & Lodging Association, chain brands refer to a set of three or more hotels operating under a single brand name (Rushmore, 1992). A dummy variable, Branded Hotel, was created in this study to indicate brand affiliation status: if a hotel was affiliated with a brand that operates three or more hotels in a given year, then Branded Hotel was equal to 1, and 0 otherwise (i.e., for independent hotels). Among the 45,034 observations, 41,695 were branded and 3,339 were independent. Descriptive statistics are presented in Tables 1 and 2 (continuous variables) and Table 3 (categorical variables). Table 1 lists summary statistics for five performance measures and two continuous control variables: building age (Age) and number of rooms (Rooms). A typical hotel in our sample was 22 years old and contained 258 rooms.
Descriptive Statistics of Continuous Variables—KPIs and Hotel Attributes.
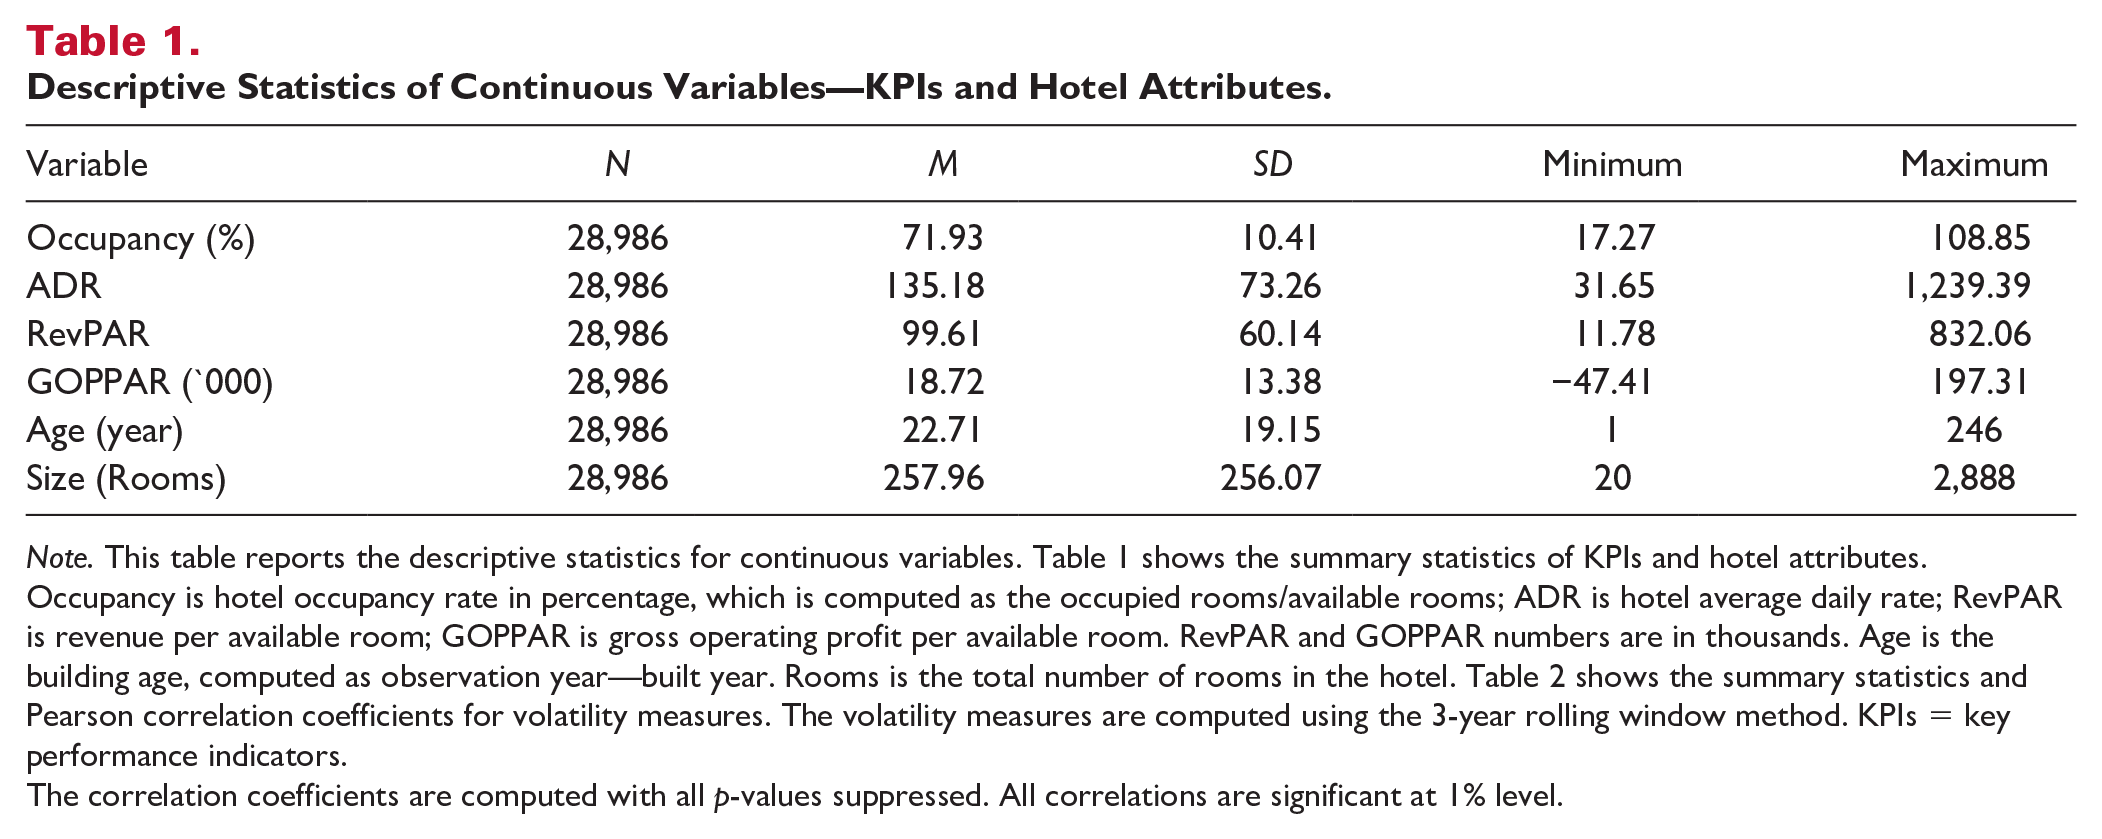
Note. This table reports the descriptive statistics for continuous variables. Table 1 shows the summary statistics of KPIs and hotel attributes. Occupancy is hotel occupancy rate in percentage, which is computed as the occupied rooms/available rooms; ADR is hotel average daily rate; RevPAR is revenue per available room; GOPPAR is gross operating profit per available room. RevPAR and GOPPAR numbers are in thousands. Age is the building age, computed as observation year—built year. Rooms is the total number of rooms in the hotel. Table 2 shows the summary statistics and Pearson correlation coefficients for volatility measures. The volatility measures are computed using the 3-year rolling window method. KPIs = key performance indicators.
The correlation coefficients are computed with all p-values suppressed. All correlations are significant at 1% level.
Descriptive Statistics of Continuous Variables—Volatility Measures.
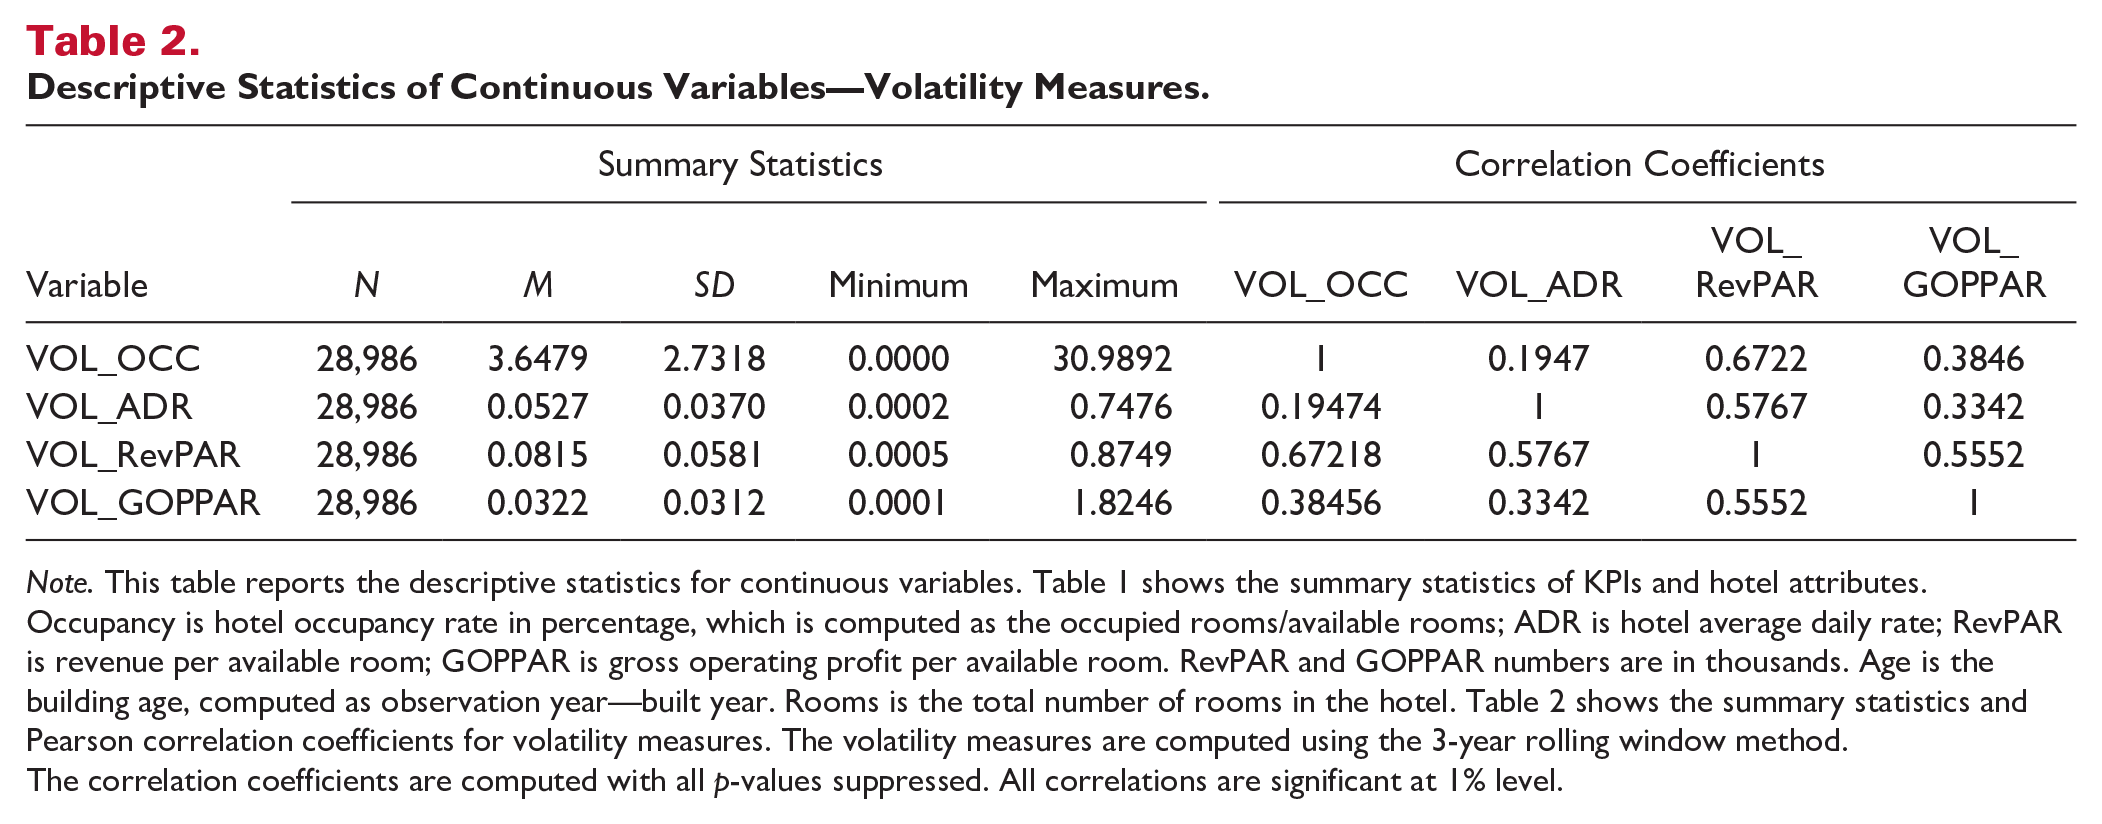
Note. This table reports the descriptive statistics for continuous variables. Table 1 shows the summary statistics of KPIs and hotel attributes. Occupancy is hotel occupancy rate in percentage, which is computed as the occupied rooms/available rooms; ADR is hotel average daily rate; RevPAR is revenue per available room; GOPPAR is gross operating profit per available room. RevPAR and GOPPAR numbers are in thousands. Age is the building age, computed as observation year—built year. Rooms is the total number of rooms in the hotel. Table 2 shows the summary statistics and Pearson correlation coefficients for volatility measures. The volatility measures are computed using the 3-year rolling window method.
The correlation coefficients are computed with all p-values suppressed. All correlations are significant at 1% level.
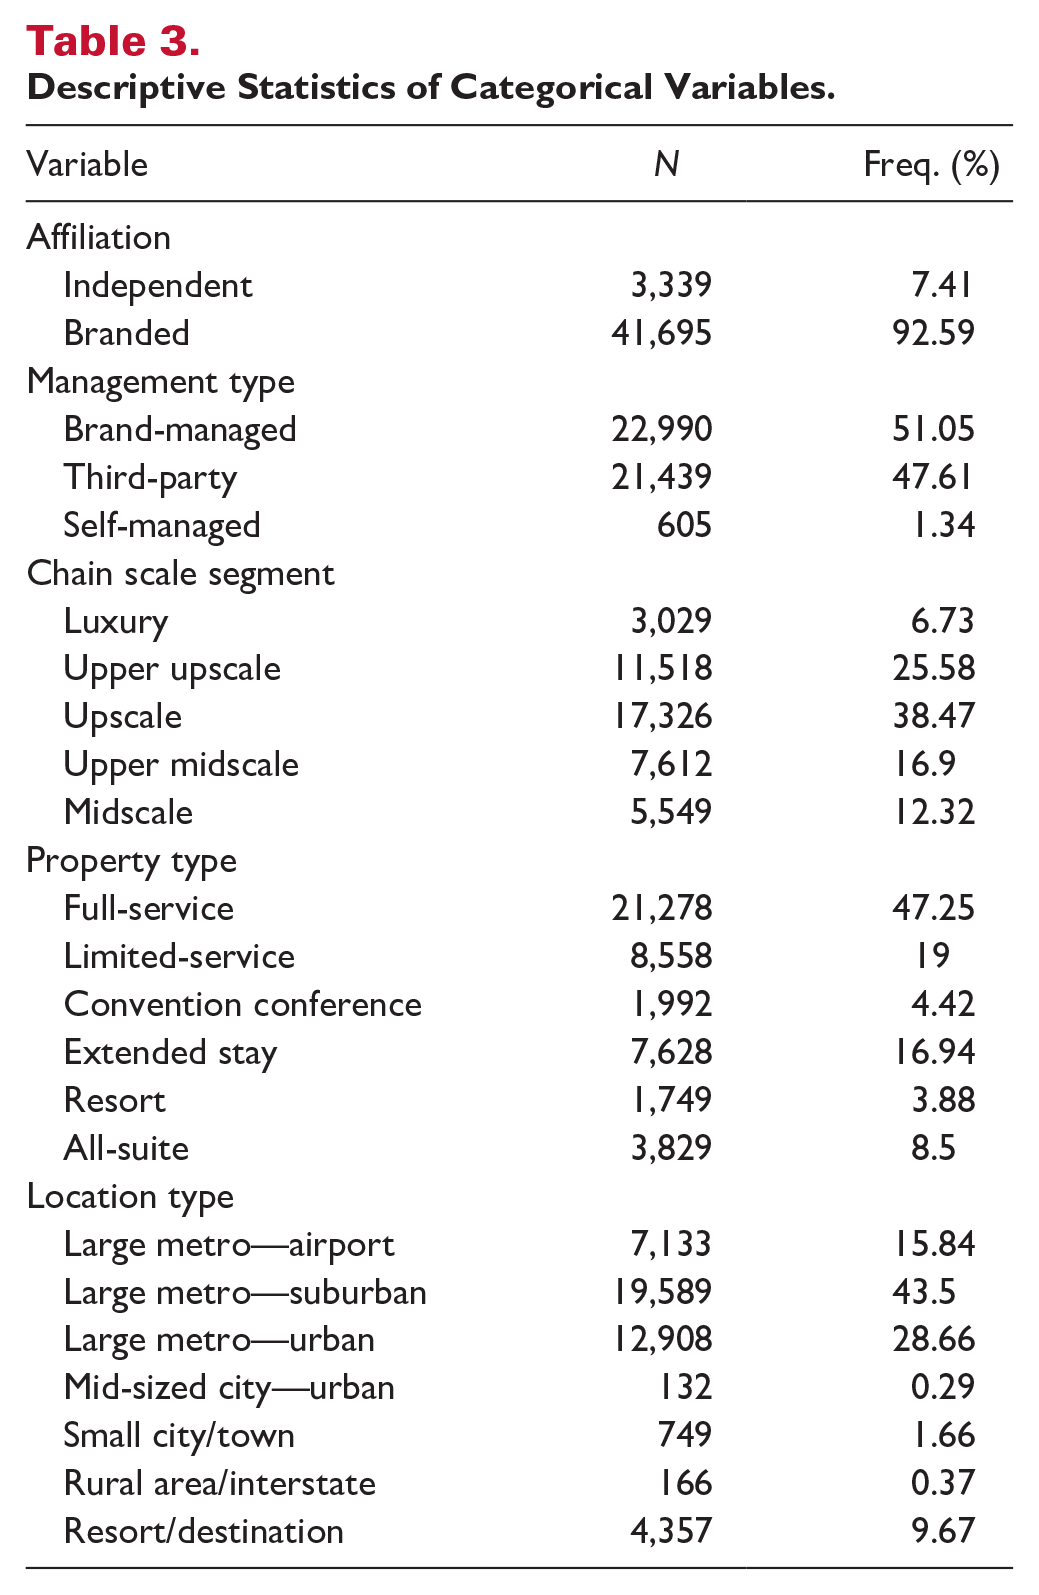
Descriptive Statistics of Categorical Variables.
Hotel operating performance was quantified using four KPIs, namely, occupancy rate (OCC), ADR, RevPAR, and gross operating profit per available room (GOPPAR). These KPIs reflect hotel performance from different perspectives: ADR represents the supply-side stability of hotel pricing; OCC conveys the smoothness of hotel demand; and RevPAR, computed as the product of OCC and ADR, indicates a hotel’s overall performance in room sales. These three KPIs are commonly known as top-line measures. Hotels also absorb varying degrees of costs depending on the type of brand affiliation. 1 Accordingly, GOPPAR measures a hotel’s operating profit after deducting franchise fees and other costs; this variable is thus considered a bottom-line performance measure.
Table 1 displays the summary statistics for KPIs and continuous hotel attribute variables. The average annual occupancy rate in our sample was 71.93% with a wide range from 17.27% to 108.85%. 2 ADR spanned from less than US$31.65 (midscale hotel) to more than US$1,239.39 (luxury hotel), with an average of US$135.18. RevPAR is generally the most popular performance measure in the hotel industry when evaluating or benchmarking hotel performance. The average RevPAR in our sample was US$99.61, and ranged from US$11.78 to US$832.06. The bottom-line performance measure, GOPPAR, spanned between –US$47,410 and +US$197,310 with a mean of US$18,720. Table 3 displays the frequency for categorical variables used in the regression analysis.
In addition to hotels’ brand affiliation status, size, and property age, we examined the following service and property attributes: hotel management type (i.e., brand-managed, third party–managed, self-managed); scale segment (i.e., luxury and upper upscale, upscale and upper midscale, and midscale 3 ); service/hotel type (i.e., full-service, limited-service, convention hotel/conference center, resort, extended-stay, and all-suite); location type (i.e., large metro–airport, large metro–suburban, large metro–urban, mid-sized city–urban, small/town, rural area/interstate, and resort/destination); year; geographic market; and submarket.
Measure of Hotel Performance Risk
As previously discussed, the lack of long-term leases presents a substantial risk to hotel owners and investors. Volatility has led hotels to be perceived as the riskiest type of CRE asset.
SD is a statistical metric indicative of volatility, as previously discussed. As a popular measure of investment risk for public companies, the SD describes how far a value (e.g., closing stock price) lies from the average. The larger the dispersion or difference between an actual value and the average value, the larger the SD and the higher an element’s volatility and riskiness (e.g., of an asset). We considered the volatility of hotel KPIs to measure hotels’ riskiness. Specifically, we performed multiple regression analysis to identify whether brand-affiliated hotels had the same KPI risks after controlling for other hotel attributes. The dependent variable in the regression was the volatility of hotel KPIs.
Using “same-store” financial performance information over 20 years, we calculated volatility for ADR, OCC, RevPAR, and GOPPAR with two methods. First, the raw volatility measure was determined using two steps: (a) convert each KPI measure into a natural logarithm value for each hotel in the sample; and (b) calculate the SD according to the following formula:

where xi is the log value of the KPI,
Table 2 presents the summary statistics for raw volatility. Each property had four volatility measures: VOL_OCC, VOL_ADR, VOL_RevPAR, and VOL_GOPPAR. Because all data points between 2000 and 2019 were included for analysis, each hotel had only one raw volatility value per KPI. It should be noted that the raw volatility measure has a few shortcomings despite its computational simplicity. First, not all hotels in our sample had the same 20 years of data points: some data points appeared in the early years whereas others emerged later; still others skipped a few years. Second, the sample period spanned two decades and at least two economic cycles. Volatility measured using all available data points may be inappropriate because this metric fails to control for (a) the years in which data were collected and (b) the number of sample years included in the calculation. To address these concerns, we developed a second method—the rolling-window volatility measure.
The rolling-window volatility measure is computed similarly to the raw volatility measure, as the first step is identical in both methods. In the second step, the rolling-window volatility calculation uses a window of n years of KPI data to estimate the SD. Depending on the number of years for which data are available, more than one volatility value can potentially be calculated. We determined the vintage of volatility based on the middle year in the estimation window. The rolling-window method is also flexible, as the window length n can be any number between 3 and 20; the SD can be computed as long as at least 3 years of continuous data exist for a given hotel. The shorter the length of the rolling window, the more SDs can be calculated given the available sample year for a hotel. If n = 20, there will be only one SD under the rolling-window method, identical to raw volatility. In addition, because the rolling windows overlap, a single data point can be used more than once. A hotel with longer continuously reported data will produce more volatility statistics calculated using the rolling-window method. This hotel will then naturally have larger weights in the regression analysis. In contrast to a regression using the raw volatility measure as the dependent variable, where each hotel has an equal weight, the regression using the rolling-window volatility measure is essentially a weighted least squares (WLS) regression analysis. In WLS, a hotel with a longer history of available financial information is assigned a heavier weight because this hotel’s volatility measure is inherently more reliable. The rolling-window method, which implicitly reweighs observations based on quality, thus outperforms the raw volatility method.
Multiple Regression Analysis
To test the brand affiliation effect on the risk of hotel KPIs, we carried out the following multiple regression analysis:
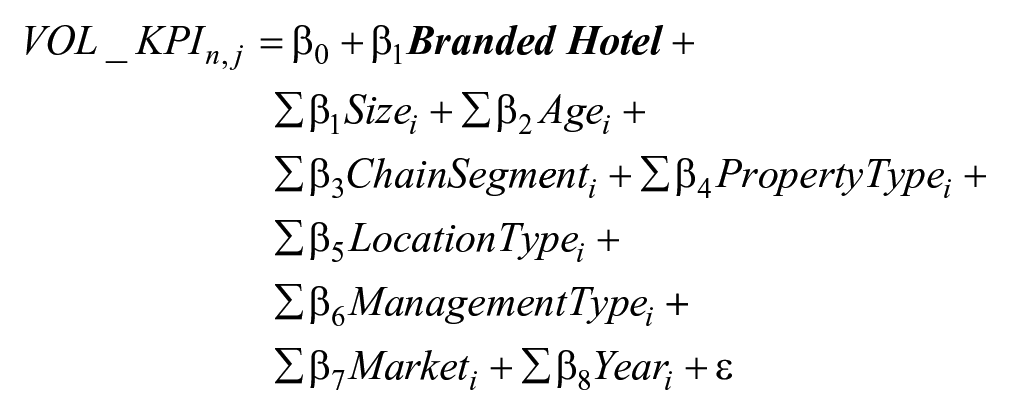
where
To address the potential endogeneity issues in the data, we apply the propensity score matching (PSM) technique, pioneered by Rosenbaum and Rubi (1983). To disentangle a branded hotel’s superior ability to achieve lower volatility and a choice of management for the less-volatile hotels to be branded, an ideal experiment would involve evaluating the volatility comparison under a random assignment of branded and independent status. Although such an experiment is infeasible in this study, PSM allows us to minimize the impact of the selection biases. The PSM technique entails creating a counterfactual distribution of observable hotel characteristics in the brand affiliation sample to match the distribution in the independent hotel sample. Using PSM scores as weights, we estimate the coefficients in the multiple regression framework.
Results
Table 4 presents the regression results using raw volatility measures. The dependent variables for Columns 1 to 4 are the respective volatility of OCC, ADR, RevPAR, and GOPPAR. Our main results from the sample 4,582 observations are shown in the coefficients of Branded Hotel. With the exception of ADR, branded hotels in our sample had less KPI volatility than independent hotels, keeping other hotel attributes the same. In other words, branded hotels had more stable volume of room sales (i.e., OCC), RevPAR, and GOPPAR, on average, than hotels that were not brand-affiliated but were otherwise similar. These results were statistically significant. Importantly, however, significance is not necessarily analogous to economic relevance. To measure the economic significance of brand benefit from the risk perspective, we define the volatility reduction associated with branded hotels as follows: the percentage of decreased volatility in KPIs for hotels with a brand affiliation relative to the average KPI volatility on interest, keeping other hotel attributes constant. The economic magnitude of volatility reduction for OCC, RevPAR, and GOPPAR was 16%, 15%, and 17%, respectively.
Raw Volatility Regression Results.
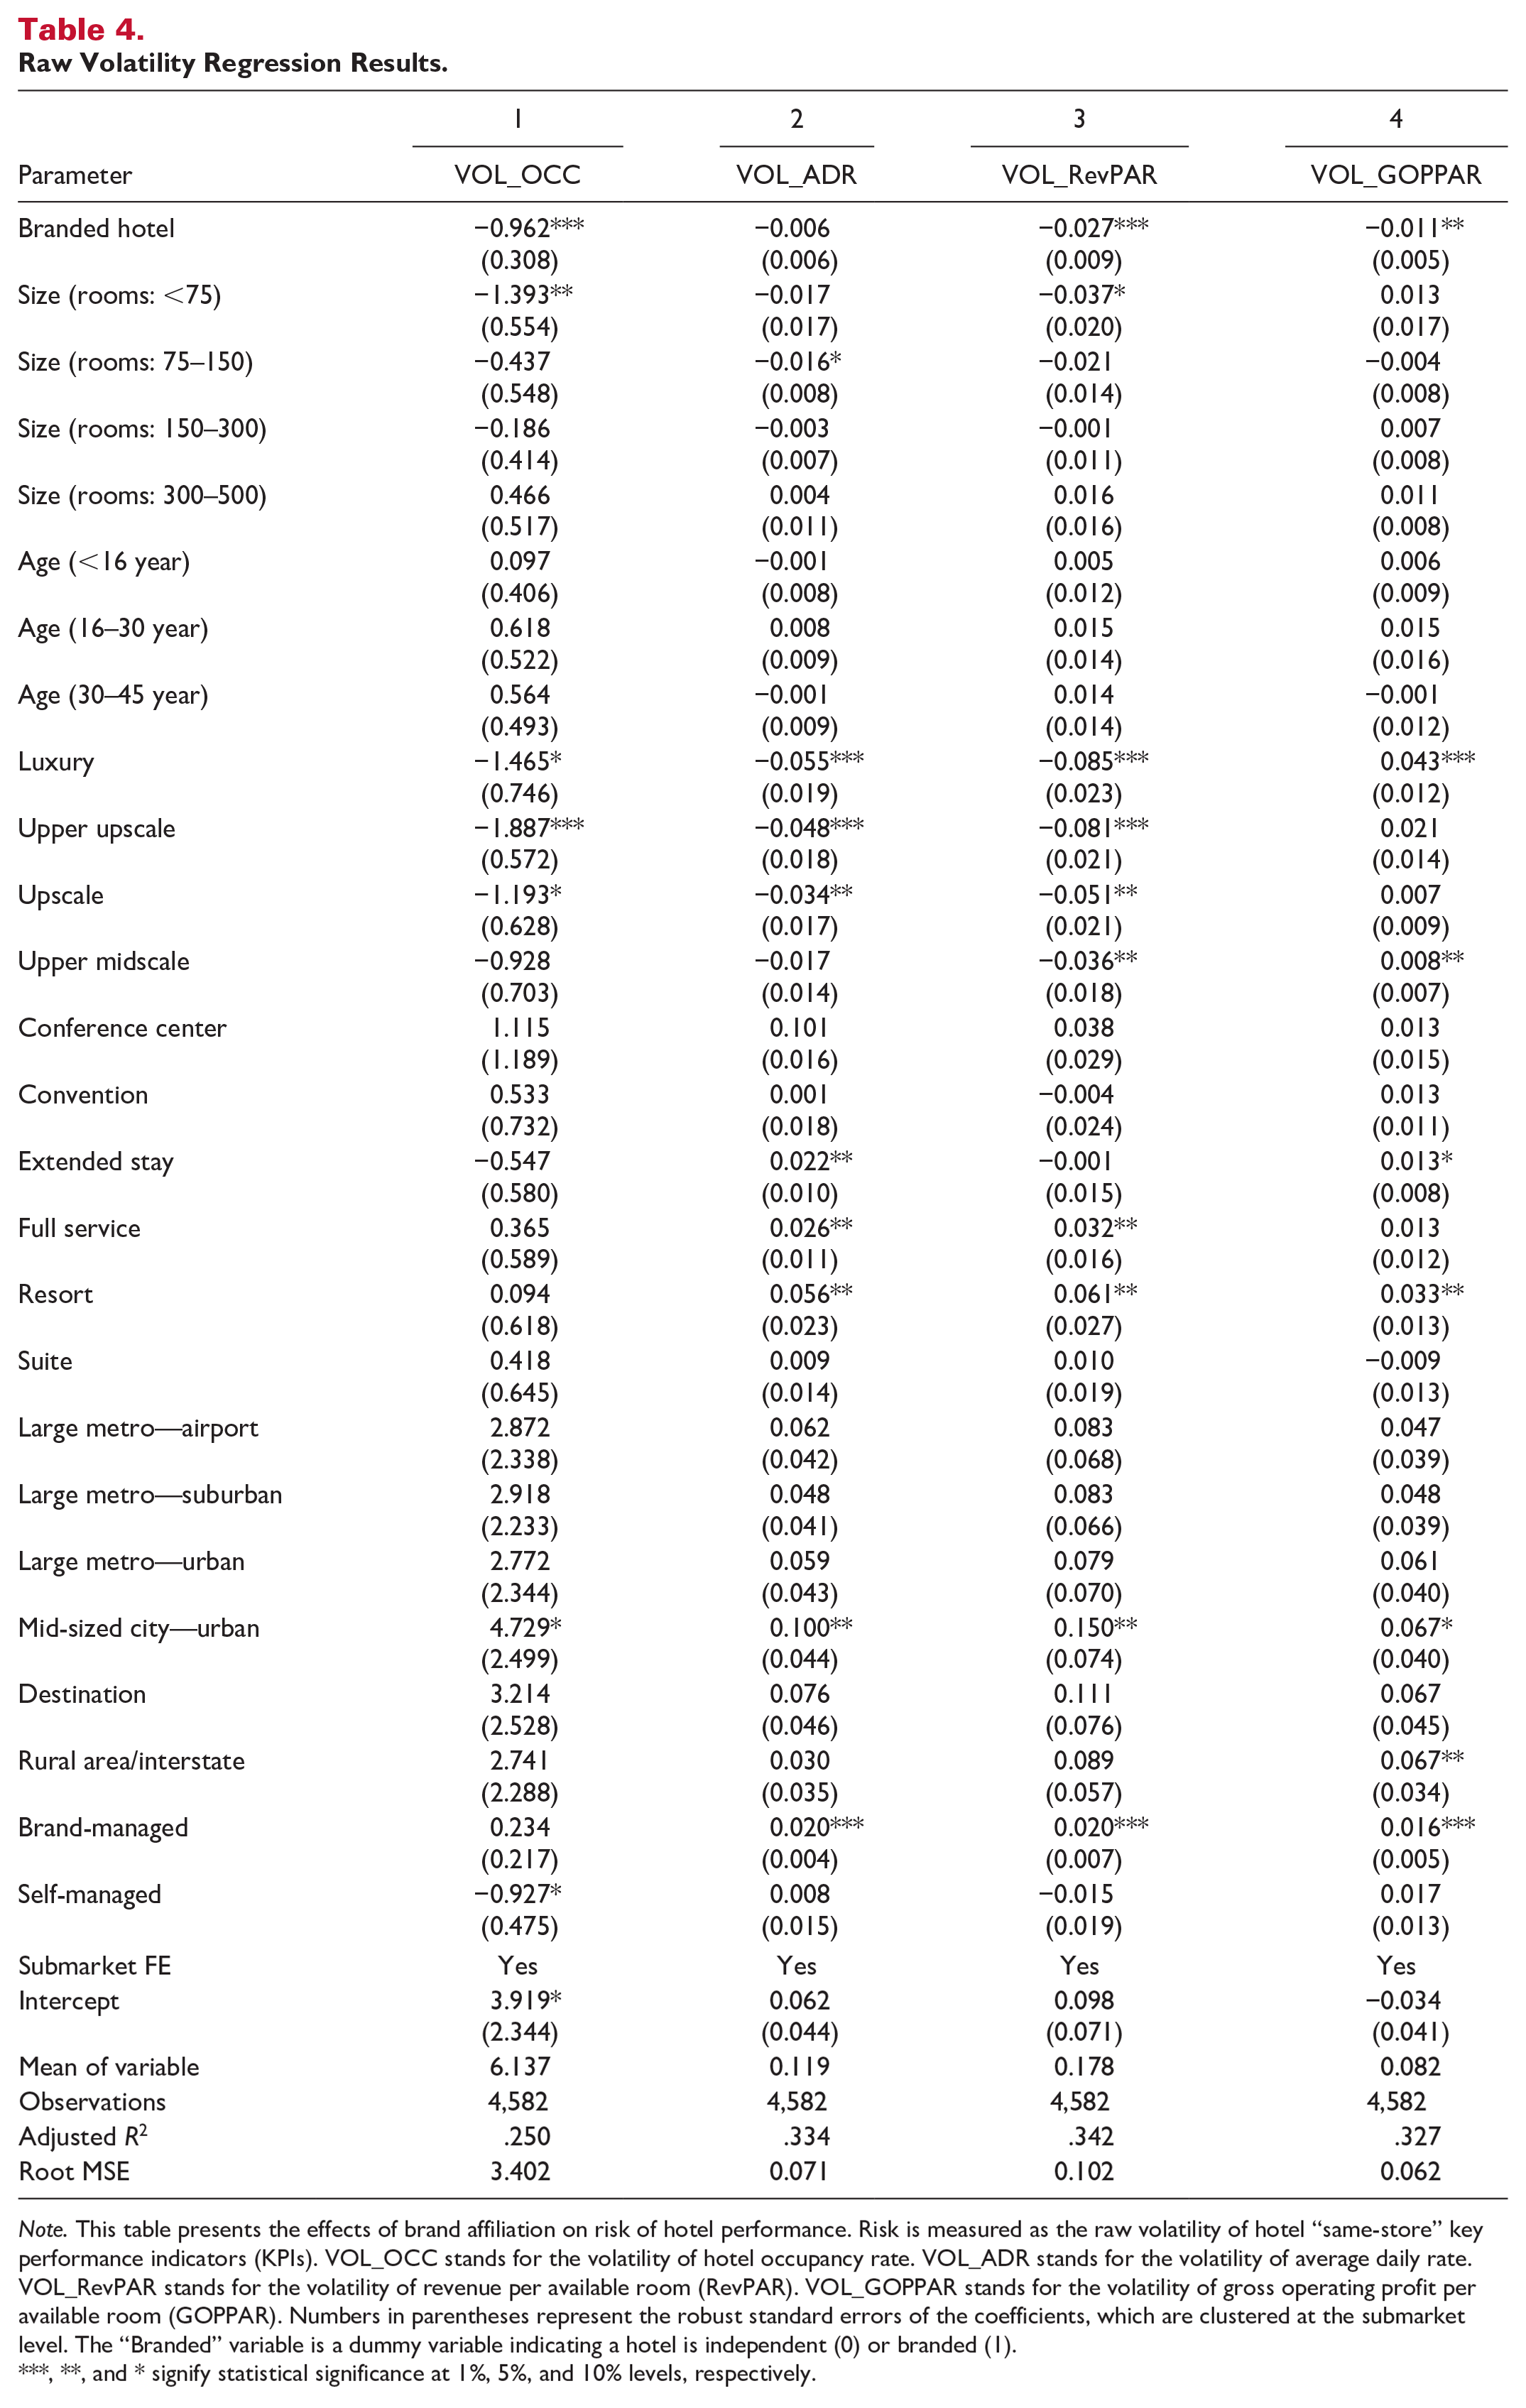
Note. This table presents the effects of brand affiliation on risk of hotel performance. Risk is measured as the raw volatility of hotel “same-store” key performance indicators (KPIs). VOL_OCC stands for the volatility of hotel occupancy rate. VOL_ADR stands for the volatility of average daily rate. VOL_RevPAR stands for the volatility of revenue per available room (RevPAR). VOL_GOPPAR stands for the volatility of gross operating profit per available room (GOPPAR). Numbers in parentheses represent the robust standard errors of the coefficients, which are clustered at the submarket level. The “Branded” variable is a dummy variable indicating a hotel is independent (0) or branded (1).
, **, and * signify statistical significance at 1%, 5%, and 10% levels, respectively.
Table 5 displays the regression results using rolling-window volatility measures. We first illustrate the 3-year rolling window because the 3-year same-store KPI numbers constitute the smallest window for volatility estimation. These regression models are similar to those in Table 4 with one difference: because each rolling window used only 3 years of information, the vintage year effect in each market was controlled in the regression. Table 5 reveals that, when controlling for other confounding factors, branded hotels were associated with lower volatility on all KPI measures than hotels without brand affiliations, that is, independent hotels. These findings coincide with those involving raw volatility measures with one exception: VOL_ADR was significantly lower for branded hotels based on the rolling-window method. Meanwhile, the difference between branded and independent hotels was statistically insignificant according to raw volatility measures. We also observed three major distinctions when comparing results using a 3-year rolling window versus raw volatility measures. First, average volatility was lower when calculated for a 3-year rolling window than for 20-year raw measures. For example, the mean volatility of OCC was roughly 3.65% over three consecutive years, whereas the volatility using raw measures was 6.14%. The reason for this discrepancy is straightforward: the raw volatility method measures KPI variation over the 20-year sample period, which contained two business cycles. Average volatility statistics for other KPIs measured using the raw method were correspondingly smaller than those measured using three-year rolling windows. Second, the economic magnitude of coefficients for Branded Hotel was smaller for three-year rolling windows compared to raw volatility measures (−0.224 vs. −0.962 for OCC, −0.005 vs. −0.006 for ADR, −0.008 vs. 0.027 for RevPAR, and −0.008 vs. −0.011 for GOPPAR).
Three-Year Rolling Window Volatility Regression Results.
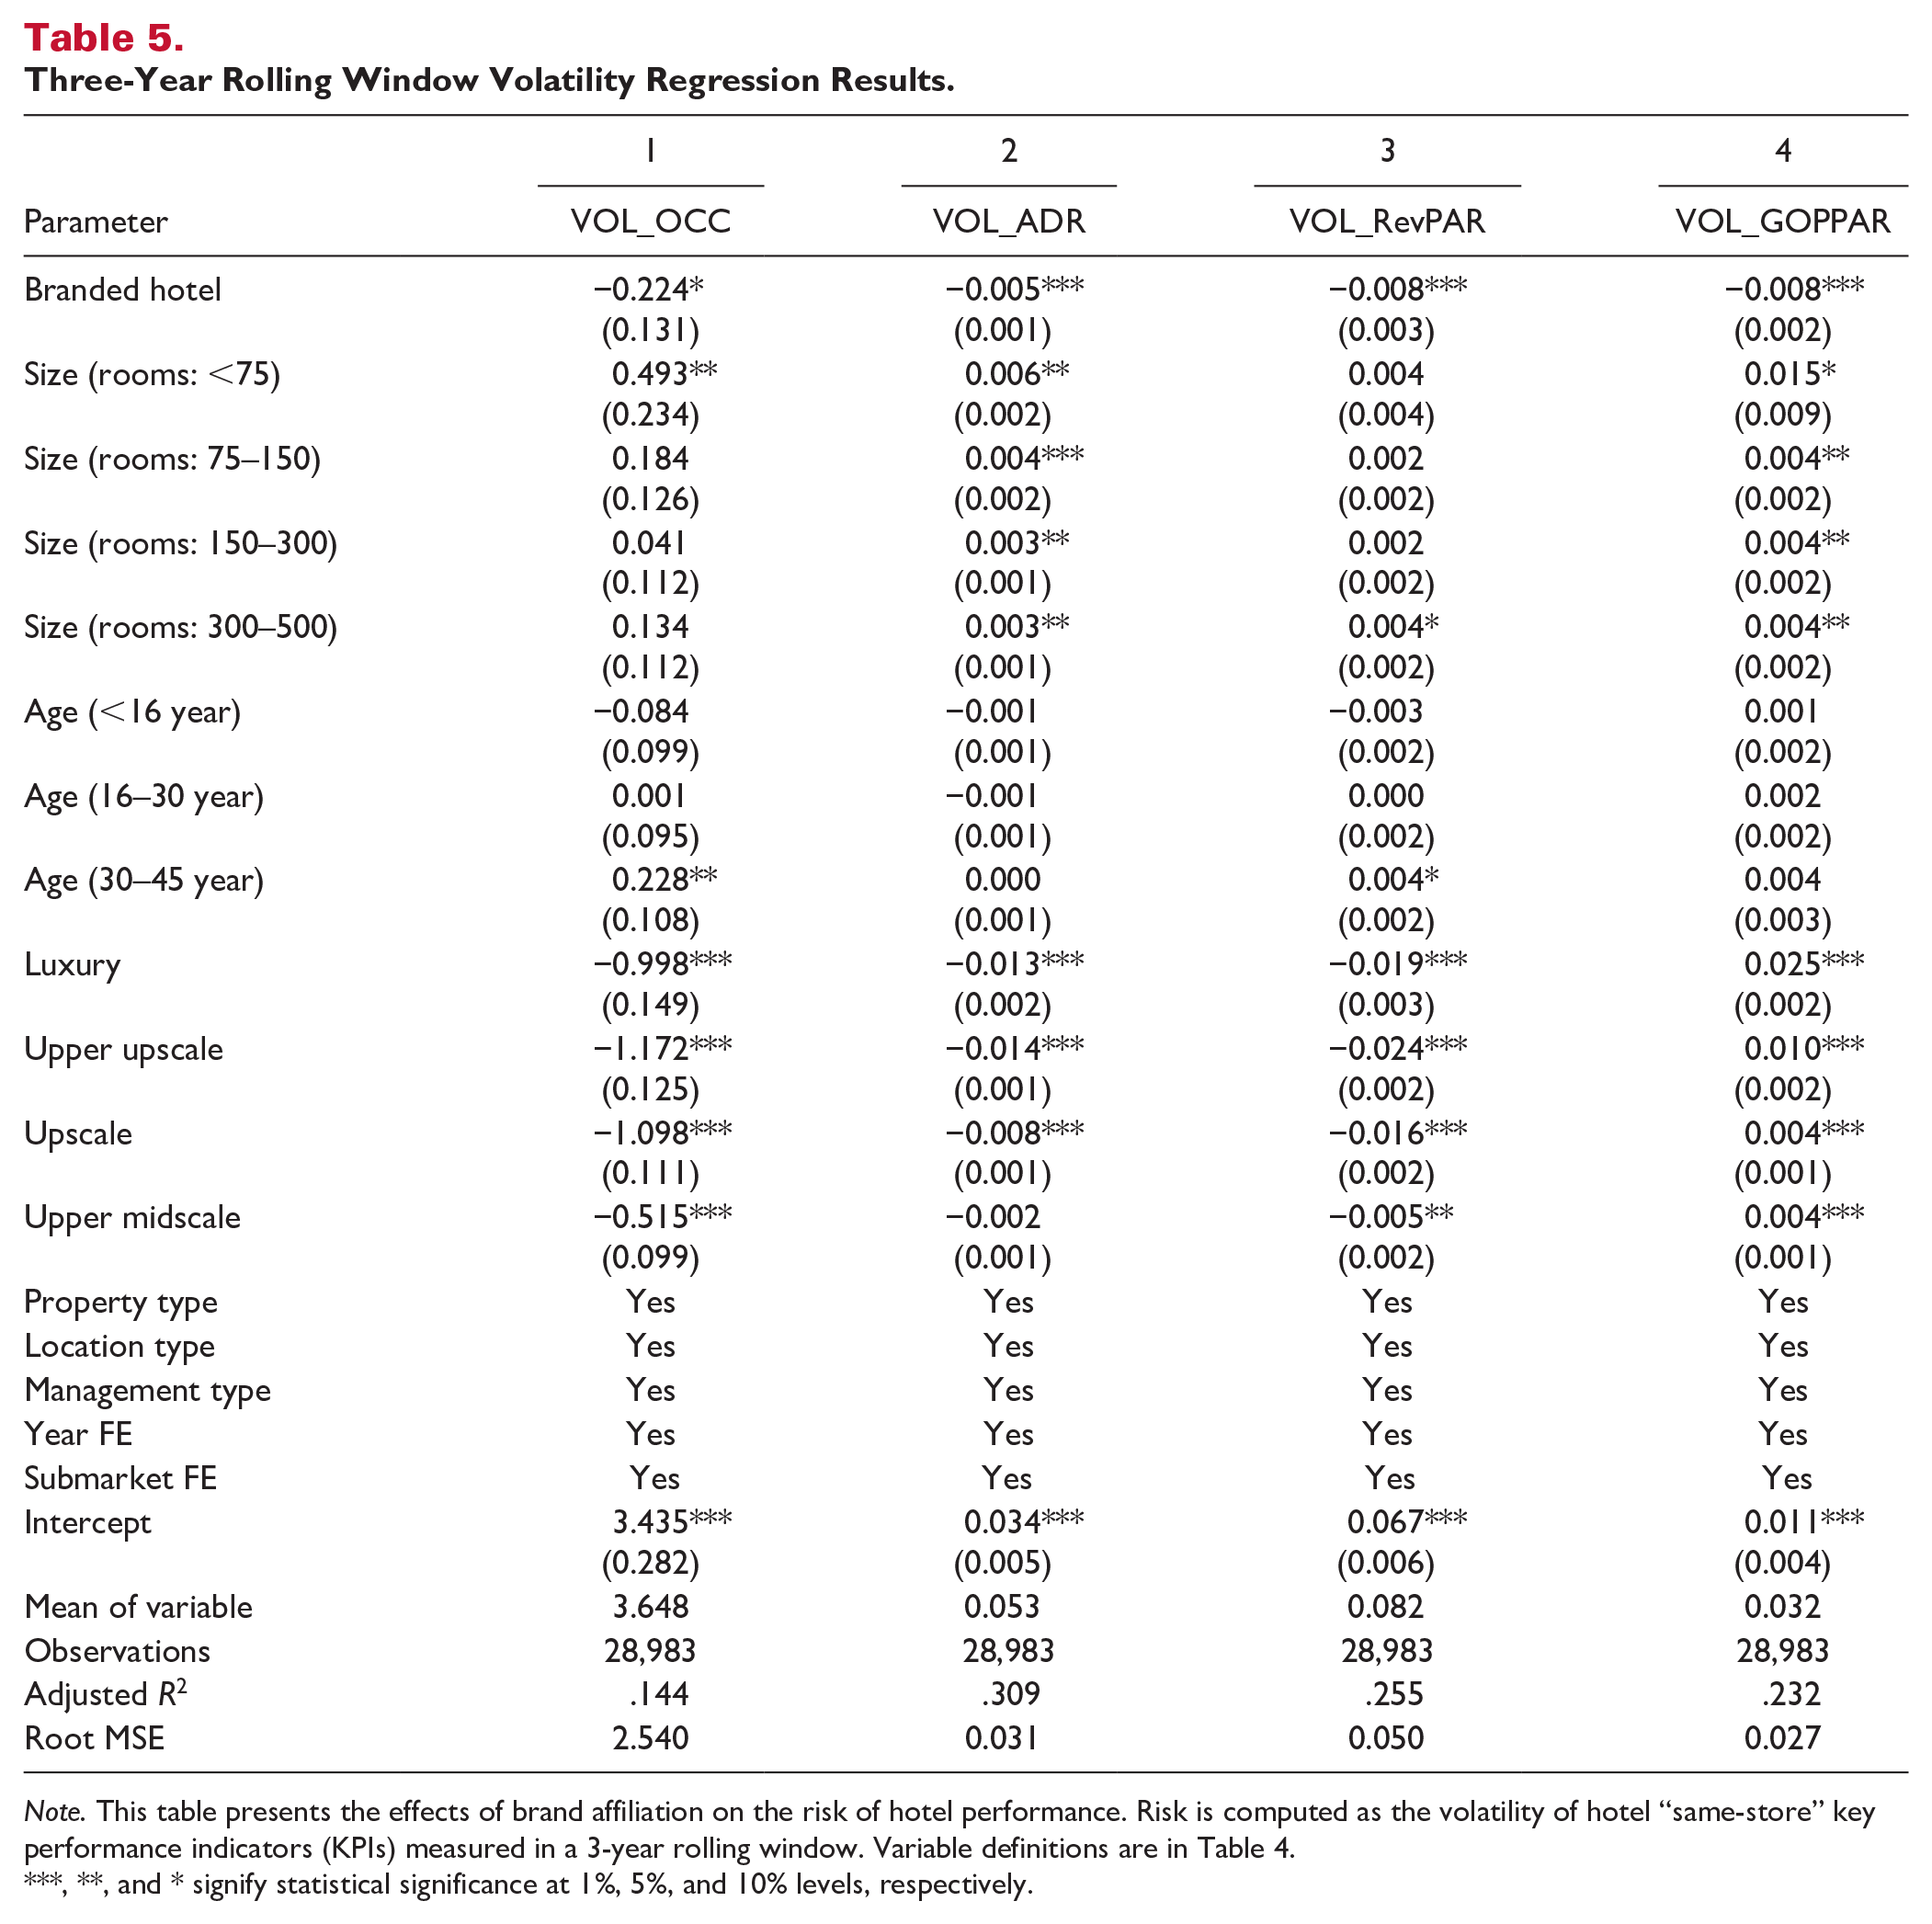
Note. This table presents the effects of brand affiliation on the risk of hotel performance. Risk is computed as the volatility of hotel “same-store” key performance indicators (KPIs) measured in a 3-year rolling window. Variable definitions are in Table 4.
, **, and * signify statistical significance at 1%, 5%, and 10% levels, respectively.
The benefits of 3-year, rolling-window volatility measures inspired us to explore the effects of rolling-window length on the magnitude of volatility reduction for brand-affiliated hotels. Choosing the rolling-window length in which to measure volatility has important managerial implications. Hotel owners may not own a property for either as little as 3 years or as long as 20 years. Different types of hotel investors (e.g., individual vs. institutional, private vs. public) who have unique investment objectives or varied capital costs may opt to hold a hotel property for 5, 7, or 6 years, for example. Therefore, we also measured volatility over 5-, 7-, and 9-year rolling windows. These holding periods are supported by recent hotel investor surveys. Tables 6 to 9 list the magnitude of the volatility reduction effect of Branded hotels across different rolling windows for OCC, ADR, RevPAR, and GOPPAR, respectively. The dependent variable in Table 6 is VOL_OCC. Volatility results show that brand-affiliated hotels were associated with lower volatility than independent hotels. The negative coefficients of Branded Hotel, which reflect the impact of volatility reduction, were consistent for 3-, 5-, 7-, and 9-year rolling windows. Volatility reduction effects were also statistically significant across different years. Of note, the magnitude of volatility reduction increased as the rolling-window length increased. For instance, the magnitude of volatility reduction measured over three continuous years was approximately 0.224; this figure rose considerably to 0.390 when measuring volatility over 9 years. The above pattern suggests that the benefit of stable hotel occupancy increases as the number of years in the holding period increases. Similar patterns of volatility reduction were confirmed for ADR, RevPAR, and GOPPAR. Ceteris paribus, brand-affiliated hotels were associated with lower volatility in terms of ADR (Table 7), RevPAR (Table 8), and GOPPAR (Table 9) compared with independent hotels.
Rolling Window Volatility—Occupancy Rate as Dependent Variable.
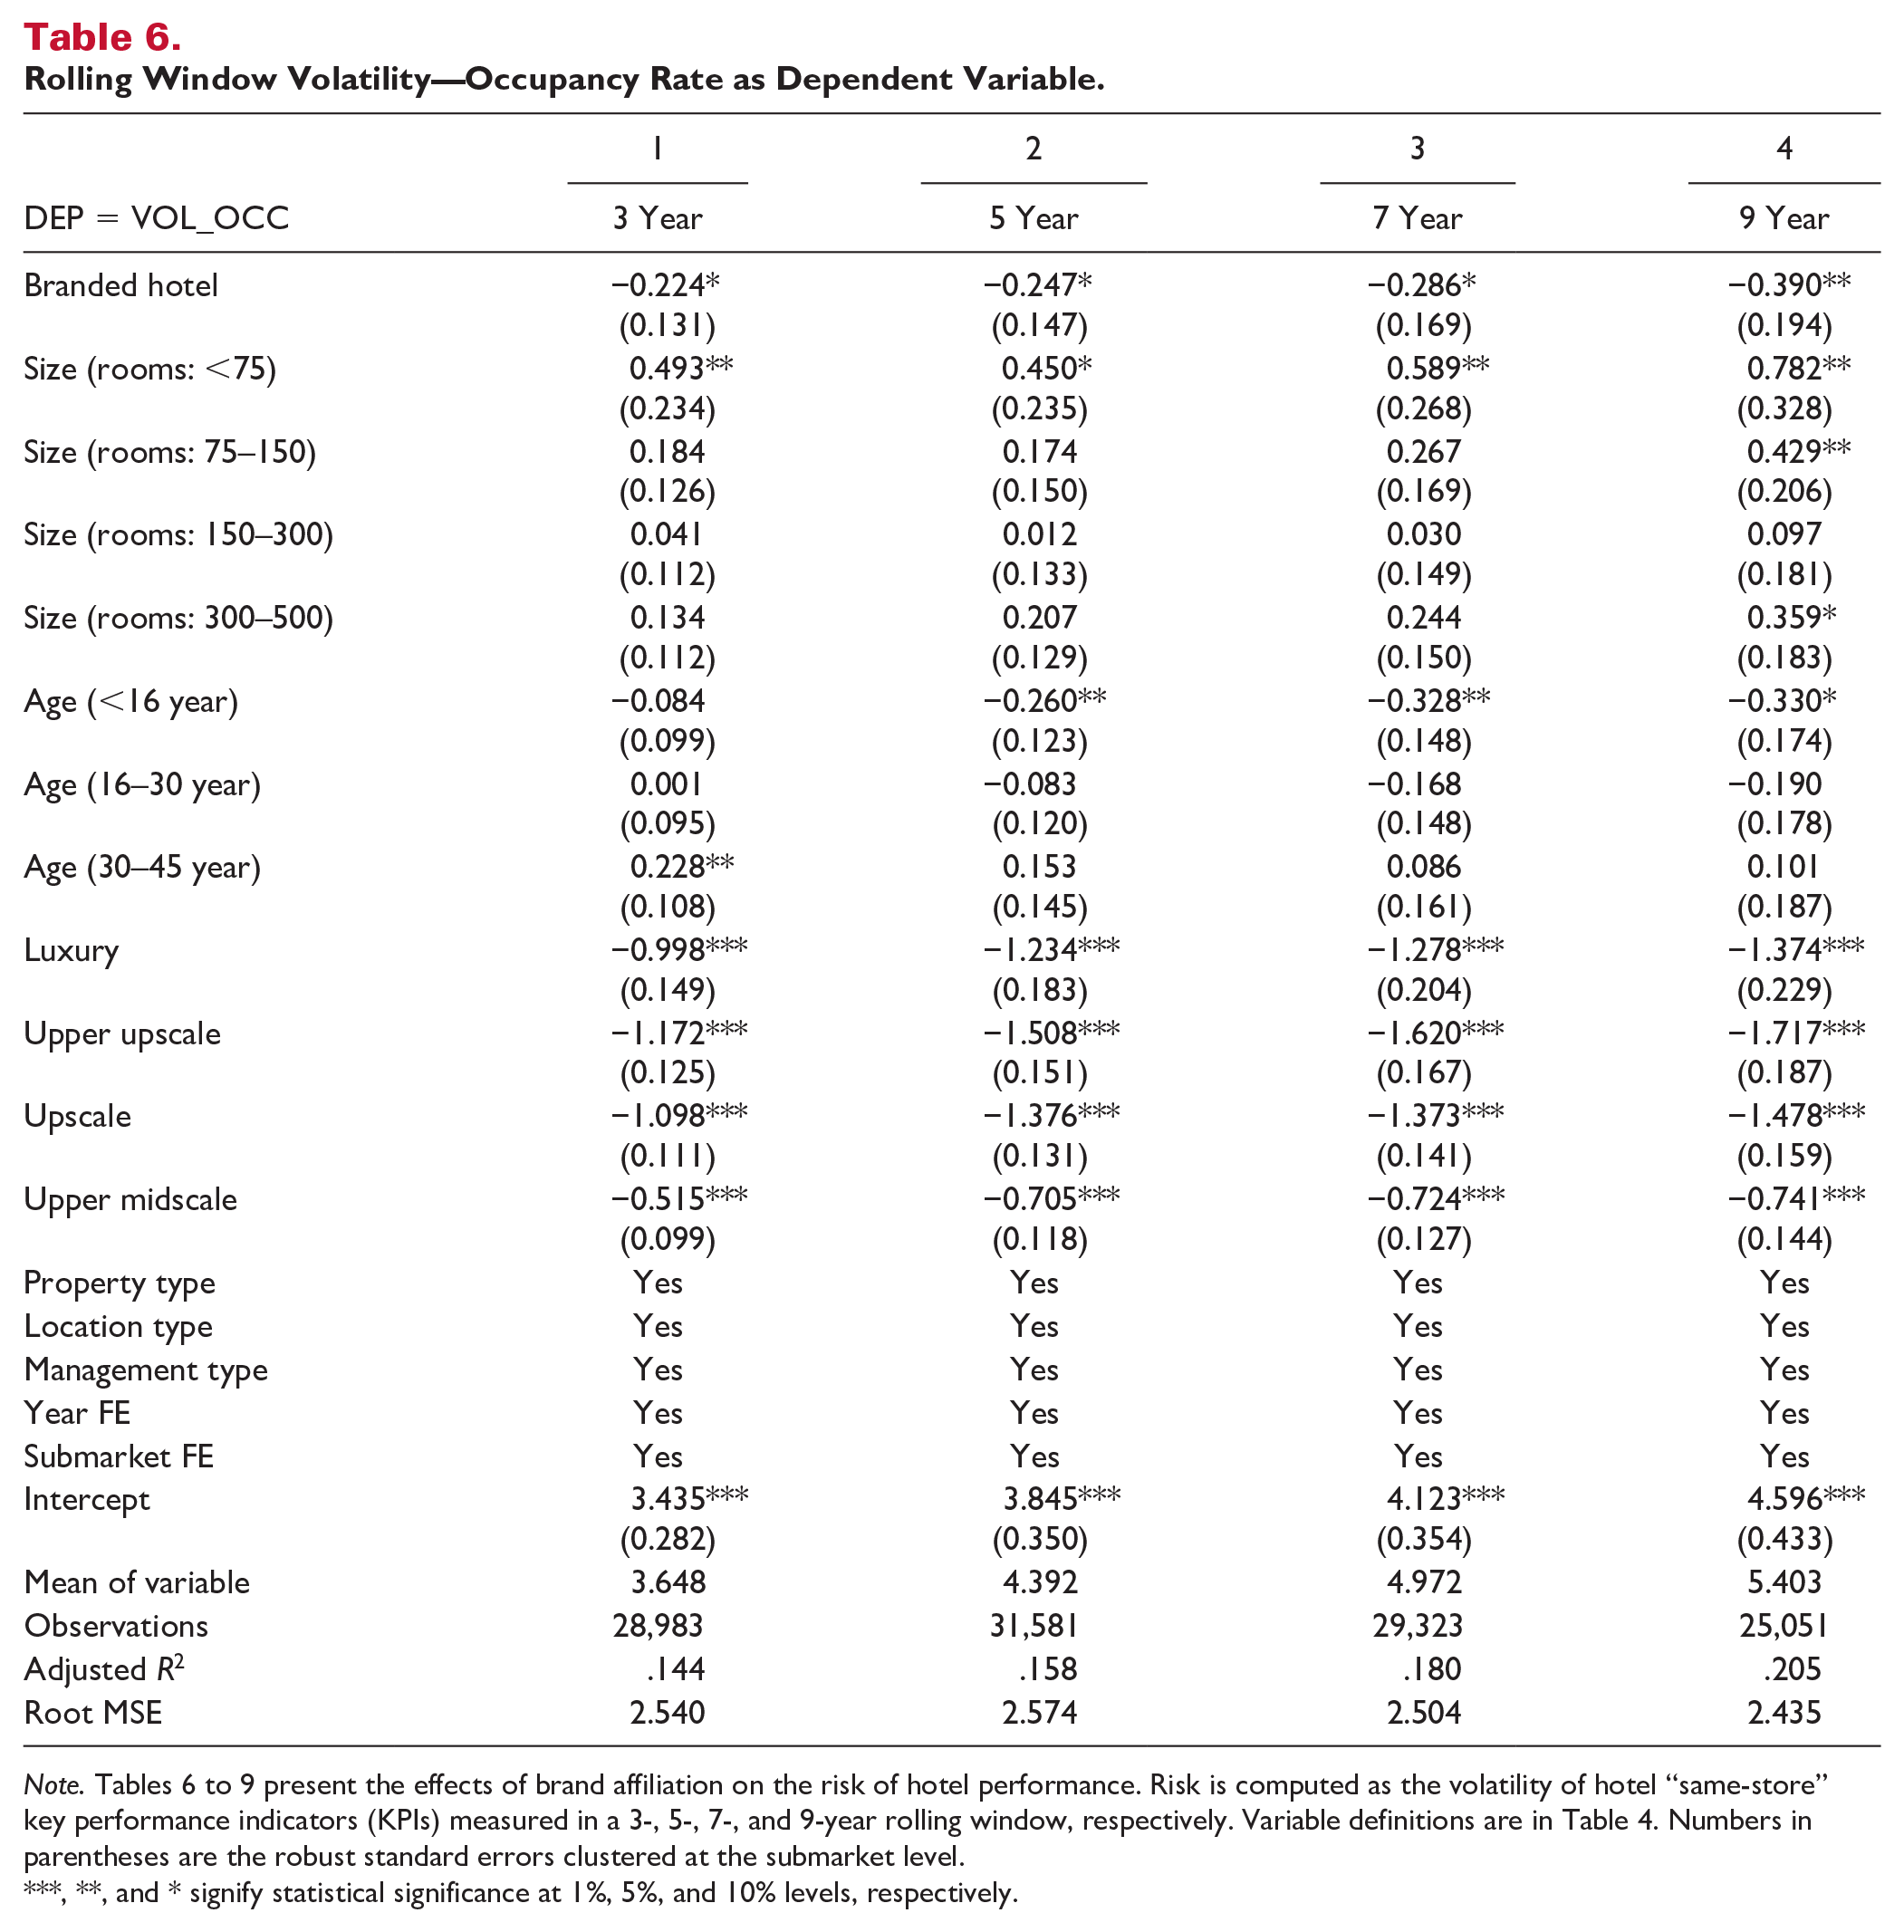
Note. Tables 6 to 9 present the effects of brand affiliation on the risk of hotel performance. Risk is computed as the volatility of hotel “same-store” key performance indicators (KPIs) measured in a 3-, 5-, 7-, and 9-year rolling window, respectively. Variable definitions are in Table 4. Numbers in parentheses are the robust standard errors clustered at the submarket level.
, **, and * signify statistical significance at 1%, 5%, and 10% levels, respectively.
Rolling Window Volatility—ADR as Dependent Variable.
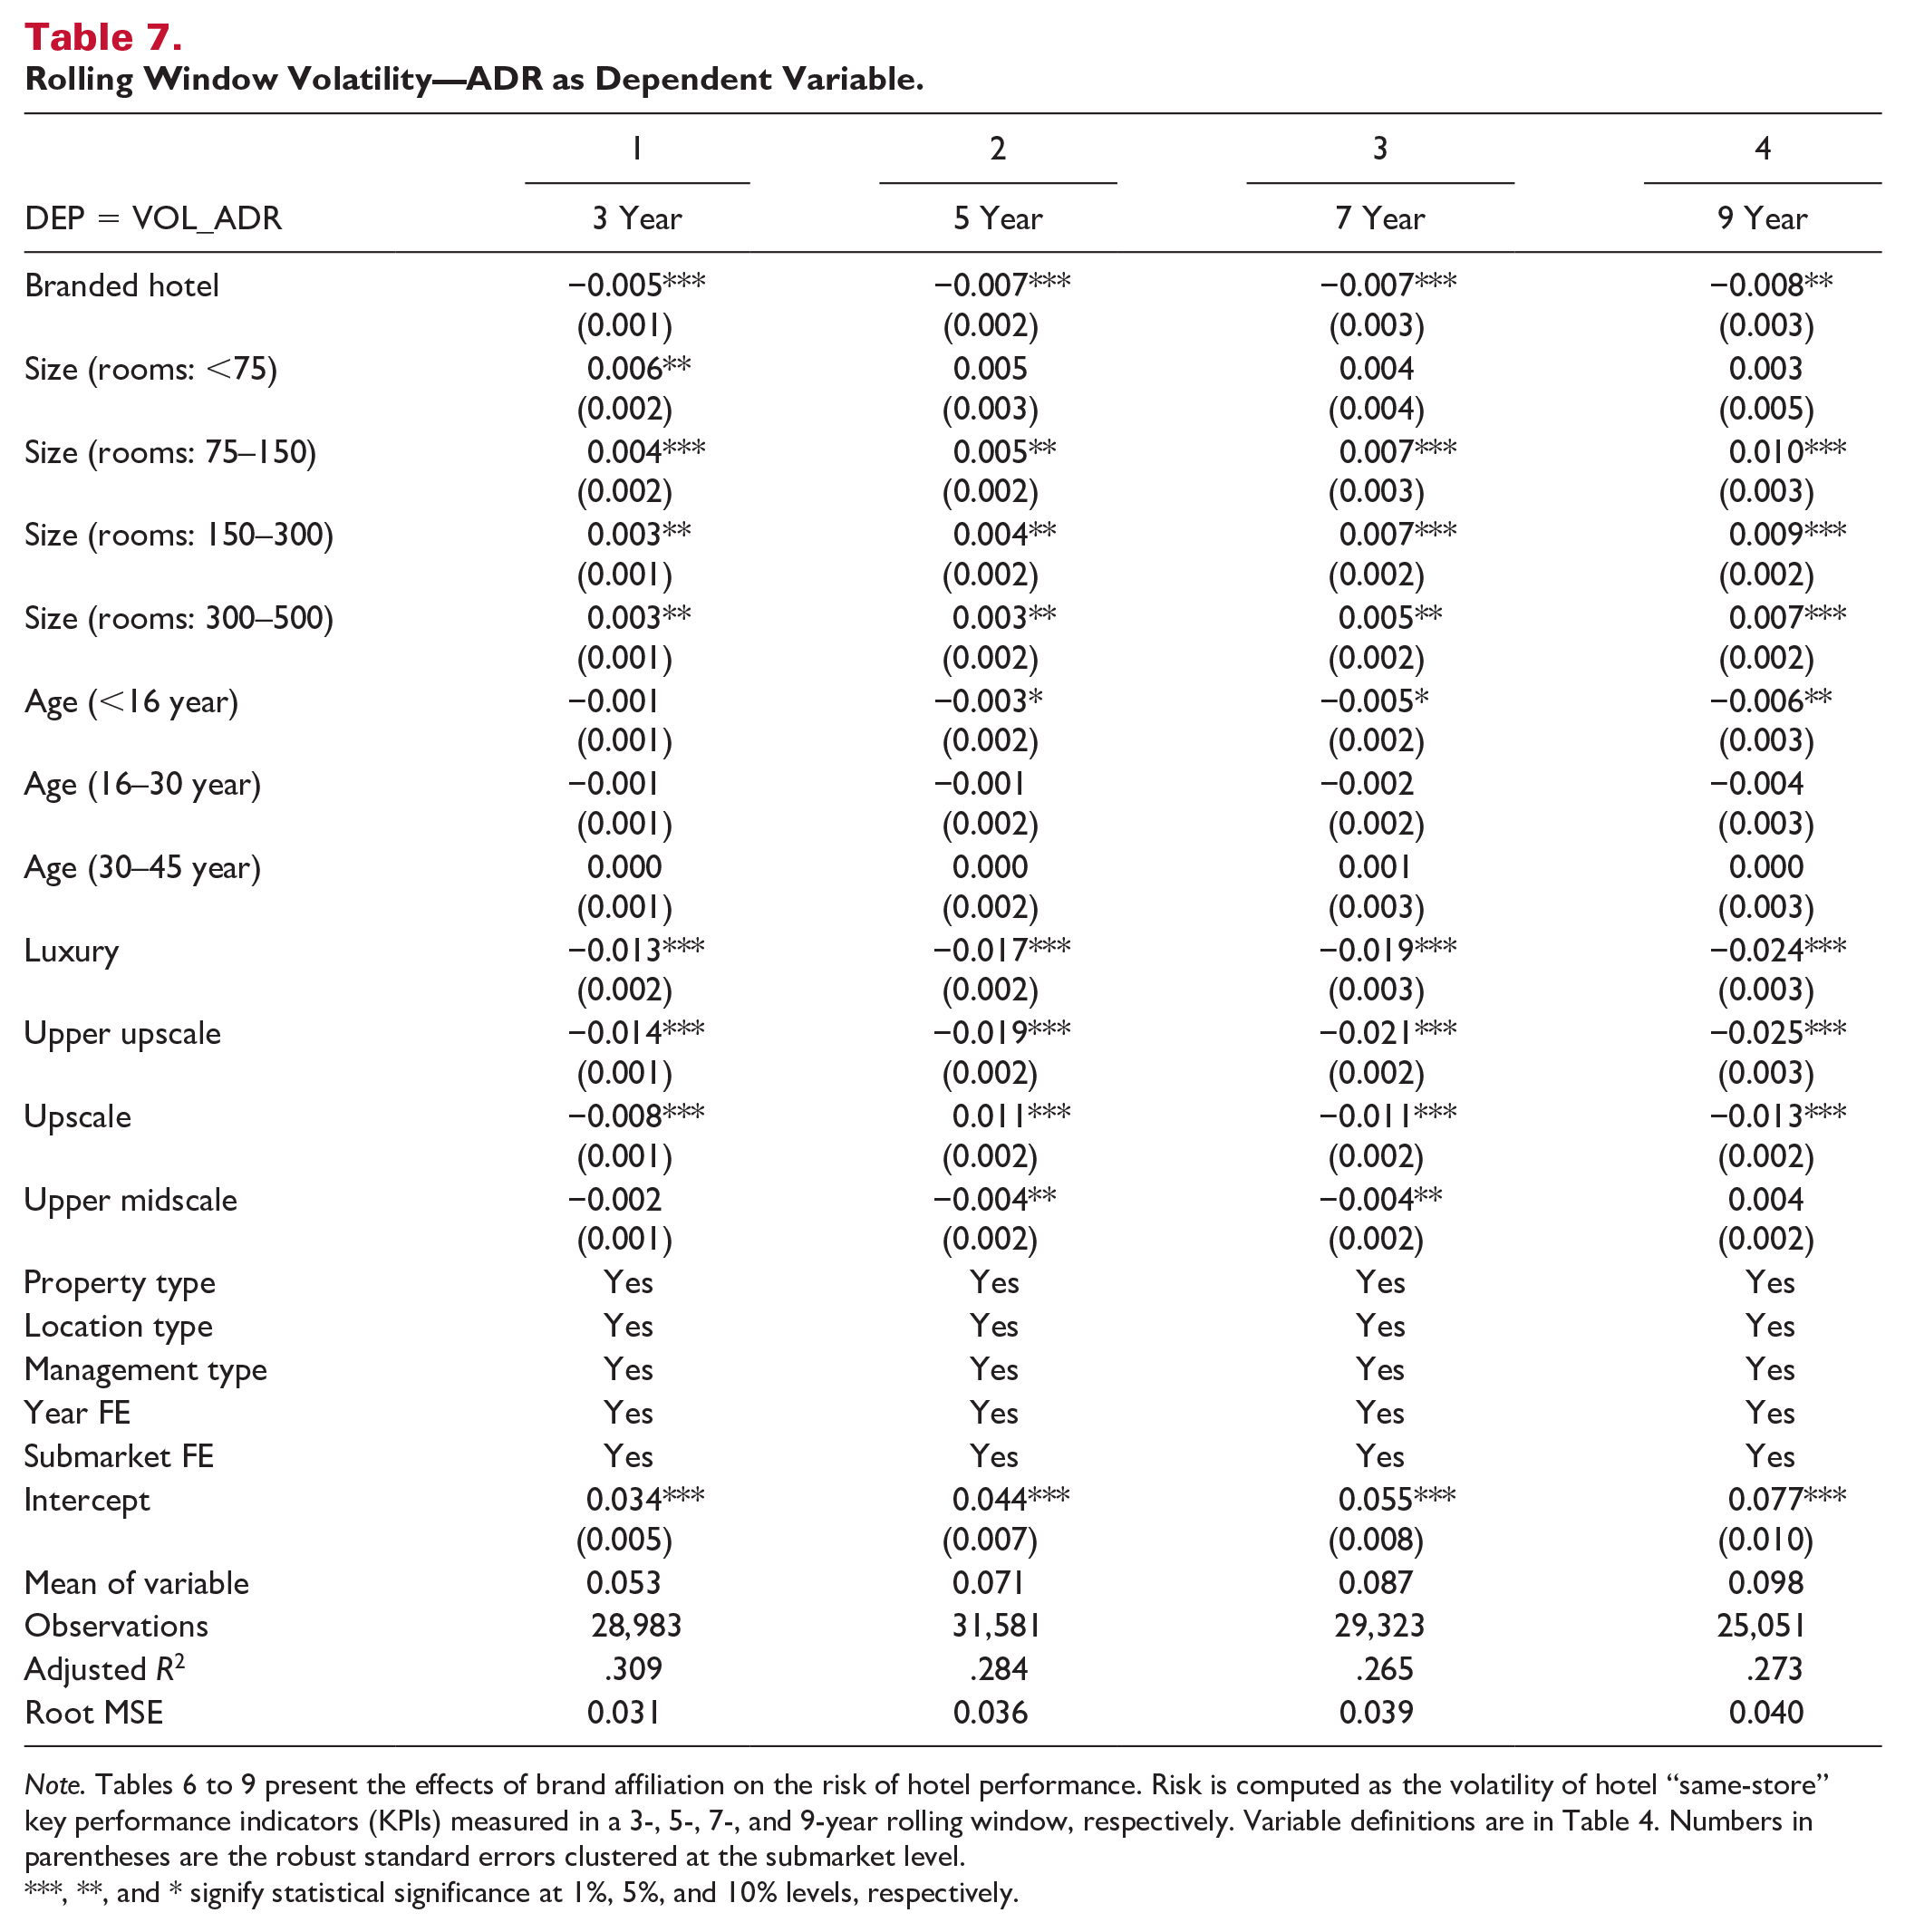
Note. Tables 6 to 9 present the effects of brand affiliation on the risk of hotel performance. Risk is computed as the volatility of hotel “same-store” key performance indicators (KPIs) measured in a 3-, 5-, 7-, and 9-year rolling window, respectively. Variable definitions are in Table 4. Numbers in parentheses are the robust standard errors clustered at the submarket level.
, **, and * signify statistical significance at 1%, 5%, and 10% levels, respectively.
Rolling Window Volatility—RevPAR as Dependent Variable.
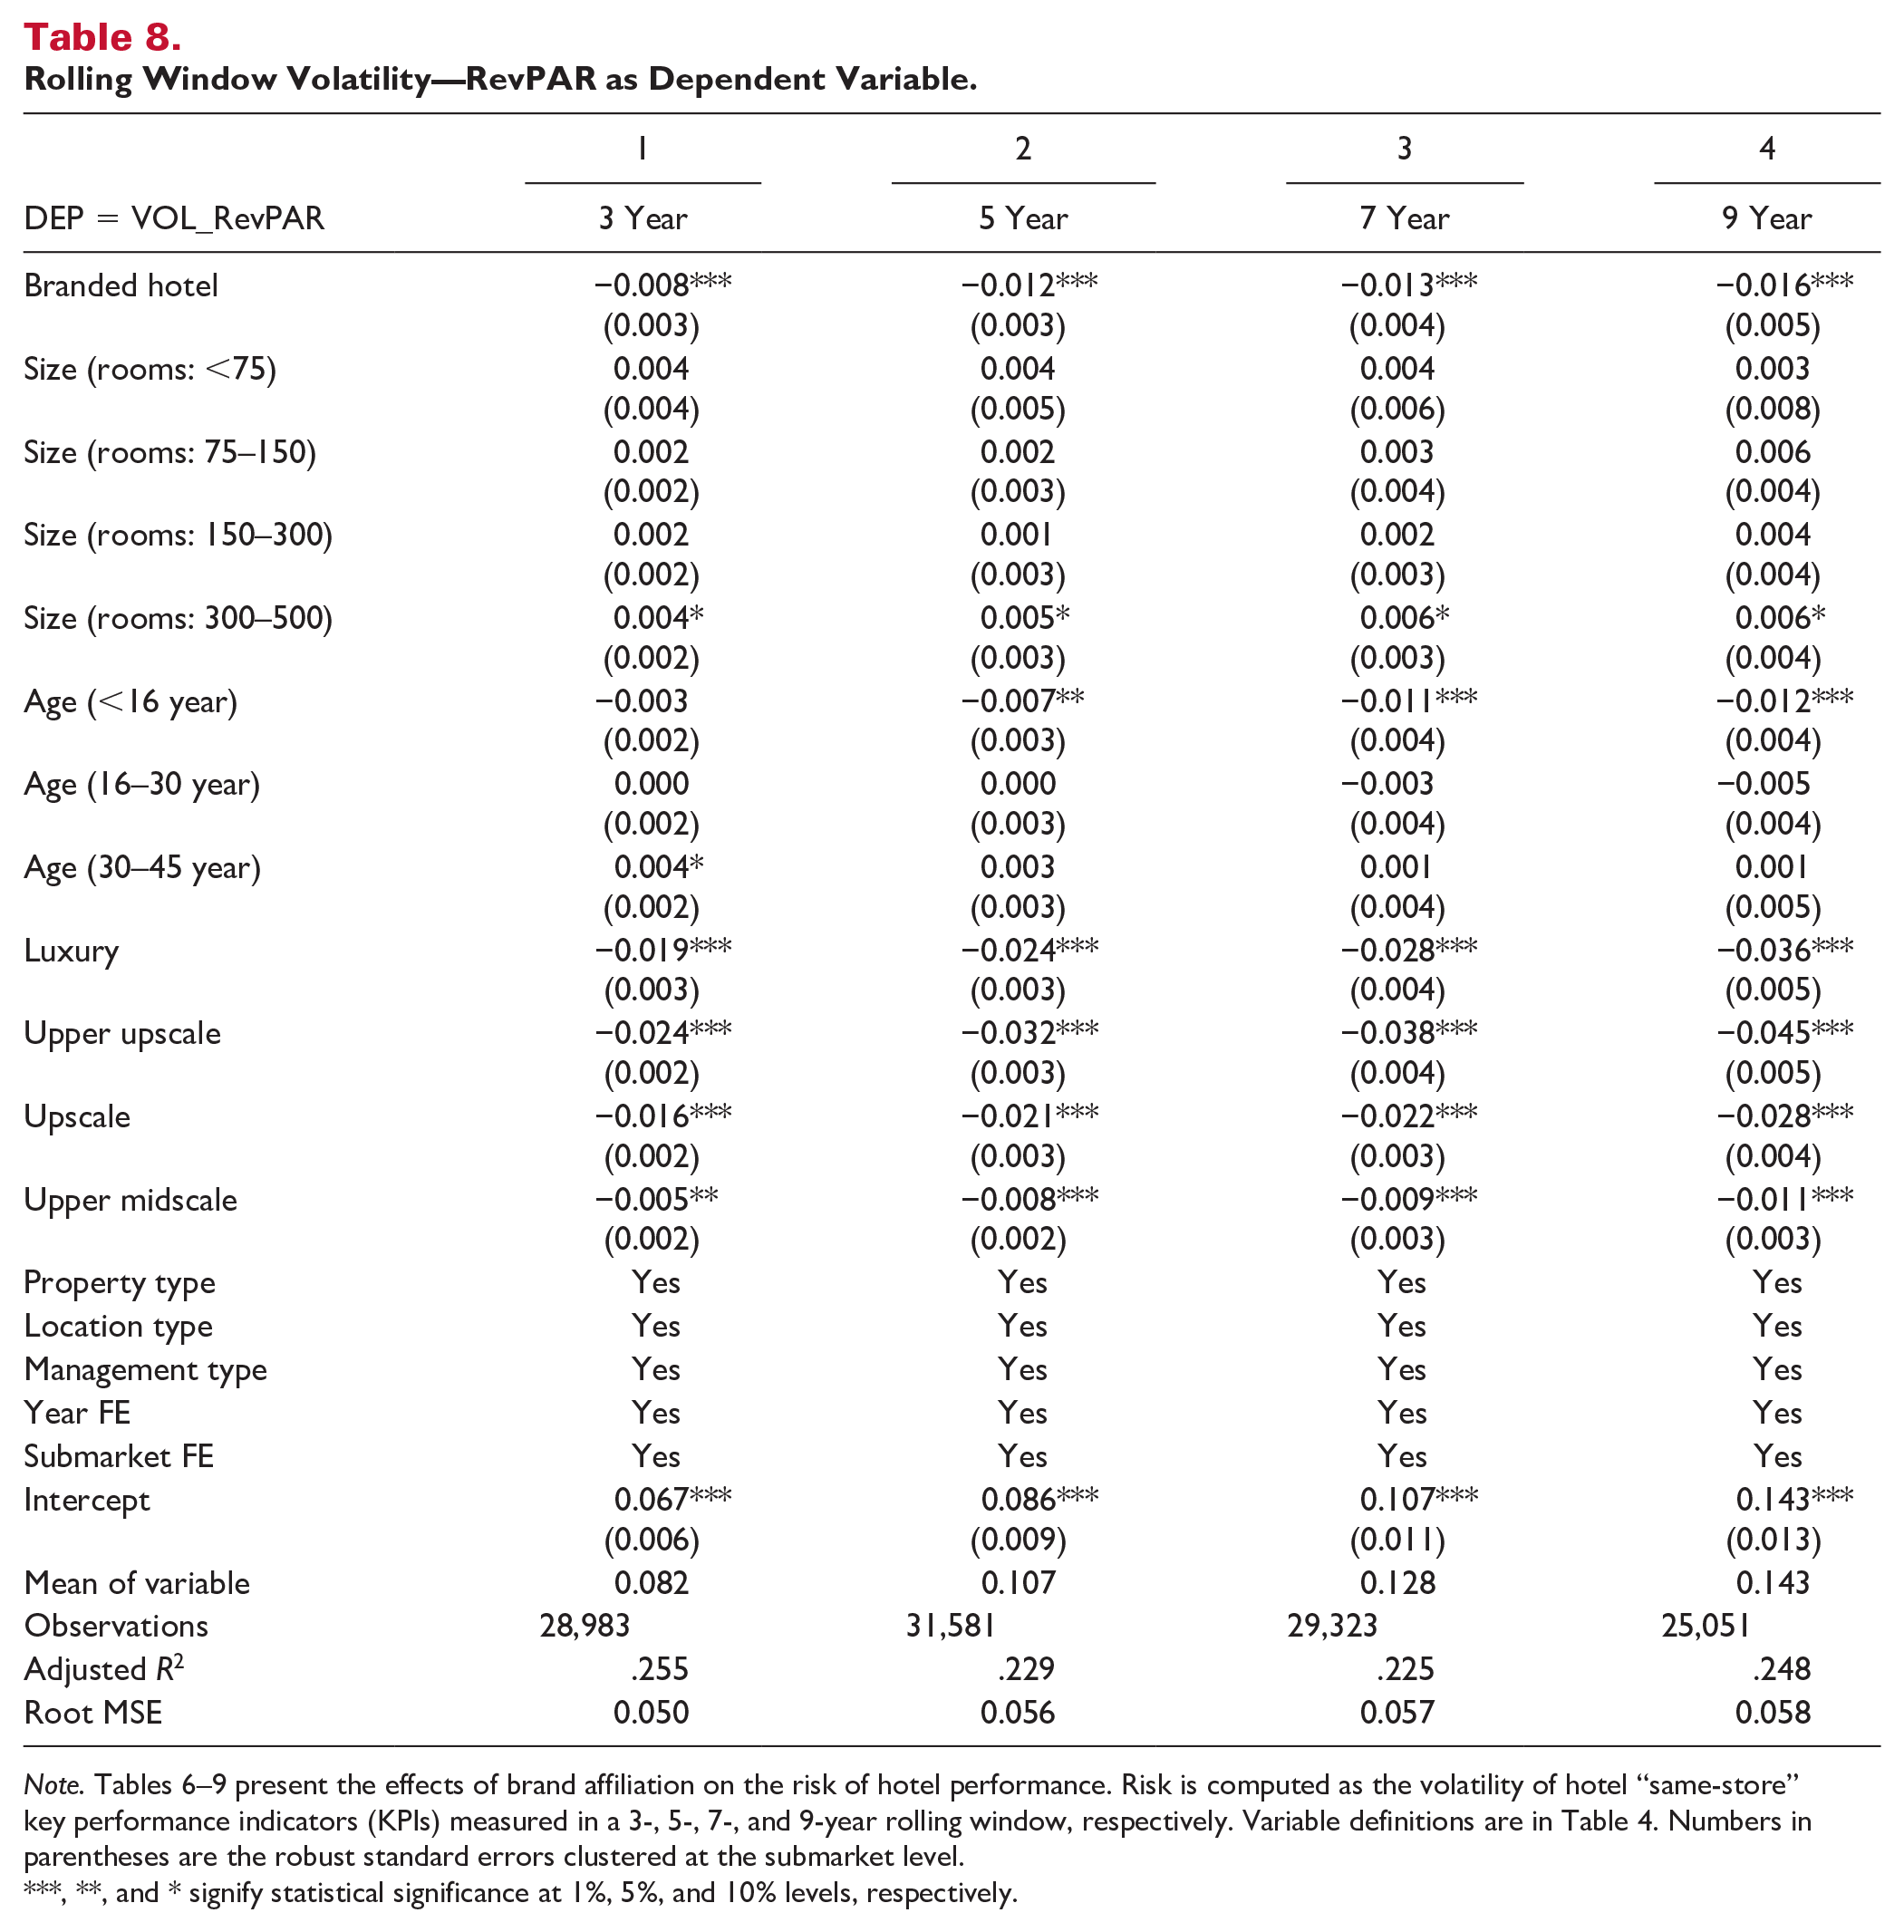
Note. Tables 6–9 present the effects of brand affiliation on the risk of hotel performance. Risk is computed as the volatility of hotel “same-store” key performance indicators (KPIs) measured in a 3-, 5-, 7-, and 9-year rolling window, respectively. Variable definitions are in Table 4. Numbers in parentheses are the robust standard errors clustered at the submarket level.
, **, and * signify statistical significance at 1%, 5%, and 10% levels, respectively.
Rolling Window Volatility—GOPPAR as Dependent Variable.
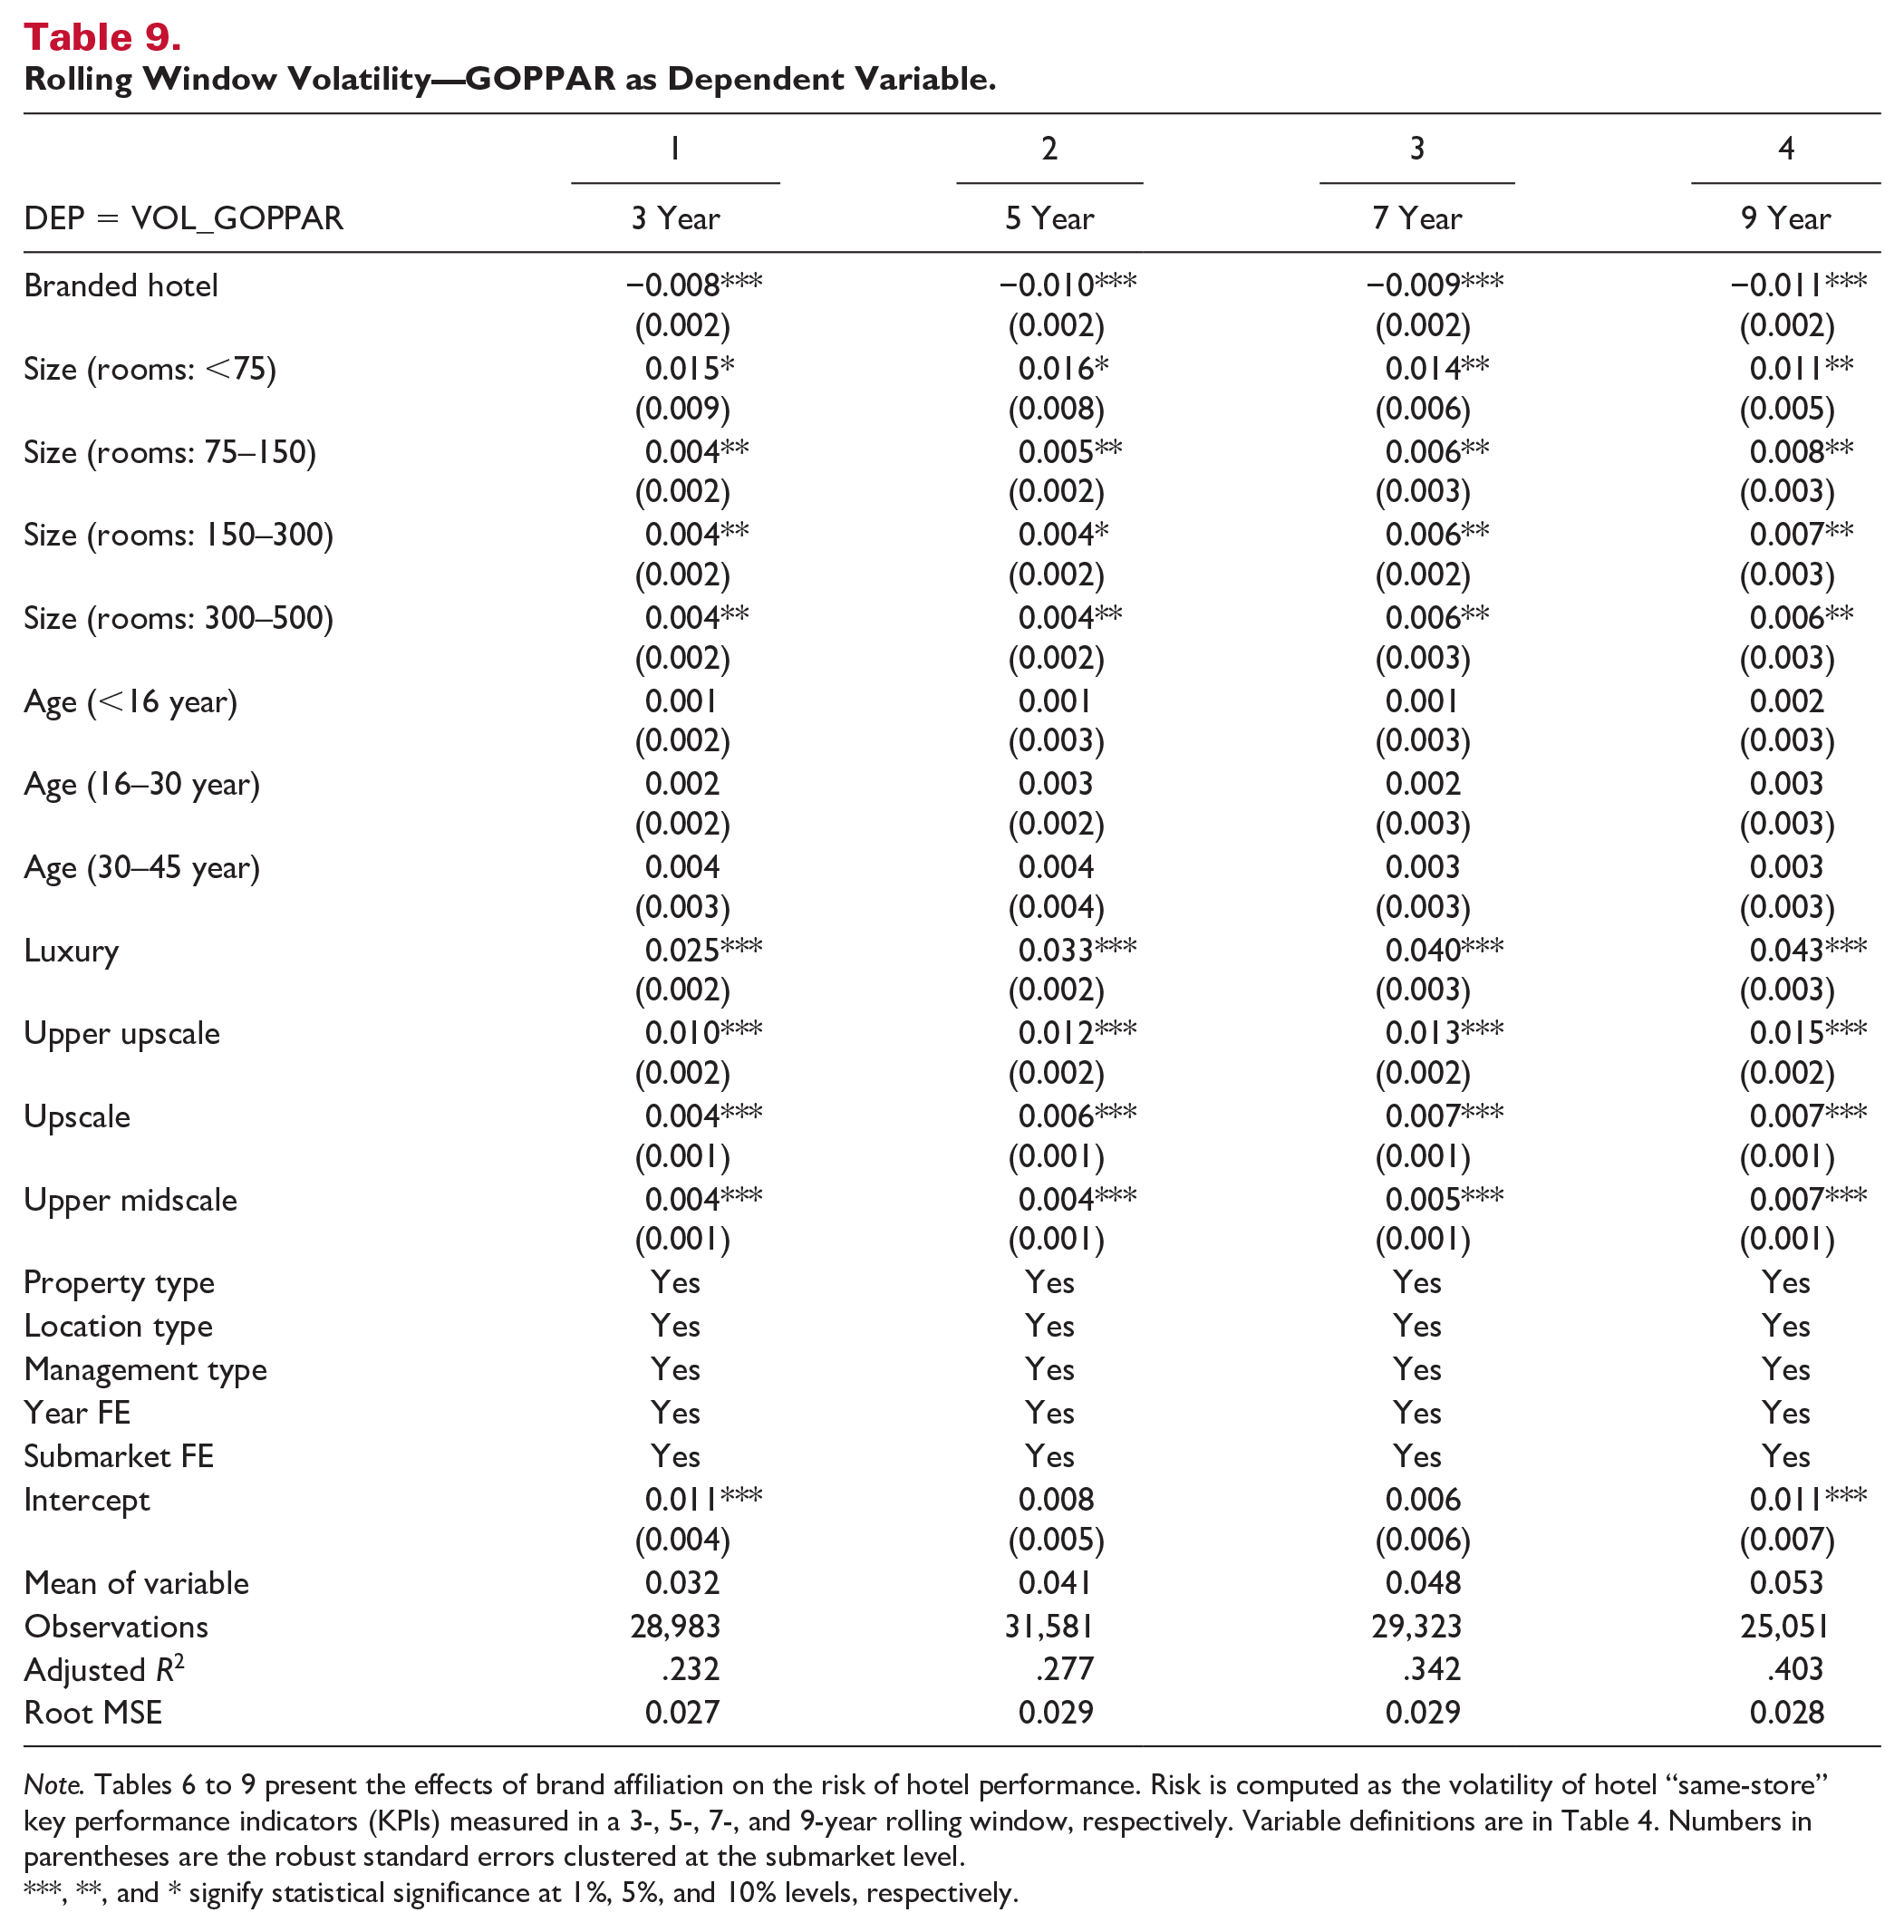
Note. Tables 6 to 9 present the effects of brand affiliation on the risk of hotel performance. Risk is computed as the volatility of hotel “same-store” key performance indicators (KPIs) measured in a 3-, 5-, 7-, and 9-year rolling window, respectively. Variable definitions are in Table 4. Numbers in parentheses are the robust standard errors clustered at the submarket level.
, **, and * signify statistical significance at 1%, 5%, and 10% levels, respectively.
In summary, it is important to note that we have shown that brand-affiliated hotels had lower volatility at both the revenue and profit levels. Specifically, branded hotels had lower volatility on all selected KPIs: OCC, ADR, RevPAR, and GOPPAR. Volatility reduction effects remained robust across two measurement methods and different rolling-window lengths. These findings reveal another advantage to hotel branding decisions: lower risk. In essence, for the same levels of KPI measures, branded hotels face less risk when other cofounding factors remain the same (e.g., chain segments, service levels, location types, hotel attributes, and submarkets). Furthermore, the associated benefits increase as the holding period lengthens. The volatility reduction effect also appears economically meaningful: on average, brand-affiliated hotels can realize a volatility reduction of 7% to 16% for OCC, 8% to 10% for ADR, 10% to 11% for RevPAR, and 19% to 25% for GOPPAR. Interestingly, among all KPI measures, the advantages of lower risk for branded hotels are greatest in terms of profit. Most hotel managers benchmark top-line performance, such as occupancy rates and ADRs, to their peers (i.e., competitive, or “comp” set). The merits of lower profit risk for branded hotels are often neglected. Our results indicate that bottom-line performance for branded hotels is even stronger than top-line performance from a risk reduction perspective. These findings imply that hotels with brand affiliations are not only successful at revenue management, but also excel at cost control.
Robustness Checks
We have run several robustness checks. First, we checked whether the results were driven by our definition of Branded hotels. In the main study, Branded hotel is defined as a hotel affiliated with a brand that operates three or more hotels in a given year. We re-estimated the model using different criterions for brand affiliation: five and more hotels, and ten and more hotels. The results were very similar to the results using original definition. Second, we used the range, which is defined as the difference between maximum and minimum, as an alternative measure of cash flow risk. The tests using range as dependent variable yielded the same results. Third, we used time-varying variables to control for the state of the economy and financial market conditions. In our main analysis using rolling-window, we controlled the year fixed effect (middle year when calculating the rolling-window volatilities) and submarket dummies, in addition to the hotel property and service characteristics. In other words, each hotel’s cash flow risk was compared with other comparable hotels that were in the same submarket for the same year. Because the economy and market condition would have the same impacts on the business for hotels in the same region and same year, we implicitly controlled for the time-varying state of the economy and financial market. As a robustness check, we analyzed other control variables that describe the state of the economy and/or of financial markets. There is extensive literature that discussed and empirically investigated how the economic status and financial market condition impact the tourism and hotel market demand and performance. In a recent study, O’Neill and Ouyang (2020) analyzed and ranked the predictive ability of various economic variables. They identified GDPI (Gross Domestic Private Investment, the portion of GDP generated by private business investment, also known as GPDI) as having the strongest predictive ability. Therefore, we included GDPI to control for the state of the economy in our robust analysis. In addition, we used SP500 (S&P 500 index) to control for financial market conditions (SP500 was also an outperforming factor in the three-factor model documented in O’Neill & Ouyang, 2020). It showed that both GPDI and SP500 were significantly associated with the hotel cash flow risk. After controlling the state of economy (GPDI) and financial market conditions (SP500), branded hotels still demonstrated smaller KPI volatility. The magnitudes and model fits are similar with the main model.
Conclusions, Managerial Implications, and Limitations
As with all research of this nature, this study is subject to limitations. Although our CBRE set of data containing revenue, expense, and profitability information for 20 years for over 4,000 hotels is the largest data set available for research of this type, our findings and conclusions must naturally be limited to the data we studied. It is notable that CBRE data focus on the 40 largest hotel markets in the United States. Thus, our findings may not be applicable to small towns and cities, nor to hotels or hotel markets located outside the United States.
Furthermore, we can only hypothesize regarding the reasons or mechanisms for the greater volatility reduction of branded hotels over independent ones. Previous research showed that while both branded and independent hotels performed well (i.e., generated comparable returns) during economic expansions, branded hotels outperformed independent ones during economic recessions, as previously discussed. Hotel guests may feel more comfortable staying in branded hotels during economic recessions, and a feeling of safety and security may translate to relatively higher occupancy, revenue, and profit for branded hotels during recessions, as well as overall greater stability in branded hotels’ long-term revenue and profit.
Future research in this area could provide a more complete and thorough understanding regarding the stability premium of branded hotels. For example, future research could investigate what brand factors determine the risk-reduction. In this study, we grouped all branded hotels into one category and compared them with independent hotels. Future study could investigate how brand dimensions such as brand size 4 and geographical distribution of affiliated properties affect risk reduction. Future research in the area of hospitality real estate could delve into the revenue and profit performance of branded versus independent hotels in small cities and towns, as well as in locations outside the United States. Furthermore, future studies in the area of hospitality consumer research could explore why hotel consumers may choose to patronize branded versus independent hotels during different phases of economic cycles. It is plausible, for example, that hotel brand standards are generally more stringent and proactive than any such requirements for the maintenance of the physical plant, services and staffing levels of independent hotels, and these brand standards result in branded hotels offering relatively higher quality accommodations during recessions (and possibly during other time periods, as well), and consumers tend to flock to quality. Hotel investors may similarly flock to quality.
In conclusion, based on a sample of over 4,000 hotels, our research illustrated that overall, branded hotels generate greater variability reduction, that is, more stable cash flows, than independent ones, with lower, long-term variances and SDs in both sales and profitability. These findings were significant after controlling for other important characteristics of the hotels in our sample. In addition, we analyzed annual returns and their stability at both the revenue and profit level, and we found that the level of stability of annual returns of branded hotels was greater for profit than for revenue. This finding was notable because profit (and the consistency of it) is ultimately the KPI of greatest importance to hotel investors. Furthermore, we showed these findings to be robust over several different recent time periods, ranging from 3 to 20 years. As the time periods we studied increased, the variability in annual returns of branded hotels decreased.
Our findings and conclusions are important to hospitality and real estate researchers because we found no prior work studying investment risk of branded versus independent hotels. Risk and return are critical elements of CRE research. While some earlier research has studied returns of branded versus independent hotels, as previously discussed, we found no studies comparing the levels of risk between these two important types of hotels.
For practitioners, our results are notable because prior research found that over the long term, the annual returns of branded hotels tended to be at least as strong, if not stronger than independent ones. From a theoretical standpoint, one may conclude, therefore, that branded hotels would be likely to carry greater risk in their annual returns given the tendency of riskier assets to produce greater returns. However, we find that the hotel types with generally stronger annual returns, that is, branded hotels, did not carry greater risk, but in fact, had lesser risk. Although such research may exist on a proprietary basis (probably involving a smaller sample, and possibly a much smaller sample than used in this study), we found no prior research studying this important dimension of risk. This conclusion is relevant to hotel investors in not only their decision-making processes regarding what hotels and what types of hotels to invest their capital but also in their valuations of prospective hotel investments because risk is central to CRE valuation analyses. This conclusion is also relevant to participants in the capital markets, such as hotel debt and equity providers, for example, financial institutions and private equity organizations, because capital markets typically reward not only overall returns, but smoothness in those returns, as well, that is, low risk.
Footnotes
Acknowledgements
We thank CBRE hotels and Smith Travel Research for providing data, Joshua Sheinberg for excellent research assistance.
Declaration of Conflicting Interests
The author(s) declared no potential conflicts of interest with respect to the research, authorship, or publication of this article.
Funding
The author(s) received no financial support for the research, authorship, or publication of this article.