
Abstract
Objective:
To (1) evaluate the use case for tunable lighting in inpatient behavioral health, (2) describe differences in staff lighting exposures between static and tunable lighting conditions using wearable sensors, and (3) document occupant lighting control usage patterns.
Background:
Tunable lighting fixtures can vary the amount of light and spectral content, so have been offered as a way to address light and health considerations. Before we can understand potential health benefits of tunable lighting, it is helpful to understand how occupant exposures under tunable lighting differ from those under more traditional lighting systems.
Methods:
Tunable lighting benefits and challenges for inpatient behavioral health were carefully detailed during design. Light exposure measurements were recorded at an old site with static fluorescent lighting and a new site with tunable light-emitting diode (LED) lighting. Behavioral health inpatient unit staff participants voluntarily wore a light measurement device to estimate light exposure. At the new site, controls usage data were recorded each time a button was pressed on a lighting control station.
Results:
While general observations can be made about the data between sites, there is notable variation at both sites depending on the day and hour. Button press data revealed that occupants used the full capability of the tunable lighting system to support different activities and needs.
Conclusion:
Understanding the relationship between occupant well-being and light requires a holistic research approach including thoughtful design accounting for real-world constraints, detailed measurement of light exposure, and understanding how occupants interact and make use of new technology.
Tunable lighting presents opportunities to improve the standard of inpatient behavioral health care that needs to be further explored in real-world settings. Tunable lighting fixtures can vary the intensity (amount of light) and spectral content of light and have been offered as a way to address light and health considerations by enabling more light during the day and dimmer, blue-depleted light at night. The guidance on the ideal light level, spectrum, and timing of these shifts in light is still limited, revealing the difficulty of translating existing research to lighting applications in support of occupant outcomes. Before we can begin to understand the potential benefits of tunable lighting, it is helpful to understand how tunable lighting differs from a more traditional static fluorescent lighting system. We aimed to (1) evaluate the use case for tunable lighting in inpatient behavioral health, (2) describe differences in staff light exposure between static and tunable lighting conditions using new wearable sensor technology, and (3) document occupant lighting control usage patterns. This is helpful feedback for designers and researchers seeking to use new lighting technology and approaches, including the potential value and challenges of using tunable lighting. As part of the broader study, staff survey data and patient outcomes were analyzed; however, these will be the focus of a separate report.
Background
Circadian rhythms are biological rhythms with a cycle of approximately 24 hr generated by the biological clock in the suprachiasmatic nucleus, which plays a role in regulating sleep–wake cycles along with peripheral clocks in tissues and organs (Vetter, 2018). Lewy et al. (1980) showed that light suppresses melatonin; however, it was not until 20 years later that the photoreceptors in the retina containing the photopigment melanopsin were identified as being primarily responsible for entraining circadian rhythms to environmental time (Berson et al., 2002; Hattar et al., 2002; Provencio et al., 2000). These photoreceptors are known as intrinsically photosensitive retinal ganglion cells.
The circadian system is sensitive to light in the short-wavelength region of the visible spectrum (Brainard et al., 2001; Thapan et al., 2001), commonly referred to as blue light. White light sources contain varying amounts of short-wavelength light depending on their spectral power distribution. For persons with normal sleep–wake cycles, melatonin decreases to a plasma concentration close to zero in the morning and increases in the evening, with a peak plasma concentration of 60 pg/mL (Rajaratnam & Arendt, 2001). More recently, researchers found that there can be a 50-fold difference in the suppression of melatonin in response to evening light between individuals (Phillips et al., 2019). Melatonin still rises and falls in the absence of light; the role of light is to keep the circadian system synchronized with the 24-hr day/night cycle (Czeisler et al., 1999).
Circadian disruption is a term often used to describe circadian misalignment resulting from external factors such as shift work; circadian desynchrony due to a disease or genetic factors; and social jetlag, which is the difference between sleep timing on work and free days (Vetter, 2018). Circadian disruption has been correlated with negative health impacts, including increased cancer rates (Dauchy et al., 2014), mental health disorders (Walker et al., 2020), and mood disorders (Bedrosian & Nelson, 2017; Monteleone & Maj, 2008). For persons predisposed to mental health disorders, circadian disruption may exacerbate the symptoms of mood disorder, and circadian rhythm resynchronization can improve these symptoms (Walker et al., 2020). Circadian and sleep disruption are common among inpatients, and the constant bright light common in hospitals may be disrupting patients’ circadian rhythms (Tan et al., 2019). Minimizing light at night, particularly short-wavelength light, may help synchronize circadian rhythms of behavioral health patients who experience disrupted sleeping patterns and possibly could be used to complement treatment such as electroconvulsive therapy (ECT). There is a lack of research exploring the effect of ECT treatment on the circadian rhythm (Lee, 2018), although Szuba and colleagues (1997) did find that ECT could restore a disrupted circadian rhythm.
Published research and case studies on behavioral health units have been constrained in their ability to characterize the lighting due to meter and technology limitations. Gbyl and colleagues (2016) compared patient outcomes based on the amount of daylight access in their rooms, finding a positive trend (not statistically significant) in reducing the severity of depression for patients assigned to rooms with more daylight. The patients with more daylight did have a statistically significant reduction in length of stay. The researchers took a limited set of measurements that did not include measurements at the eye of patient room occupants. Additionally, Wilkerson and colleagues (2017) studied a tunable lighting system installed in a behavioral health unit in a Seattle hospital; however, the lighting system documentation focused on horizontal measurements at task planes and the color characteristics of the light rather than vertical measurements of light at eye height. In the study presented in this article, new wearable technology was used to record staff exposure to light and new lighting system technology was used to record lighting use in patient rooms, communal areas, and staff spaces providing a more holistic understanding of staff exposure to light.
Project Description
The Boulder Community Health (BCH) Della Cava Family Medical Pavilion opened in April 2019 in Boulder, CO, the new site of the adult inpatient behavioral health unit (IBHU) along with outpatient behavioral health services. This Pavilion replaced an older facility that housed the same IBHU. The IBHU staff includes a psychiatrist, psychiatric mental health nurse practitioner, registered nurses, mental health workers, a unit therapist, case managers, and security. The majority of the staff on the unit are nursing staff. Depending on patient census, four to eight nursing staff are present on the unit during a shift. IBHU nursing staff work 8-hr shifts, detailed in Table 1. Nursing staff may be part time or full time, but shift type is permanent, not rotating.
Inpatient Behavioral Health Unit Nursing Staff Shifts.
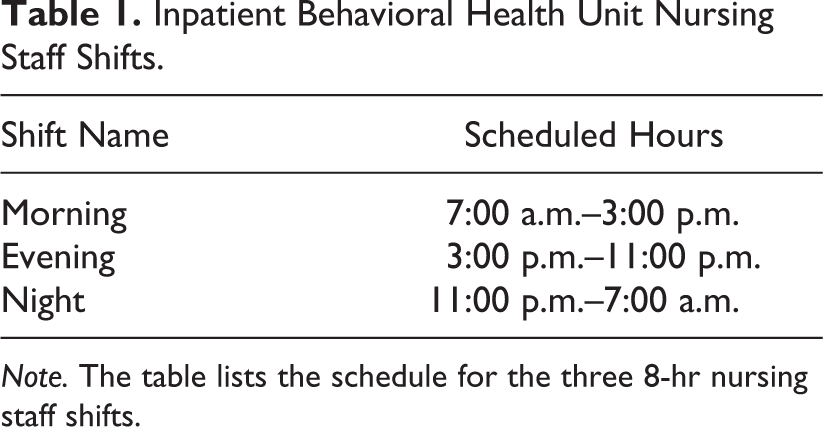
Note. The table lists the schedule for the three 8-hr nursing staff shifts.
Site Characteristics
The floor plans and characteristics of the old and new IBHU sites are compared in Figure 1. The IBHU staff serve adults from the surrounding community. The average patient stay is 6 days, although this can range from a few days to months. Although the new IBHU site has the same inpatient capacity as the old site, the new site has all private patient rooms, wider corridors, a central courtyard, and a larger dining area. Photographs of the old and new patient rooms are shown in Figure 2.
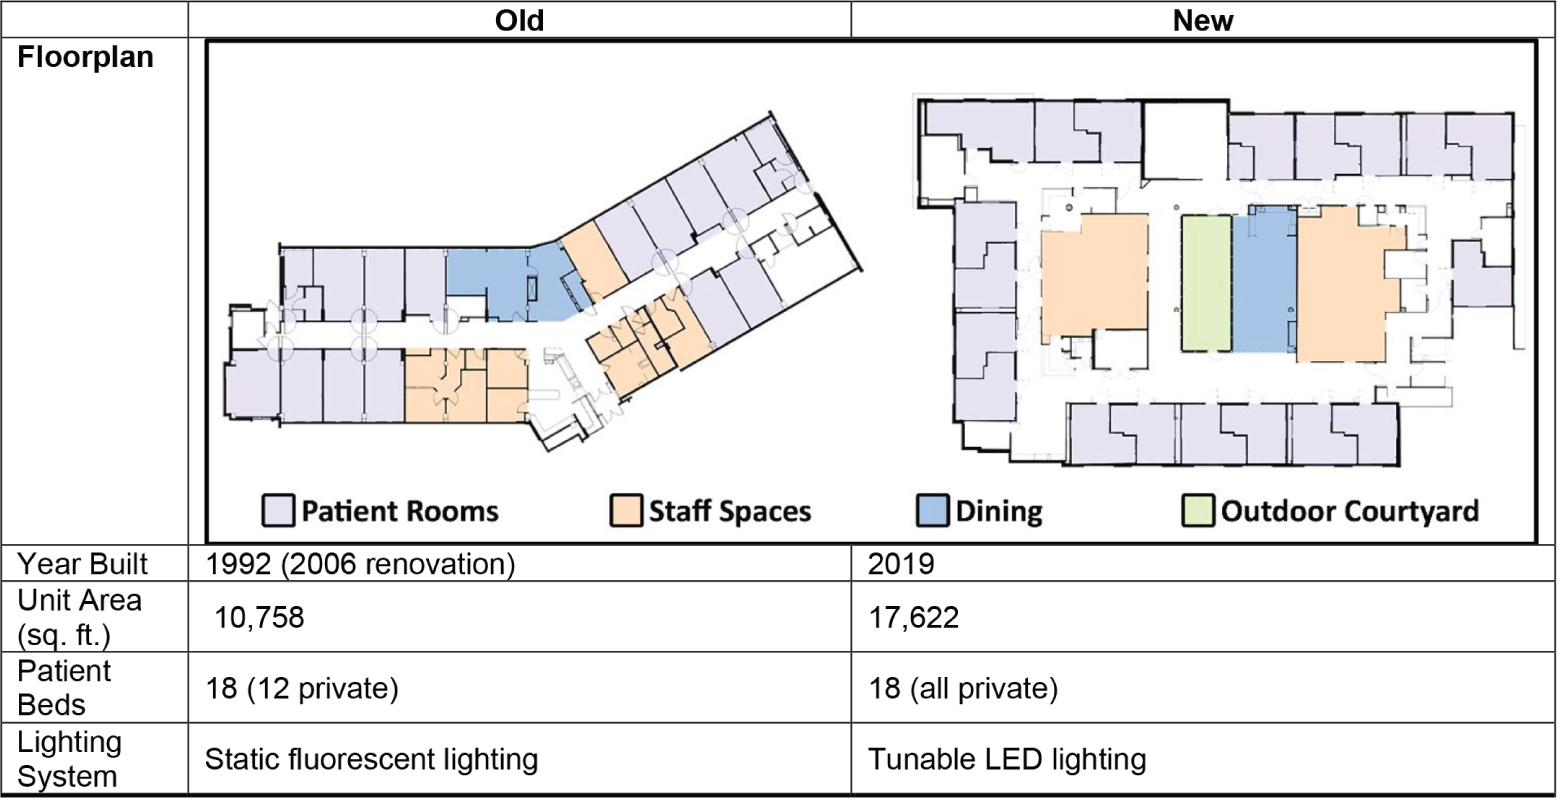
Old and new IBHU site floor plans and characteristics. The new IBHU site has the same bed capacity as the old site, but the new site is larger to provide more space for patient rooms, staff spaces, and community spaces. IBHU = inpatient behavioral health unit.
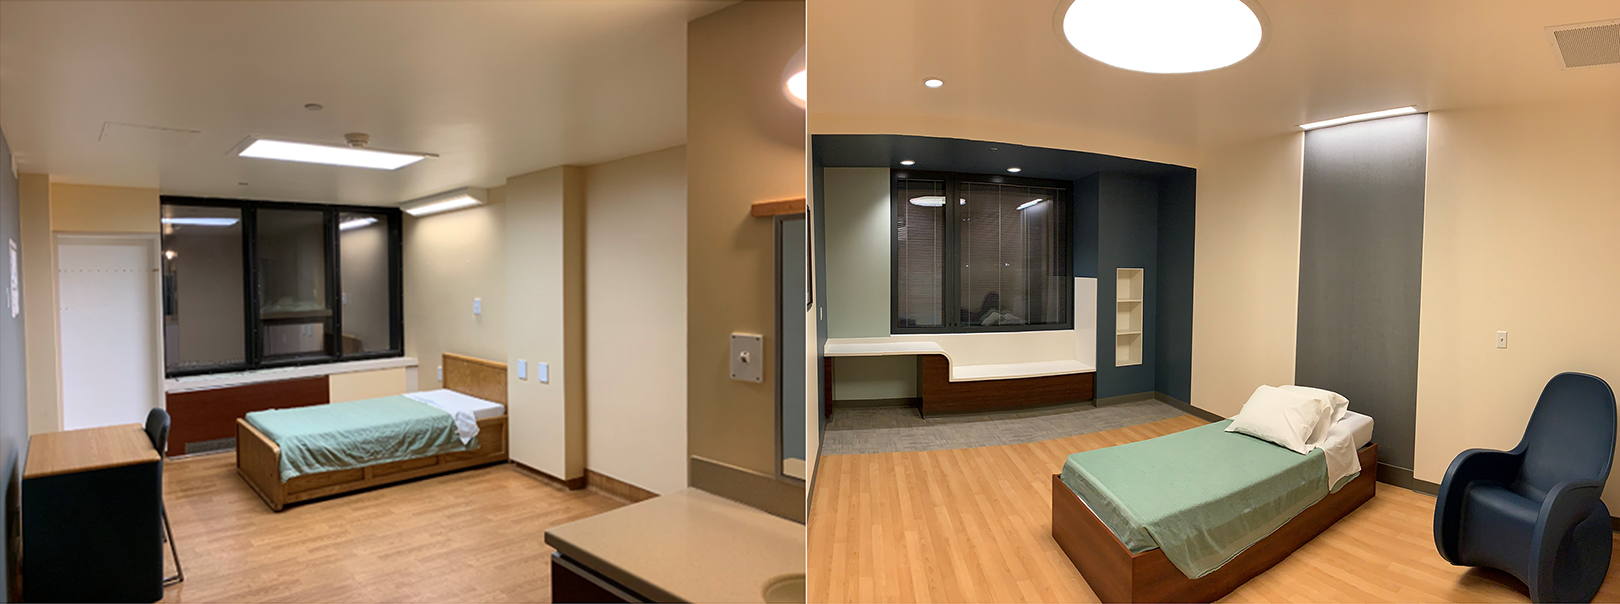
Photographs of patient rooms at old IBHU Site (left) and new IBHU site (right). The new patient room is more spacious and features tunable lighting, a built-in desk, artwork, and a bench near the window. Both old and new patient rooms have large windows with nice views of the surrounding landscape. IBHU = inpatient behavioral health unit.
Tunable Lighting System
During early design phases for the new IBHU site, the design team conducted goal setting simulation workshops with IBHU staff and BCH leadership to align the design of the new site, including the lighting system, with BCH’s target outcomes. After evaluating the use case for a tunable lighting system described in Aim #1, and Table 2, the team selected a Tunable Lighting system for the new IBHU site.
Project Design Goals Summary Table.
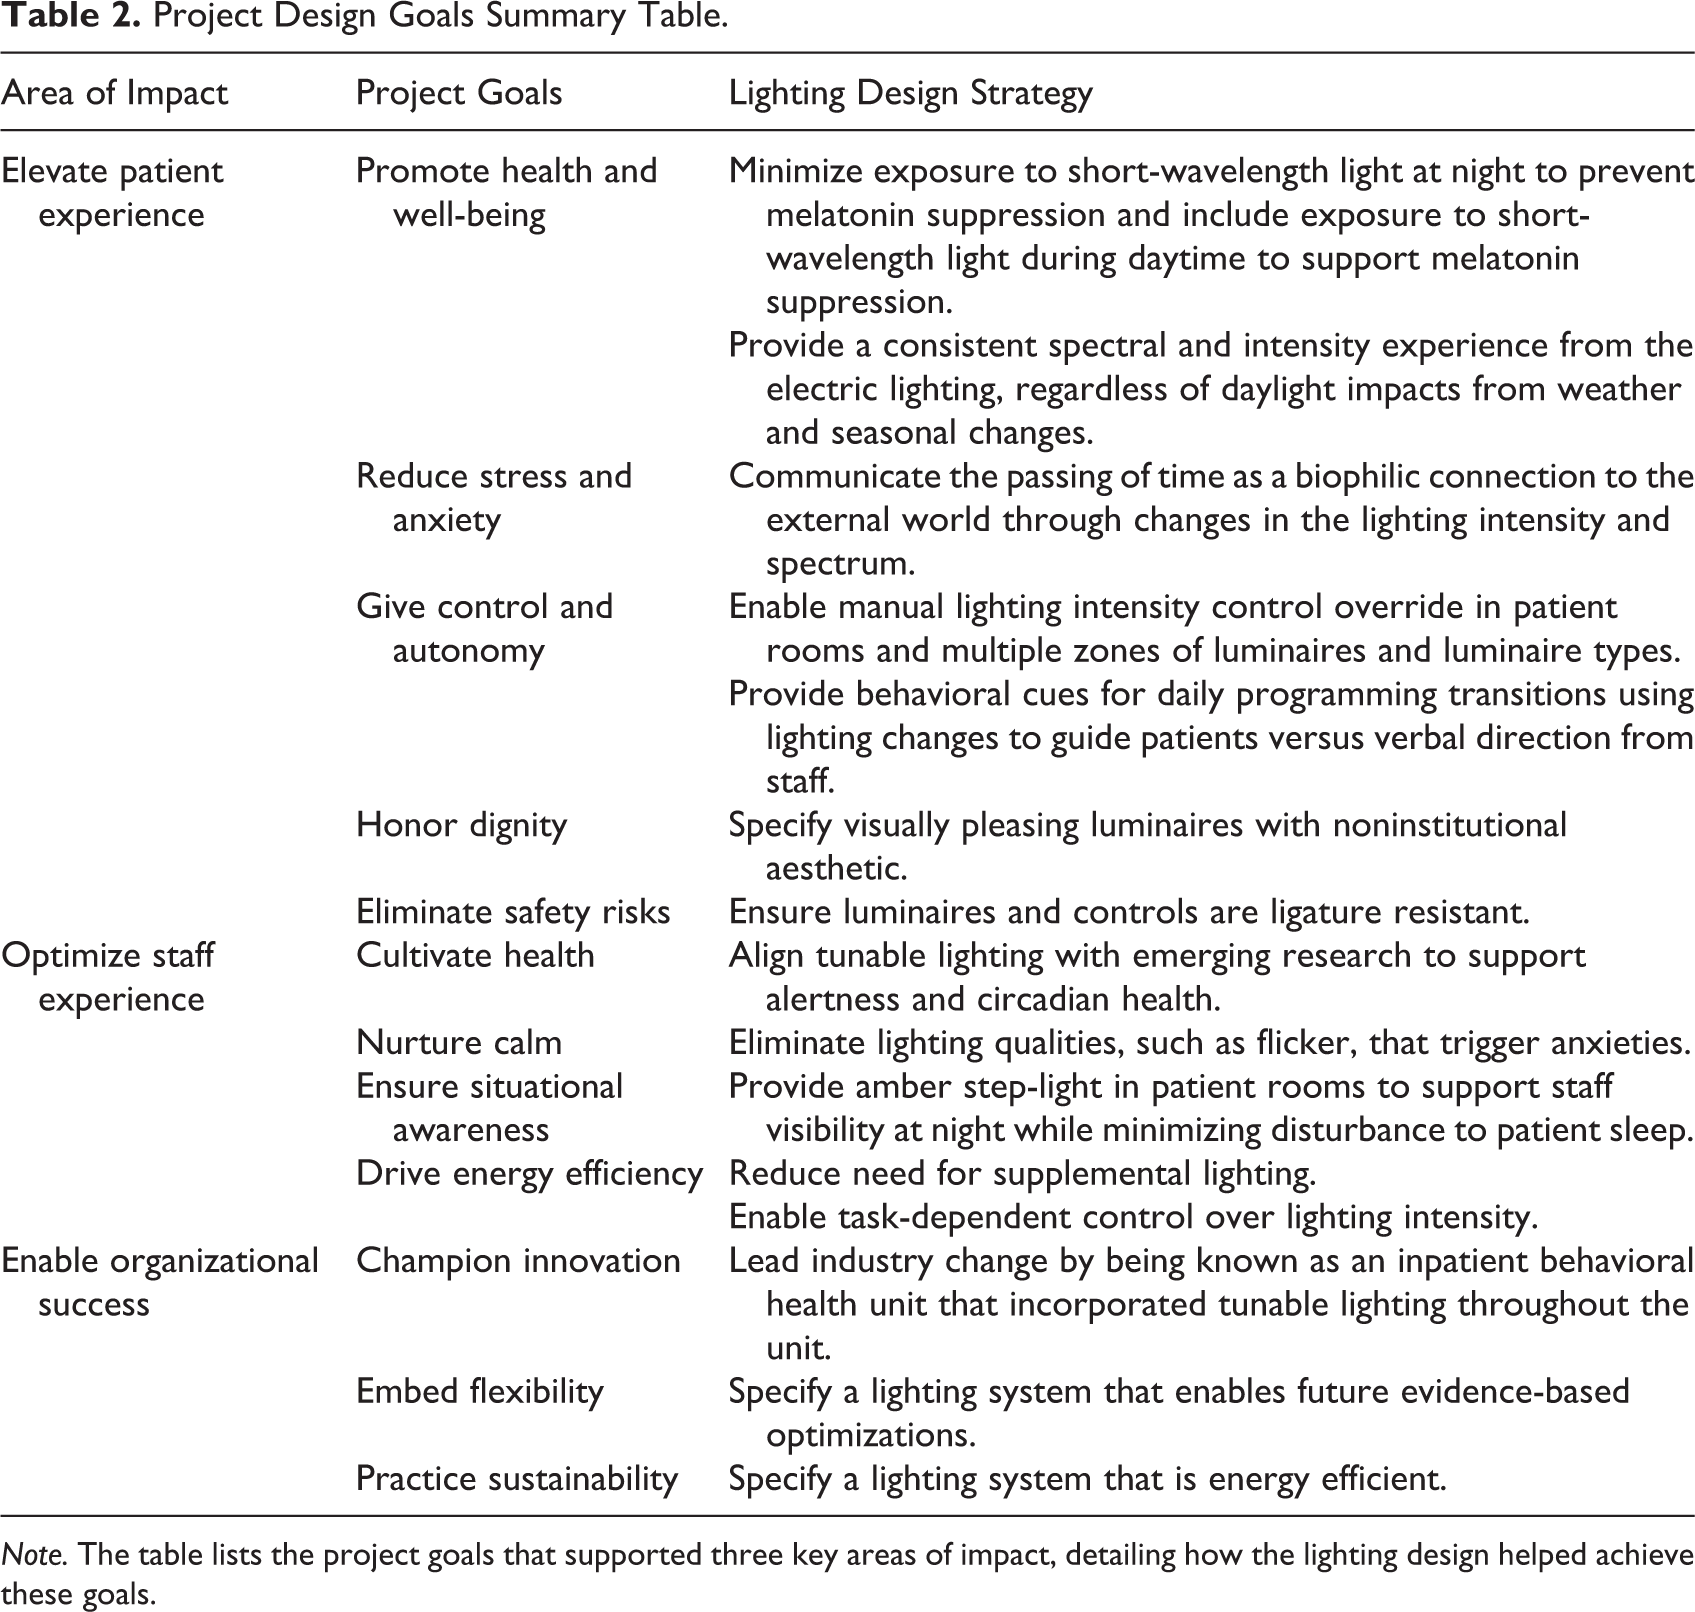
Note. The table lists the project goals that supported three key areas of impact, detailing how the lighting design helped achieve these goals.
Staff moved from the old IBHU site with static fluorescent lighting to the new IBHU site with a tunable light-emitting diode (LED) system that changed spectrum and intensity throughout the day according to a programmed sequence, with intensity override capability. The new IBHU site is the first known at the time of construction to incorporate tunable lighting throughout the unit, from common areas and staff offices to patient rooms and bathrooms.
The tunable lighting system consisted of approximately 30 different luminaire types from various manufacturers, with five different luminaire types in the patient rooms. The luminaires were chosen not only because of their anti-ligature and tunable characteristics but also because the correlated color temperature (CCT) range for all luminaires had to be aligned and all the luminaires needed to be able to communicate using the same control protocol. The design team worked with BCH to develop a lighting program that shifted in spectrum and intensity similar to that of daylight, along with specific transition times to align daily patient activities to support behavioral cueing. The team prioritized the importance of aligning the lighting program with the daily patient schedule, and not in response to changing hours of daylight over the year; thus, the electric lighting schedule did not change. Short-wavelength spectral content is minimized at night and increased during morning and midday as detailed in Figure 3. Transitions between each of the seven presets occur gradually over 5 min. Lighting controls in each space, including patient rooms, allow for light level adjustments and on/off.
Figure 3 illustrates the general lighting program scenes and changes in both intensity and CCT throughout the 24-hr day. While CCT conveys a very limited amount of information about the spectral content of a light source, it does provide a relative approximation of the amount of short-wavelength content, with higher CCTs (visually cooler) having more short-wavelength content than lower CCTs (visually warmer). The electric lighting schedule did not vary by season, to maintain alignment of lighting system with IBHU daily activities.
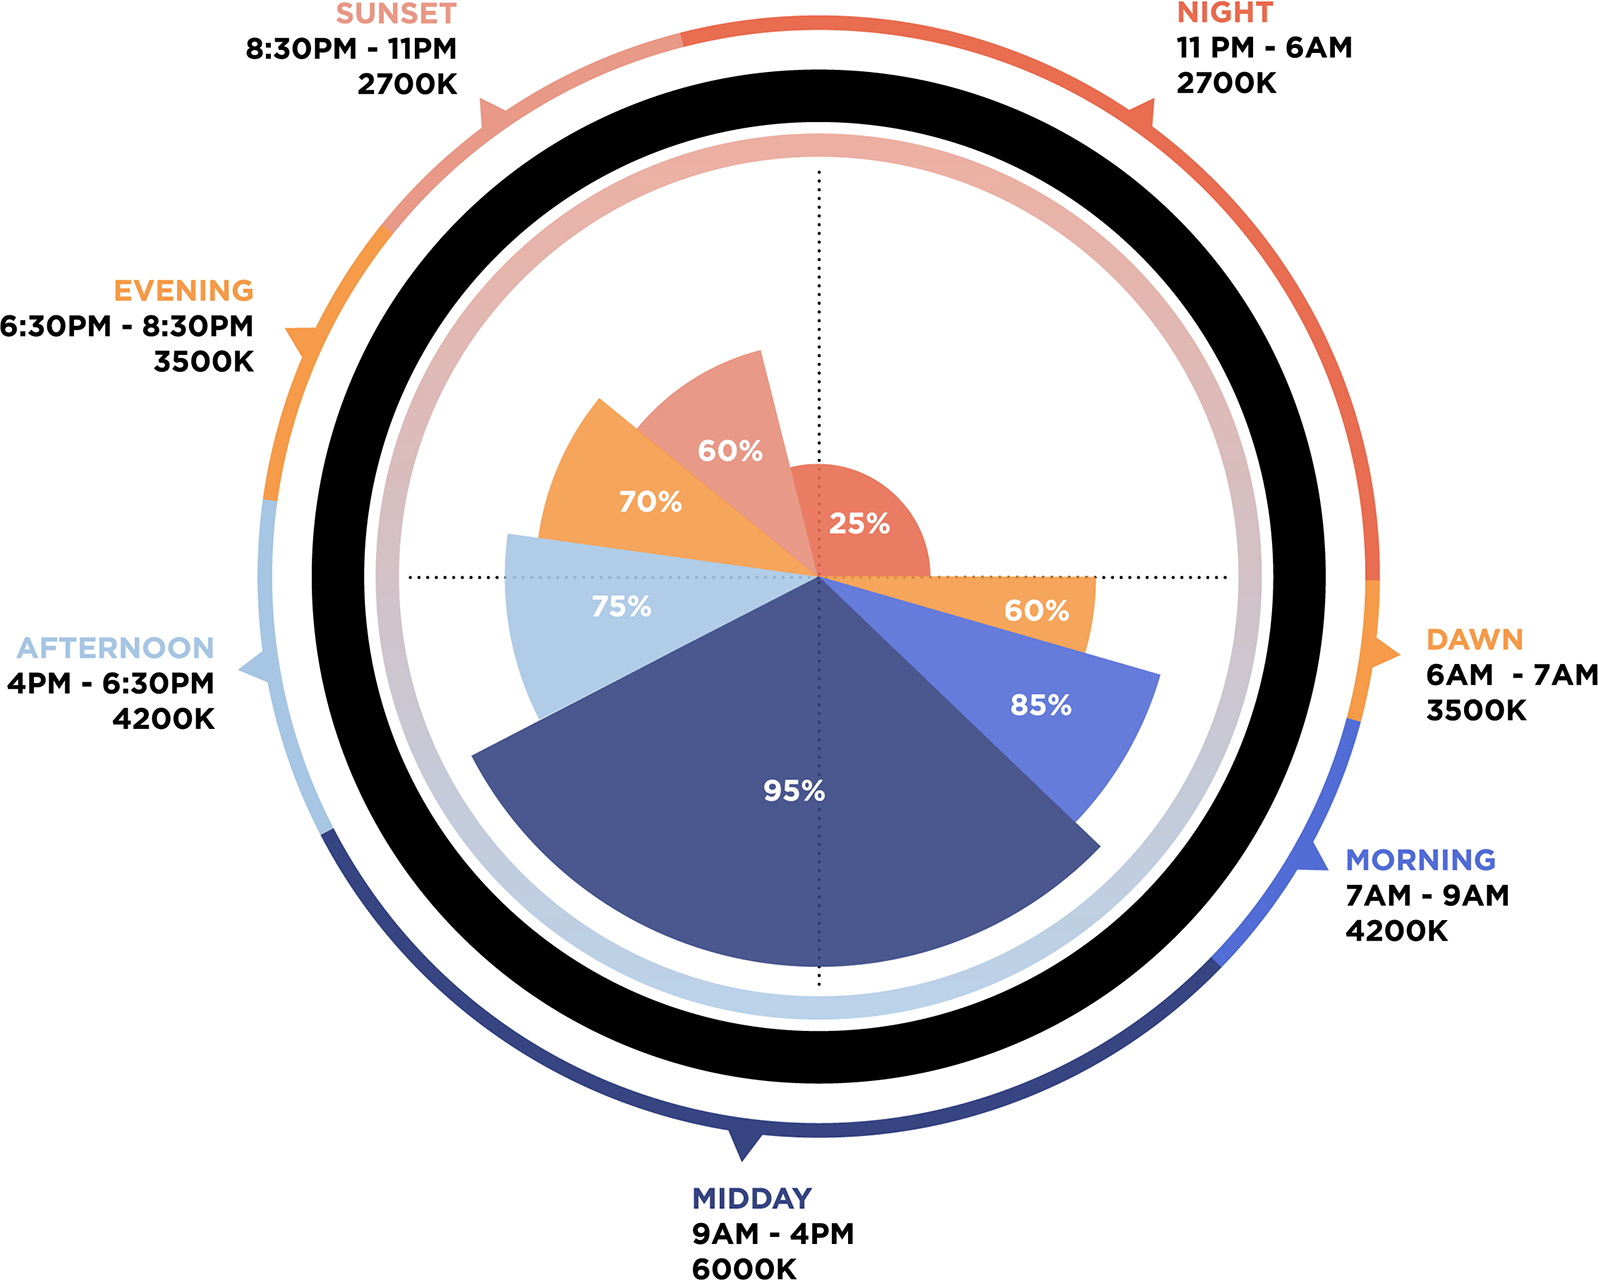
Schematic of the 24-hr automated lighting program at new IBHU site. The intensity of the light varies throughout the 24-hr day, as indicated by the distance from the center of the circle, ranging from 25% at night to 95% during midday. The CCT of the light also shifts from 2,700 K (visually warmer) to 6,000 K (visually cooler), indicated by the color of the wedges. The lighting program for the new IBHU site was developed by Boulder Associates and informed by ZGF Architects’ program for Swedish Health Services (detailed by Wilkerson et al., 2017). IBHU = inpatient behavioral health unit; CCT = correlated color temperature.
Project and Evaluation Timeline
As part of the evaluation of the new tunable lighting system, lighting data from both sites were collected along with occupant light usage patterns at the new IBHU site. This provided an opportunity to explore the use of new technology to collect data, including wearable devices to record light exposure and the lighting controls data to identify lighting usage patterns.
The collection of lighting data from the wearables occurred in three distinct phases, as shown in Figure 4. The first phase occurred in the old IBHU site over 7 days in December 2018. To minimize confounds associated with the new design itself, the research team obtained permission to set the lighting in the new IBHU site at a static 3,500 K CCT throughout the day for the first 3 months of occupancy, still allowing for manual dimming; this was planned as the second phase. Some stationary measurements with the wearables were recorded at fixed points in the unit prior to occupancy with the same lighting as the second phase. The lighting program was then intended to be switched to the tunable lighting mode during a third phase, following the automated lighting program in Figure 3. The goal was to be able to compare static and tunable lighting in the new unit to better understand the effects of the tunable lighting system, limiting the confounding factors associated with moving into a completely new site.
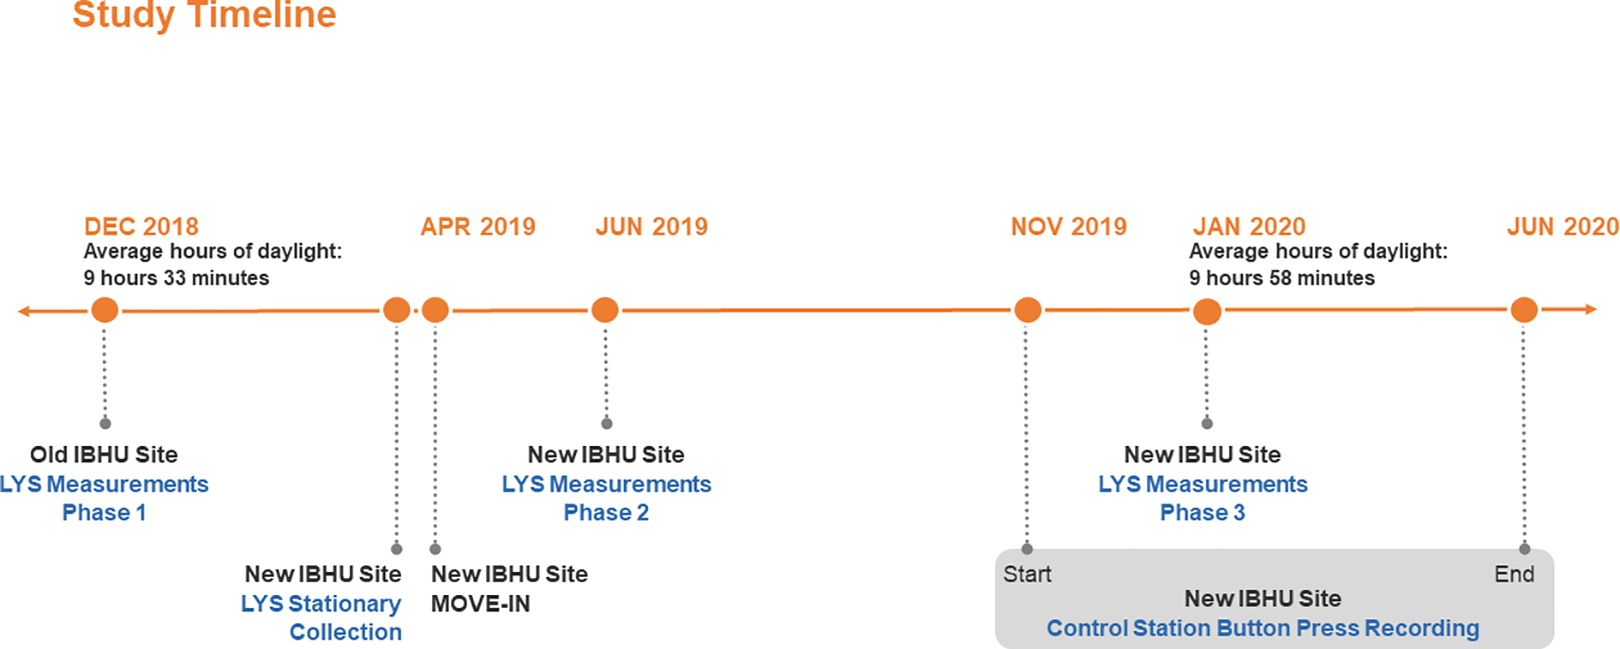
IBHU LYS and Control Station Data Collection Timeline. The first phase of data collection using the LYS wearable devices was in December 2018, and data collection occurred again in June 2019 and January 2020. Recording of control station button presses at the new IBHU site began in November 2019 and ended in June 2020. IBHU = inpatient behavioral health unit.
The IBHU staff moved to the new site in early April 2019, and unfortunately in late May there was a technical error with the lighting control system, causing the tunable lighting system to be partially initiated. This issue was unknown to the researchers until halfway through the June 2019 Phase 2 data collection. As a result, the June 2019 data reflected a period of some unintended variation in intensity and CCT and this data was excluded from analysis. After recommissioning the lighting system in July 2019, the tunable variation was activated according to the planned automatic lighting program, with varying intensity and CCT throughout the day. The final data collection took place in January 2020, approximately 1 year after the first collection. This final phase had nearly the same average hours of daylight (9 hr, 58 min) as the first phase in December 2018 (9 hr, 33 min).
Aim #1: Evaluate the use case for tunable lighting in inpatient behavioral health
Design Goals and Challenges
The vision for the new site was to advance the standard of care in adult behavioral health from an environment strictly focused on harm reduction to one that is supportive, healing, and therapeutic. The design team worked closely with the IBHU staff to develop the design strategy for the new IBHU site. Project design goals were informed by behavioral health design recommendations (Shepley, 2017) and were organized around three areas of impact: patient experience, staff experience, and organizational success. While working through these areas of impact, the team realized the greater extent to which the lighting design could support key project goals using a tunable lighting system, compared to a static lighting system, as summarized in Table 2.
Lighting for Patient Experience
A key driver for the project was to support patient health and recovery. The tunable lighting system was automated to vary in spectrum throughout the 24-hr day to support patient circadian entrainment, minimize short-wavelength light at night, and increase exposure to short-wavelength light during the day. To honor the dignity of the patients, the design team sought to create a home-like environment, avoiding design elements that had an institutional aesthetic to the extent possible. Everything at the IBHU site needed to be anti-ligature, requiring the design team to spend considerable time working with manufacturers to identify luminaires that were tunable, anti-ligature, and noninstitutional in appearance.
To elevate the patient experience through reduced stress and anxiety, the design team proposed that the tunable lighting system would help communicate the passing of time through visual changes in the lighting and foster a connection to the external world. Changes in lighting throughout the day that mimic changes in the natural environment can provide a visual cue to the time of day. Daylighting from large windows, similar in size to the windows at the old site and with similar views to the surrounding landscape, was provided in the patient rooms and community spaces. A key difference is that the new site also included the addition of an outdoor courtyard at the center of the floor plate, with floor-to-ceiling glazing, providing a more proximal connection to natural daily and seasonal changes. The secured courtyard is accessible to patients on a privilege basis, providing access to higher light levels.
To support patient control and autonomy, patients had control over the intensity of light in their rooms, including three separate zones of light in the patient room and two zones of light in the patient room bathroom. Perceptible shifts in intensity and spectrum can also act as behavior cues for task-shifting, such as moving from active to quiet times, when synced with IBHU programming. The team proposed that the automatic changes in the tunable lighting would act as behavioral cues guiding patients to transition activities in their daily programming versus relying solely on verbal direction from staff.
Lighting for Staff Experience
Similar to goals aimed at supporting patient circadian health, a key project aim was to cultivate staff health and well-being. Tunable lighting was installed in all staff areas and included controls for staff to adjust the intensity of light, while the spectrum was set by the automated lighting program. In addition, to nurture calm and mitigate stress caused by visual aspects of lighting such as glare, the design team carefully considered luminaire optical control of the light and how the light was distributed throughout the space, prioritizing visual comfort. The flexibility of the tunable lighting allowed for varying light levels in different spaces based on divergent occupant needs, supporting staff tasks such as patient checks while maintaining a dark environment for patient sleeping. Moreover, override controls allowed individual staff to change light levels in support of task-dependent lighting at any time.
Organizational Success
Broader organizational goals were also key to the lighting design. BCH sought to continue to champion innovation with this project by being an early adopter of incorporating tunable lighting throughout the entire unit, from staff spaces to patient bathrooms. BCH also sought to embed flexibility in the new IBHU site, and tunable lighting provided the ultimate flexibility to meet current needs while allowing for future adjustments and evidence-based optimizations of the lighting system. As research continues to emerge and inform best practice, the spectrum, intensity, and timing of the unit’s lighting program can be adjusted. It can also be adjusted if there are any major changes to the scheduling of the unit so that it continues to align with daily programming. Sustainability is also important to BCH. In 2003, BCH was the first hospital in the United States to attain Leadership in Energy and Environmental Design certification, and in this case, the use of an LED system with dimming aligned with their sustainability and efficiency goals.
Aim #2: Lighting Characterization
There is a growing body of research wherein wearables are used to collect data related to health performance indicators and indoor environmental quality in field studies (Abboushi et al., 2022). Wearable devices make it possible to continuously monitor environmental conditions, like illuminance or light source spectrum, experienced by a large number of individual participants as they move throughout a space and can be used to document personal light exposure (Peeters et al., 2020). For this study, staff participants voluntarily wore a light measurement device developed by LYS Technologies on their shirt collar for the duration of their shift to roughly estimate occupant light exposure. The LYS contains three visible light sensors (red, green, blue [RGB]), an infrared sensor, and an actigraphy sensor. Light measurements were recorded with the LYS wearables during all three collection phases and were also recorded in stationary positions before the patients moved to the new site. During the stationary measurements, LYS wearables were mounted vertically at eye level at six fixed locations in the new unit, as shown in Figure 5. These stationary measurements were recorded for 41.5 hr over the weekend after commissioning and before move-in from Friday, March 29, 2019, at 7:30 p.m. through Sunday, March 31 at 1:00 p.m., capturing the automatic transitions of the new lighting program while the site was still unoccupied. The average illuminance and CCT values for these stationary measurements are plotted in Figure 6.
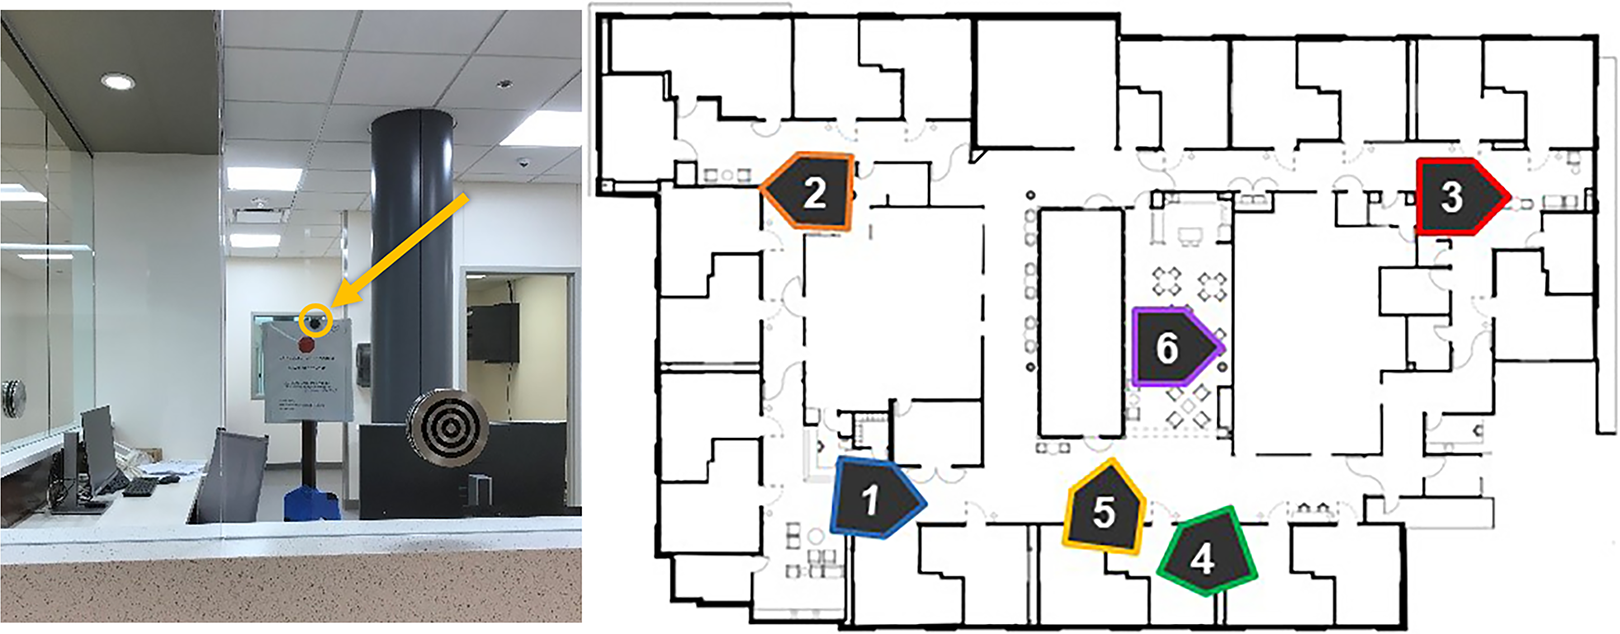
Placement of LYS light measurement devices prior to occupancy of new IBHU site. The photo shows the LYS wearable device mounted vertically at standing eye height at the nurse station desk behind the glass partition (Location 2). Numbered arrows on the new IBHU site floor plan show roughly where and in what direction LYS devices were placed to capture stationary measurements of the lighting conditions prior to occupancy. IBHU = inpatient behavioral health unit.
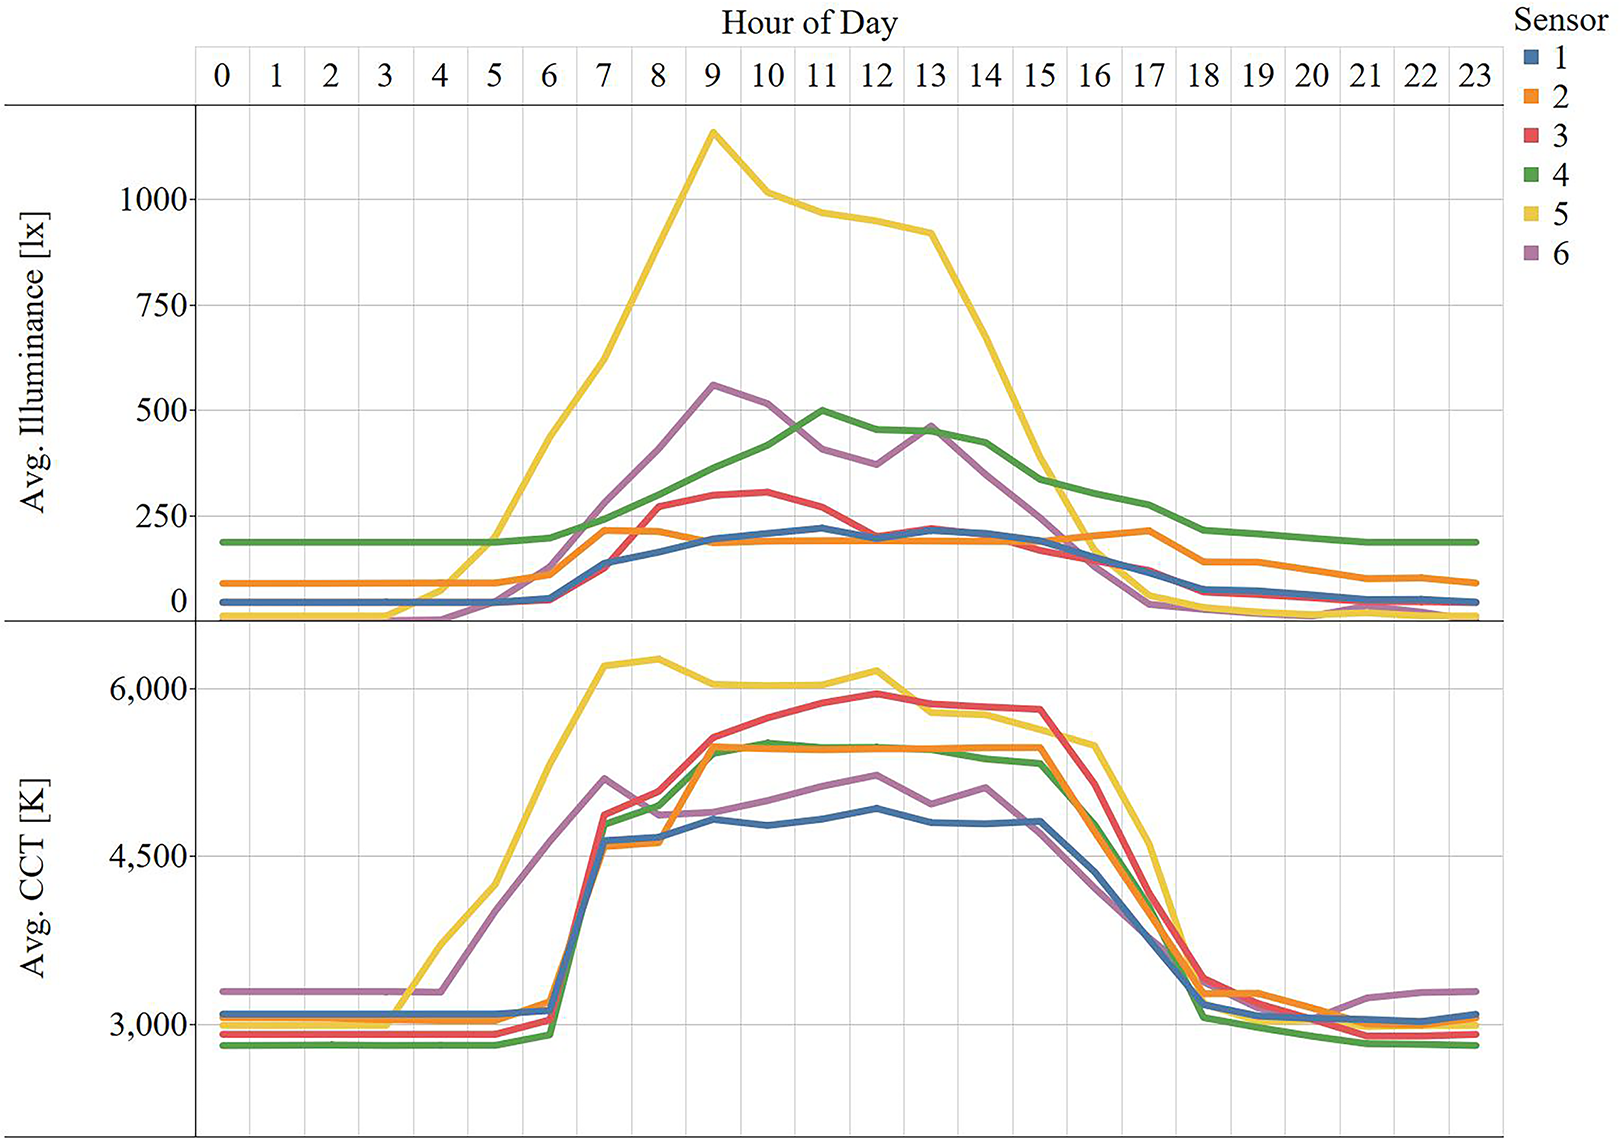
LYS Stationary Vertical Illuminance and Correlated Color Temperature Measurements. Average illuminance (top) and CCT (bottom) captured for 40.5 hours are plotted per hour for each sensor location shown in Figure 5. CCT = correlated color temperature.
At the old and new IBHU sites, eight LYS wearable devices were made available for the clinical staff to voluntarily wear throughout their shift over a 7-day period during each data collection phase. Staff were invited to participate via email. To maintain anonymity, devices were not assigned to staff and the data collected was not traceable to any individual. Day and evening shifts had a maximum of eight participating staff members and the night shift had a maximum of four. Staff were instructed to pick up an LYS from the charging station at the beginning of the shift and attach it to their shirt collar, facing away from their body. At the end of their shift, staff were instructed to return the LYS to the charging station in the staff meeting room. Participants were instructed to remove wearables when leaving the facility to go outside. Measurements greater than 7,000 lux were removed from the analyzable dataset.
Data from the five sensors within each LYS device were recorded in 15-second intervals across each 7-day data collection phase. Measurements recorded while the device was charging were excluded from the analysis. Initially, this exclusion was determined by using movement as an indicator that the sensor was stationary and therefore could be assumed to be on the charger. Movement was measured by the actigraphy sensor as a count of the number of times the acceleration exceeded 0.1875 g (g = gravitational force) in any of the three axes. A movement sensitivity threshold of less than five units/hour was set after pilot testing the LYS actigraphy measurements during common activities ranging from table bumps and sustained sitting to slow and fast walking. Because some actigraphy sensors were found to be not registering movement during Phase 2, a second exclusion parameter was developed for all data. When variation across all lighting sensors was less 1% per hour, devices were assumed to be located at the charging station, excluding known programmed changes to the lighting system. To make data cleaning easier, the chargers were placed inside a black cardboard box during the Phase 3 collection so that light level could be more easily used to flag instances when the LYS device was not in use.
Additional data cleaning was necessary to remove impractical values based on the observed limits of the LYS wearables. The limits were based on comparing measurements of the LYS device to a calibrated spectrometer in a variety of lighting conditions, including daylight and electric light, along with measurements recorded at the IBHU sites with a calibrated spectrometer. For example, illuminance measurements that were less than 0 lux or greater than 6,999 lux were flagged as outliers and removed. Similar cleaning was applied to the CCT values and RGB values, with the criteria and number of measurements removed listed in Table 3. After cleaning, the dataset included 104,126 measurements for the old site and 87,915 for the new site. Since about half the number of staff work night shift compared to evening and day shifts, there is less data during the nighttime hours, as shown in Figure 7.
LYS Data Cleaning Summary.
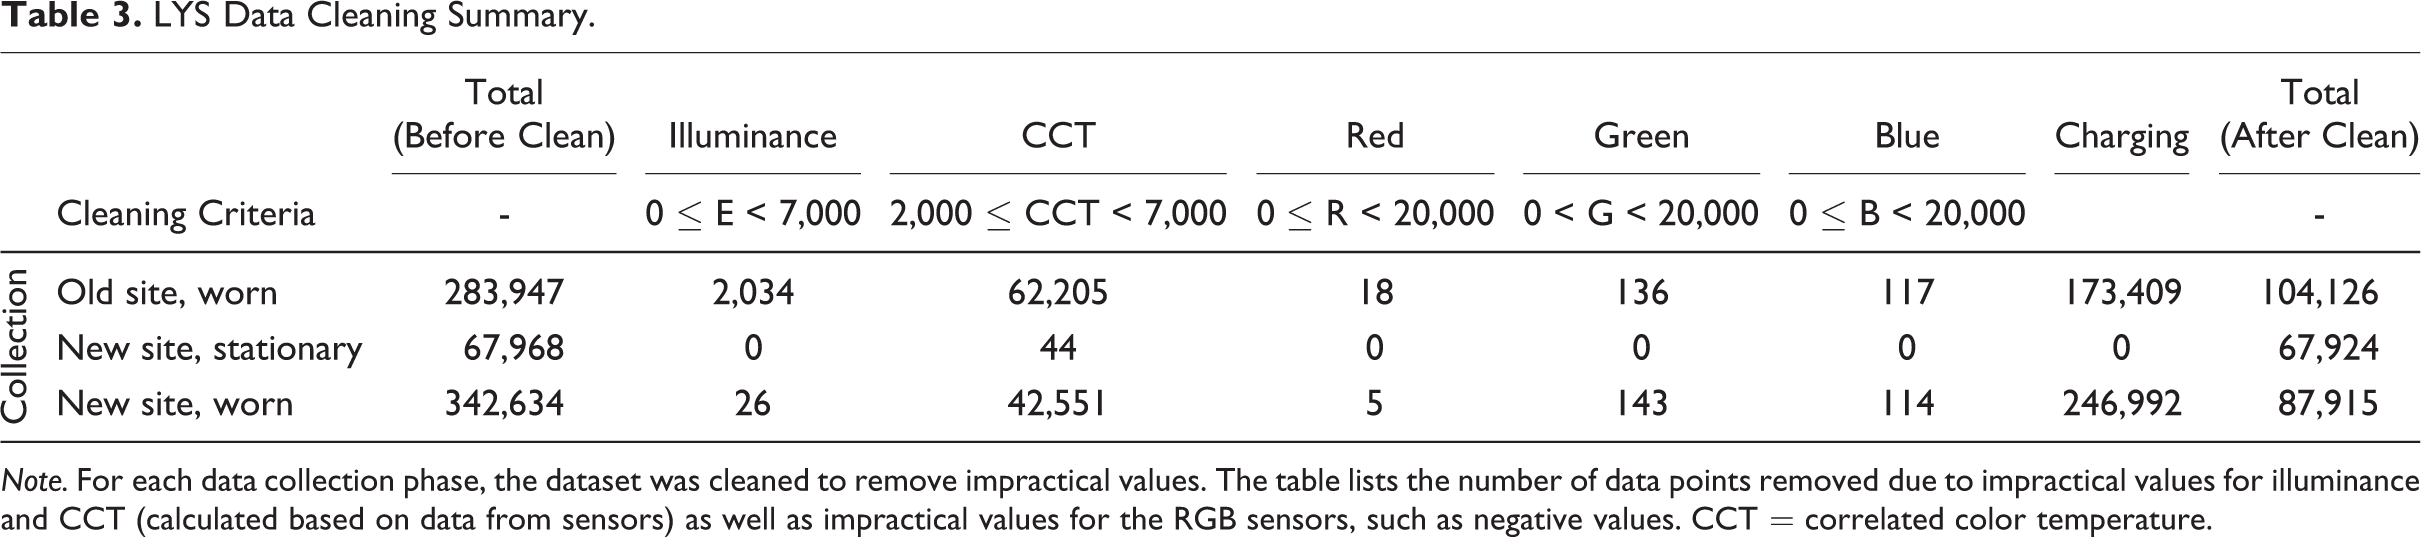
Note. For each data collection phase, the dataset was cleaned to remove impractical values. The table lists the number of data points removed due to impractical values for illuminance and CCT (calculated based on data from sensors) as well as impractical values for the RGB sensors, such as negative values. CCT = correlated color temperature.
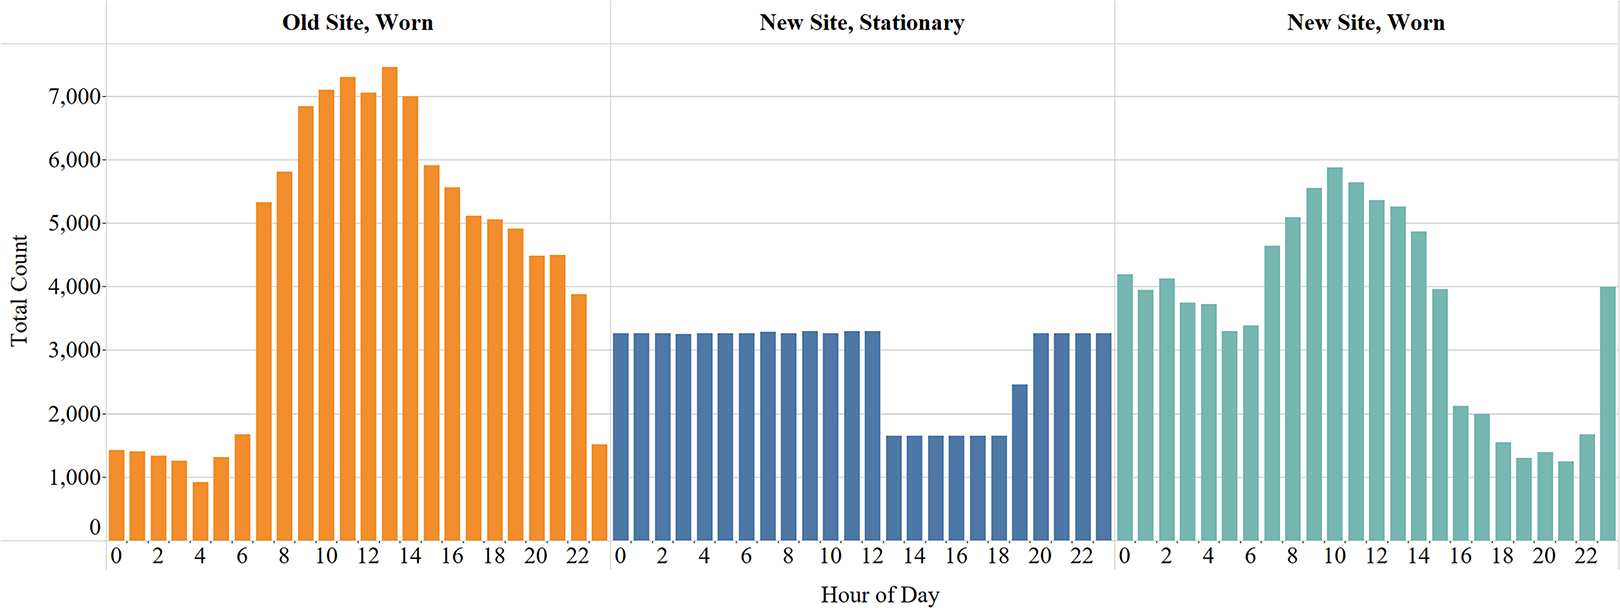
Number of measurements per hour during each data collection phase. The chart shows the total number of measurements analyzed per hour after the data were cleaned to remove impractical values.
While the accuracy of the LYS measurements is limited compared to a calibrated spectrometer, the amount of data collected with the LYS is currently impossible to collect with a traditional calibrated spectrometer, and the measures are still useful for general observations about relative differences in lighting exposure between the new and old IBHU sites. Figure 8 summarizes the illuminance recorded while staff were wearing the LYS devices at the old and new IBHU sites. Vertical illuminance levels at the old IBHU site were generally higher than those recorded at the new IBHU site; however, at 7 a.m. both units saw a notable increase in vertical illuminance during the daytime hours compared to nighttime hours. Additionally, at the old IBHU site, half of the fluorescent luminaires in the hallways were typically turned off manually at night. This did decrease the overall average light level for staff exposure; however, the amount of light entering an individual patient room at night would vary depending on whether the luminaire closest to the patient room remained off or on. At the new IBHU site, all luminaires could be dimmed, resulting in a uniform decrease in the light level at night. Nurse station luminaires were programmed to have greater intensity compared to the general setting during the night shift.
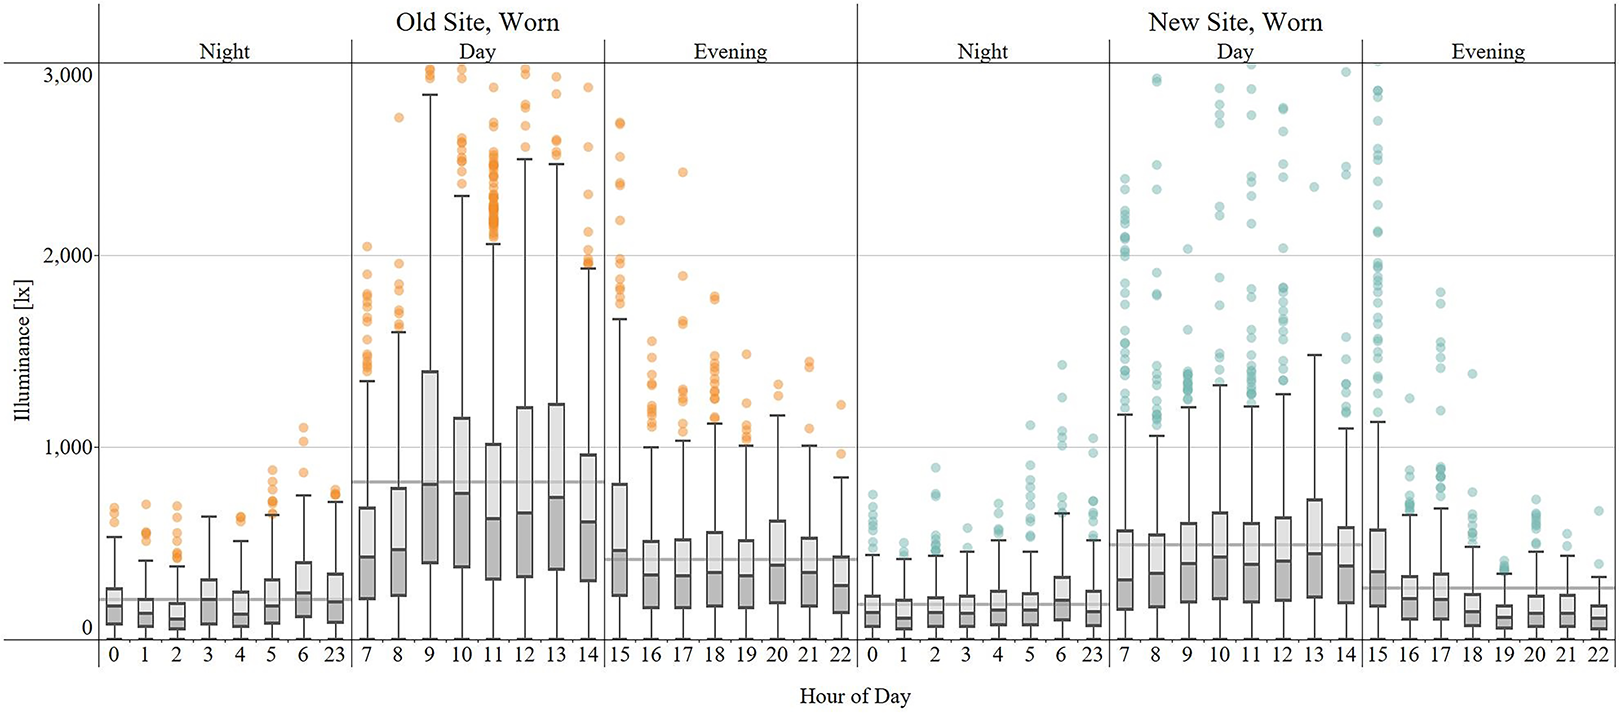
LYS vertical illuminance measurements at new and old IBHU sites. Solid grey line indicates the average vertical illuminance recorded per unit. The center line of each box corresponds to the median value, with the extents of the box corresponding to the upper and lower quartiles. The whiskers indicate the datapoints that are 1.5 times within the interquartile range, with outliers displayed as individual datapoints outside of these whiskers. IBHU = inpatient behavioral health unit.
Figure 9 summarizes the CCT recorded at the two sites. The data from the old IBHU reflects the static nature of the fluorescent lighting system, with very little variation in CCT throughout the day. At the new IBHU site, there is greater variability of CCT, particularly between the daytime and nighttime hours. The programmed changes in the tunable lighting schedule are visible in the relative changes in CCT. This is particularly true for shifts to higher CCTs occurring at 7 a.m. and at 9 a.m. that last until 4:00 p.m., when the lighting system is programmed to return to lower CCTs. Evening and night shift exposures between hour 23 (11:00 pm) and 6 (6:00 am) do not drop to the programmed 2,700 K. While downlights at the nurse station zone were programmed to have greater intensity than the general setting, the spectrum was constant throughout the unit at 2,700 K. This effect may be the result of exposure to light from sources such as the computer monitor.
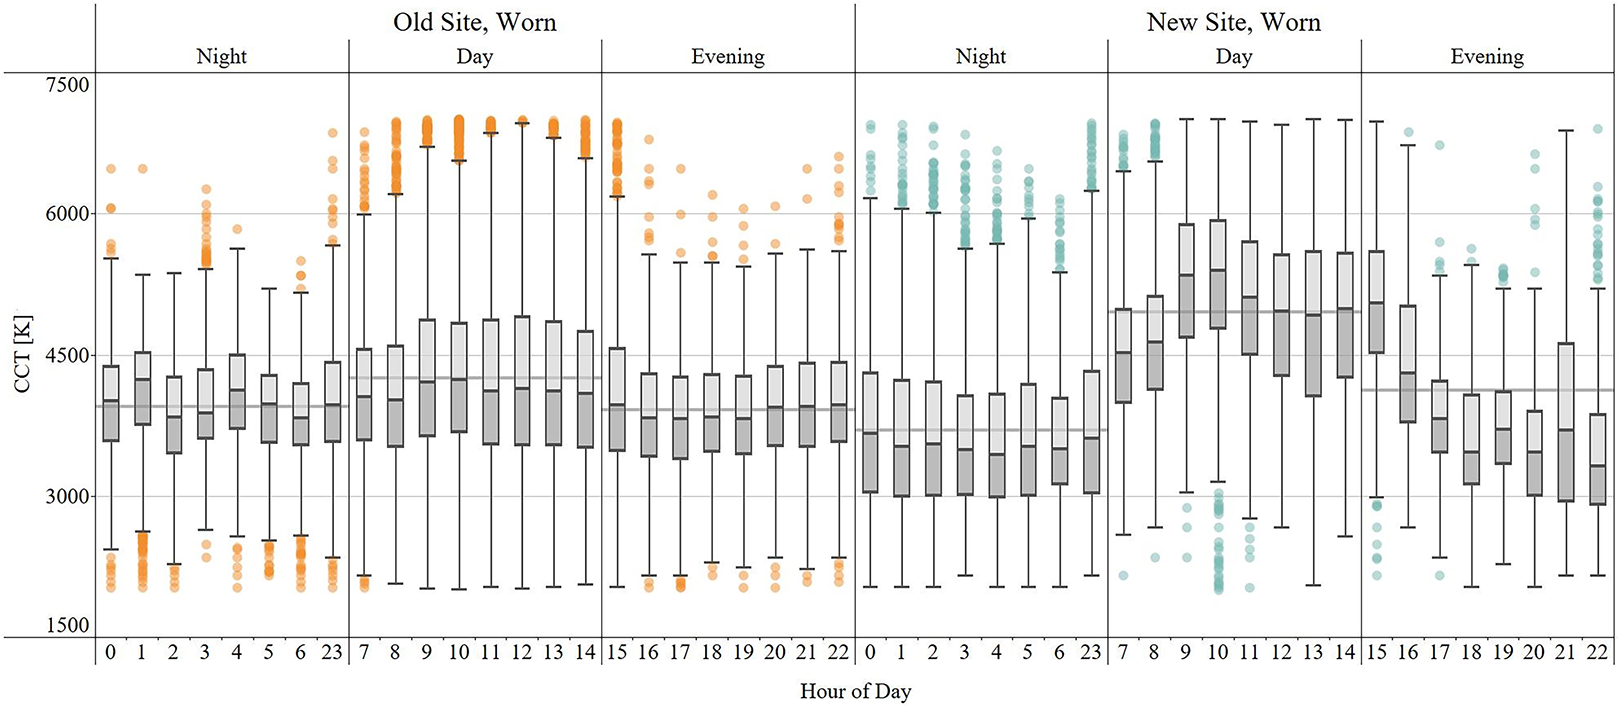
LYS correlated color temperature measurements at new and old IBHU sites. Solid grey line indicates the average CCT recorded per unit. The center line of each box corresponds to the median value, with the extents of the box corresponding to the upper and lower quartiles. The whiskers indicate the datapoints that are 1.5 times within the interquartile range, with outliers displayed as individual datapoints outside of these whiskers. IBHU = inpatient behavioral health unit; CCT = correlated color temperature.
Figure 10 shows the variation in CCT recorded by one LYS device worn during two shifts compared to measurements recorded at a fixed location at the new IBHU site (Location 2 in Figure 5). The fixed measurements show little variation over time, making it easier to detect scheduled changes in CCT. Measurements captured while the LYS is worn are much more variable, with abrupt shifts in CCT between measurements recorded within minutes or seconds of each other. The variation highlights the value of using wearable LYS devices instead of stationary devices to capture light exposure for individuals as they move in the built environment.
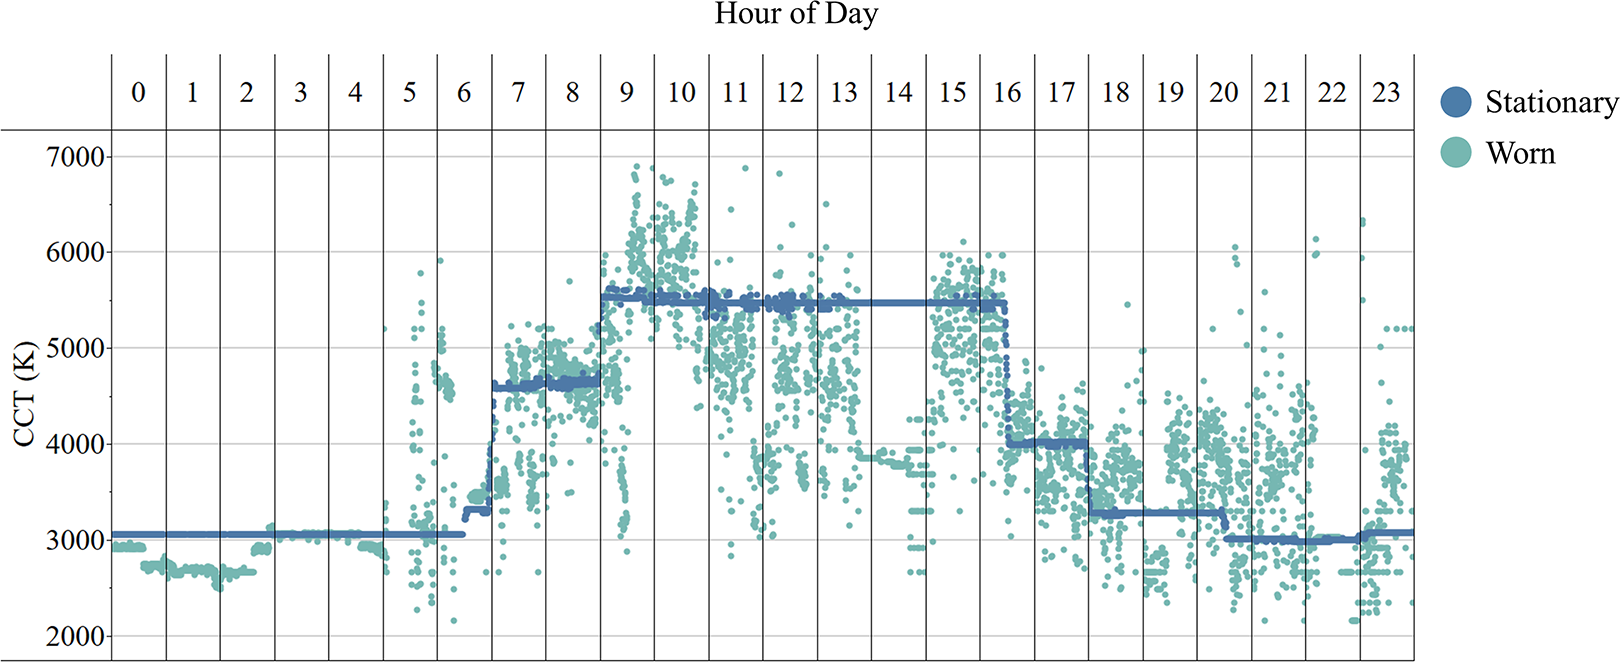
Comparison of LYS CCT measurements recorded at new IBHU site: Worn and Stationary. The plot shows the LYS CCT data collected from an LYS device during the stationary phase (blue) and data from one LYS device worn during a night and day shift (green). The stationary data were recorded by the LYS device located at a nurse station. IBHU = inpatient behavioral health unit; CCT = correlated color temperature.
The variation in the data collected while the LYS devices were worn by staff is also illustrated in Figure 11, with average illuminance and CCT measurements shown for each instance an LYS device was worn during a day shift. Each row represents the measurements recorded by one LYS device for one shift, with averages for each hour of the shift indicated with a color gradient. While general observations can be made about the data captured between sites, including higher CCTs and lower illuminance levels at the new IBHU site compared to the old site, there is notable variation at both sites between average values depending on the day and hour.
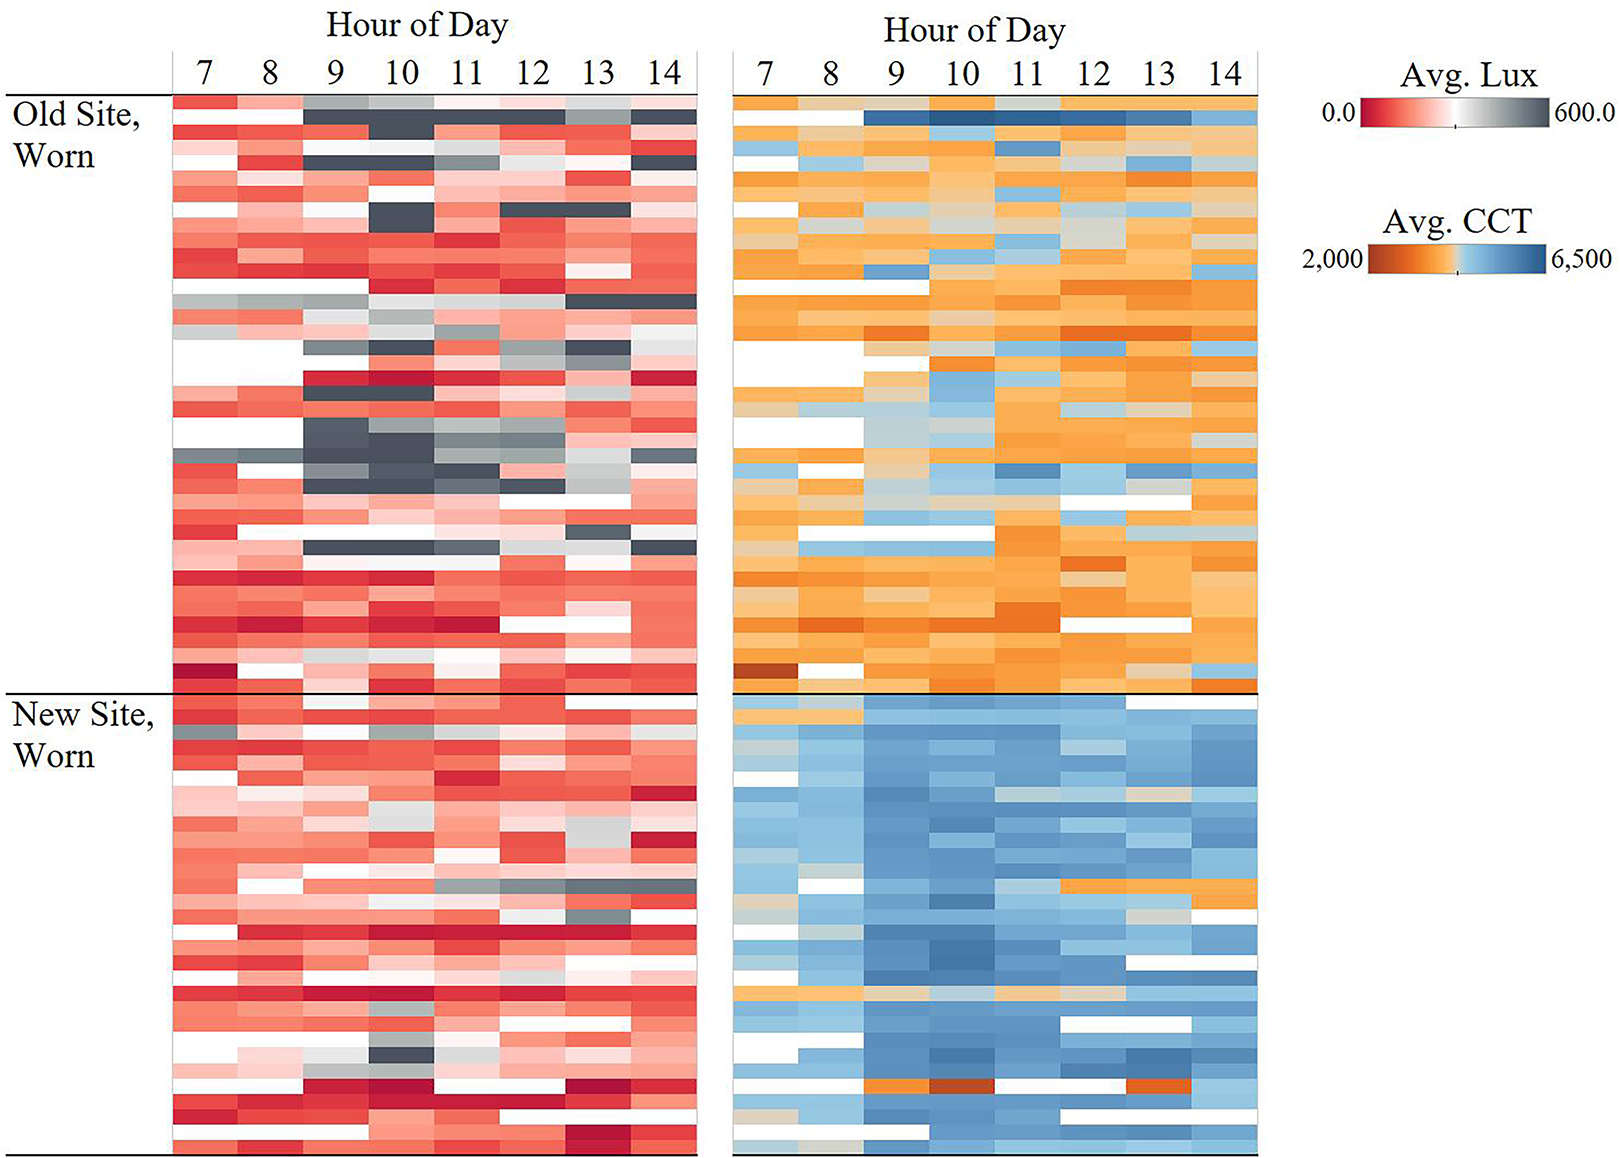
Comparison of LYS illuminance and CCT measurements per hour for the day shift. Each row represents one 8-hr day shift, with each rectangle color representing the average illuminance or CCT recorded per hour by one LYS device worn by staff. LYS data collected across at least 5 hr during the day shift at the old IBHU site (top) and new IBHU site (bottom) are presented. IBHU = inpatient behavioral health unit; CCT = correlated color temperature.
Aim #3: Lighting System Control Data
Capturing and analyzing lighting system control data is a relatively new method for understanding occupant response to lighting and optimizing the lighting system after installation based on occupant patterns and preferences (Wilkerson et al., 2022). Such data can be used to improve and provide insight for improving the next design. A key project goal for the new IBHU site was to give patients environmental control and autonomy in their patient room with multiple lighting zones and multiple luminaire types that could be turned on/off or adjusted to increase/decrease the light level. Patients did not have control over automatic CCT transitions. Staff could also adjust the light levels in the community spaces and nurse station. Advanced lighting control systems can record what buttons occupants press when using a lighting control station (light switch) located in each patient room and throughout the new IBHU site, making it possible to understand occupant usage patterns. For patient, community, and staff spaces at the new IBHU site, data were recorded and saved to a local server each time a button was pressed on a lighting control station, including the time, location, and button title. This button press data were collected for 243 consecutive days from November 2019 through June 2020 (Figure 4).
Button press data for the control stations was recorded to understand patient and staff response to the new tunable lighting system and design strategy in the various spaces, including identifying instances when manual control was used immediately to override the automatic changes in the lighting. Figure 12 compares the number of button presses per day in the staff and communal spaces. Most spaces had fewer than 20 button presses per day; however, there are a few days where the day and group rooms exceed 30. The group room had roughly nine button presses per day, occurring around the same time every day consistent with the daily staff/patient activities scheduled in this space. Manual override after automatic changes in the lighting program was the most frequent in the security office, occurring on 88% of the occupied days at roughly the same time every day, often within 5–10 min of automatic transitions of the lighting system.
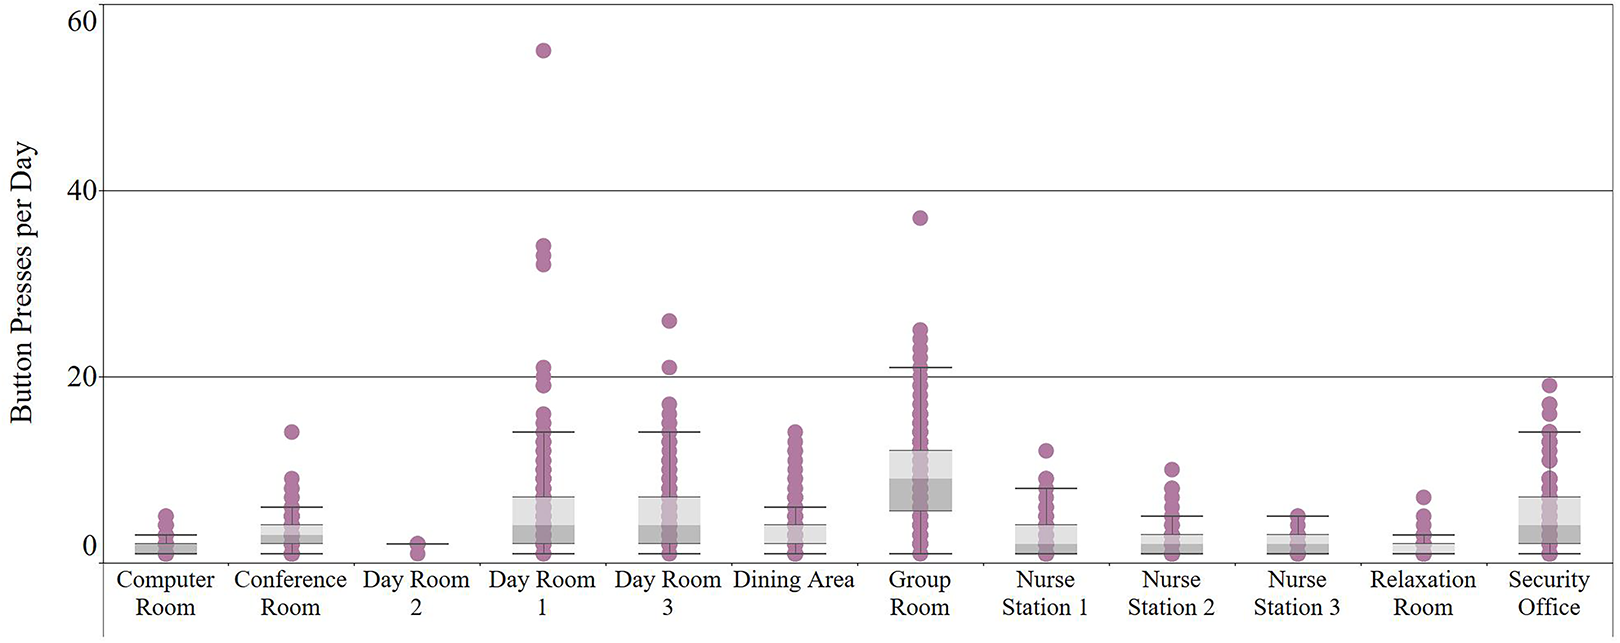
Summary of lighting control station button presses in staff and communal spaces at the new IBHU site. Button presses per space were summed for each 24-hr day and plotted. The center line of each box corresponds to the median value, with the extents of the box corresponding to the upper and lower quartiles. The whiskers indicate the datapoints that are 1.5 times within the interquartile range, with outliers displayed as individual datapoints outside of these whiskers. IBHU = inpatient behavioral health unit.
In comparison, the control buttons in the nurse stations were used infrequently, despite regular occupation by multiple nurses throughout the day and night. The primary nurse station, Nurse Station 1, had an average of three button presses per day and a maximum of 12 button presses in one day.
Similar button press data were available for the 18 patient rooms, summarized in Figure 13. For this dataset, only days with four or more button presses are presumed to be days in which the patient room was occupied. Some patient rooms have as many as 200 button presses in a single day, although the average for most rooms is between 10 and 15 button presses per day. Rooms 7 and 8 only recorded button presses for 1% of the 243-day monitoring period, indicating these rooms are typically unoccupied. Rooms in the primary wing of the unit (Rooms 9–18) generally recorded 10–20 button presses per day with button press activity recorded for more than 60% of the days in the monitoring period.
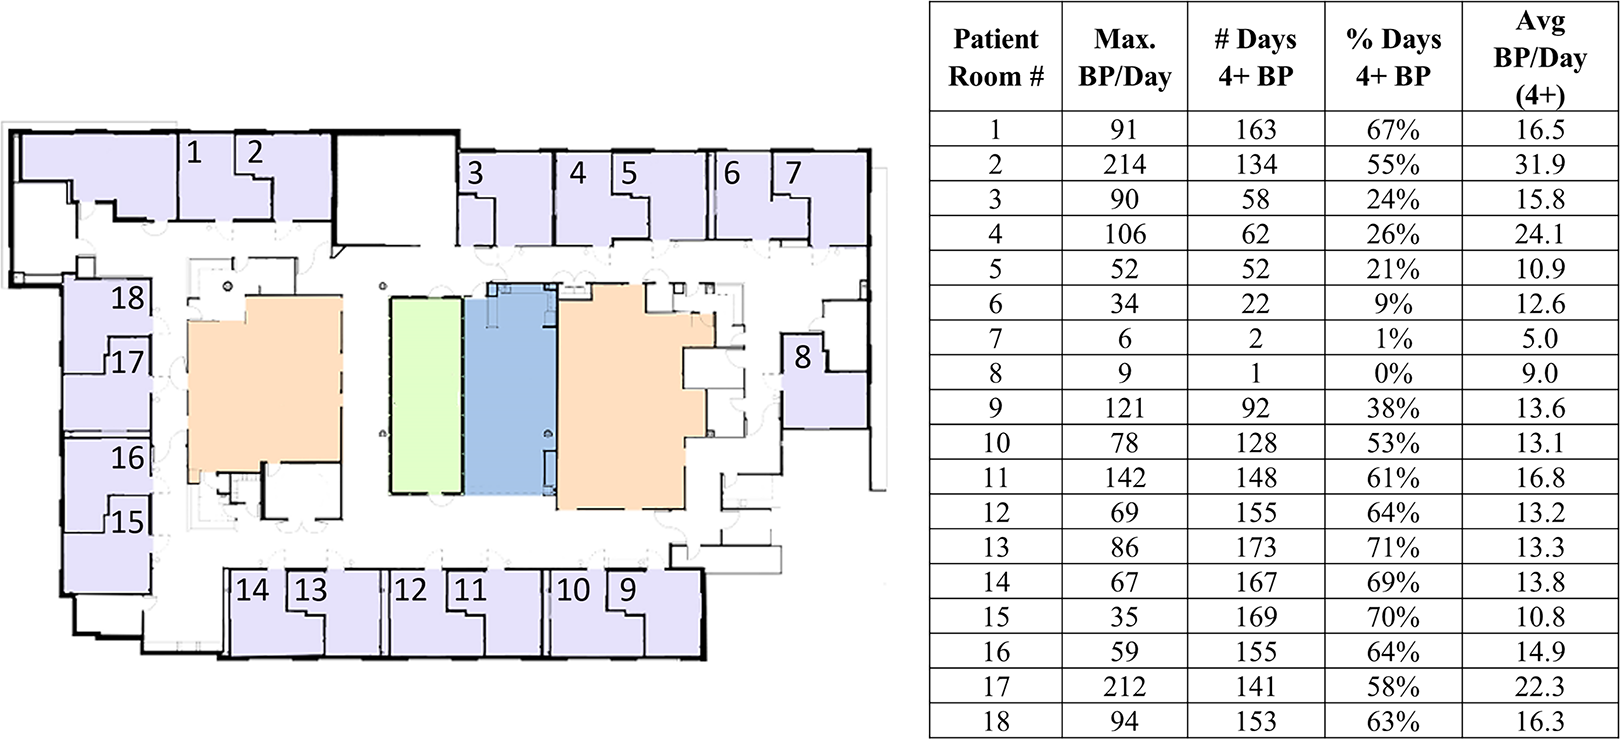
Summary of patient room lighting control station button presses at the new IBHU site. Button presses per room were summed for each 24-hr day. Only days with 4 or more button presses were included to consider only the days that the room was likely occupied by a patient. IBHU = inpatient behavioral health unit.
Discussion
Aim 1 describes how project design goals for the new IBHU site were informed by behavioral health design recommendations, leading to the design team selecting a tunable lighting system to address areas of impact across patient experience, staff experience, and organizational success. These goals included supporting visual and nonvisual responses to light; however, designing for nonvisual responses was a challenge due to the limited guidance for healthcare applications. Despite all of the challenges, building an evidence base was important to the design team because behavioral health patients often remain inside for a few days to a few weeks or more, increasing their risk of losing a connection to the external world.
Lighting System Design Challenges
The tunable lighting system at the new IBHU site consisted of approximately 30 different luminaire types from various manufacturers that all needed to be both anti-ligature and aesthetically pleasing (noninstitutional) with the CCT range aligned and the same control protocol. This level of complexity also required considerable commissioning to make sure every luminaire was at the correct intensity and CCT for the different transitions during the day. There were several rounds of commissioning, including after a technical error caused the tunable lighting system to be unintentionally and partially initiated. While tunable luminaire options continue to expand and controls technology continues to improve, this level of complexity requires a substantial amount of additional time for successful implementation.
Designing for Nonvisual Responses
Houser and others (2021) recently prioritized four variables for nonvisual responses (in order of importance): temporal pattern of light and darkness, light intensity, light spectrum, and spatial pattern of light. The LYS measurements captured the temporal pattern of light and darkness at both the old and new IBHU sites. Tunable lighting technology incorporated in the new IBHU site provided a way to uniformly reduce light intensity and exposure to short-wavelength light at night and to increase both during the day. The LYS measurements also captured the relative differences in CCT between the day and night shifts at the new IBHU site, as well as the difference between the old IBHU site and new IBHU site. The automatic changes of the tunable lighting system supported this, along with the amber step-lights in the patient rooms.
Incorporating daylight also helped to achieve the temporal pattern of light and dark, along with higher light levels and CCTs during the day. Integrating daylight in behavioral health is particularly challenging because all inpatient rooms are required to have windows; however, unlike other inpatient healthcare units, patients at the IBHU are encouraged to participate in activities outside their rooms during daytime hours. This results in the rooms with windows and access to natural light being empty during the day, and designers struggling to find ways to incorporate daylight and views into other communal spaces. Additionally, providing secure outdoor space in inpatient behavioral health can be challenging as these units are often located above the ground floor. Even with the addition of a courtyard at the new site, patient outdoor access is limited.
de Kort and Smolders (2010) were not able to establish beneficial effects of dynamic lighting compared to a static condition on workplace occupants and acknowledged the role which daylight may have played in mitigating differences between their dynamic and static condition. The stationary LYS measurements (Figure 6) show the impact of daylight penetration through the interior courtyard windows compared to the other LYS devices located in areas of the unit father away from windows, highlighting the need to consider both daylight and electric light as design priorities. A benefit of tunable lighting systems is the ability to vary spectrum and intensity consistently day to day, regardless of the weather or time of year, communicating a consistent passing of time and behavioral cues for daily program transitions. Further research is needed to understand how the dynamic quality of the tunable lighting may benefit patient outcomes.
Control Data and Flexibility
Manual adjustment of lighting in the patient rooms was intended to support patient autonomy; however, during design it can be difficult to know what level of lighting control and zoning is useful, particularly with a new technology. Button press data collected from the patient room control stations confirmed patients regularly interacted with the control stations to adjust the lighting in their rooms. Usage patterns suggest certain lighting intensity program settings, such as those in the security office and group room, could be reprogrammed to better align with occupant performance and comfort. Infrequent interaction with the control station by the nurses suggests that the lighting was generally acceptable, although this also may be due to the more limited control options at the nurse station and the nature of a shared workspace. The control data also provides a proxy for the occupancy of certain spaces, such as the patient rooms, and can also provide a coarse estimation of occupant light exposure, particularly at critical times such as at night.
The inability to adjust a lighting system provides occupants with a one-size-fits-all approach, yet different occupants desire different light levels due to age differences, task needs, sensitivity to light, and preference. Lighting control systems can enable these adjustments to be made manually, or for some instances desired variations can be programmed. Lighting control data, like that collected via button presses, can also be used to aid in commissioning by informing how changes to the lighting program may better align with occupant usage patterns. In the longer term, collection of light data sets the stage for future adaptability in implementing responsive, dynamic environments informed by occupant data. There are few methods to assess how decisions made during the design phase later suit the needs of occupants in the space; however, the methods used in this study to evaluate occupant–environment interactions bring design practice one step closer to developing these morphic environments. To realize the full value of these methods, the design process must evolve to include continuous feedback loops throughout the building life cycle, and not end at occupancy. As more evidence emerges related to how lighting can support occupant well-being, the system installed for this project can be adjusted as the evidence base for best practice builds.
Limitations
To further understand the relationship between light and occupant response in real-world environments, it is critical to characterize the lighting in the environment. Field studies vary widely in the characterization of electric lighting, sometimes solely focusing on the light source with no measurements in the actual physical environment. This is partly because it is difficult to carefully characterize even a small space thoroughly because occupant light exposure is highly variable and depends on the number of light sources in the field of view and the proximity to those sources. Additionally, the reflection of light off surfaces alters the intensity, direction, and spectrum of the light as it reflects throughout a space. An ideal lighting characterization also accounts for daylighting, further complicating measurements because of the changes in intensity, spectrum, and directionality throughout the day and seasonally. A limitation of studies in real environments is the inability to separate out daylight, electric light, and other miscellaneous light sources such as computer monitors. For this study, architectural layouts interiors, daylight penetration, and views varied between the old and new IBHU sites.
Lighting field measurements documenting occupant exposure to light are also often limited by the placement of the meter. For studies seeking to understand nonvisual responses, the meter should ideally be placed adjacent to the occupants’ eyes throughout the study. This may be feasible for highly controlled laboratory studies, but in field studies where occupants are consistently moving, the next best available option is a wearable device. A wearable device can be located close to the occupant’s eye by clipping the meter to glasses or a special headband. Alternatively, it can be worn on a shirt or attached to a neck lanyard. It is important to note that the farther from the eye the wearable is placed, the greater the difference will be from what reaches the eye due to the variation in distance, and there is additional opportunity for the light to be blocked (e.g., by hair).
The use of a wearable meter has a separate set of challenges due to the current trade-offs required to develop an accurate and reasonably priced meter that can be worn. While the LYS devices used in this study provide an accessible and affordable means of measuring light in a real-world environment, their accuracy fluctuated under different lighting conditions. These fluctuations were noted when comparing the LYS measurements to a calibrated meter under a variety of intensities and spectral characteristics. For this study, the LYS measurements varied due to a combination of the varying light characteristics (e.g., spectrum and intensity), differences in light exposure (e.g., varying professional duties and individual preferences), and wearing the LYS on the neck collar (e.g., hair length and location on collar). Placing the LYS devices in a fixed location throughout the unit prior to occupancy helped to further understanding of how much variation was due to lighting characteristics in the space and how much was due to the other influencing factors when the LYS devices were worn. The IBHU also provided unique challenges for lighting measurements due to the need to not disrupt the IBHU staff and patients. Measurements with a calibrated meter were recorded in one of the patient rooms to confirm the expected shifts in CCT, along with understanding other characteristics of the system such as dimming and flicker.
Conclusion
In the absence of specific targets to account for nonvisual responses, the characterization of tunable lighting in real-world settings is needed to further the evidence base for behavioral health applications. The tunable lighting system at the new IBHU site was selected by the designers to support patient experience, staff experience, and organizational success. This study documented differences between the old and new IBHU site lighting systems using new sensor and lighting system technology to characterize staff exposure and occupant usage patterns. Lessons learned from this evaluation can help designers and researchers understand the potential value and challenges of using tunable lighting in behavioral health. Understanding the relationship between occupant well-being and light requires a holistic research approach including thoughtful design accounting for real-world constraints, detailed measurement of light exposure, and understanding how occupants interact and make use of new technology.
Implications for Practice
Tunable lighting technology provides a way to uniformly reduce light intensity and exposure to short-wavelength light at night and to increase both during the day while providing flexibility for occupant adjustment and system changes to automated lighting programs.
The collection of occupant interaction with the control stations confirmed the regular use of lighting manipulation (occupant control).
While the use of a wearable meter has challenges and trade-offs due to current limitations, the measurements collected reveal that even in a static electric lighting environment, there is great variability in occupant lighting exposure that is often oversimplified in lighting recommendations.
Footnotes
Acknowledgment
The authors wish to thank Bob Davis, Marjon Pekelharing, Jill Eriksen, Carolyn Schilling, Liz Joyce, Sarah Plane, and Alyssa Weber.
Declaration of Conflicting Interests
The author(s) declared the following potential conflicts of interest with respect to the research, authorship, and/or publication of this article. Meredith Banasiak was employed by Boulder Associates during the research and manuscript preparation. Boulder Associates is the architecture firm which designed the new site evaluated in this study. Andrea Wilkerson and Sarah Safranek declare no conflict of interest.
Funding
The author(s) received financial support for the research, authorship, and/or publication of this article: This work was supported by the U.S. Department of Energy’s Lighting R&D Program, part of the Building Technologies Office within the Office of Energy Efficiency and Renewable Energy (EERE).