
Abstract
Aim:
This project used historical hospital data to forecast demand for specialized bariatric beds. Models were evaluated that determined the relationship between the number of bariatric beds owned and service level for patients of size requiring these beds. A calculator was developed for minimizing the equipment costs of meeting demand.
Background:
Failing to provide enough bariatric beds may negatively affect outcomes for patients of size and healthcare workers, whereas owning more bariatric beds than required to meet demand means unnecessary cost. With rising rates of obesity increasing care costs, minimizing equipment costs is increasingly important.
Method:
One year of hospital admissions data were used to determine arrival rates and lengths of stay for patients of size. Two subsequent years verified the consistency of these rates. Simulations modeled the flow of patients of size through the hospital and the service level associated with the number of beds owned. A minimization function determined the optimal number of bariatric beds to be provided. A simplified, generalizable model was compared to the simulation.
Results:
The simplified model produced similar results to more complex simulation. The optimization was robust, or insensitive to small changes in inputs, and identified substantial opportunity for savings if demand for beds was substantially over- or underestimated.
Conclusions:
The simplified model and cost optimization could be used in many situations to prevent costly errors in equipment planning. However, hospitals should consider customized simulation to estimate demand for high-cost equipment or unique circumstances not fitting the assumptions of these models.
Background
The growing prevalence of obesity is well-documented. Worldwide in 2016, 650 million adults were obese (body mass index [BMI] at least 30 kg/m2) with trends steadily increasing (World Health Organization, 2020). In the United States, 49% of the adult population is expected to be obese by 2030, and nearly one in four will have severe obesity with BMI ≥ 35 kg/m2 (Ward et al., 2019). This growth in obesity is also reflected in the U.S. hospital population. Hossain et al. (2018) found almost one third of patients admitted were obese. Furthermore, the increase in obesity is most pronounced among the heaviest patients. From 2006 to 2015, the mean patient weight increased from 80.5 kg to 83.7 kg (177.5–184.5 lbs; Vangilder et al., 2017), but the proportion of patients weighing more than 136 kg (300 lbs) increased from 2.5% to 4.0% during the same period (unpublished data from Vangilder et al., 2017).
The Burden of Obesity for Healthcare and Hospitals
Throughout the United States, obesity is associated with a substantial and increasing percentage of healthcare costs for each category of expenditure and each type of payer (Biener et al., 2018). Obesity also poses many clinical and logistical challenges for hospitals. The term “patient of size” has been used to describe patients weighing more than 136 kg (300 lbs), who tend to need dedicated equipment, infrastructure, and staffing (Matz, 2019). The physical size of such patients requires wider hospital beds, chairs, walkers, and commodes to improve management and treatment. More space in the hospital room is also needed to accommodate the patient, equipment, and additional caregivers required for care (Matz, 2019).
The hospital bed is an important medical device upon which patients may remain for days or weeks. Even during peak waking hours, patients spend 83% of their time in bed (Brown et al., 2009). The most advanced hospital beds, “smart beds,” include powered air surfaces to prevent pressure injuries (Ghersi et al., 2018), surface features to help caregivers turn patients (e.g., Wiggermann, 2016; Zhou & Wiggermann, 2021), integrated scales, exit detection alarms, and powered drives to help safely transport a heavy patient and bed through the hospital (Wiggermann, 2017). Specialized, “bariatric” hospital beds with wider frames and thicker surfaces are designed to support patients of up to 454 kg (1,000 lbs). Although most standard hospital beds are built with the mechanical strength to support patient weights of up to 227 kg (500 lbs), patients weighing 136 kg (300 lbs) or even less may not be accommodated by the standard 91-cm (36-in) width (Wiggermann et al., 2017). A patient of size placed on a bed of insufficient size or weight capacity may experience negative outcomes including increased risk of pressure injury, decline in functional independence due to difficulty repositioning, or sleep deprivation due to discomfort. An inadequately sized bed may also increase risk of injury to caregivers when attempting to turn or reposition a patient with insufficient space in bed. The availability of appropriately sized beds may enable greater throughput and turnover from the emergency department, intensive care unit, and operating room.
Unlike other equipment such as walkers, mobile lifts, or chairs, the hospital bed is dedicated to an individual patient. Furthermore, hospital beds can be costly to purchase or rent, especially bariatric beds. For hospitals, the high cost of either purchasing unnecessary bariatric beds or not having a bariatric bed when it is needed poses a dilemma that commands an accurate estimate of demand. Previous research has used simulation for planning capacity (Fournier & Zaric, 2013) and allocating beds across units (Holm et al., 2013), but there is little available research on determining demand for bariatric beds, especially as a generalizable model that can be applied across hospitals.
The objective of this project was to use historical hospital data to forecast the demand for bariatric beds. Data were used to determine the relationship between bed inventory and service level and the optimal trade-off between purchasing and renting beds. A sensitivity analysis tested the influence of the model assumptions. Finally, the results were used to develop a forecasting tool that could be generalized to other hospitals for which the model assumptions were also applicable.
Service Level and Resource Planning
It is impossible to guarantee the needed staffing and facilities for every patient arrival as this would be cost prohibitive. For example, a hospital cannot afford to provide staff, beds, and rooms to meet demand on the busiest day of the year, while absorbing the cost of empty rooms and wasted resources for the other 364 days. Instead, hospitals must plan resources to meet the needs of a certain percentage of patients at arrival. This percentage of patients accommodated is called service level. High service levels suggest patient needs are almost always accommodated. It is not uncommon to have different service levels in different departments due to demand for different hospital services (Song et al., 2020).
When a patient is not accommodated, negative outcomes may occur. Unaccommodated patients may leave the hospital, may be dissatisfied with their care, may have a delayed admission or procedure until the appropriate services are available, or may be cared for in substandard facilities. All these measures imply a cost. For instance, patients who stay in inappropriate care areas may have increased length of stay (LOS) due to hospital acquired complications or greater chance of readmission (Song et al., 2020). These patients may also provide a lower rating on the Hospital Consumer Assessment of Healthcare Providers and Systems survey which can affect reimbursement (Centers for Medicare and Medicaid Services, 2017). Furthermore, unaccommodated patients who leave without the service or procedure may imply lost revenue not only for the immediate admission but for all future services or admissions as they may turn to competing facilities. Finally, if equipment is needed on a short-term basis equipment rental may be available at a premium cost. Hence, it is important to identify the appropriate cost metrics and trade-offs between these costs to make the best choice for the patient and hospital.
This case study demonstrates how hospital data are used with both service level and cost metrics to determine the appropriate number of bariatric beds for the hospital. In addition, simple approximation techniques are developed for other hospitals to use to determine the number of beds needed. This may be especially important for new hospitals as proper bed predictions may save millions of dollars in underutilized equipment, misused space, or suboptimal patient care. Accurate demand estimates and resource plans are predicated on using metrics appropriate for evaluating desired outcomes. Improperly defined metrics for evaluating healthcare operations can negatively impact decision-making and result in erroneous conclusions (Torabi et al., 2020).
Method
In this case study, queueing models were used to estimate demand for bariatric beds. Queueing theory involves systems where customers, in this case patients, wait in queues for resources to provide service. Queues are a common experience and form when resources are limited. Queues are often economically desirable, and designers of queueing systems must find a balance between increasing resource utilization and providing adequate service to customers. Evaluating queueing systems requires probabilistic and statistical analysis of arrival and service distributions. Two approaches were evaluated in this case study: computer-based simulation and simpler formula-based approximation models.
Data Source and Hospital Information
The University of Cincinnati Medical Center is a 515-bed hospital with an overall 81% utilization rate (Definitive Healthcare, 2020) and is the major research and trauma center hospital in the Cincinnati region. The University of Cincinnati Medical Center does not divert patients and often accepts patients from other regional hospitals. The goal of the institution is to provide appropriate care for all patient groups, which includes having the correct facilities and equipment, including rooms and beds.
Data Collection
The University of Cincinnati Medical Center’s health informatics center gathered patient-level data for patient visits to the hospital from July 2015 to July 2018. The first 12 months of data were used in the primary analysis, and the remaining 24 months were used to check for trends and verify data included in the primary analysis remained consistent over time. Data used in this analysis included a unique patient identifier, patient weight, admission time, admission department, discharge time, and whether the patient received a specialized bed. Because data were deidentified before they were received by the project team, institutional review board approval was not required.
Data Selection
From an initial data set of 105,484 patients, 765 unique patients were included. Data were removed for patients visiting only units where a bariatric bed would not be used. For example, patients arriving at the emergency room would usually be placed on a stretcher and would not typically require a bariatric bed. Therefore, these patients were not included in the analysis unless subsequently admitted to a unit where a bariatric bed could be used. Data were removed for patients with missing weight or for patients weighing greater than 1,000 pounds as this was deemed a clerical error. Data were removed for patients with missing admission or departure time. Finally, all patients weighing less than 300 pounds were removed based on the assumption they would not need a bariatric bed. This assumption is based on the weight designation requiring special accommodation by the Facility Guidelines Institute (Matz, 2019) and is consistent with the findings of Wiggermann (2017). This process and the number of patients removed in each step are illustrated in Figure 1.
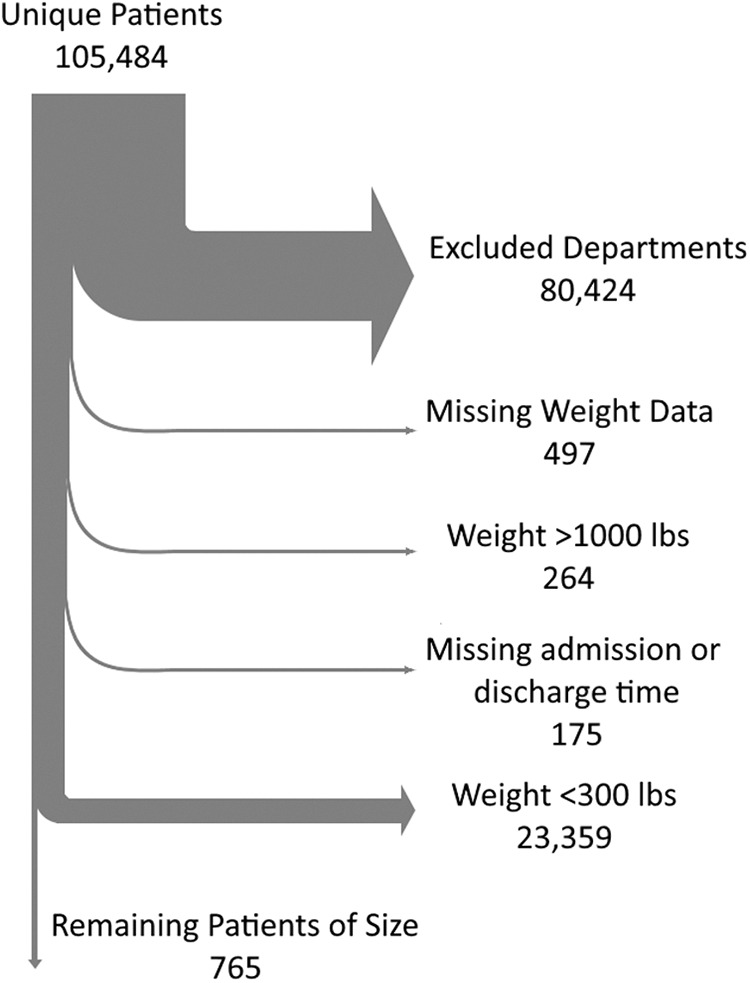
Steps for data cleaning.
Rationale for Simulation
Forecasting demand is straightforward when variation is low. If the number of admitted patients of size never vary because arrival and discharge rates are constant, it is easy to determine how many beds are needed. However, the historical hospital data showed the arrival of patients needing bariatric beds and the length of time these patients stay in the hospital varied considerably over time. Variability poses a challenge when forecasting because it causes peaks in demand that are difficult to predict. Although many hospitals may currently assess historical data of hospital bed rentals, this does not allow an accurate estimate of the true demand nor its variability. When such variability exists, simulation is a useful technique for describing the flow of patients in the system. Furthermore, the application of simulation allows for considering alternative states such as shifting demographics that may be particularly important for planning fixed resources like bariatric rooms.
Assumptions for Simulation
The modeling in this study relied on the following assumptions: (1) Patients weighing 136 kg (300 lbs) or more are assigned a bariatric bed. (2) The bariatric beds were considered a floating resource, which means bariatric beds are assigned from a shared inventory across all units. (3) Patients are not transferred from one bed type to another once they have been admitted to the hospital. Bariatric beds that become available are assigned only new admissions and not admitted patients who have been placed on standard beds. (4) Bariatric beds not being used do not fulfill demand of nonbariatric patients.
Simulation Approach
A series of simulations were performed using Arena software (Rockwell Automation, Milwaukee, WI) to estimate demand for bariatric beds, test the sensitivity of different factors, and perform cost optimization to determine the beds to purchase and rent.
Initial service-level simulation
The distribution of arrival and discharge was estimated by fitting the historical hospital data to empirical distributions, and the number of beds needed to achieve a certain service level was determined. Service level was defined as the total number of patients of size treated in a bariatric bed divided by the total patients of size treated (in bariatric beds and standard beds). A sensitivity analysis compared a stationary arrival process (i.e., a service-level simulation with a constant arrival rate representing the overall average) and a nonstationary arrival process that considered variation in arrival by day of the week.
Cost optimization simulation
Based on the distribution of arrivals and discharge determined in the initial simulation, an optimization model was developed that allowed trade-offs between the acquisition of permanent beds or short-term rental beds. This study assumed a service level of 100% (i.e., all patients >300 lbs receive a rented bariatric bed if a hospital-owned bed was unavailable).
Simulation steps
Using the historical data on variation in patient arrival and LOS, simulations calculated many scenarios to determine variation in demand and how many bariatric beds were needed to achieve a certain service level. Because a simulation is driven by a random process and subject to variability, each simulation was run 100 times and each run modeled 5 full years of hospital admissions and discharges of patients requiring bariatric beds. During simulation, two event types were processed through simulated time using the historical arrival and LOS distributions: (1) patient arrival and (2) patient discharge. For an arrival, if a bariatric bed was available, it was assigned to the patient, and this counted favorably toward service level. If a bariatric bed was unavailable, this was recorded and counted negatively against service level. (In the case of the optimization simulation, a bariatric bed was rented to achieve a 100% service level). For a discharge, if the patient was assigned a bariatric bed, the bed is returned to the pool of available resources.
The input into the initial service-level simulation was the number of bariatric beds owned by the facility, and the output was the service level. For the cost optimization simulation, the input was the pricing of the annualized cost of owning and the daily cost of renting a bariatric bed. The output of the optimization was the minimum cost and the associated number of beds to purchase.
Approximation Model
As an alternative to the above sophisticated simulations that relied on granular historical data, a simplified formula-based approximation model was evaluated that could be more easily used by other hospitals. This approximation approach used steady-state queueing models with constant arrival rates and service times (Bhat, 2015) to determine the service level associated with any fixed number of beds. Differences between the simulations and approximation model were compared.
Results
Service-Level Simulation With Constant Arrival Rate
The average LOS for all bariatric patients was 5.25 days (range = 0–57 days), and there was substantial variation across patients as shown in Figure 2. By comparison, the average LOS for all patients in U.S. acute care facilities is 4.6 days (Definitive Healthcare, 2020). On average, there were 7 hr and 52 min between each bariatric patient arrival, and these interarrival times also varied considerably.
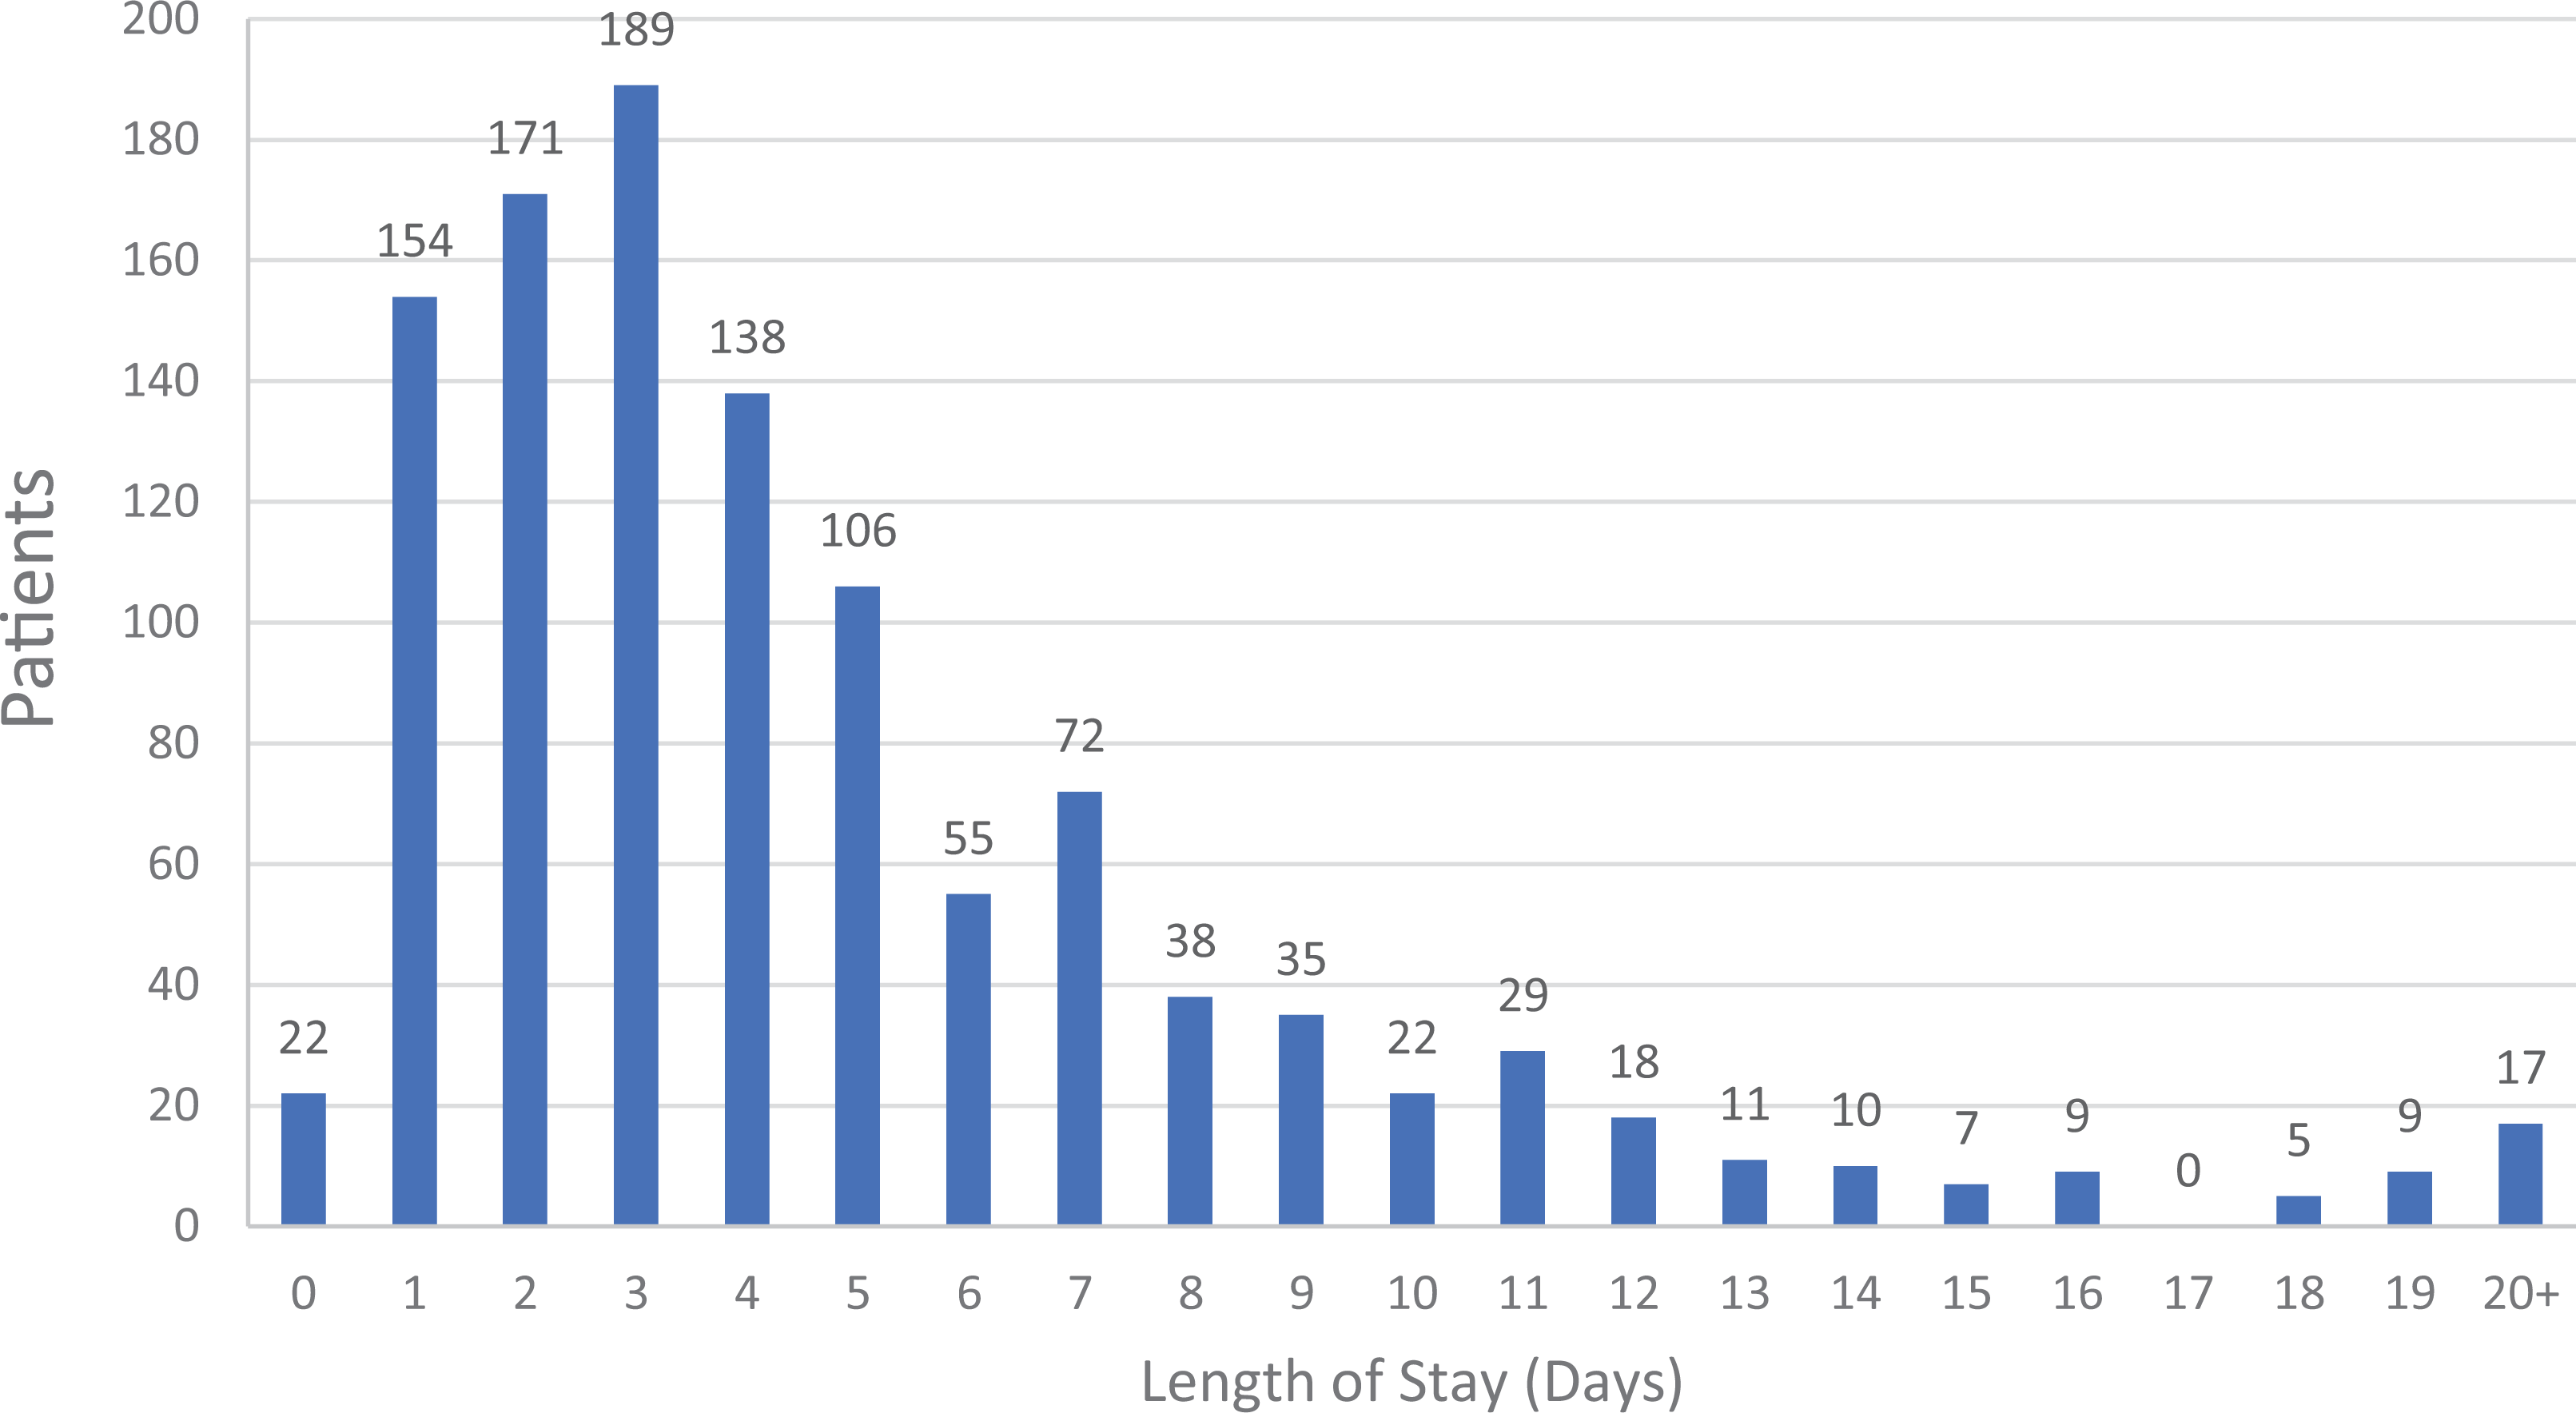
Distribution of length of stay for patients of size (n = 765).
Figure 3 illustrates the trade-off between number of beds and service level from the average of all runs of the simulation. For example, owning 12 bariatric beds would produce a service level of 66% which means only two third of arriving bariatric patients would be placed in the appropriate beds. Alternatively, the desired service level may be referenced to determine the minimum beds needed. If a 90% service level was desired, 19 bariatric beds would be needed.
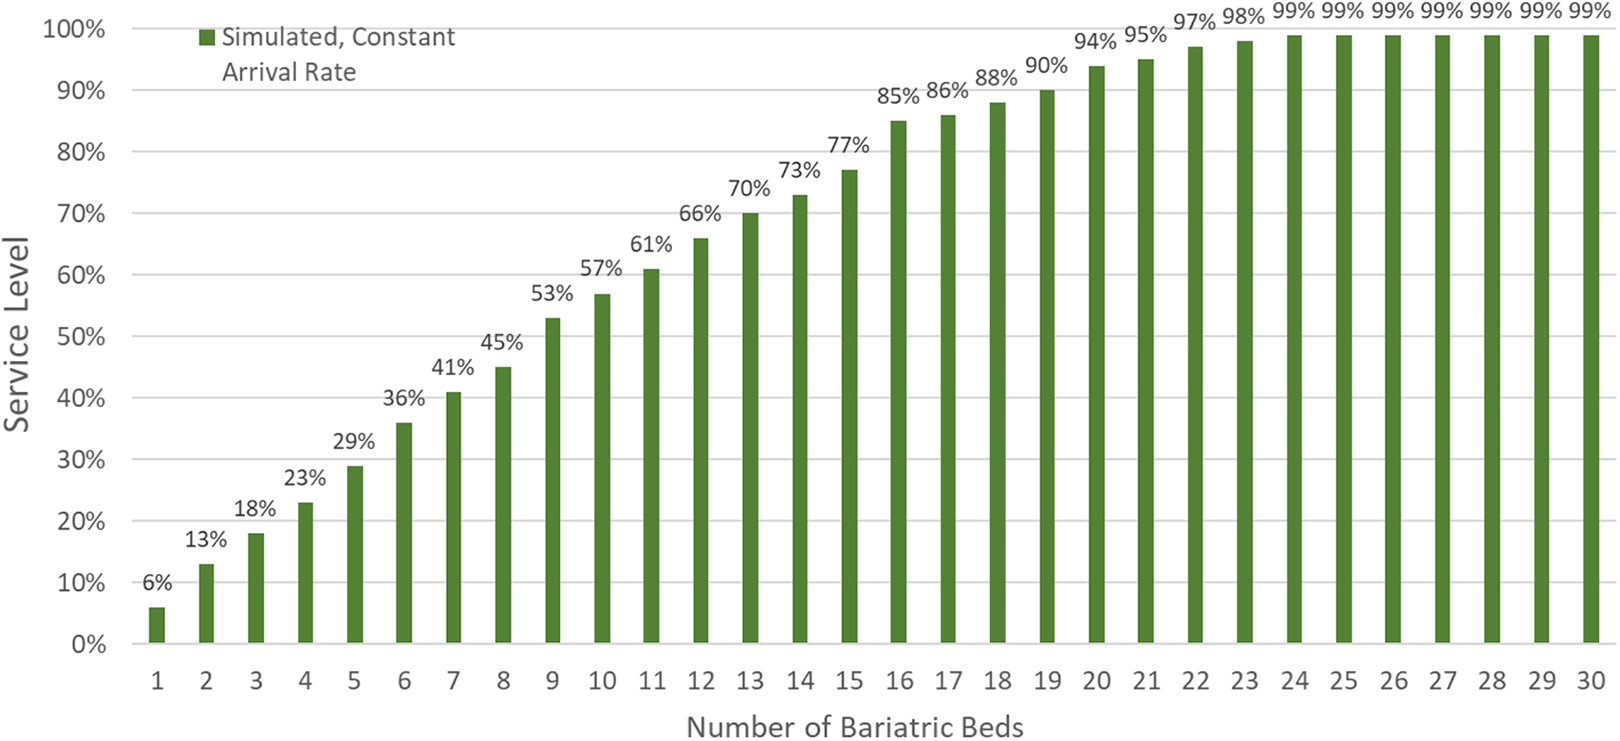
Number of beds owned versus service level for service-level simulation with constant arrival rate.
Service-Level Simulation With Nonstationary Arrival Rate
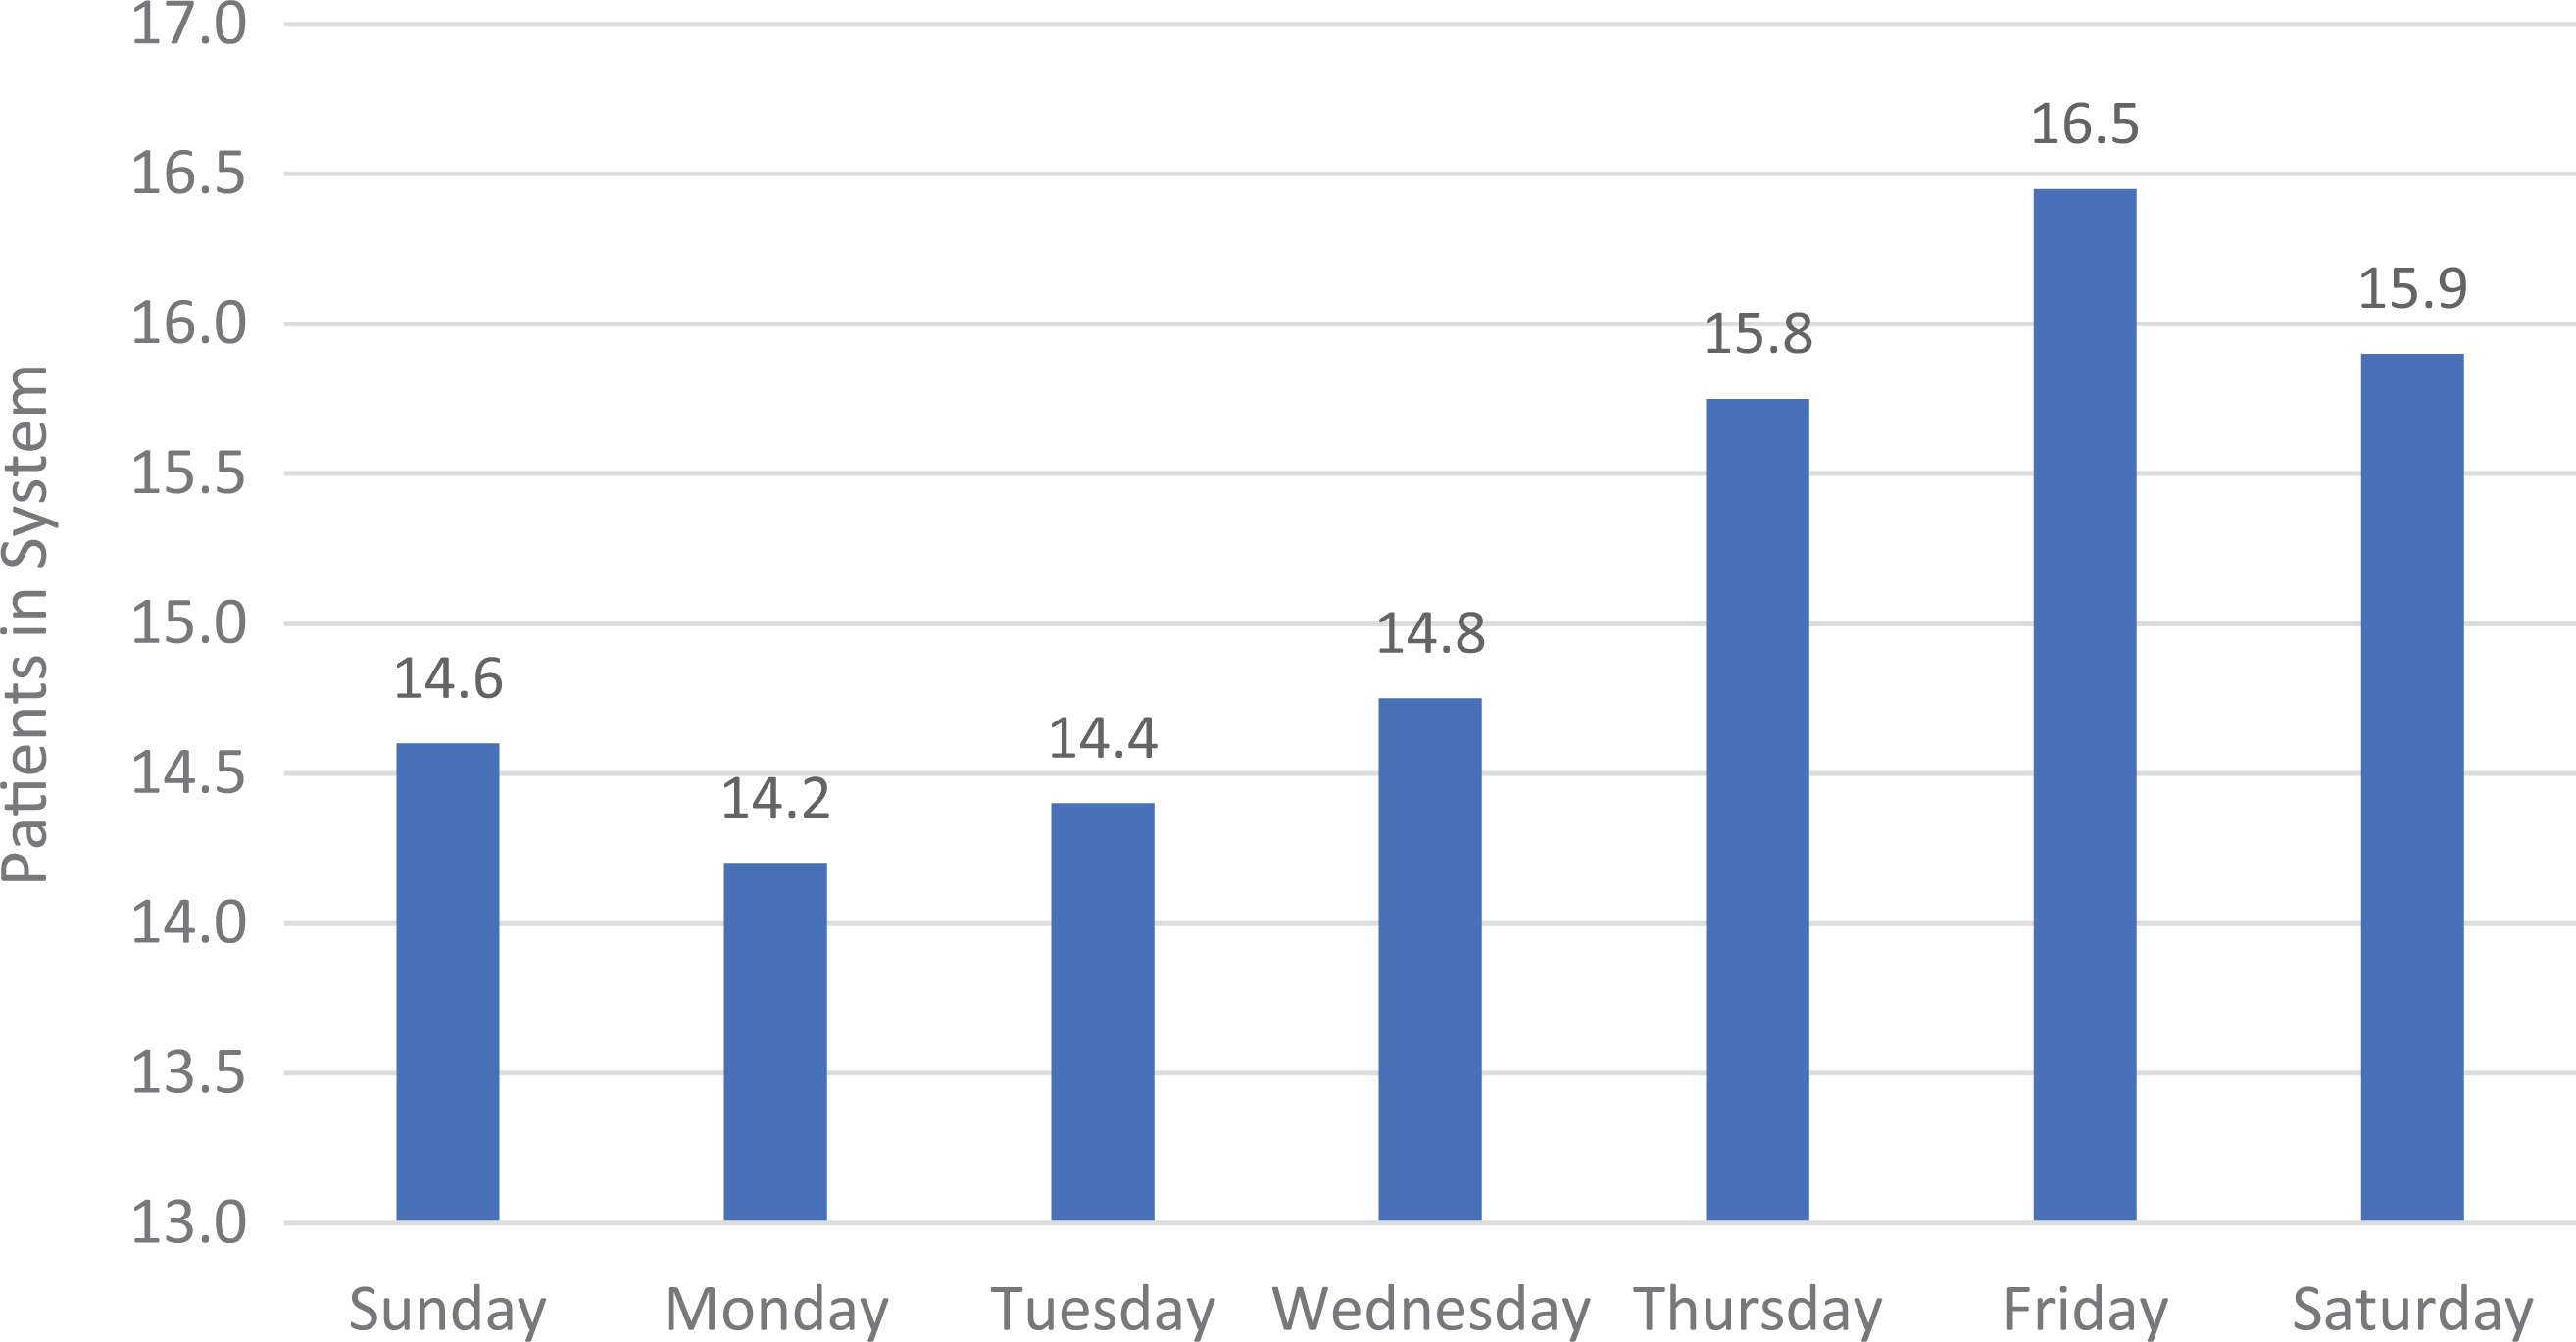
The results in Figure 3 assume a constant mean of the arrival distribution, but the historical hospital data indicated this were not the case. The distribution was found to be nonstationary, with day of the week influencing arrival rates. Figure 4 illustrates arrivals by day of the week, with fewer arrivals on Saturday and Sunday compared to the rest of the week.
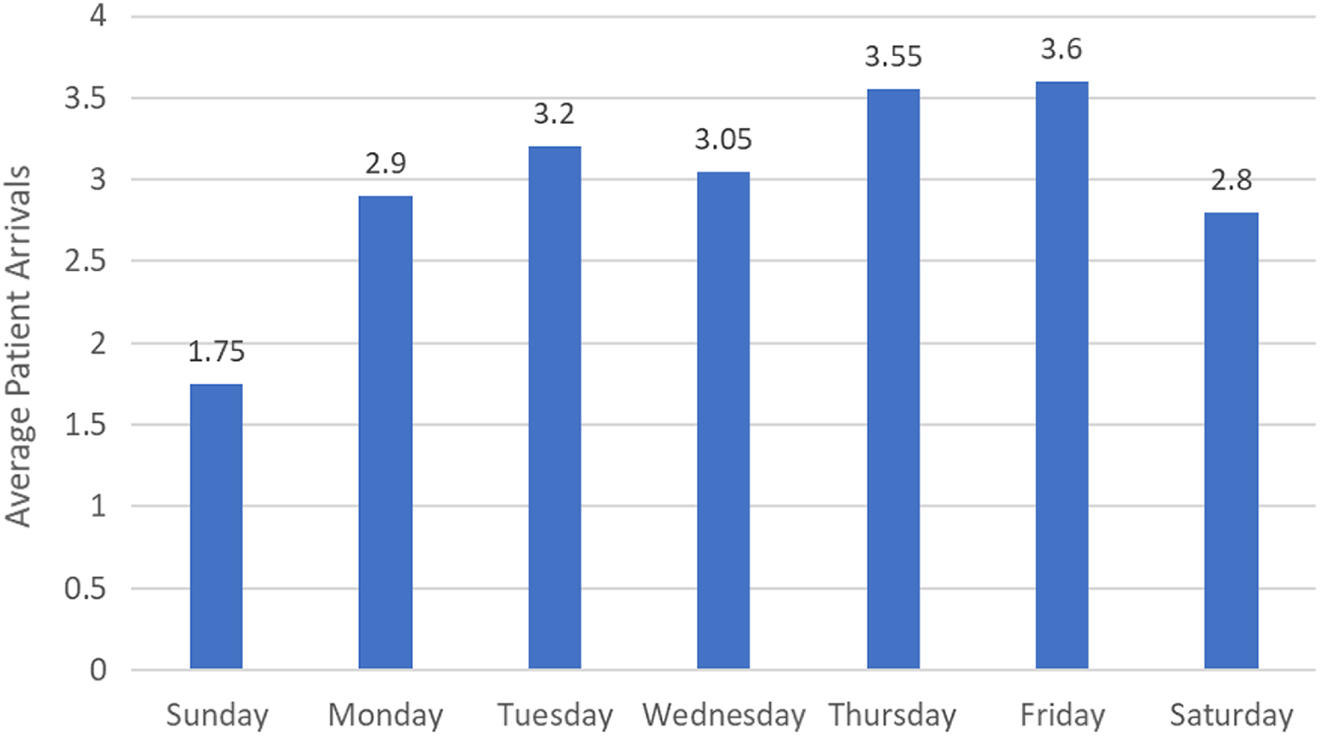
Average number of patient arrivals for each day of the week.
To simulate the nonstationary arrival rates, a unique arrival distribution was used for each day of the week, based on the historical data. In line with expectation, the historical data for LOS did not show variation by day of the week, so daily variation for LOS was not considered in the model.
Simulation with a nonstationary arrival rate varying by day of the week caused higher numbers of patients in the system later in the week after several consecutive days of high admissions numbers. It also showed fewer patients in the system following the days with the lowest number of admissions as shown in Figure 5.
Average number of patients of size in the hospital by day of the week.
Figure 6 compares the service level for the two simulations with the stationary and nonstationary arrival rates. Each curve demonstrates how each additional bed affects service level. The additional variation in the simulation with nonstationary arrival distributions produces a lower service level for incremental bed capacity. For example, to achieve a 90% service level, 22 beds are needed in the nonstationary model, compared to 19 beds in the stationary model.
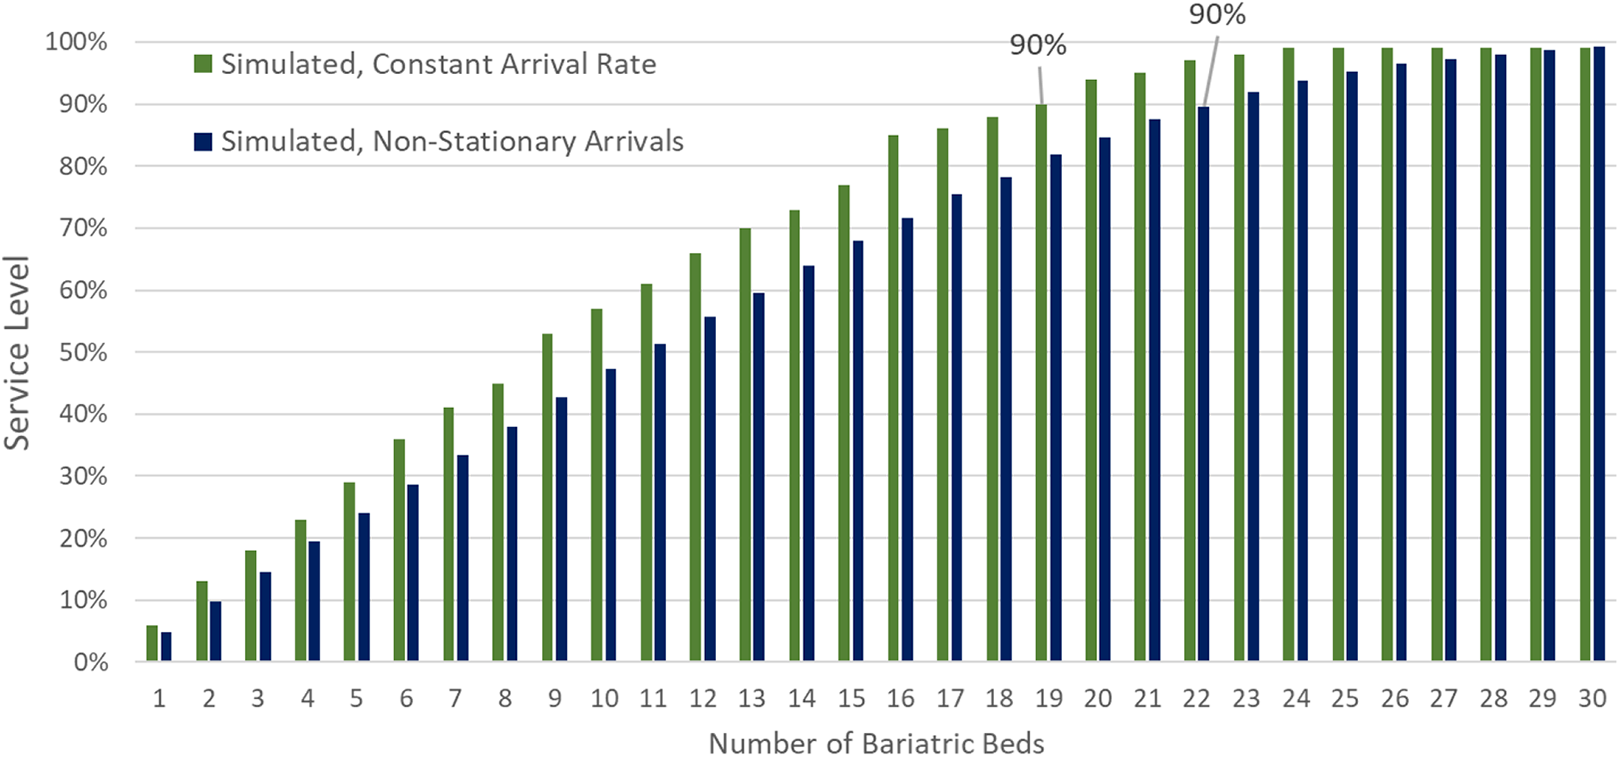
Number of beds owned versus service level for stationary and nonstationary service level simulations.
Cost Optimization
By understanding the relationship between the number of bariatric beds and service level, it was possible to perform a simulation to find the lowest cost of meeting a certain service level.
One optimization approach could weigh the costs of providing equipment against the detrimental costs to the patient and facility of not meeting demand at a given service level. These costs could include the detrimental patient care from not having proper equipment resulting in potential extra LOS, risk of injury to caregivers, and the potential loss of revenue for the hospital as there could be more readmissions and the need to divert patients.
The alternative approach used in the current project was to assume a 100% service level or that all admitted patients of size receive a bariatric bed. This is achieved by renting any needed beds when the beds owned by the hospital are unavailable. In this instance, the optimization consists of an unconstrained trade-off between the extra cost of needing to rent beds as opposed to purchasing beds. Example output of the cost optimization is shown in the Appendix.
Approximation Model
The Arena computer simulations performed in the current study provided robust results, meaning they varied little with small changes in the inputs or assumptions. However, the software and expertise required to perform such simulation may not be available for most hospitals. Therefore, a simplified formula-based approximation model was evaluated that considers constant arrival and service rates, instead of the variation considered previously. This model uses Erlang’s Loss Formula (Bhat, 2015) direct from queueing literature. The formula states the probability of all bariatric beds being used (i.e., no beds are available when a patient arrives) is equal to one-service level and is calculated as:
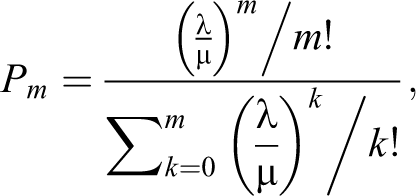
where m is the number of bariatric beds, l is the average arrival rate, m is 1/average LOS.
The great advantage of this formula is that with only the average arrival rate and the average LOS, it is possible to calculate a value for the service level given m, the number of bariatric beds available. It is also possible to fix the service level and vary m to find the smallest number of beds needed to achieve that service level. The question is whether this simplified approach differs from the robust simulation-based modeling. Figure 7 shows this comparison using the data used in the simulation:
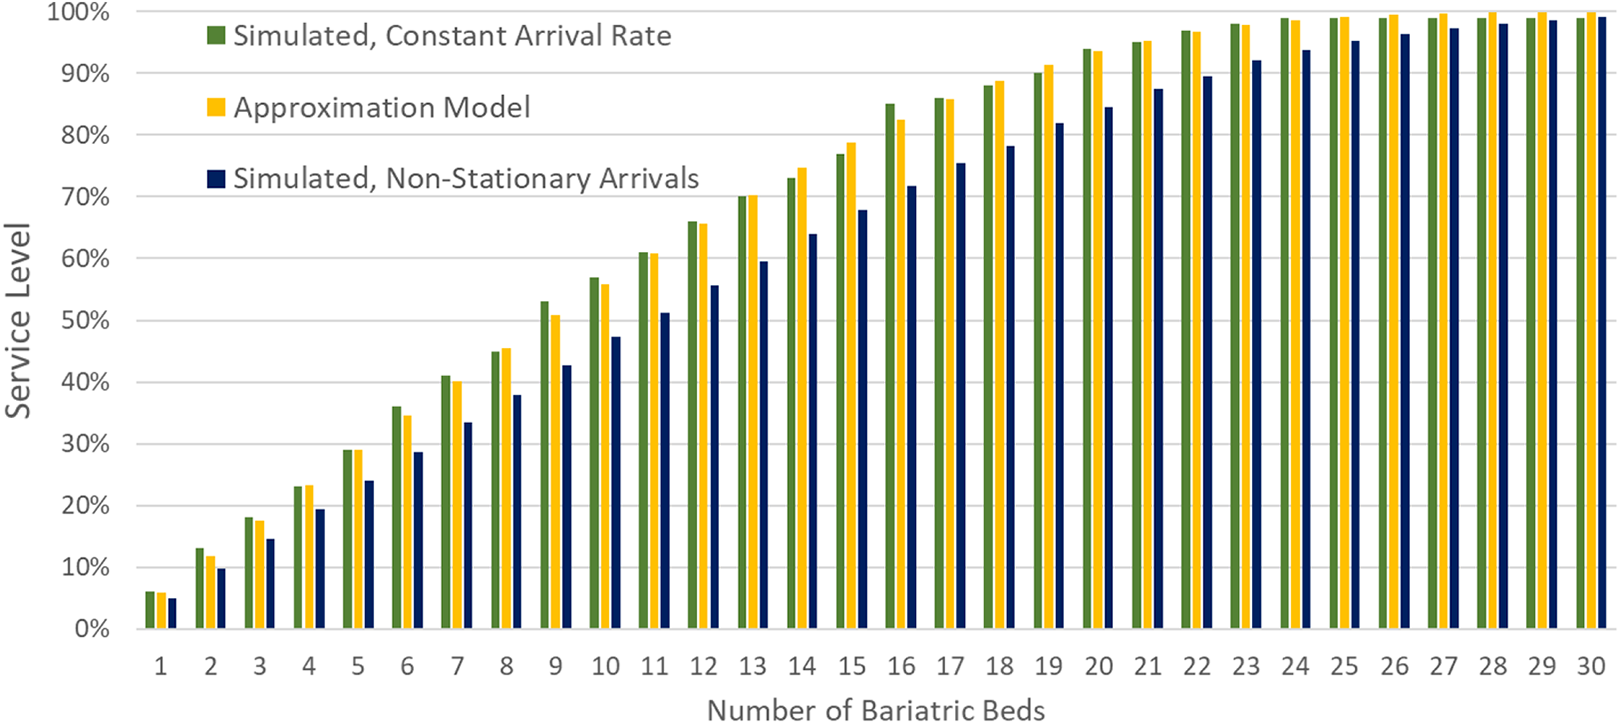
Number of beds owned versus service level for service-level simulations and approximation model.
For each level of bed inventory, the service levels for the formula-based approximation model never vary by more than 2% from the simulation with stationary arrival rate. Consequently, the approximation model consistently produces a higher service level than the nonstationary simulation which considers variation in arrival rate by day of the week. However, in this case, the number of beds needed to achieve any service level never differs by more than three beds between models. In the cost optimization example (see Appendix), the approximation model suggests purchasing three more beds than the simulation and the total cost would be only 4.9% higher.
Implementation
One of the goals of this project was to develop a model useful for most hospitals. Many research hospitals can use sophisticated techniques to develop the desired trade-offs and cost optimization conducted in this article. Many others have minimal analytic research capability but have similar needs. The simplified formula-based approximation model described here can be accomplished through data collection and relatively simple calculations. This approach allows hospitals to use their own data to account for regional differences or even adjust the inputs to account for anticipated demographic trends.
To allow other hospitals to easily forecast demand and minimize costs of providing bariatric beds, a calculator was developed that uses the approximation model with cost optimization. The user inputs (1) the average patients of size arriving per day, (2) the average LOS of those patients, and (3) the costs of renting or buying beds. The calculator outputs the average and peak occupancy for patients of size and uses the cost inputs to estimate the mix of bed purchasing and rental that minimizes costs. This calculator and a numerical example are presented in Appendix.
Limitations and Future Work
The data set used to evaluate the models in this article included 3 years of data from a single urban trauma hospital. To verify the robustness of the model, it should be tested on a larger number of hospitals with several years of data. Nevertheless, it is important patients are treated in the best possible manner and resources are not wasted. The formula-based approximation model described here can likely be used as an initial plan.
The application of this work may also be used for any equipment or resources dedicated to specialized patients for which admission data are available. If patients require service in a somewhat random distribution with modest seasonal effects, the result will likely provide useful information for decision makers. Future model development and research on demand during pandemics, disasters, and other discrete or seasonal events is warranted.
Many assumptions were made in the development of the models used in this article, and practitioners should consider them carefully when applying the approximation model. As Figure 7 shows, the approximation model underestimates the number of beds needed compared to the nonstationary model. However, even the nonstationary model could underestimate the required beds given its limitations. The current models consider the overall daily average of arrival and discharge times. Hourly surges in admission and discharge may mean more beds are needed than calculated by the model. For example, if there is a regular influx of patients midday from surgery before a cohort of patients are discharged in the afternoon, the systematic overlap of patients would require more beds than the model predicts. The model also does not factor in the time that beds may be out of service for inspection, repair, cleaning, and transport. Future research could consider such factors, including the circadian distributions of discharge and arrival, or the increased demand that occurs if a patient is moved from a standard bed to a bariatric bed if one becomes available.
The approximation model provides a useful calculation despite its limitations that may modestly underestimate the resources required to reach a given service level. This may be acceptable for products like beds which are movable resources that can be purchased incrementally or rented. The numerical example in Appendix shows underestimating demand by a few beds may have a nominal effect on overall cost. However, when estimating demand for fixed resources such as bariatric rooms, it may not be as simple to add rooms after construction is complete. Additionally, the cost of construction is even more costly than beds. For these circumstances, it may be appropriate to plan conservatively to account for these model limitations and also to plan for uncertainty that could result in increased demand. Such planning should provide inputs to the approximation model based on anticipated changes to patient demographics and potentially include a safety margin beyond what is suggested by the approximation model. To limit error when planning for high-cost fixed resources, hospitals may consider performing more detailed simulation.
Practitioners should be aware cost optimization is only as good as the true costs reflected in the inputs. The value of rental can be underestimated by not considering inventory management, storage, and maintenance costs, whereas the value of bed ownership can be underestimated by not considering the likelihood of faster delivery to the patient.
This work demonstrates the potential for collaboration among industry, healthcare providers, and university researchers to reduce healthcare costs and improve patient care. As simulation and other analytic techniques are better accepted in healthcare, hospitals can leverage their increasingly available data to consider many more operational problems.
Implications for Practice
Historical hospital data can be used in simulations that model patient flow and allow practitioners to predict equipment needs for bariatric beds.
A minimization function can identify the optimal number of bariatric beds to own to reduce the costs of satisfying demand.
A simplified approximation model was developed that produced similar results to complex simulations. This model can be easily employed by practitioners to estimate resource requirements for bariatric beds.
This approach may also be used to estimate demand and minimize costs for other types of equipment.
This approximation model can reduce costs by preventing large underestimates or overestimates of equipment requirements, but hospitals should consider customized simulation to estimate demand for high-cost equipment or unique circumstances not fitting the assumptions of this model.
Footnotes
Appendix
Declaration of Conflicting Interests
The author(s) declared the following potential conflicts of interest with respect to the research, authorship, and/or publication of this article: Neal Wiggermann is employed by Hillrom, a medical device company whose products include hospital beds.
Funding
The author(s) disclosed receipt of the following financial support for the research and/or authorship of this article: This research was partially supported by Hillrom.